Logical Attacks and Countermeasures for Fingerprint On-Card-Comparison Systems †


Abstract
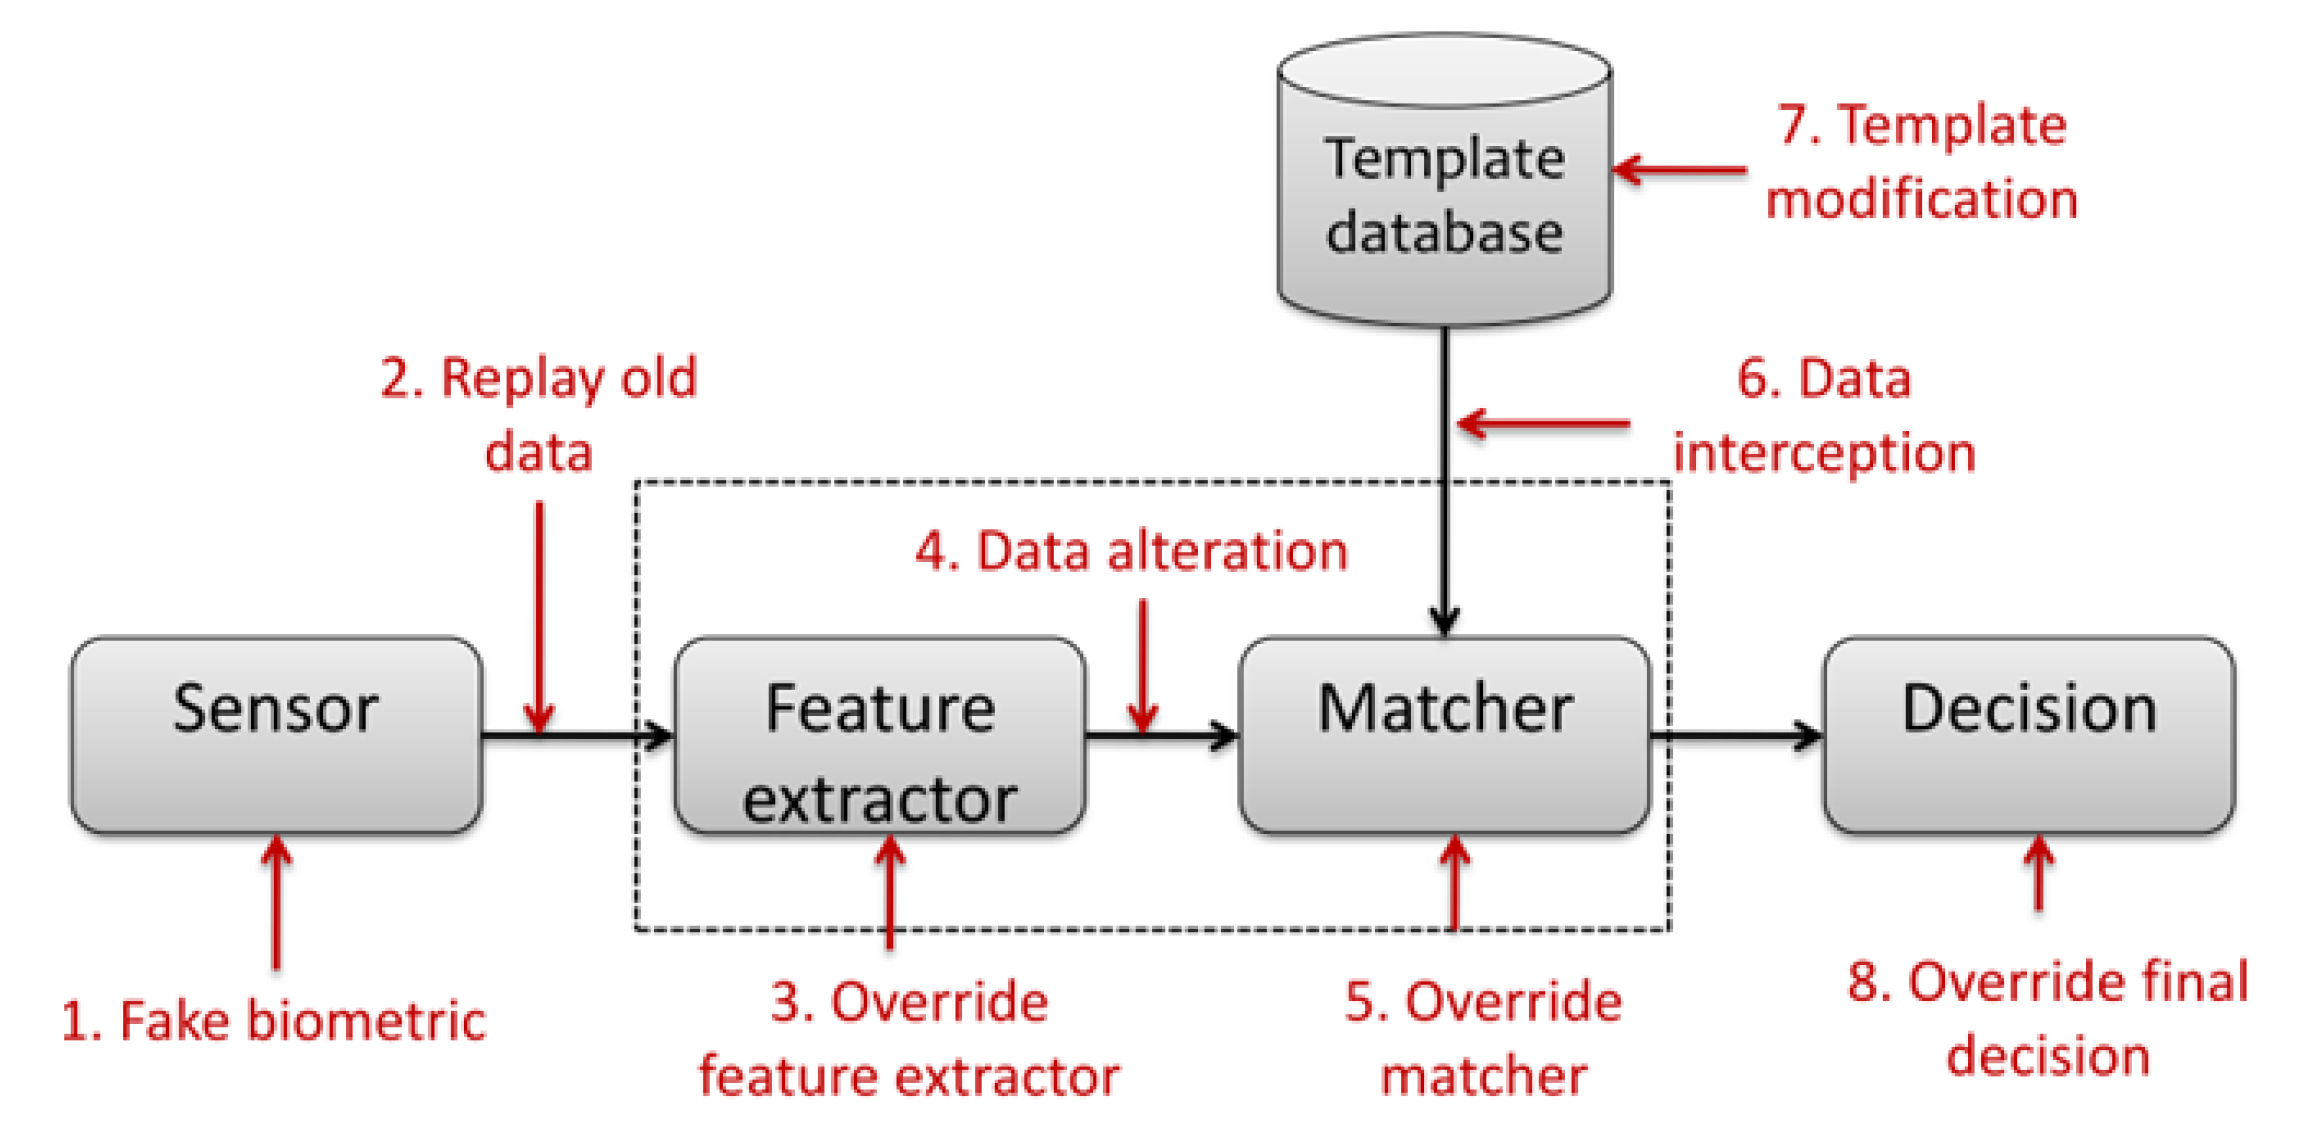
1. Introduction
2. Which a Priori Information Could Be Useful for an Impostor?
- Sensor type used during the enrollment (among capacitive and optical);
- Image resolution;
- Number of extracted minutiae in the reference template.
2.1. Experimental Protocol
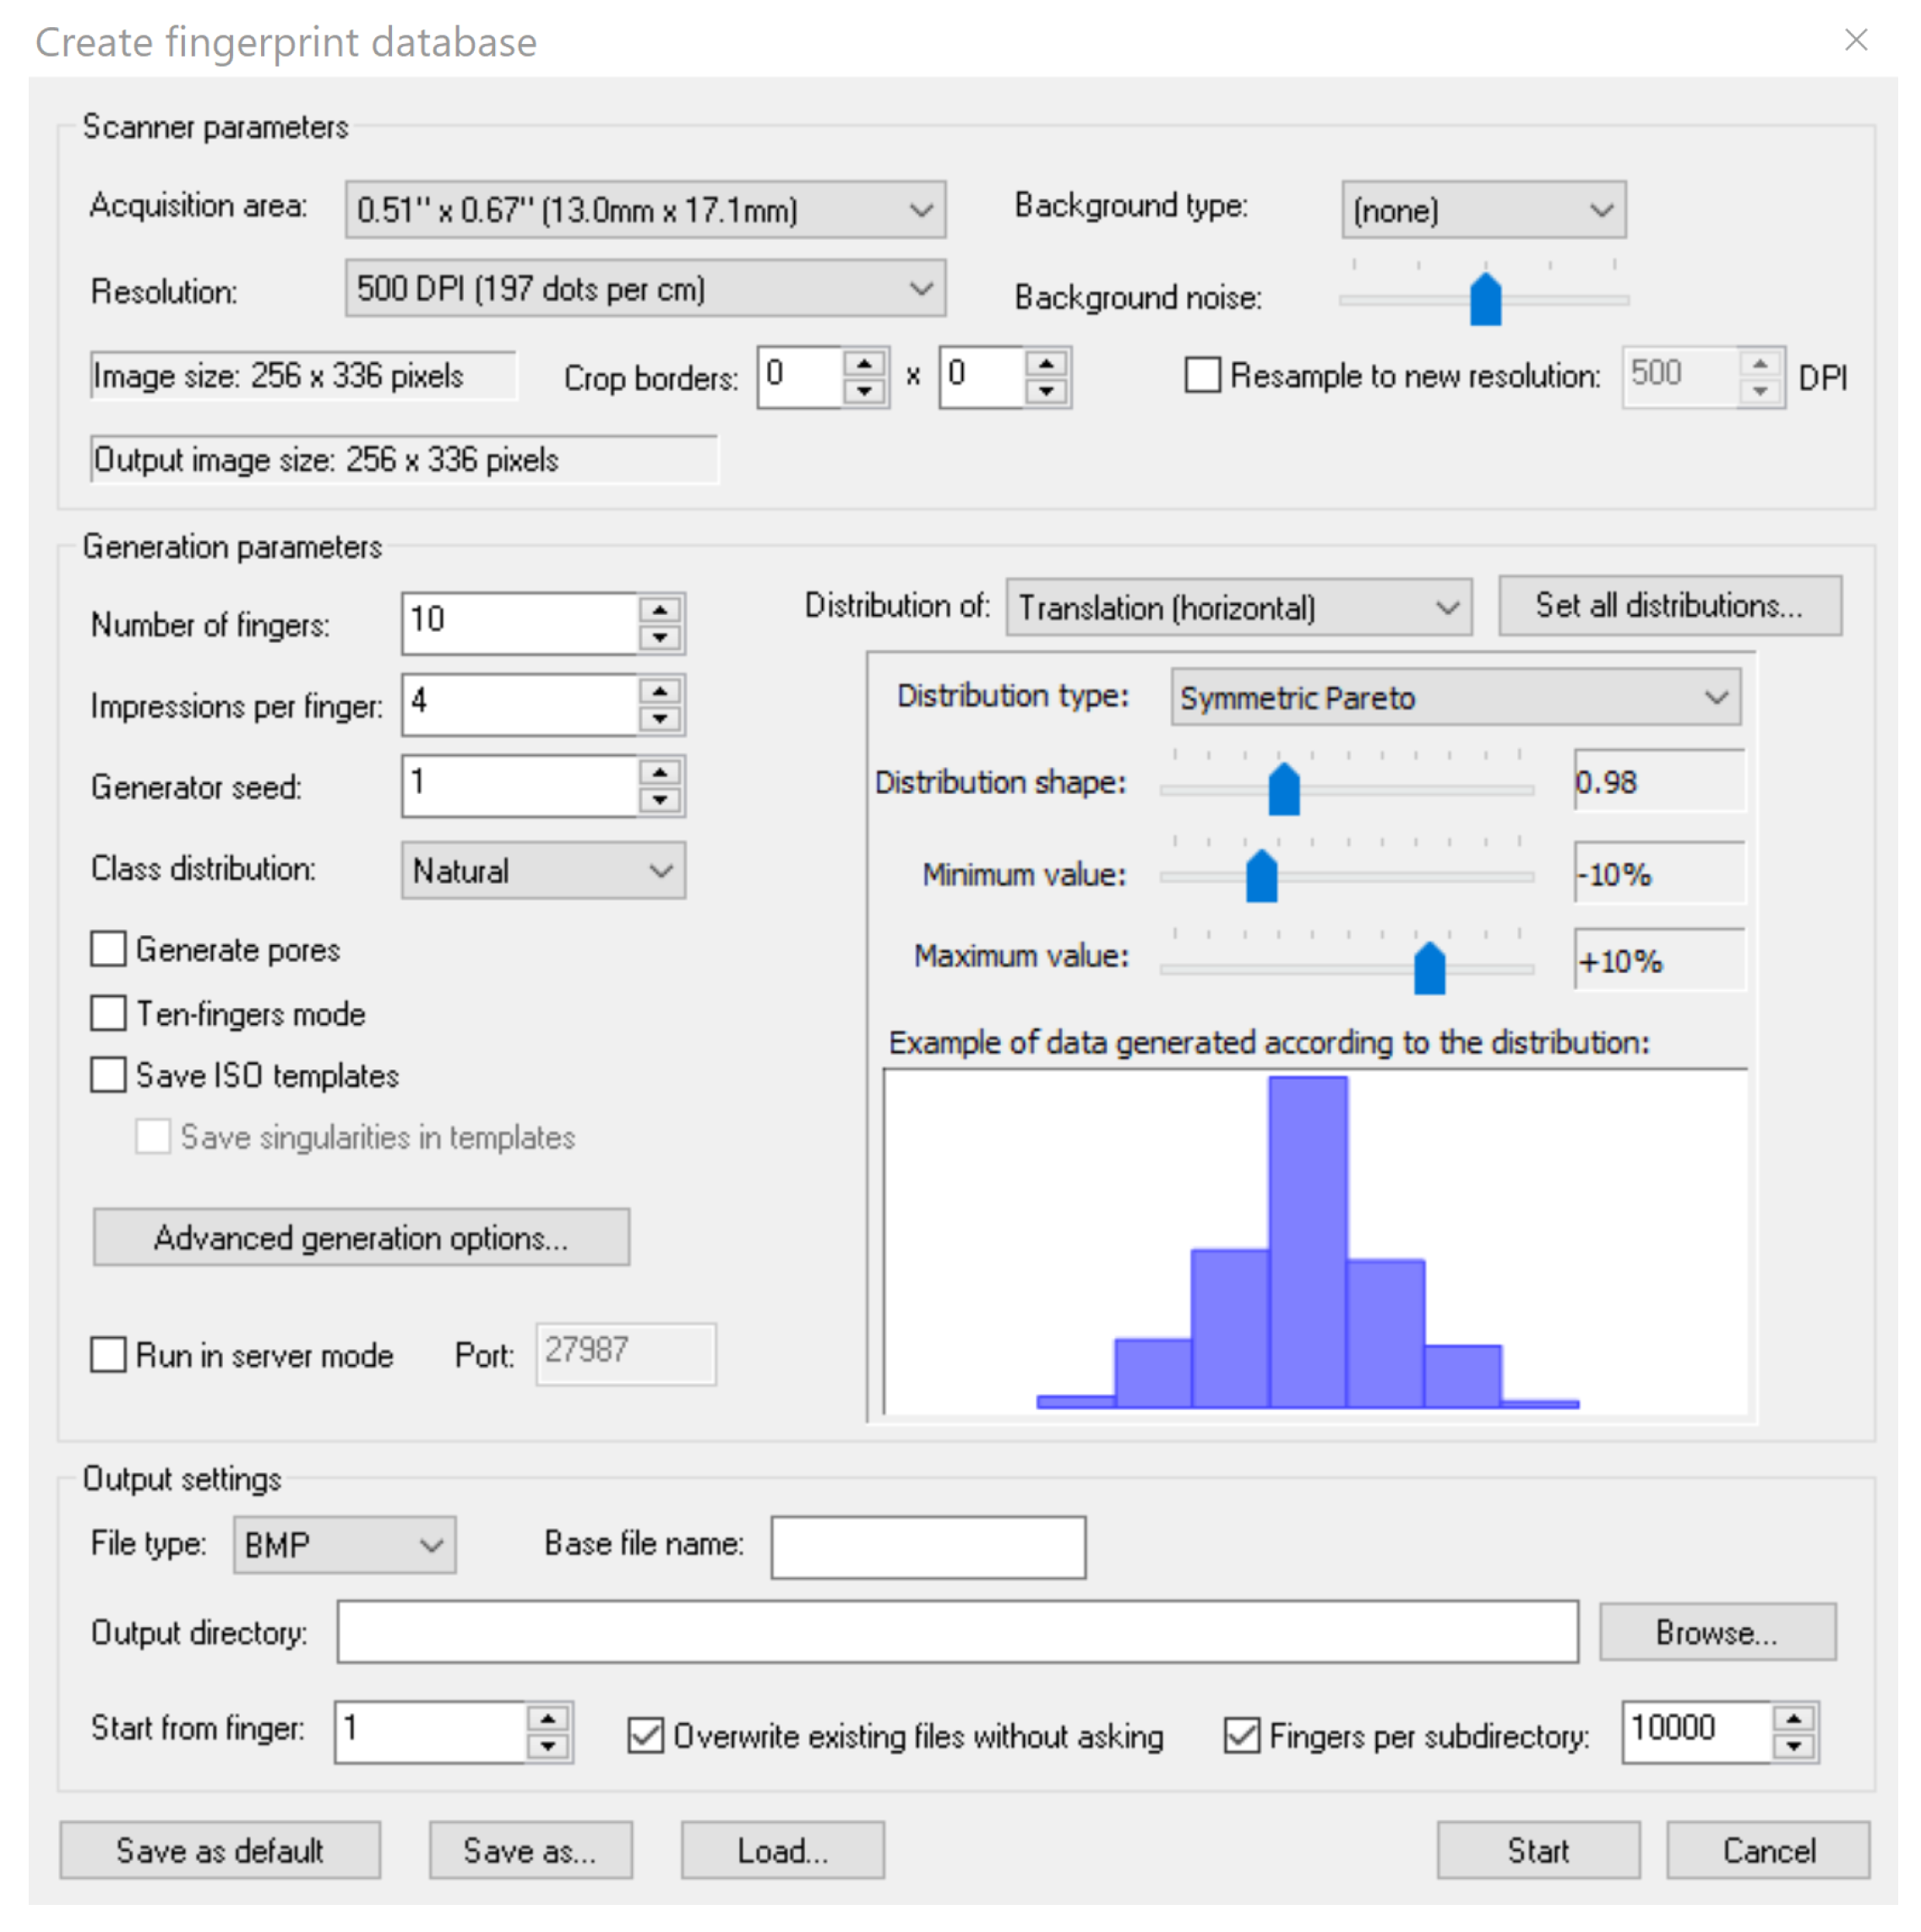
2.1.1. Biometric Databases
- Reference database: this database contains the reference templates of all users. We randomly generated one sample per user for 500 individuals (given a random and distinct seed for each user). This database contains 500 fingerprints;
- Attack database: we generated a database with 1000 different fingerprint samples (one sample per user). This database has been randomly generated (by using different seeds than the reference database) and is used for attacks.
2.1.2. Matching Algorithms
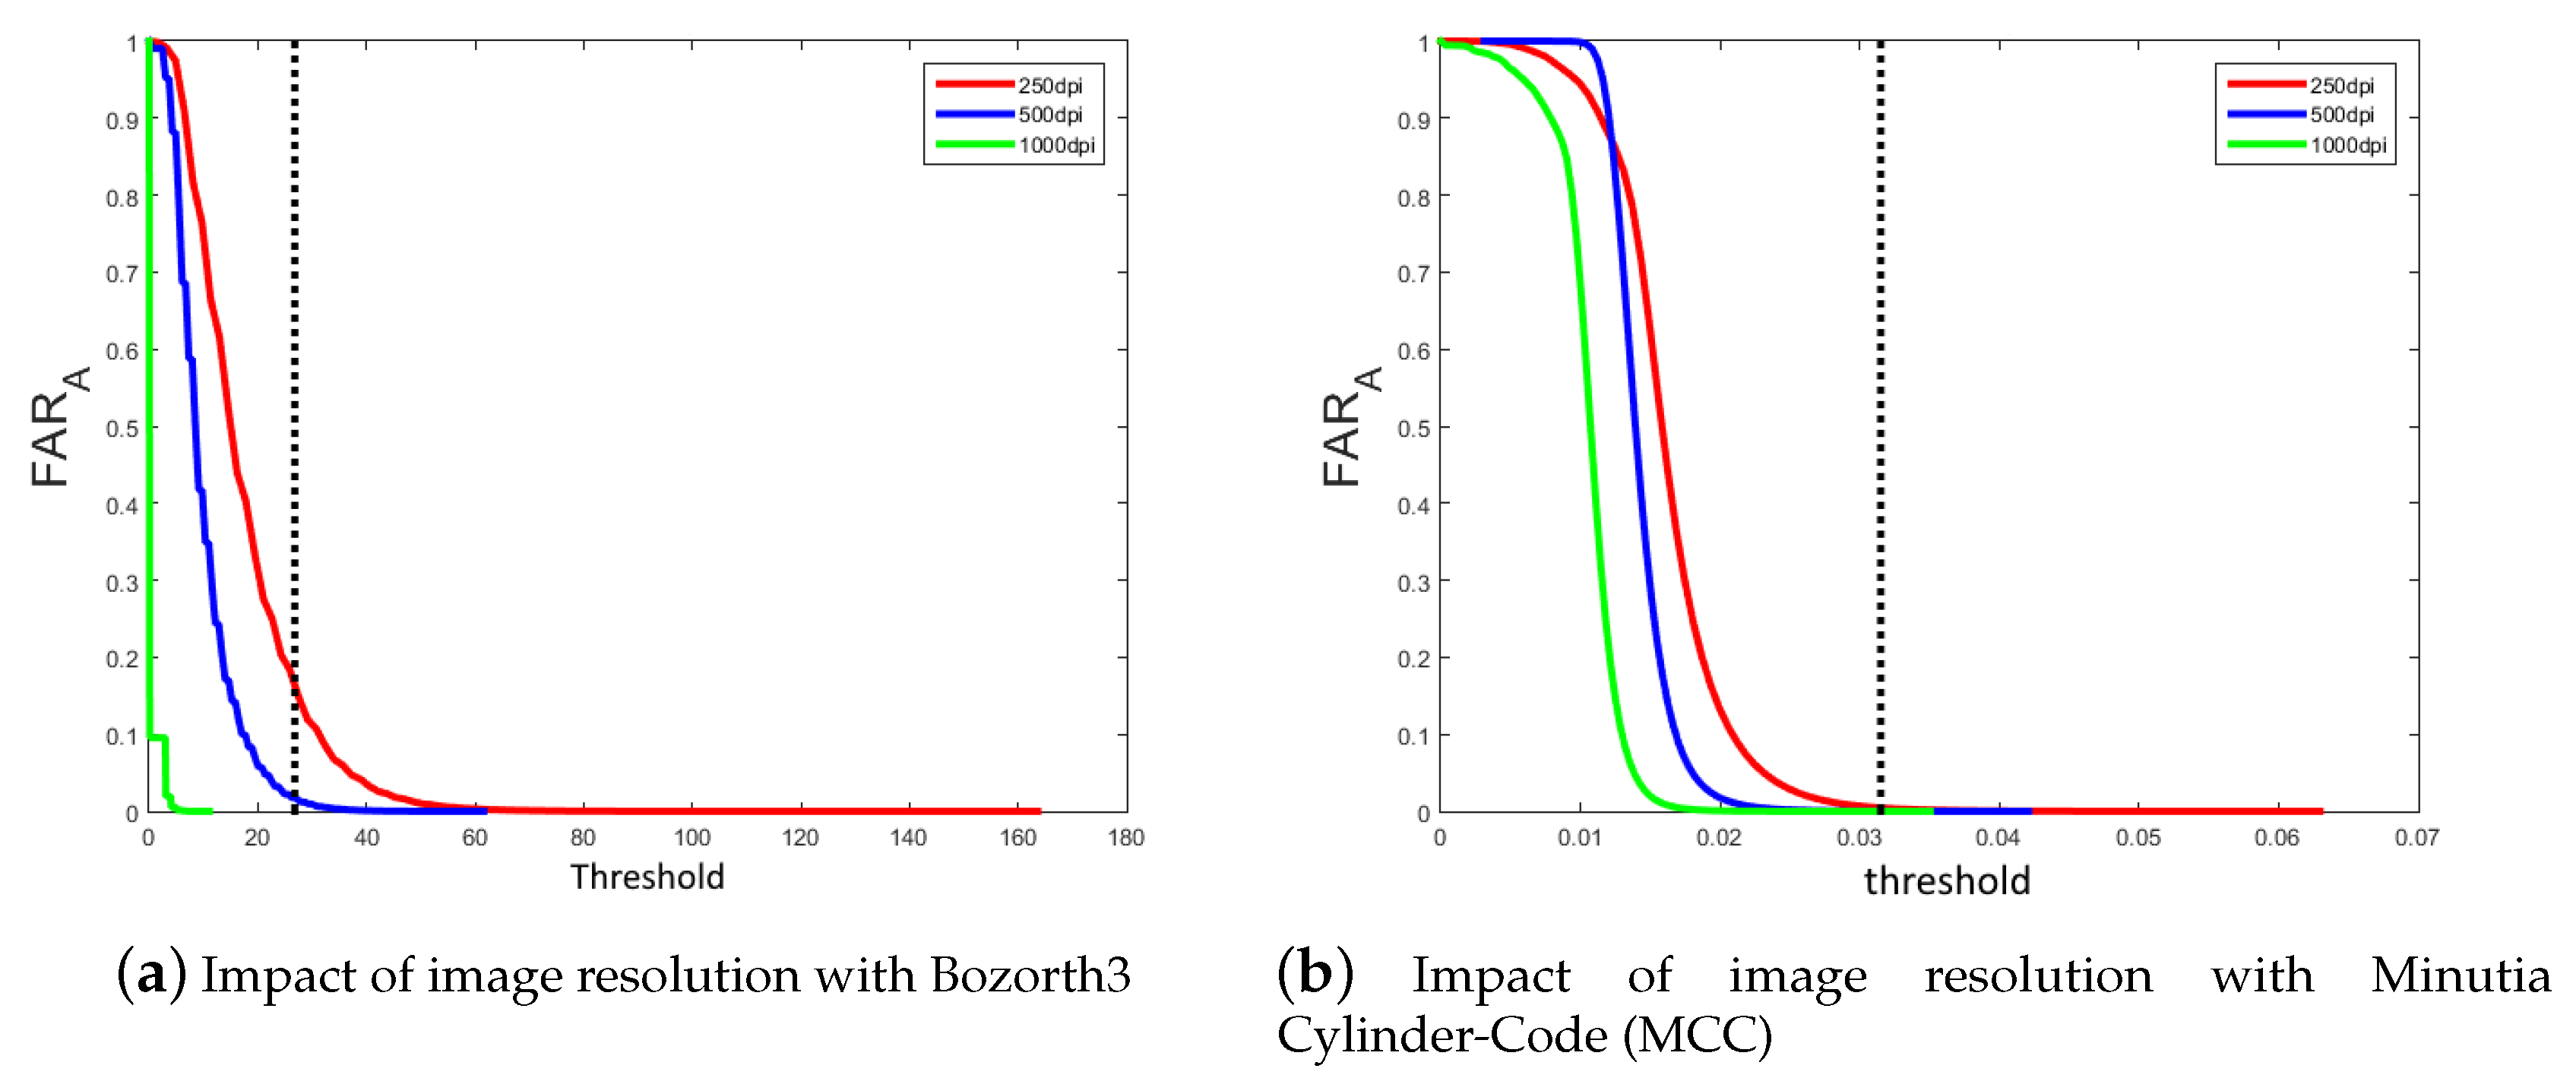
- Bozorth3 algorithm [14]: The EER value of this algorithm was calculated using the DB_SFinge database. The value obtained was equal to 1.03% with a decision threshold value 26.8;
- Minutia Cylinder-Code (MCC) algorithm [15]: The EER value of this algorithm was also computed using the DB_SFinge database. The value obtained was equal to 0% for a decision threshold .
2.1.3. Testing Scenarios
- Scenario 1: we simulated a brute force attack. We randomly selected 500 min templates, following a uniform distribution, in the database generated using SFinge, which constitutes the reference database. The attack database was generated by building 1000 biometric templates randomly but respecting the ISO format, itself coming from SFinge.
- Scenario 2: For each of the given a priori information, a reference database was generated with the SFinge software containing 500 min templates. In addition, for each of the a priori information, an attack database containing 1000 biometric probe templates is generated and is compared with the reference database. For example, considering the sensor type, we obtain four comparisons as shown in Table 1.
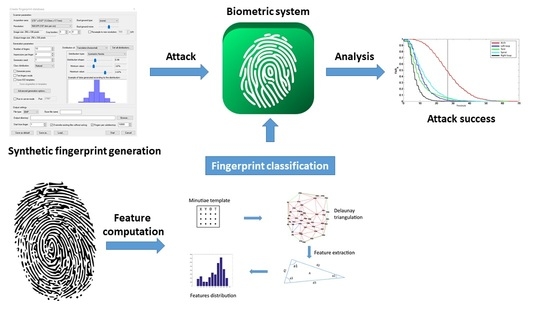
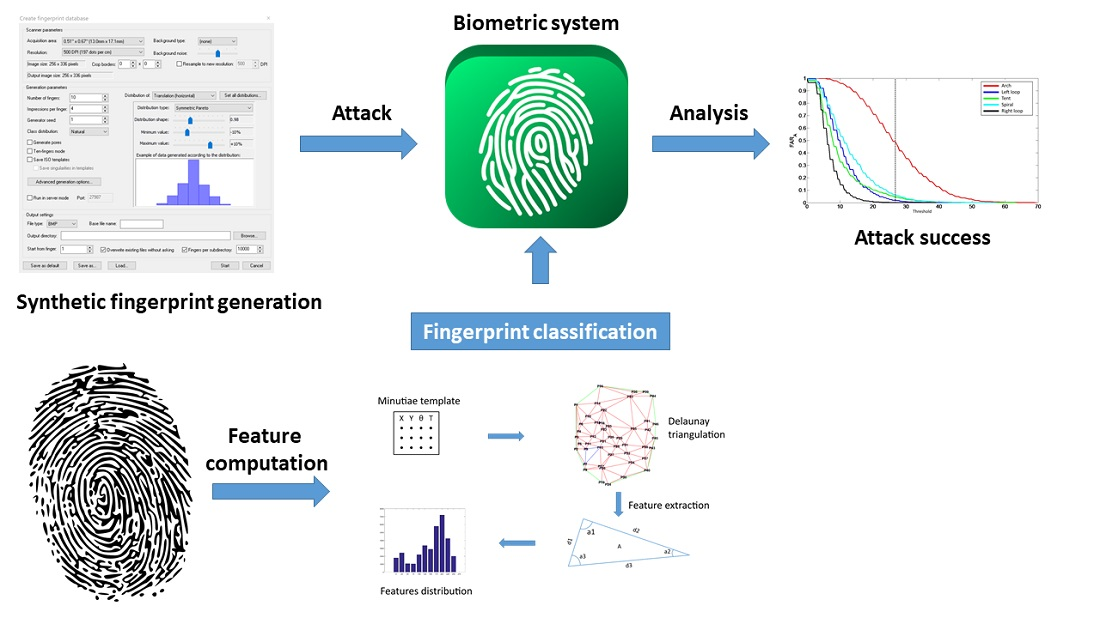
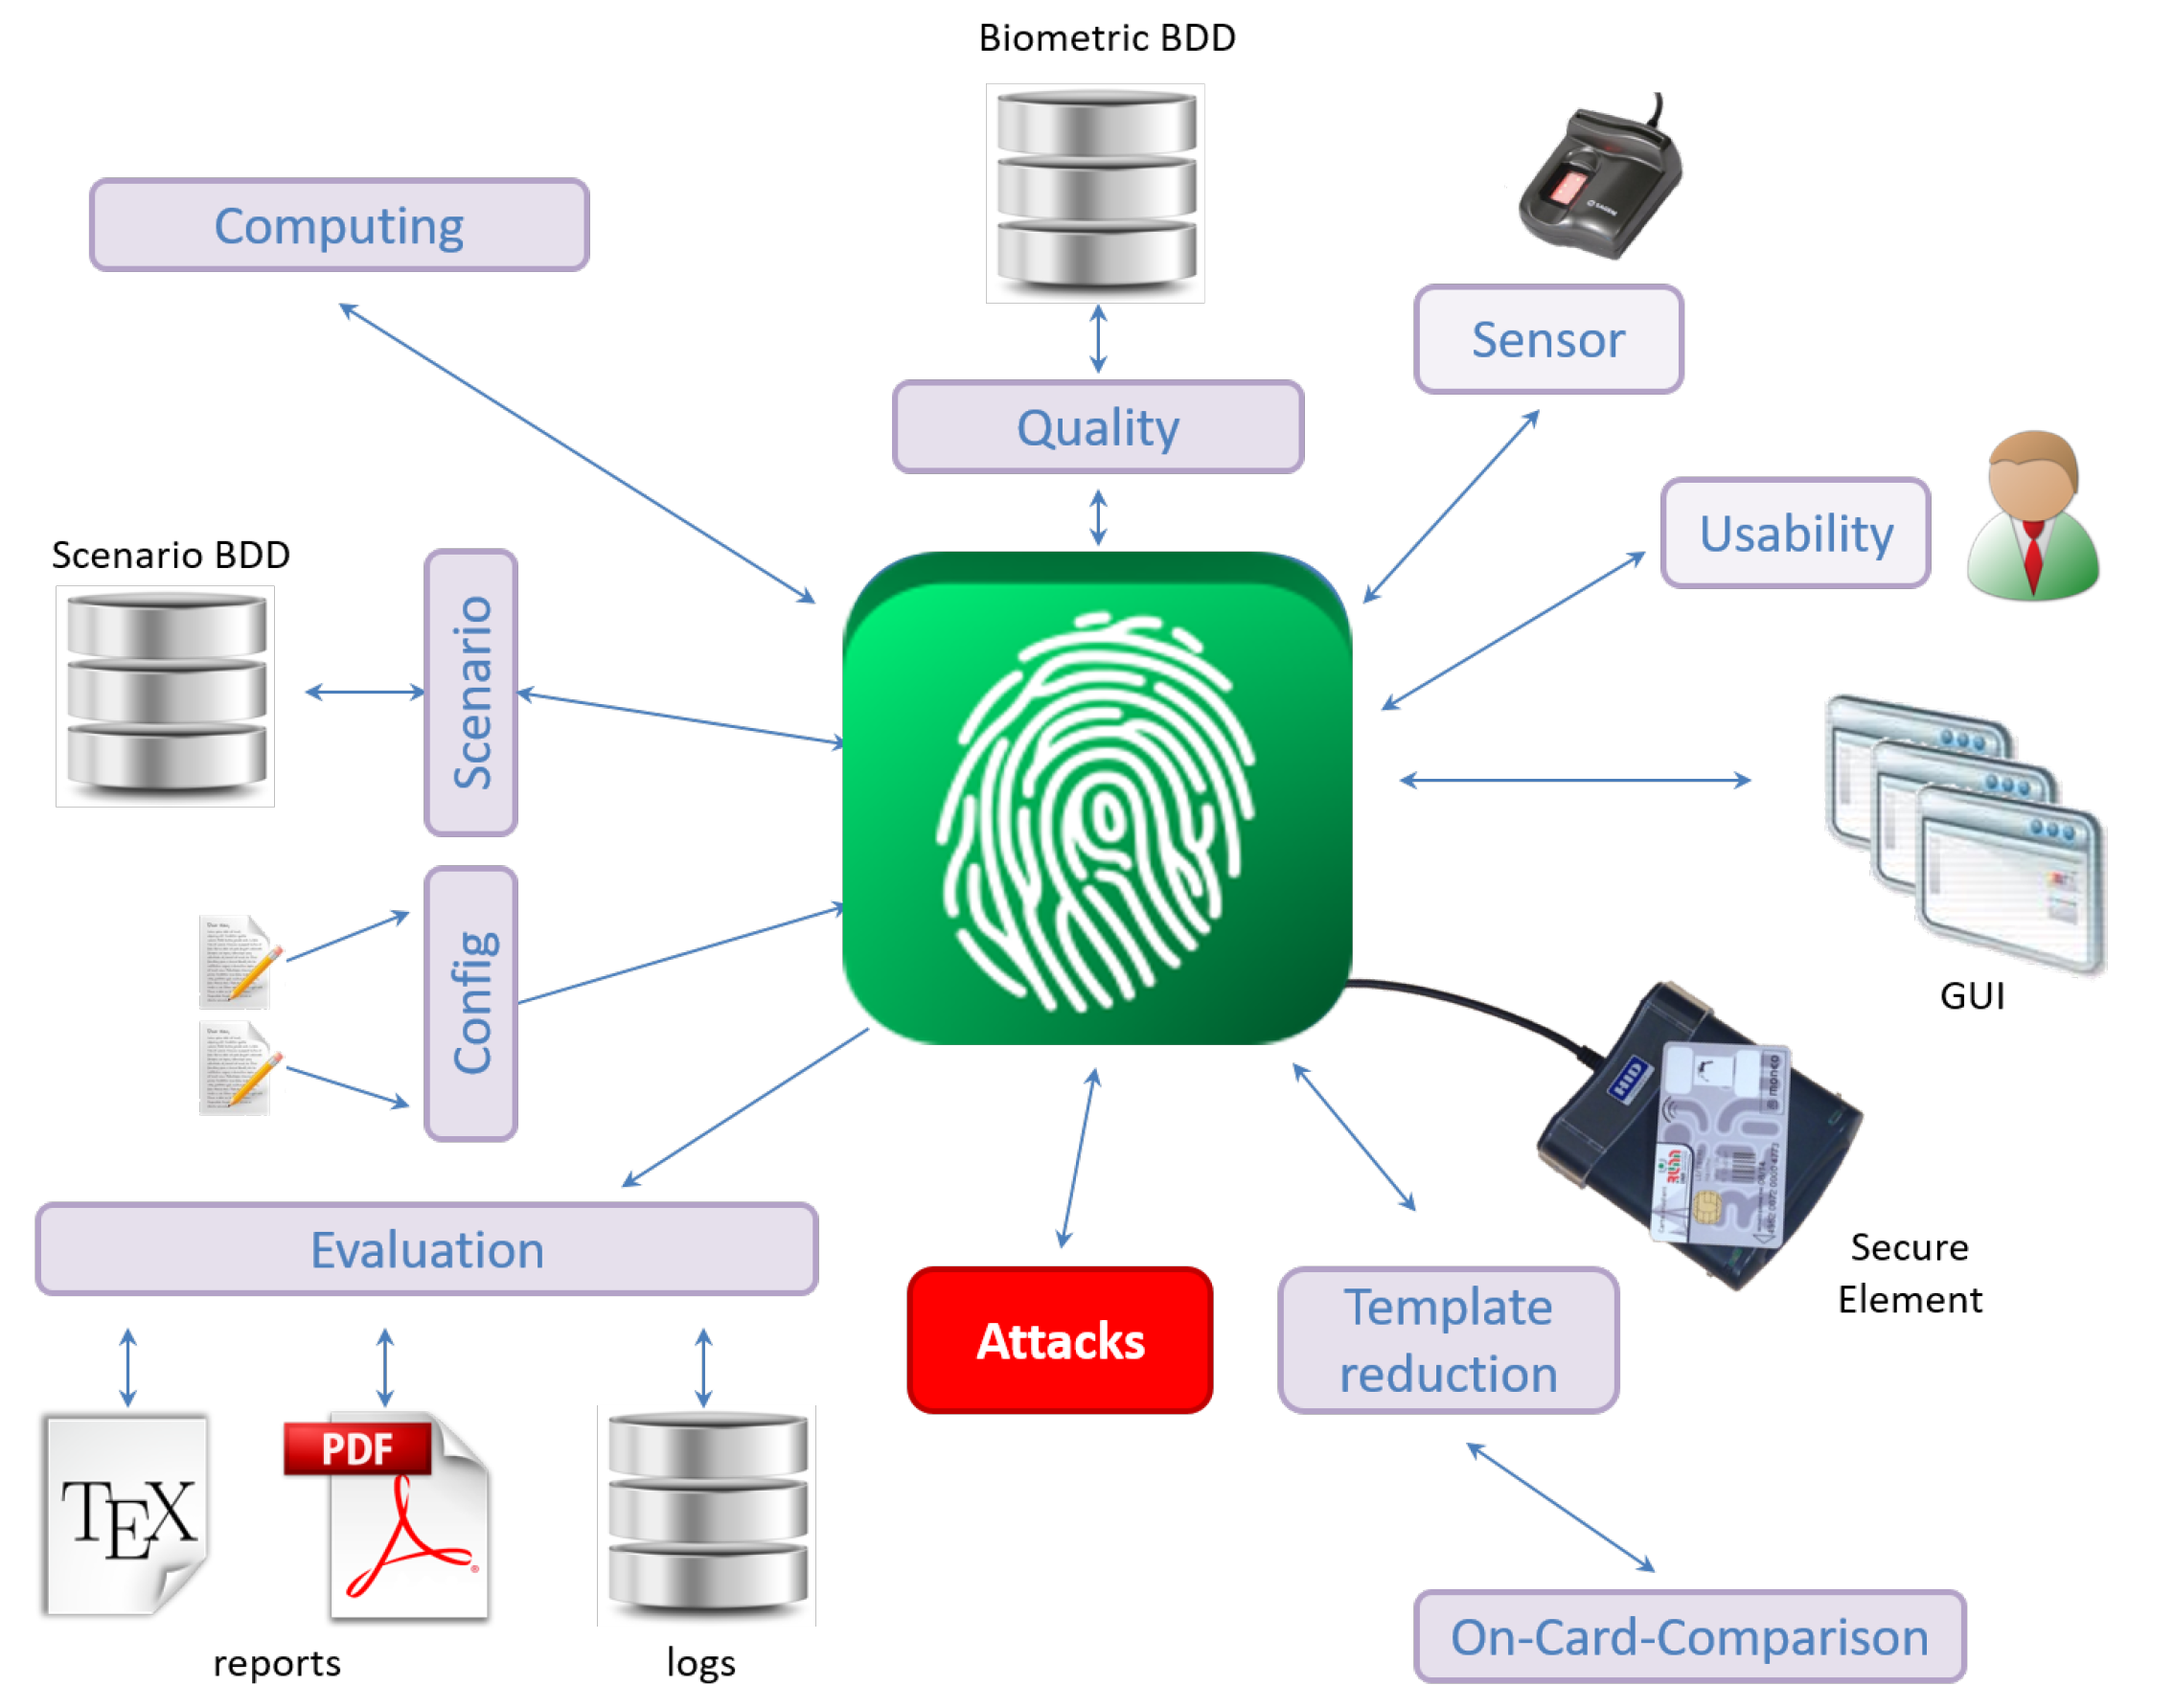
2.1.4. Implementation within the Evabio Platform
2.2. Experimental Results
2.2.1. Sensor Type
2.2.2. Number of Extracted Minutiae
2.2.3. Image Resolution
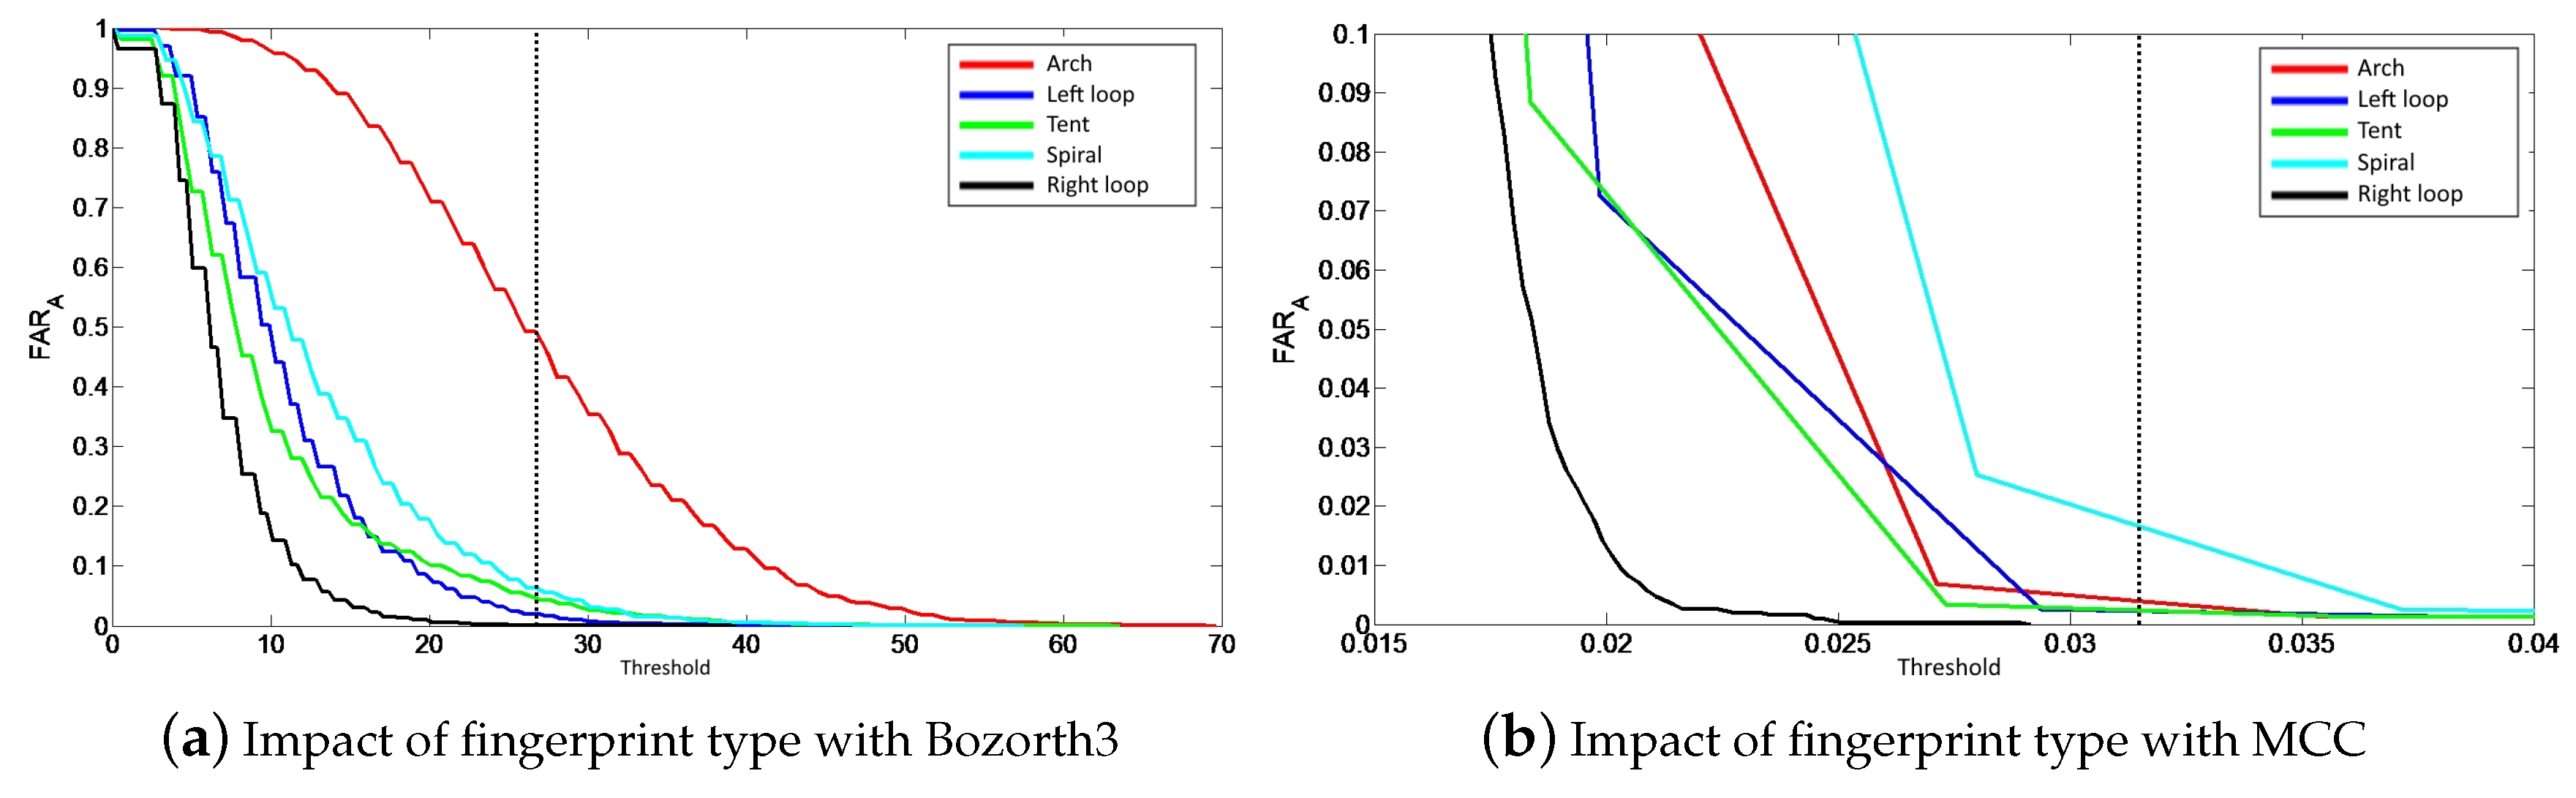
2.2.4. Fingerprint Class
2.3. Discussion
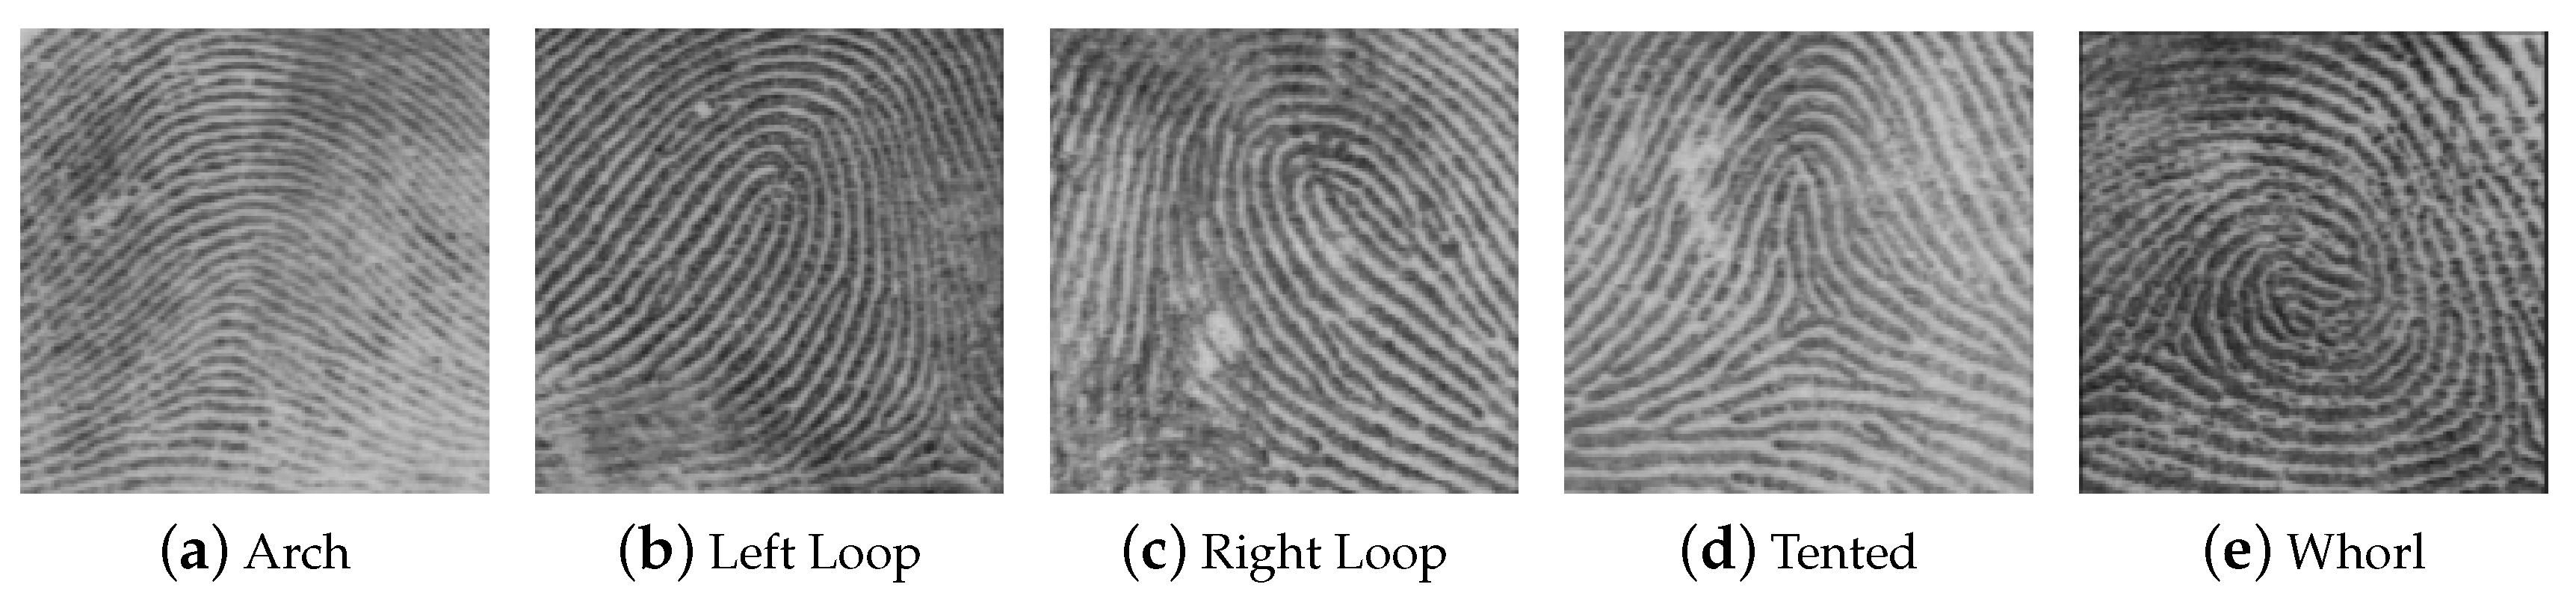
3. Fingerprint Type Recognition
3.1. State-of-the-Art Review
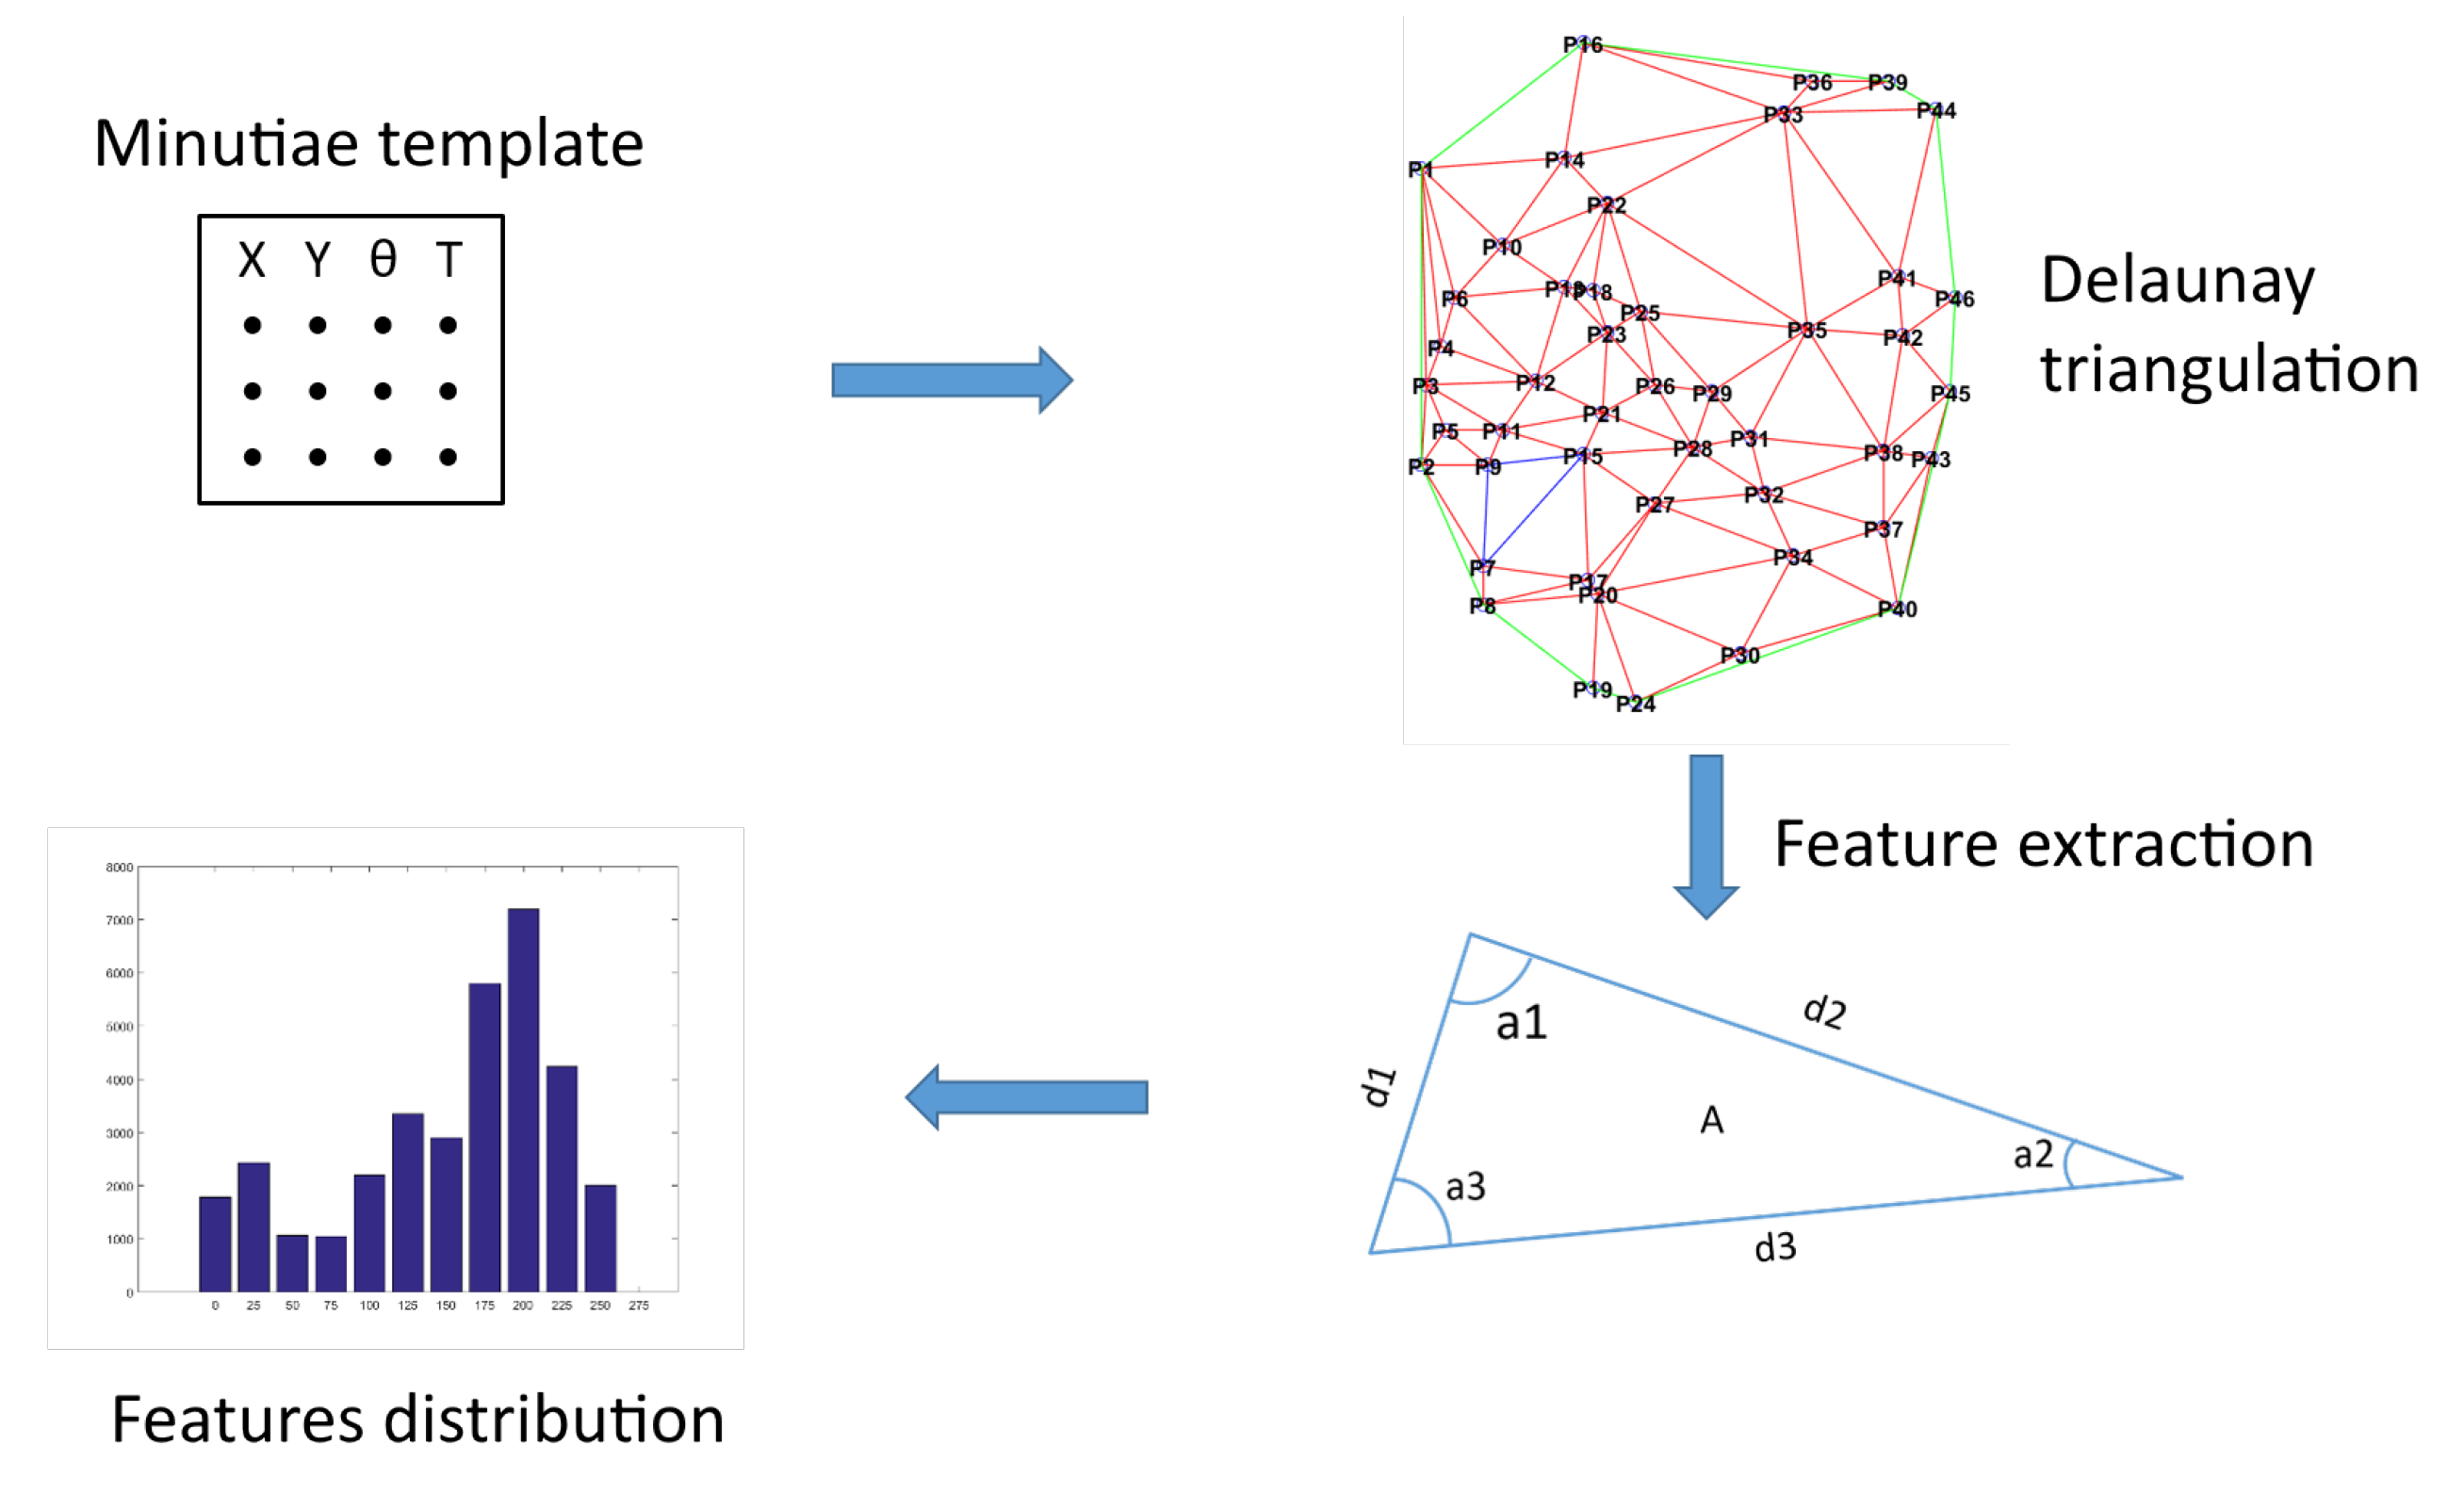
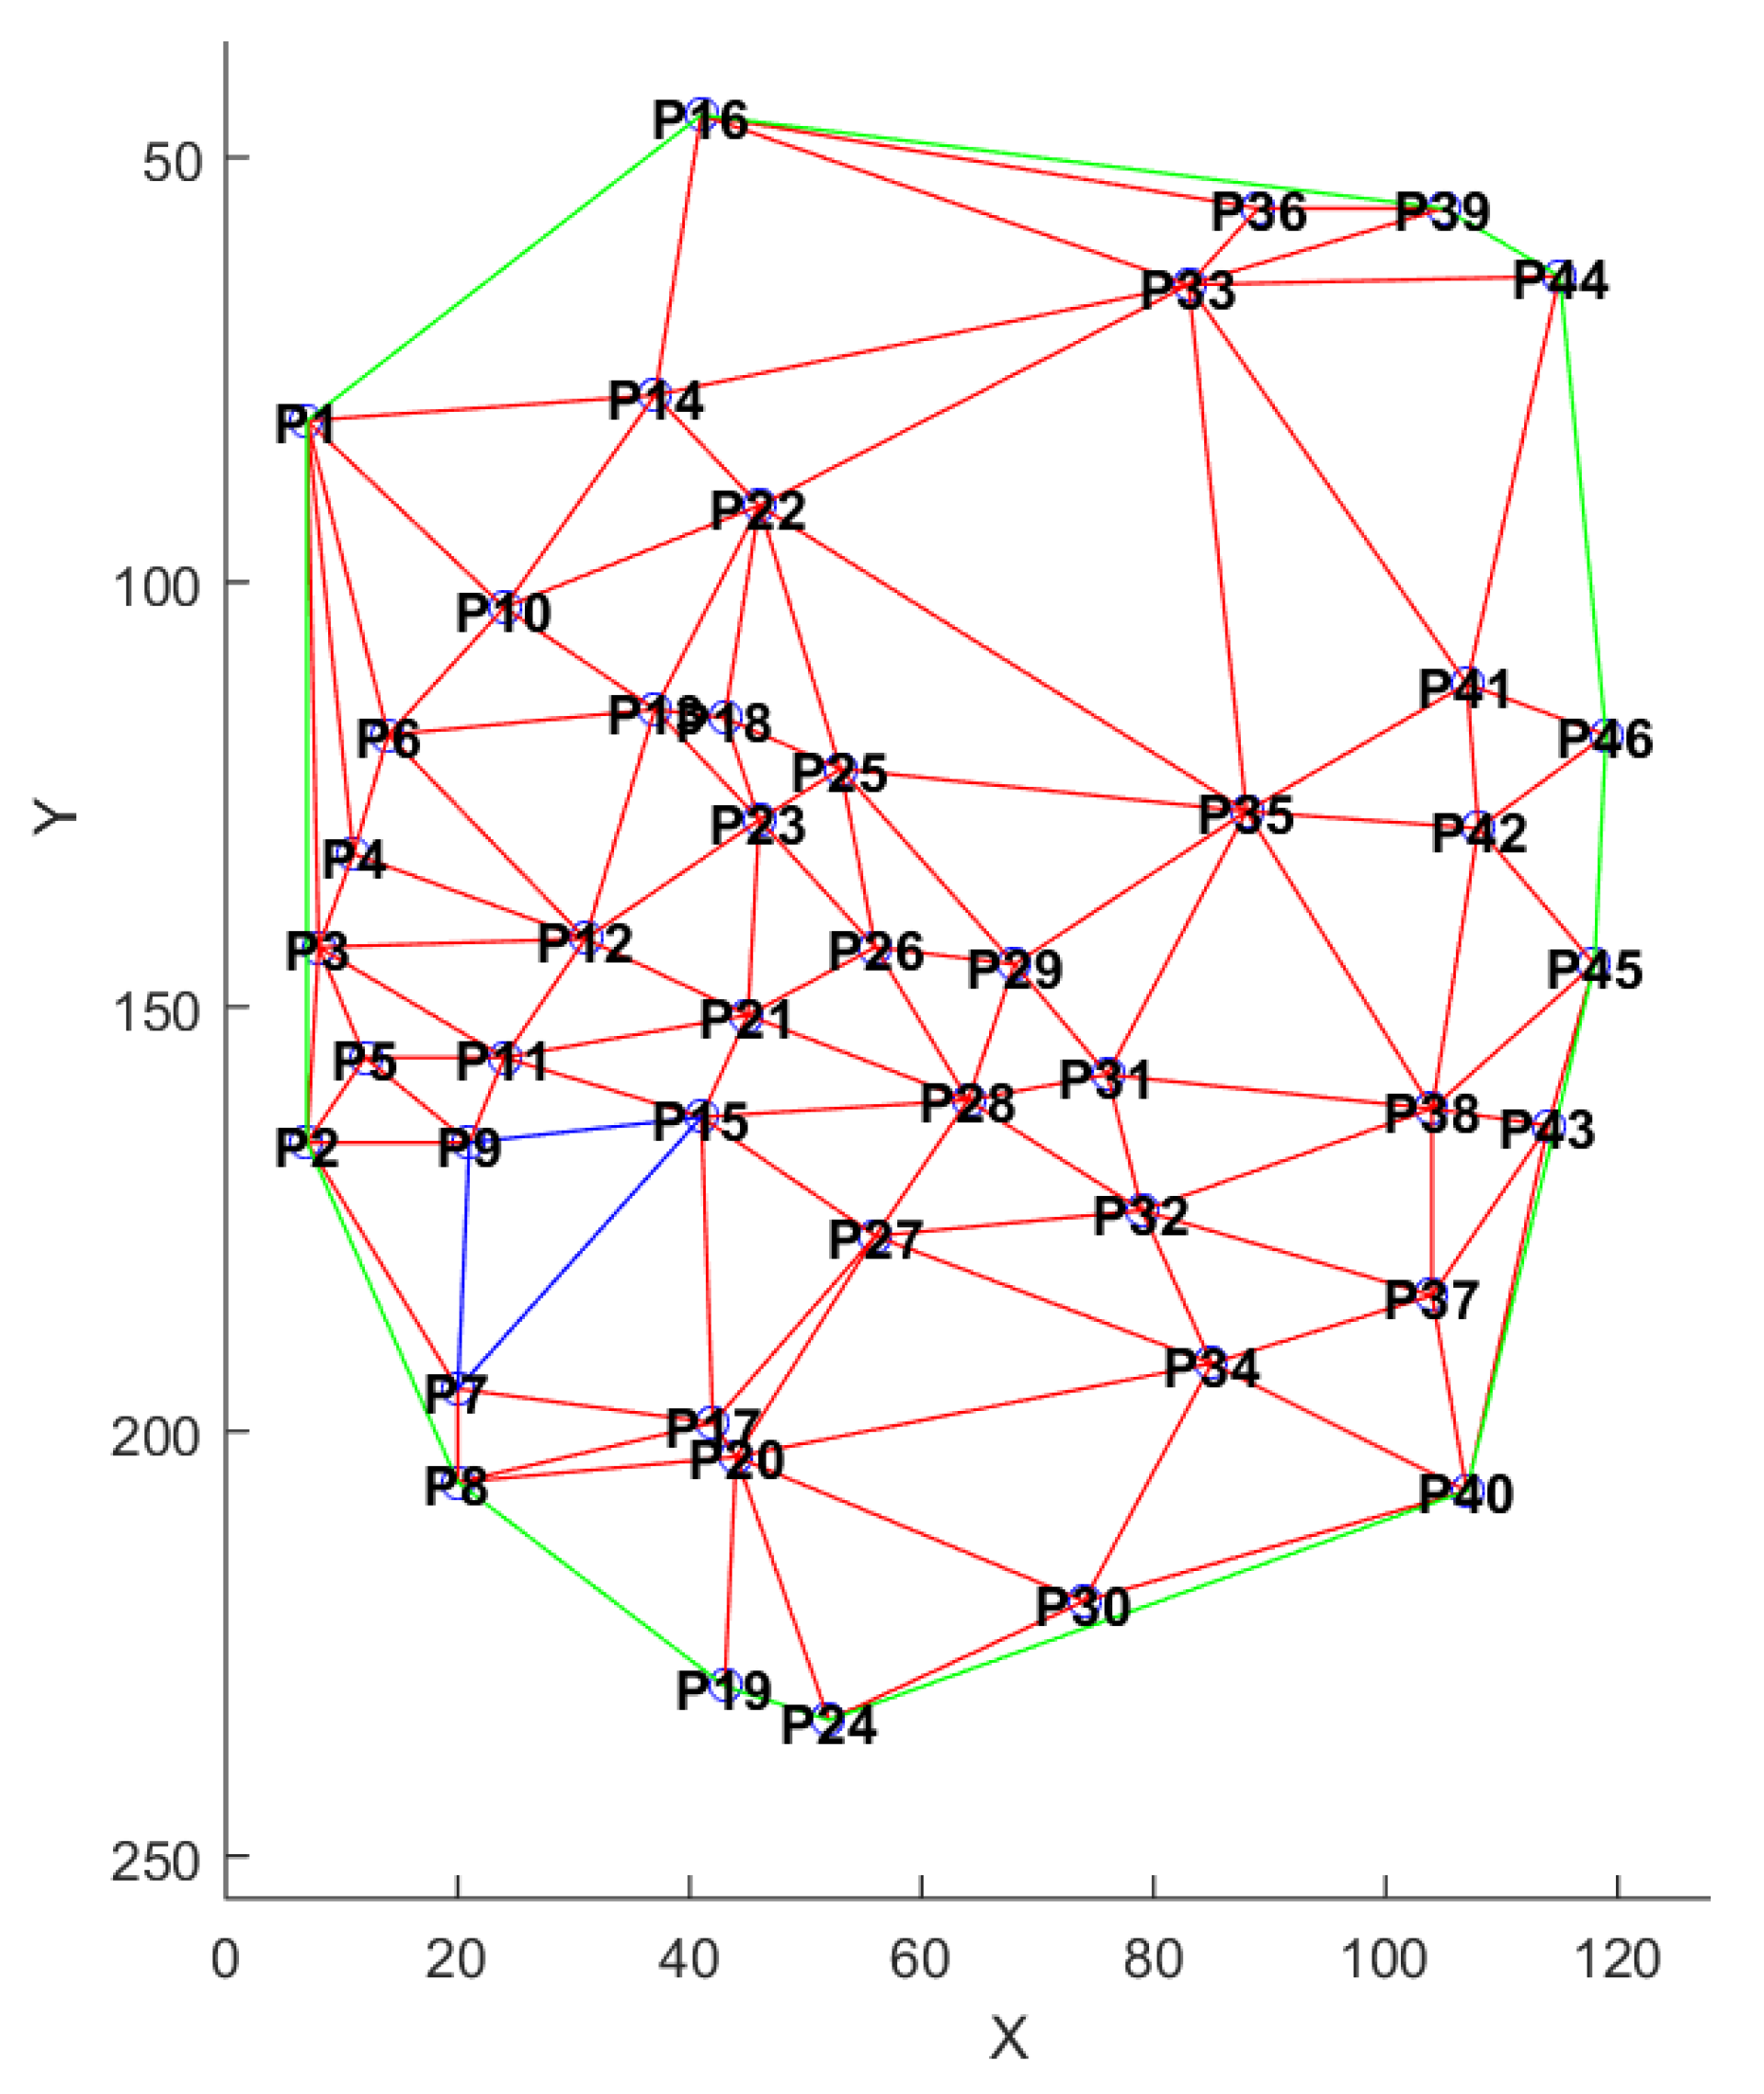
3.2. Proposed Method
- corresponds to the location of the minutiae in the image (the image being of course unavailable),
- is the type of the minutiae (bifurcation or ridge ending),
- is the orientation of the minutiae relative to the ridge. This information is represented by 6 bits, i.e., it has 64 different values.
- is the number of minutiae for the sample j of the user k.
3.2.1. Features Computation
3.2.2. Machine Learning
3.3. Experimental Protocol
3.4. Experimental Results
Isostruct Features
3.5. Templatestruct Features
3.6. Discussion
4. Conclusions and Perspectives
Author Contributions
Funding
Acknowledgments
Conflicts of Interest
References
- Grother, P.; Salamon, W. Interoperability of the ISO/IEC 19794-2 Compact Card and 10 ISO/IEC 7816-11 Match-on-Card Specifications 11; CiteSeerX: Princeton, NJ, USA, 2007. [Google Scholar]
- Ratha, N.K.; Connell, J.H.; Bolle, R.M. Enhancing security and privacy in biometrics-based authentication systems. IBM Syst. J. 2001, 40, 614–634. [Google Scholar] [CrossRef]
- Jain, A.K.; Nandakumar, K.; Ross, A. 50 years of biometric research: Accomplishments, challenges, and opportunities. Pattern Recognit. Lett. 2016, 79, 80–105. [Google Scholar] [CrossRef]
- Uludag, U.; Jain, A.K. Attacks on biometric systems: A case study in fingerprints. In Electronic Imaging 2004; International Society for Optics and Photonics: Bellingham, WA, USA, 2004; pp. 622–633. [Google Scholar]
- Martinez-Diaz, M.; Fierrez-Aguilar, J.; Alonso-Fernandez, F.; Ortega-García, J.; Siguenza, J. Hill-climbing and brute-force attacks on biometric systems: A case study in match-on-card fingerprint verification. In Proceedings of the 2006 40th Annual IEEE International Carnahan Conferences Security Technology, Lexington, KY, USA, 16–19 October 2006; pp. 151–159. [Google Scholar]
- Soutar, C. Biometric System Security. White Paper, Bioscrypt. 2002. Available online: http://www.bioscrypt.com (accessed on 10 August 2020).
- Vibert, B.; Le Bars, J.M.; Charrier, C.; Rosenberger, C. In what way is it possible to impersonate you bypassing fingerprint sensors? In Proceedings of the 2016 International Conference of the Biometrics Special Interest Group (BIOSIG), Darmstadt, Germany, 21–23 September 2016; pp. 1–4. [Google Scholar]
- Henry, E.R. Classification and Uses of Finger Prints; HM Stationery Off.: Yangon, Myanmar, 1913. [Google Scholar]
- Jain, A.K.; Prabhakar, S.; Hong, L. A multichannel approach to fingerprint classification. Pattern Anal. Mach. Intell. IEEE Trans. 1999, 21, 348–359. [Google Scholar] [CrossRef]
- Zhang, Q.; Yan, H. Fingerprint classification based on extraction and analysis of singularities and pseudo ridges. Pattern Recognit. 2004, 37, 2233–2243. [Google Scholar] [CrossRef]
- Cappelli, R.; Maio, D.; Maltoni, D. SFinGe: An approach to synthetic fingerprint generation. In Proceedings of theInternational Workshop on Biometric Technologies (BT2004), Calgary, AB, Canada, 22–23 June 2004; pp. 147–154. [Google Scholar]
- Maio, D.; Maltoni, D.; Cappelli, R.; Wayman, J.L.; Jain, A.K. FVC2004: Third fingerprint verification competition. In Biometric Authentication; Springer: Berlin/Heidelberg, Germany, 2004; pp. 1–7. [Google Scholar]
- Fiérrez-Aguilar, J.; Nanni, L.; Ortega-Garcia, J.; Cappelli, R.; Maltoni, D. Combining multiple matchers for fingerprint verification: A case study in FVC2004. In International Conference on Image Analysis and Processing; Springer: Berlin/Heidelberg, Germany, 2005; pp. 1035–1042. [Google Scholar]
- Garris, M.D.; Watson, C.I.; McCabe, R.; Wilson, C.L. User’s Guide to NIST Fingerprint Image Software (NFIS); National Institute of Standards and Technology: Gaithersburg, MD, USA, 2001. [Google Scholar]
- Cappelli, R.; Ferrara, M.; Maltoni, D.; Tistarelli, M. MCC: A baseline algorithm for fingerprint verification in FVC-onGoing. In Proceedings of the 2010 11th International Conference on Control Automation Robotics & Vision, Singapore, 7–10 December 2010; pp. 19–23. [Google Scholar]
- Vibert, B.; Yao, Z.; Vernois, S.; Le Bars, J.; Charrier, C.; Rosenberger, C. EvaBio Platform for the evaluation biometric system: Application to the optimization of the enrollment process for fingerprint device. In Proceedings of the International Conference on Information Systems Security and Privacy, Angers, France, 9–11 February 2015. [Google Scholar]
- Mahier, J.; Hemery, B.; El-Abed, M.; El-Allam, M.; Bouhaddaoui, M.; Rosenberger, C. Computation Evabio: A Tool for Performance Evaluation in Biometrics. Int. J. Ofautomated Identif. Technol. 2011, 24. [Google Scholar]
- El-Abed, M.; Lacharme, P.; Rosenberger, C. Security evabio: An analysis tool for the security evaluation of biometric authentication systems. In Proceedings of the 2012 5th IAPR International Conference on Biometrics (ICB), New Delhi, India, 29 March–1 April 2012; pp. 460–465. [Google Scholar]
- HandResearch. Fingerprints World Map. Available online: http://www.handresearch.com/news/fingerprints-world-map-whorls-loops-arches.htm (accessed on 10 August 2020).
- Vibert, B.; Le Bars, J.M.; Charrier, C.; Rosenberger, C. Fingerprint Class Recognition For Securing EMV Transaction. In Proceedings of the International Conference on Information Systems Secu-rity and Privacy, Porto, Portugal, 19–21 February 2017. [Google Scholar]
- Karu, K.; Jain, A.K. Fingerprint classification. Pattern Recognit. 1996, 29, 389–404. [Google Scholar] [CrossRef]
- Watson, C.I.; Wilson, C.L. NIST Special Database 4. Fingerpr. Database Natl. Inst. Stand. Technol. 1992, 17, 5. [Google Scholar]
- Li, J.; Yau, W.Y.; Wang, H. Combining singular points and orientation image information for fingerprint classification. Pattern Recognit. 2008, 41, 353–366. [Google Scholar] [CrossRef]
- Cao, K.; Pang, L.; Liang, J.; Tian, J. Fingerprint classification by a hierarchical classifier. Pattern Recognit. 2013, 46, 3186–3197. [Google Scholar] [CrossRef]
- Wang, R.; Han, C.; Guo, T. A novel fingerprint classification method based on deep learning. In Proceedings of the 2016 23rd International Conference on Pattern Recognition (ICPR), Cancun, Mexico, 4–8 December 2016; pp. 931–936. [Google Scholar]
- Ross, A.A.; Shah, J.; Jain, A.K. Toward reconstructing fingerprints from minutiae points. In Biometric Technology for Human Identification II; International Society for Optics and Photonics: Bellingham, WA, USA, 2005; Volume 5779, pp. 68–80. [Google Scholar]
- Aurenhammer, F. Voronoi diagrams—A survey of a fundamental geometric data structure. ACM Comput. Surv. (CSUR) 1991, 23, 345–405. [Google Scholar] [CrossRef]
- Su, P.; Drysdale, R.L.S. A comparison of sequential Delaunay triangulation algorithms. In Proceedings of the Eleventh Annual Symposium on Computational Geometry; ACM: New York, NY, USA, 1995; pp. 61–70. [Google Scholar]
- Shewchuk, J.R. Delaunay refinement algorithms for triangular mesh generation. Comput. Geom. 2002, 22, 21–74. [Google Scholar] [CrossRef]
- Gopi, M.; Krishnan, S.; Silva, C.T. Surface reconstruction based on lower dimensional localized Delaunay triangulation. Comput. Graph. Forum 2000, 19, 467–478. [Google Scholar] [CrossRef]
- Labatut, P.; Pons, J.P.; Keriven, R. Efficient multi-view reconstruction of large-scale scenes using interest points, delaunay triangulation and graph cuts. In Proceedings of the 2007 IEEE 11th International Conference on Computer Vision, Rio de Janeiro, Brazil, 14–21 October 2007; pp. 1–8. [Google Scholar]
- Miao, W.; Liu, Y.; Shi, X.; Feng, J.; Xue, K. A 3D Surface Reconstruction Method Based on Delaunay Triangulation. In International Conference on Image and Graphics; Springer: Berlin/Heidelberg, Germany, 2019; pp. 40–51. [Google Scholar]
- Liu, N.; Yin, Y.; Zhang, H. A fingerprint matching algorithm based on Delaunay triangulation net. In Proceedings of the Fifth International Conference on Computer and Information Technology (CIT’05), Shanghai, China, 21–23 September 2005; pp. 591–595. [Google Scholar]
- Mohamed-Abdul-Cader, A.J.; Chaidee, W.; Banks, J.; Chandran, V. Minutiae Triangle Graphs: A New Fingerprint Representation with Invariance Properties. In Proceedings of the 2019 International Conference on Image and Vision Computing New Zealand (IVCNZ), Dunedin, New Zealand, 2–4 December 2019; pp. 1–6. [Google Scholar]
- Valdes-Ramirez, D.; Medina-Pérez, M.A.; Monroy, R.; Loyola-González, O.; Rodríguez-Ruiz, J.; Morales, A.; Herrera, F. A Review of Fingerprint Feature Representations and Their Applications for Latent Fingerprint Identification: Trends and Evaluation. IEEE Access 2019, 7, 48484–48499. [Google Scholar] [CrossRef]
- Charrier, C.; Lézoray, O.; Lebrun, G. A machine learning regression scheme to design a FR-image quality assessment algorithm. In Conference on Colour in Graphics, Imaging, and Vision; Society for Imaging Science and Technology: Springfield, VA, USA, 2012; Volume 2012, pp. 35–42. [Google Scholar]
- Hsu, C.W.; Lin, C.J. A Comparison of Methods for Multiclass Support Vector Machines. IEEE Trans. Neural Netw. 2002, 13, 415–425. [Google Scholar] [PubMed]
- Kudo, M.; Sklansky, J. Comparison of algorithms that select features for pattern classifiers. Pattern Recognit. 2000, 33, 25–41. [Google Scholar] [CrossRef]
- Vapnik, V.N. Statistical Learning Theory; Wiley: New York, NY, USA, 1998. [Google Scholar]
- Chang, C.C.; Lin, C.J. LIBSVM: A library for support vector machines. ACM Trans. Intell. Syst. Technol. (TIST) 2011, 2, 27. [Google Scholar] [CrossRef]
- Watson, C.I.; Garris, M.D.; Tabassi, E.; Wilson, C.L.; Mccabe, R.M.; Janet, S.; Ko, K. User’s Guide to Nist Biometric Image Software (NBIS); Technical Report; NIST: Gaithersburg, MD, USA, 2007. [Google Scholar]
- Vibert, B. Contributions to the Evaluation of Embedded Biometric Systems. Ph.D. Thesis, Normandie Université, Caen, France, 2017. [Google Scholar]


| Reference BDD | Attack BDD |
|---|---|
| Capacitive | Capacitive |
| Capacitive | Optical |
| Optical | Capacitive |
| Optical | Optical |
| Matching Algorithm | Capacitive | Optical |
|---|---|---|
| Bozorth3 | 0.0158% | 0.016% |
| MCC | % | % |
| Matching Algorithm | <38 | >38 |
|---|---|---|
| Bozorth3 | 0.0038% | 0.0391% |
| Minutia CC | % | % |
| Matching Algorithm | 250 dpi | 500 dpi | 1000 dpi |
|---|---|---|---|
| Bozorth3 | 0.165% | 0.047% | 0% |
| Minutia CC | % | % | 0% |
| Matching Algorithm | Arch | Right Loop | Left Loop | Tented | Whorl |
|---|---|---|---|---|---|
| Bozorth3 | 50% | 0% | 2% | 5% | 6.3% |
| Minutia CC | 0.6% | 0% | 0.2% | 0.2% | 2% |
| Label | Fingerprint Type |
|---|---|
| 1 | Arch |
| 2 | Left loop |
| 3 | Right loop |
| 4 | Tented |
| 5 | Whorl |
| Quantization Levels | Recognition Rate (%)—IsoStruct |
|---|---|
| 8 | 79.43 |
| 16 | 80.37 |
| 32 | 80.06 |
| 64 | 60.80 |
| Arch | Left Loop | Right Loop | Tented | Whorl | |
|---|---|---|---|---|---|
| Recognition rate—IsoStruct (%) | 85 | 75 | 75 | 80 | 87 |
| Recognition Rate—IsoStruct (%) | ||||
|---|---|---|---|---|
| Quantification Level | H(X) | H(Y) | H(ISO_Angle) | H(Type) |
| 8 | 42.87 | 37.52 | 77.85 | 28.13 |
| 16 | 43.62 | 38.96 | 80.23 | 28.13 |
| 32 | 42.25 | 36.51 | 80.24 | 28.13 |
| 64 | 40.45 | 36.47 | 78.25 | 28.13 |
| Recognition Rate (%) | |
|---|---|
| IsoStruct | 80.37 |
| TemplateStruct | 89.12 |
| Arch | Left Loop | Right Loop | Tented | Whorl | |
|---|---|---|---|---|---|
| Recognition rate (%) | 95 | 82 | 82 | 89 | 97.8 |
© 2020 by the authors. Licensee MDPI, Basel, Switzerland. This article is an open access article distributed under the terms and conditions of the Creative Commons Attribution (CC BY) license (http://creativecommons.org/licenses/by/4.0/).
Share and Cite
Vibert, B.; Le Bars, J.-M.; Charrier, C.; Rosenberger, C. Logical Attacks and Countermeasures for Fingerprint On-Card-Comparison Systems. Sensors 2020, 20, 5410. https://doi.org/10.3390/s20185410
Vibert B, Le Bars J-M, Charrier C, Rosenberger C. Logical Attacks and Countermeasures for Fingerprint On-Card-Comparison Systems. Sensors. 2020; 20(18):5410. https://doi.org/10.3390/s20185410
Chicago/Turabian StyleVibert, Benoit, Jean-Marie Le Bars, Christophe Charrier, and Christophe Rosenberger. 2020. "Logical Attacks and Countermeasures for Fingerprint On-Card-Comparison Systems" Sensors 20, no. 18: 5410. https://doi.org/10.3390/s20185410
APA StyleVibert, B., Le Bars, J.-M., Charrier, C., & Rosenberger, C. (2020). Logical Attacks and Countermeasures for Fingerprint On-Card-Comparison Systems. Sensors, 20(18), 5410. https://doi.org/10.3390/s20185410