Assessing the Feasibility of Augmenting Fall Detection Systems by Relying on UWB-Based Position Tracking and a Home Robot

 , , ,
, , ,  , and
, and
Abstract
1. Introduction
- develop a machine learning algorithm to detect falls from accelerometer data collected using an IMU positioned either on the chest or on the wrist;
- assess the robustness of the alarm notification transmission system;
- evaluate the performance of the UWB-based system to locate and track a radio tag in LOS and NLOS conditions.
2. Related Work
3. Materials and Methods
3.1. Hardware
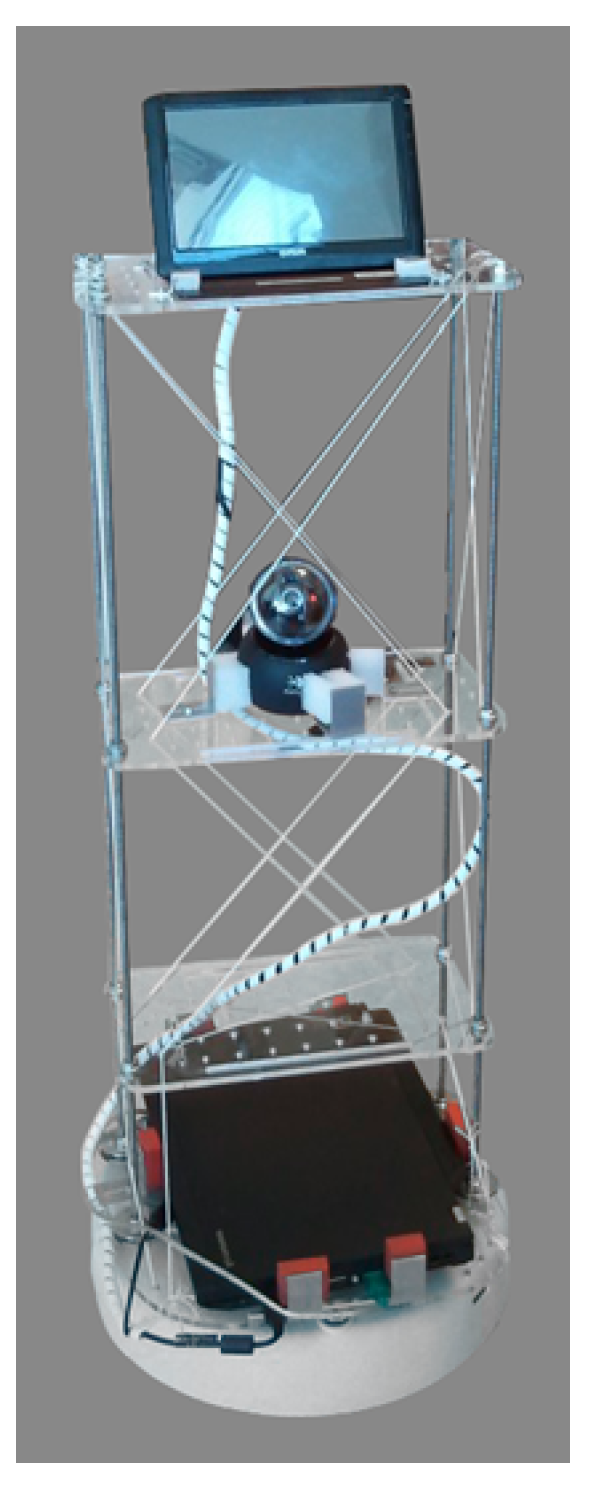
3.1.1. Home Robot
3.1.2. Wireless Sensor Network
3.1.3. Location Tracking Using UWB Radio Systems
3.2. Software
3.2.1. Fall Detection Machine Learning-Based Algorithm
3.2.2. Dataset of Fall Events
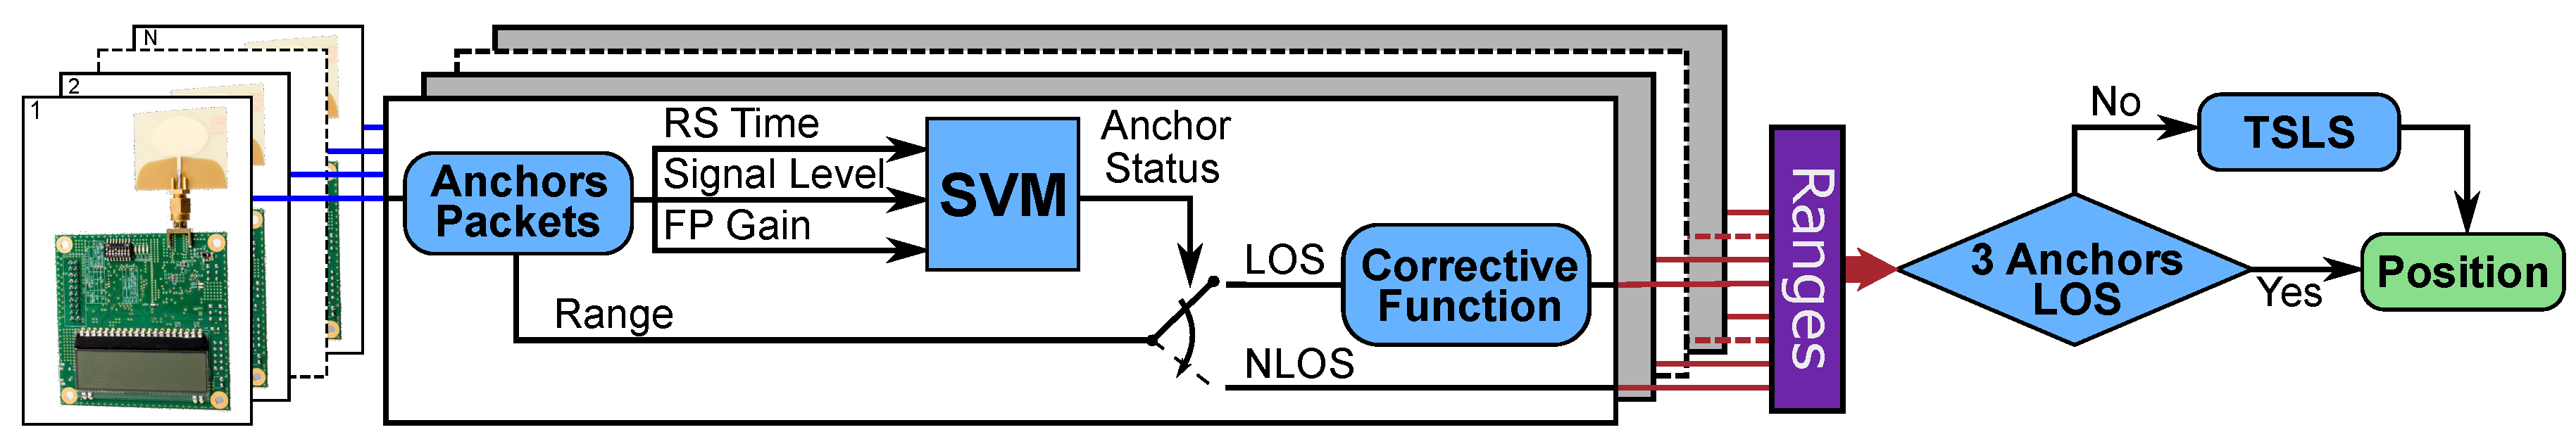
3.2.3. Location Tracking Algorithm
4. Experimental Procedures
4.1. WSN Alarm Notification Transmission
4.2. Position Tracking Experiments
- 1D static measurements in LOS conditions, to analyze the ability of the system to estimate the distance between individual anchor units and the radio tag;
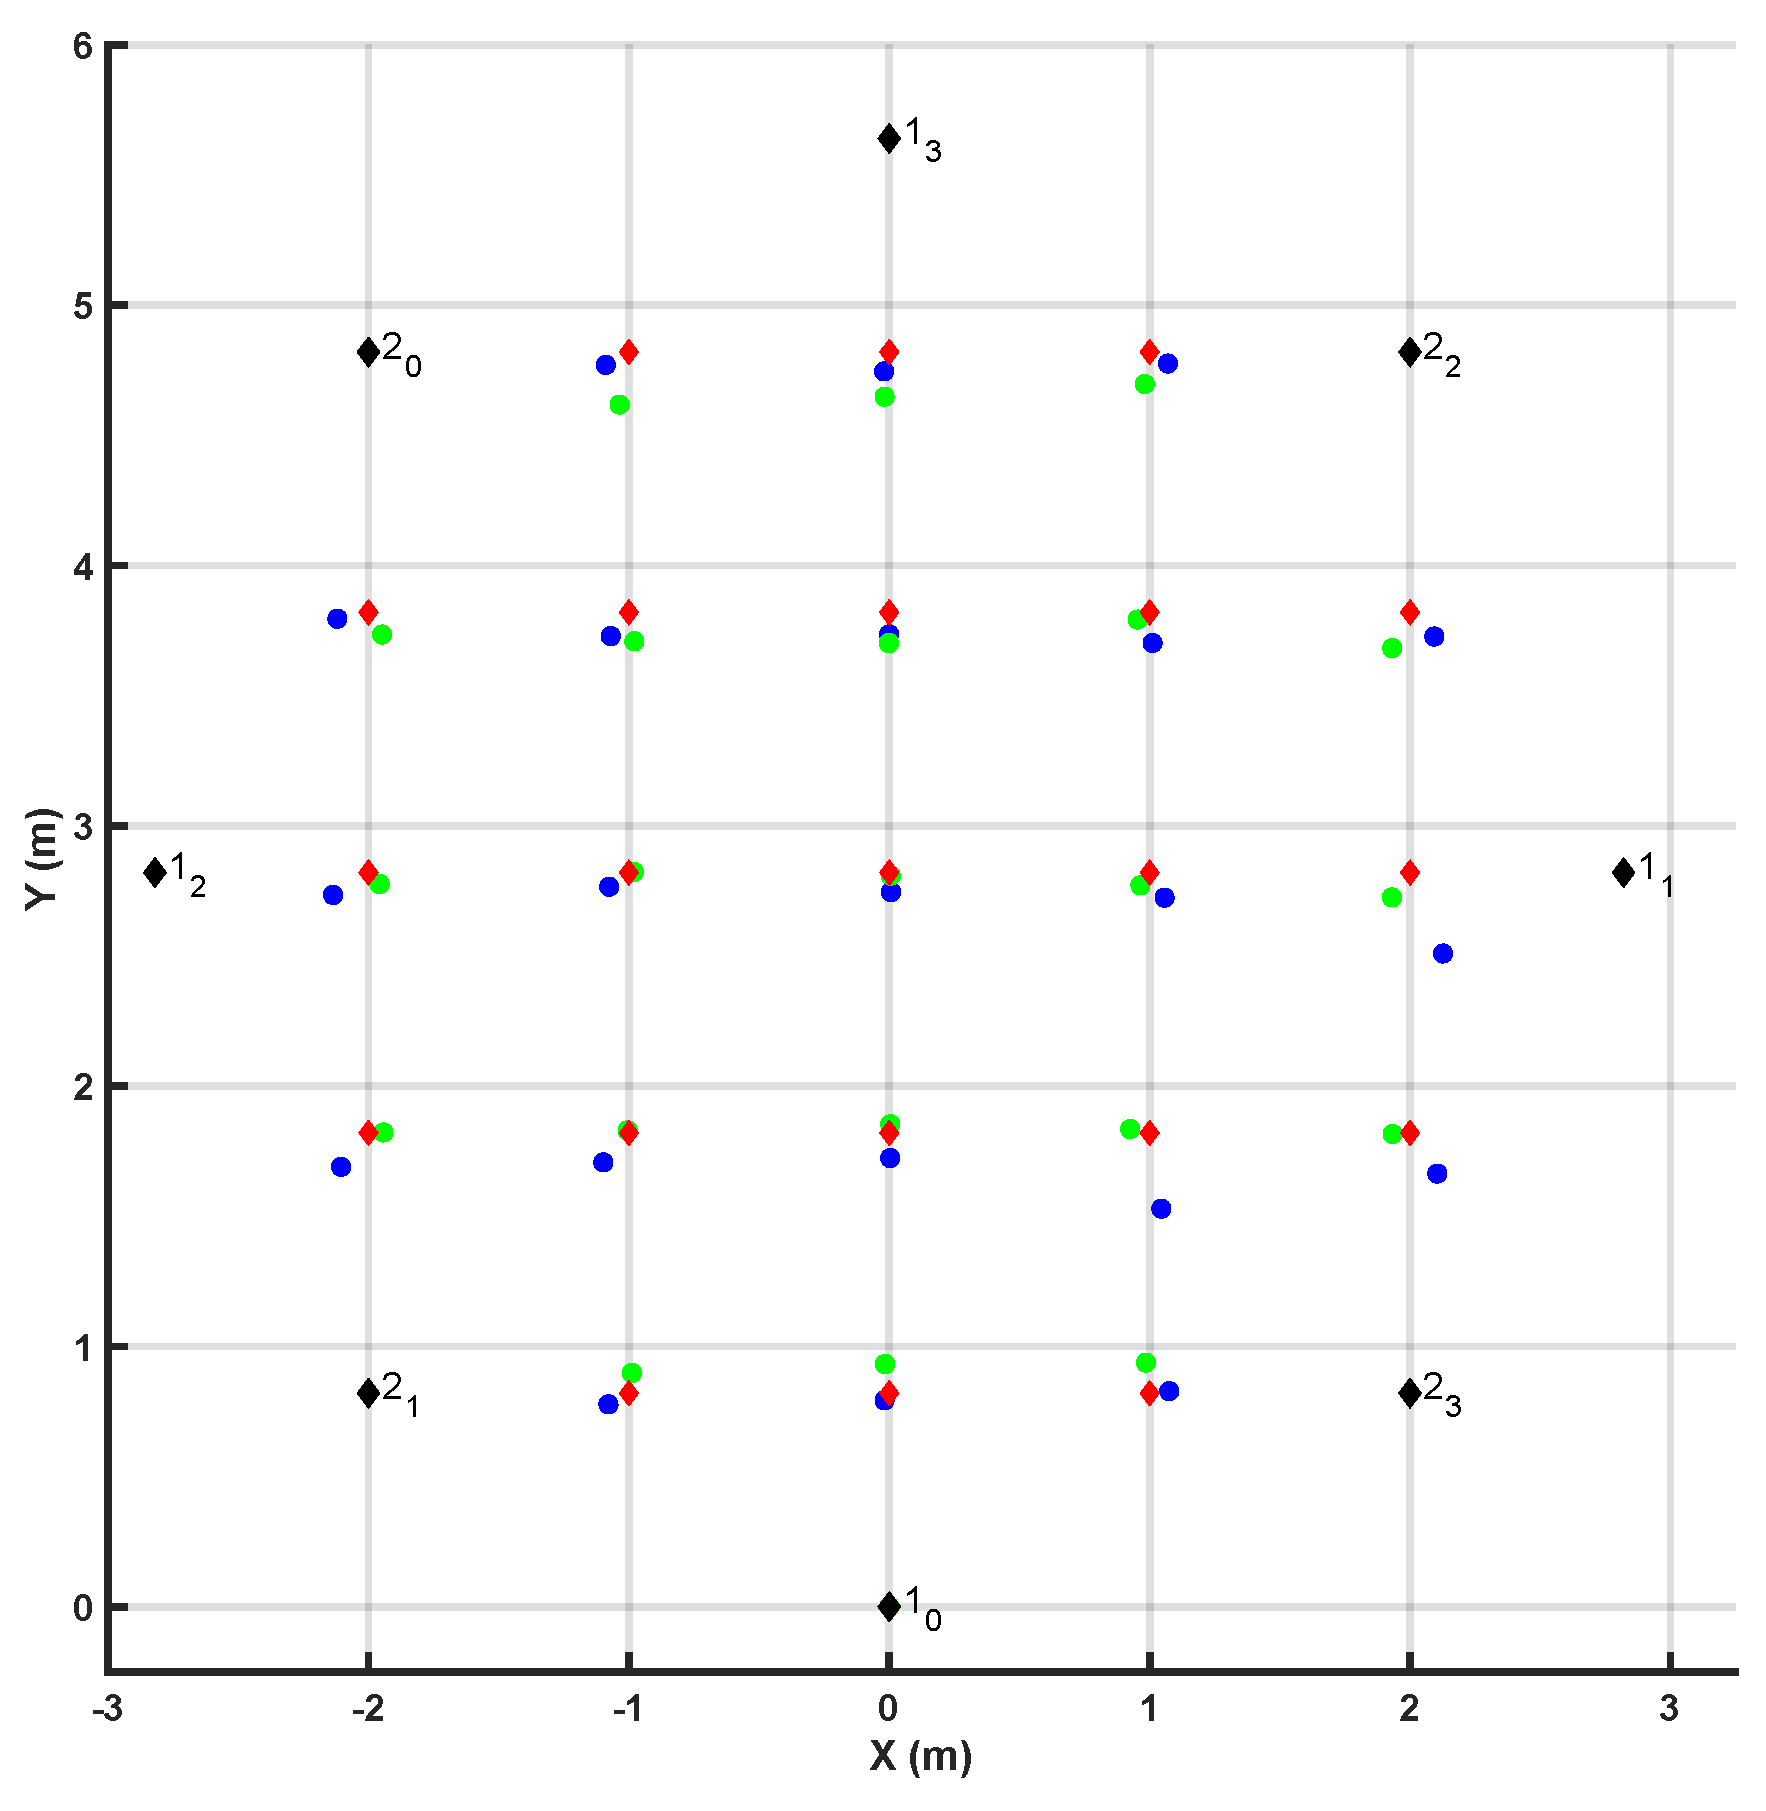
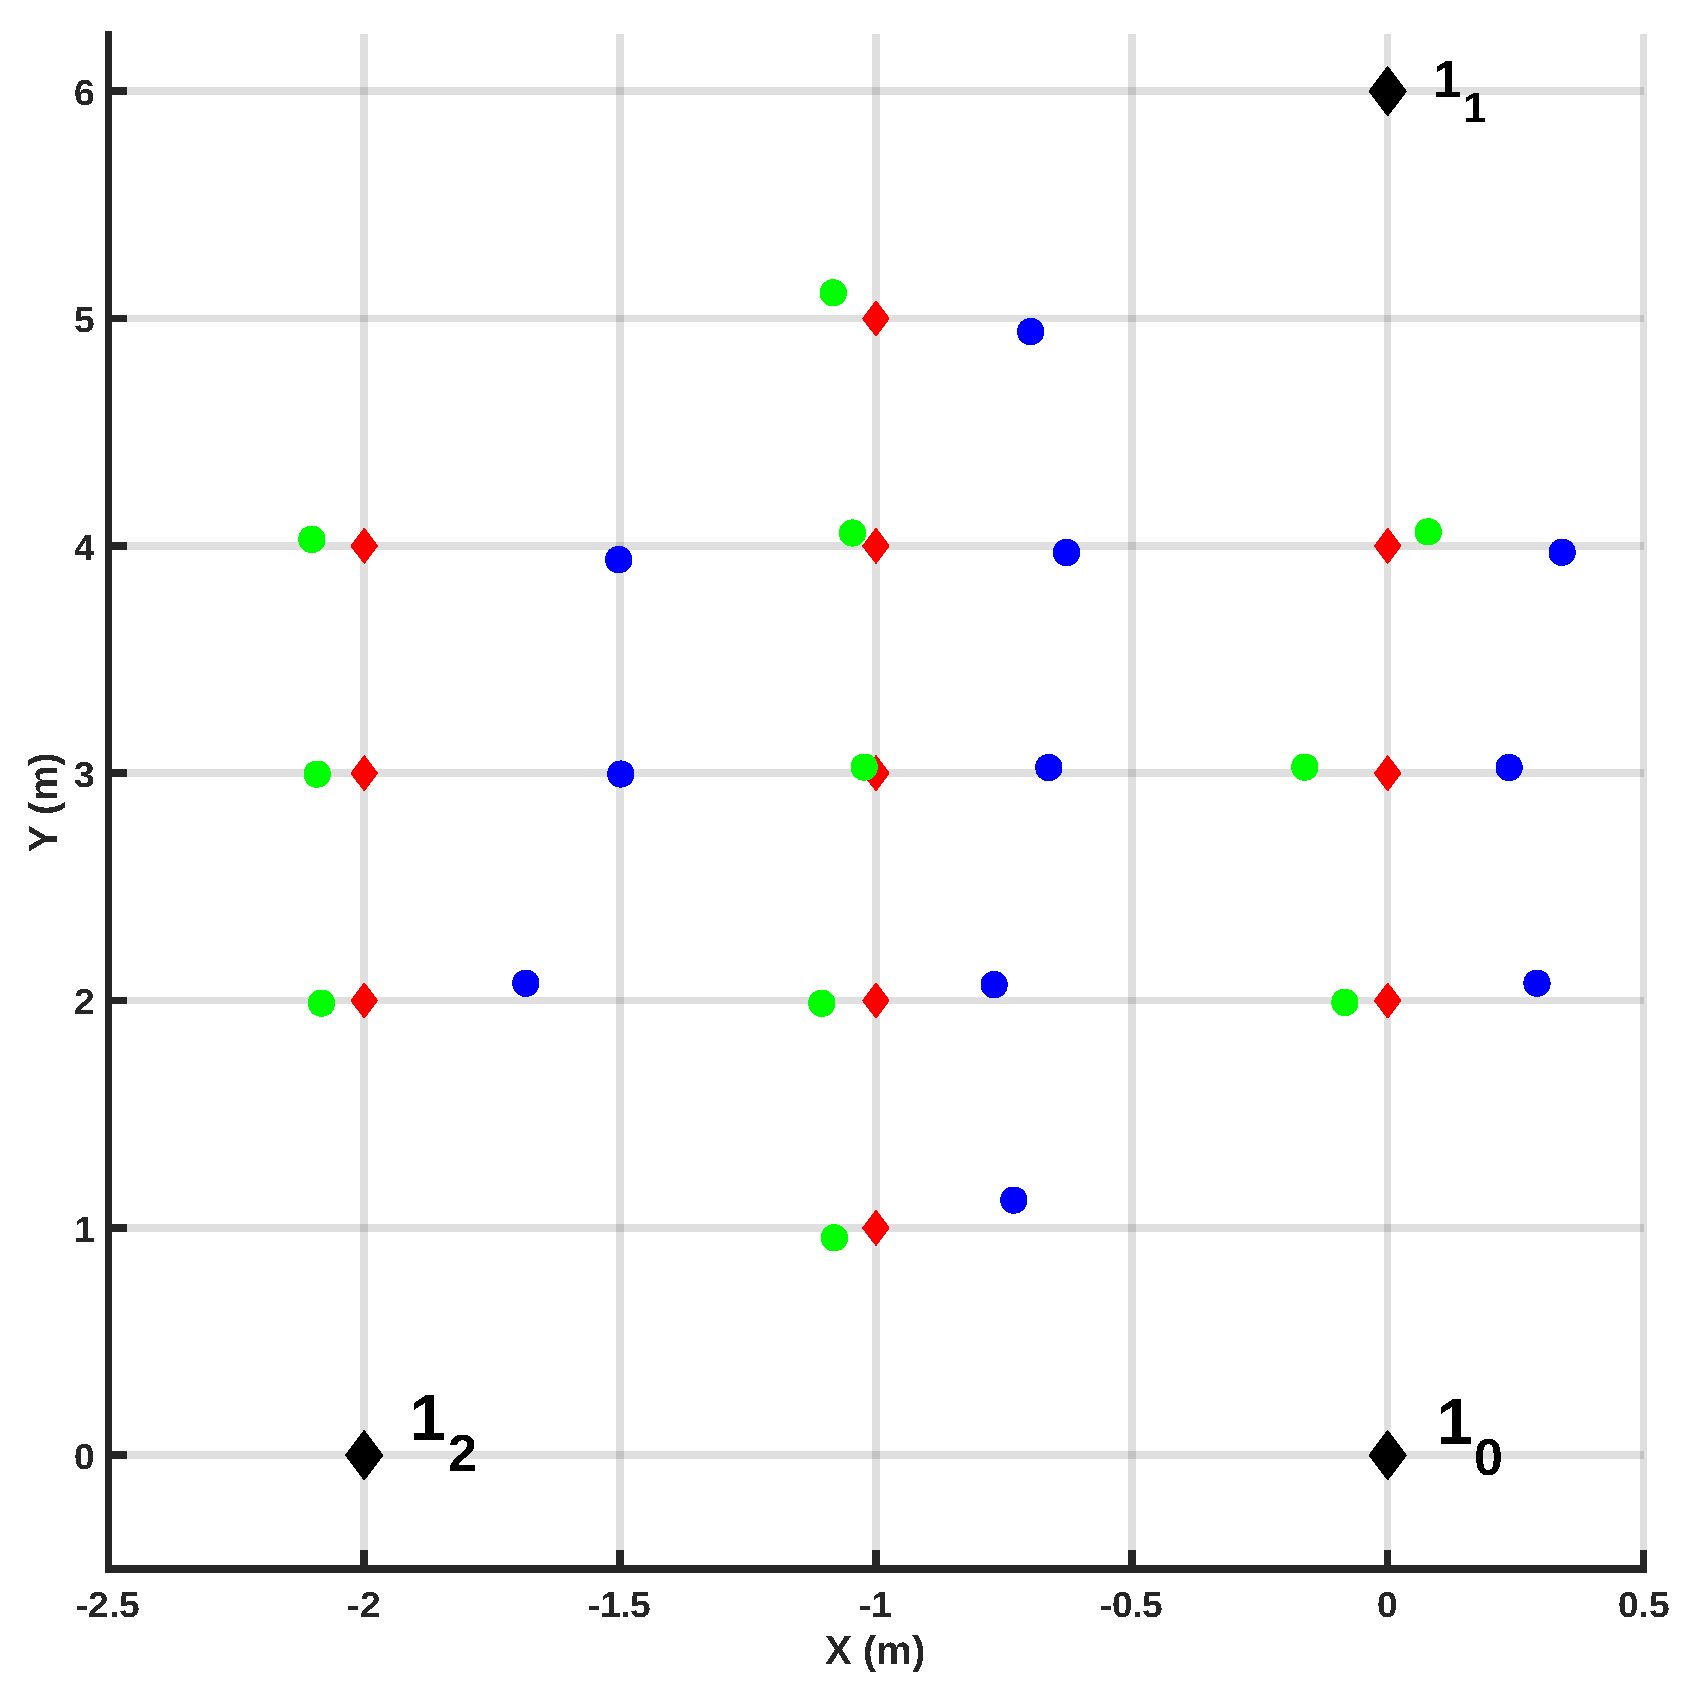
- 2D static measurements in LOS conditions, to analyze the performance of the system in estimating the radio tag’s coordinates;
- 2D static measurements in NLOS conditions, to analyze the ability of our algorithm to compensate for the error introduced by obstacles obstructing the LOS;
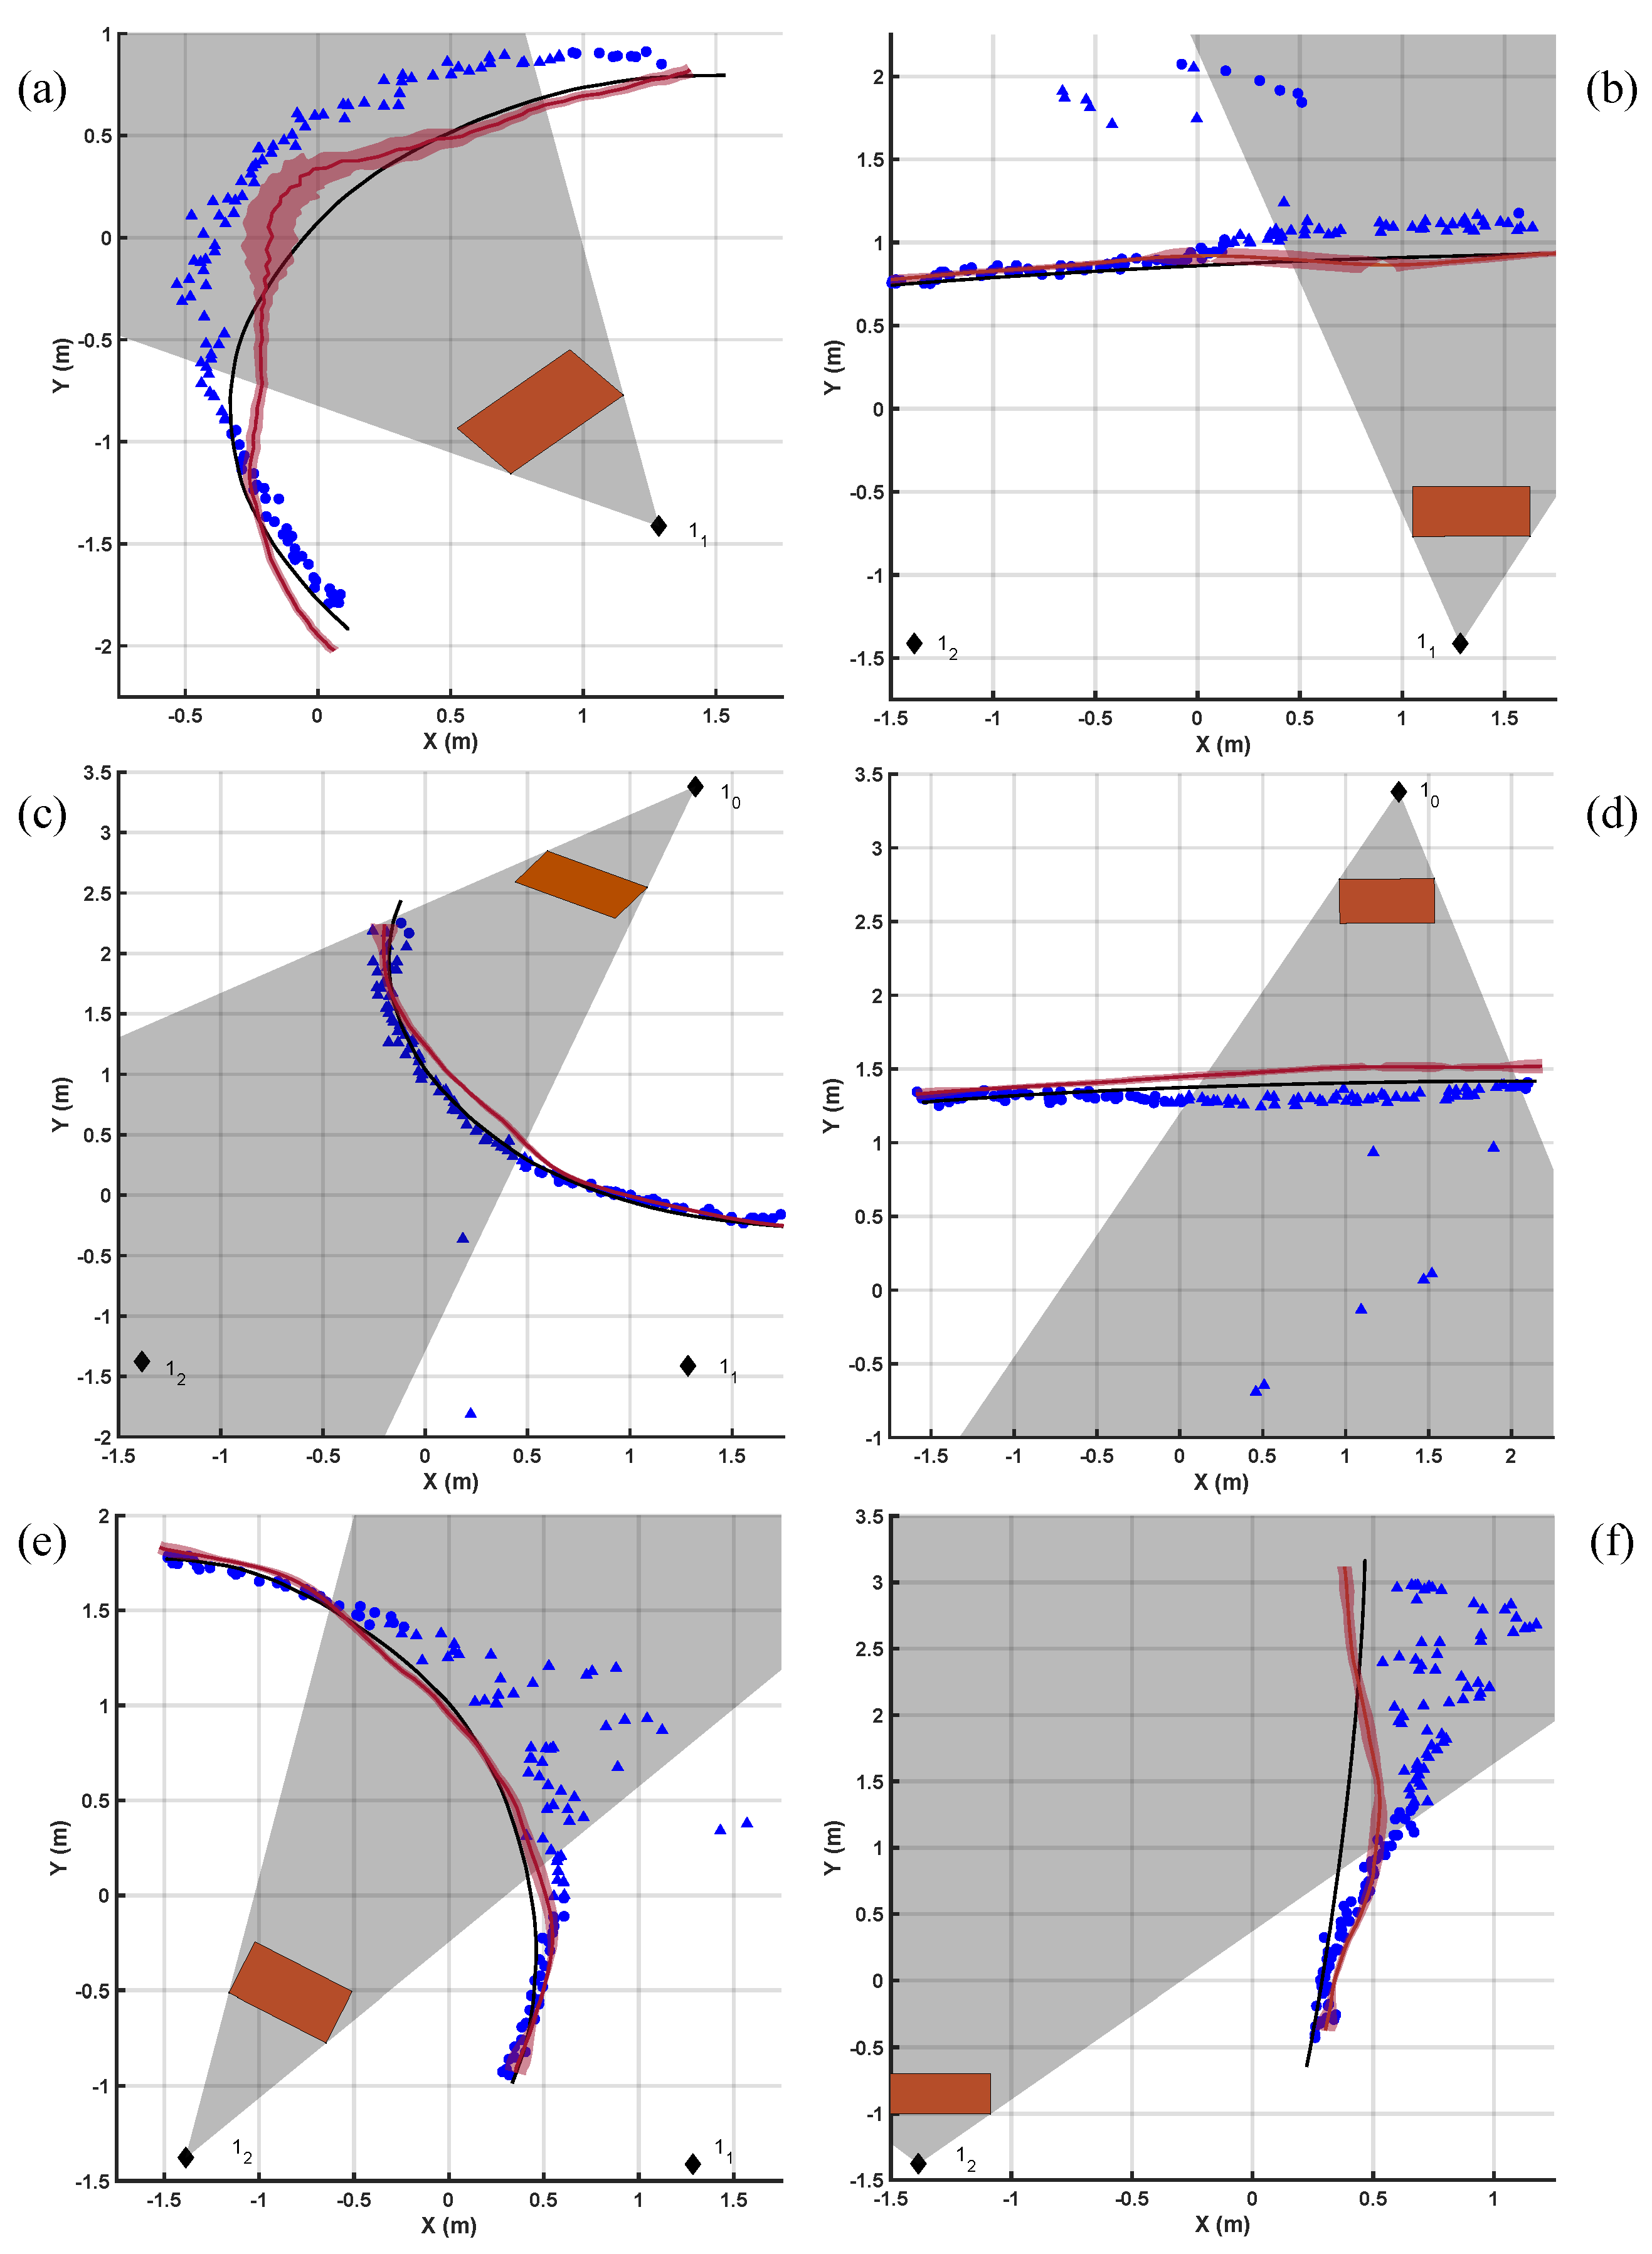
- 2D dynamic measurements in NLOS conditions, to simulate the conditions in which we would anticipate that the home robot would operate in a real-life deployment.
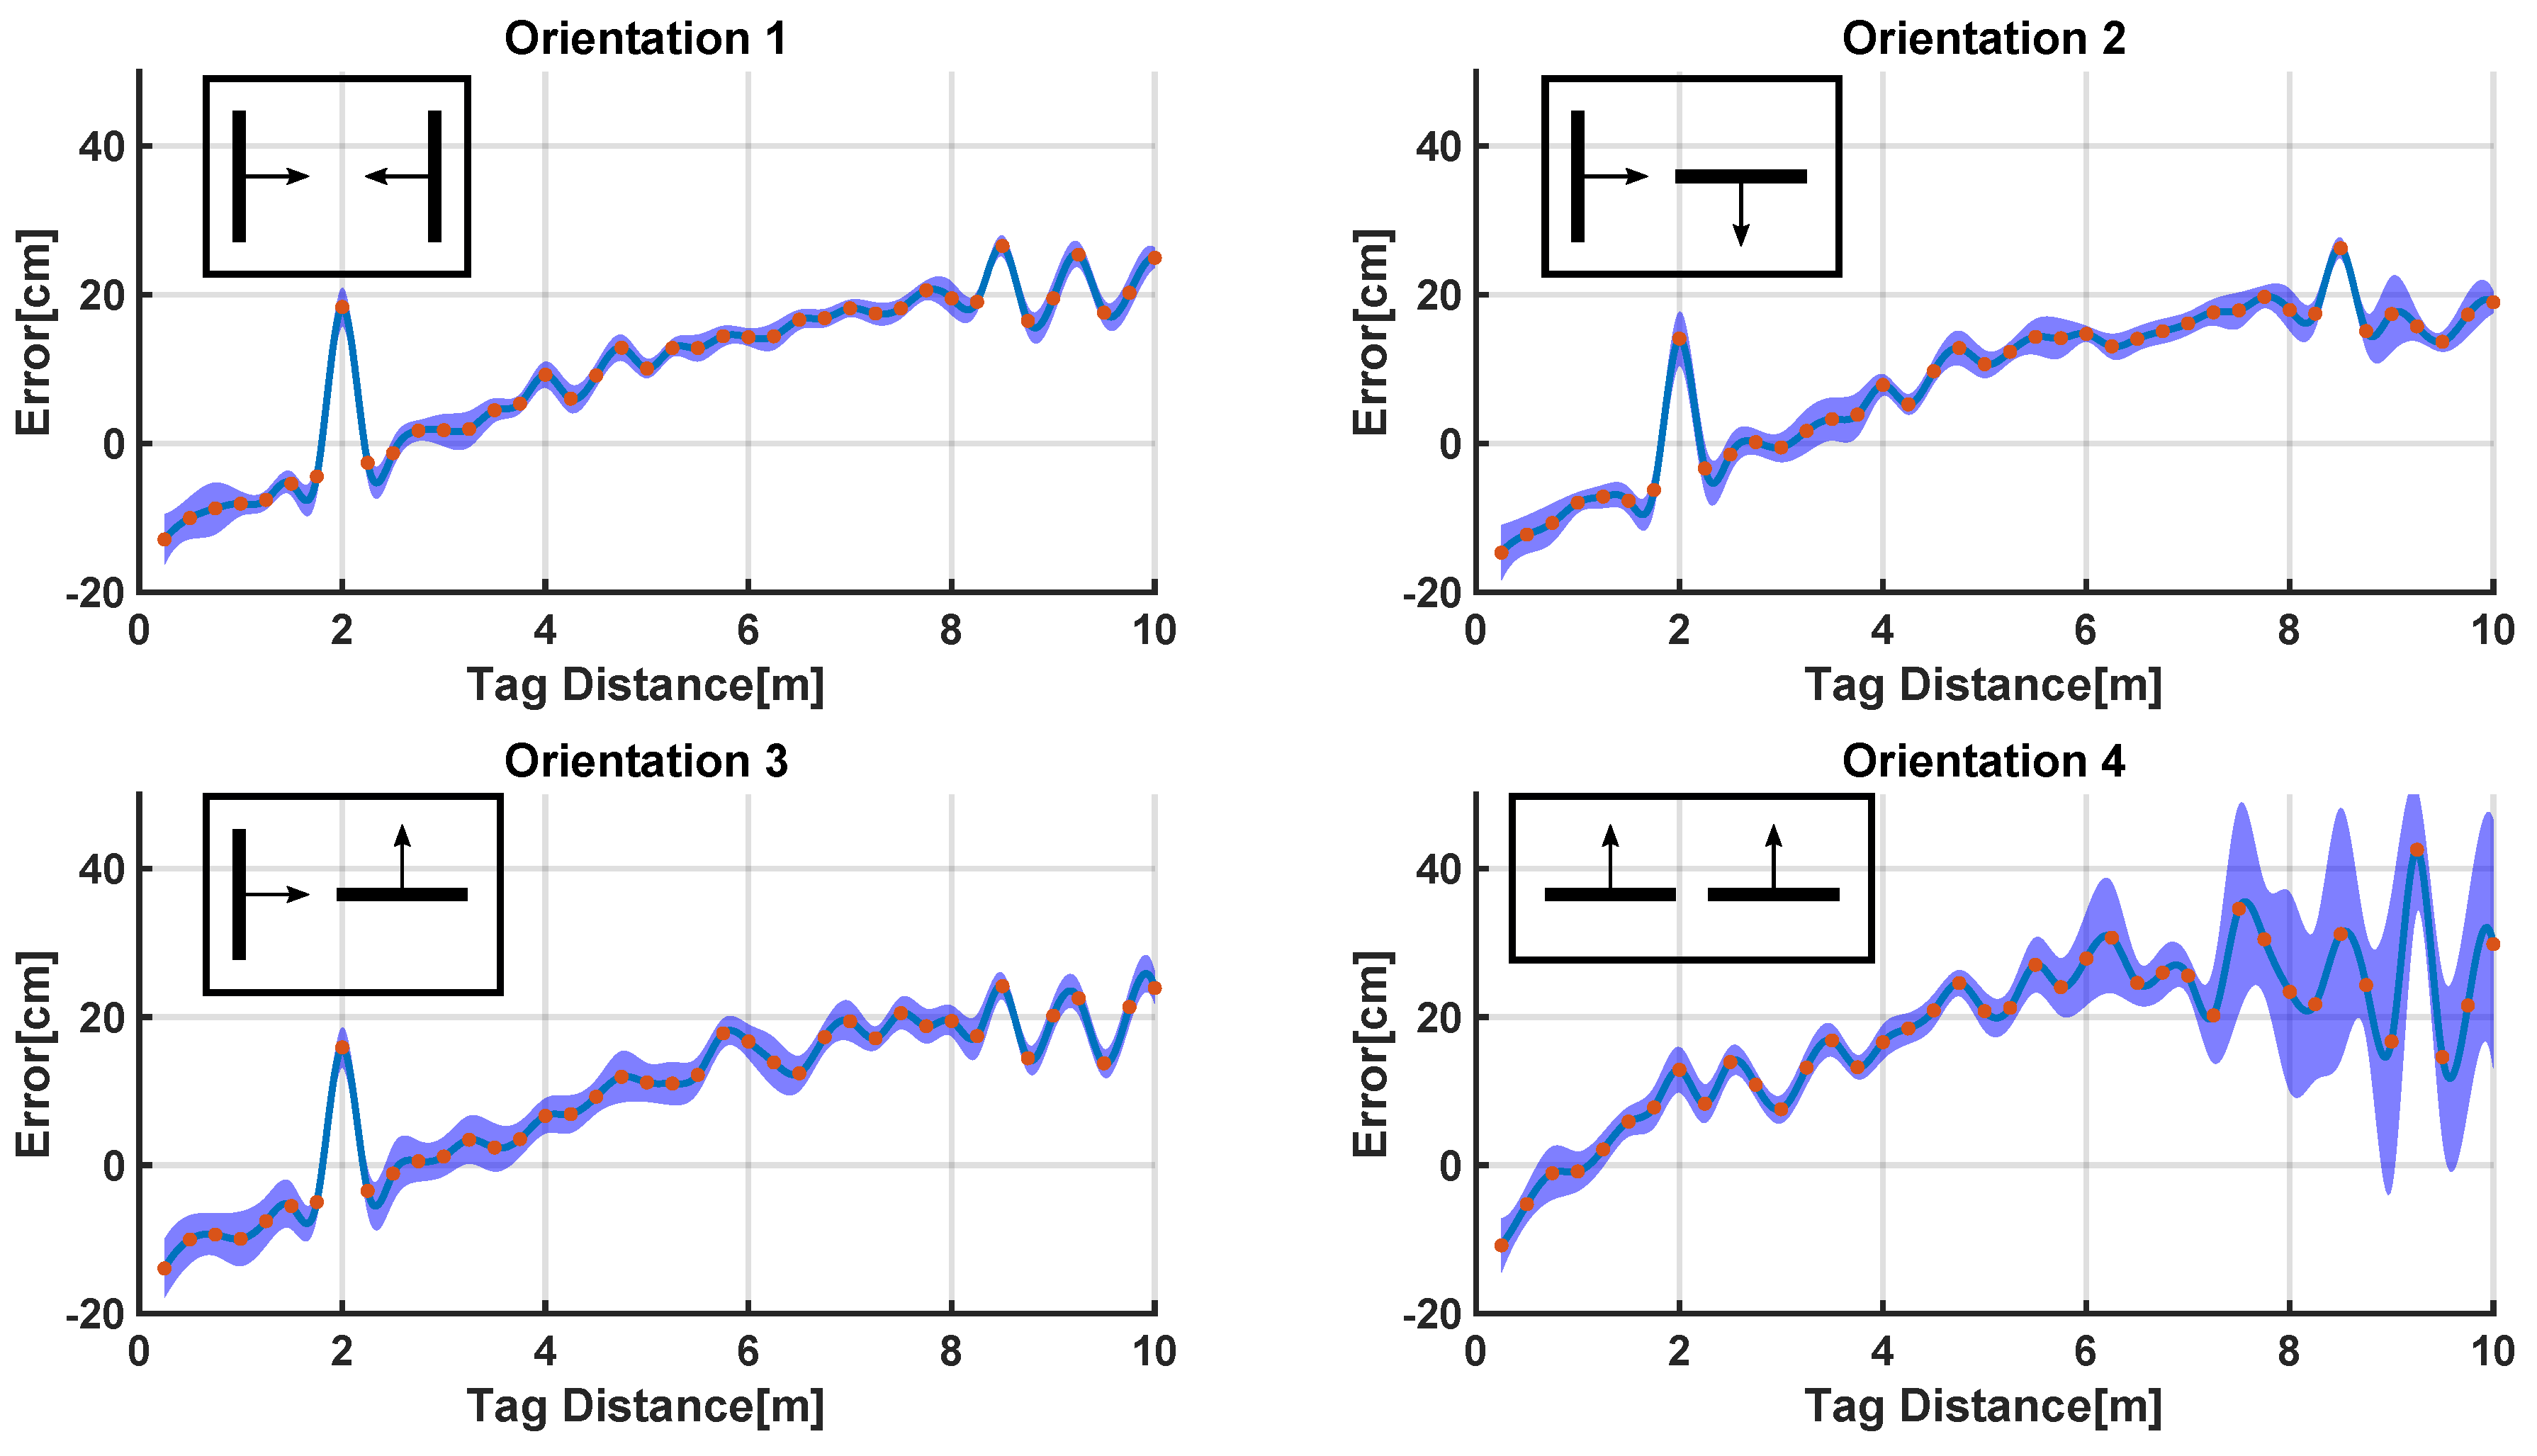
4.2.1. 1D Static Measurements in LOS Conditions
4.2.2. 2D Static Measurements in LOS Conditions
4.2.3. 2D Static Measurements in NLOS Conditions
4.2.4. 2D Dynamic Measurements in NLOS Conditions
5. Results
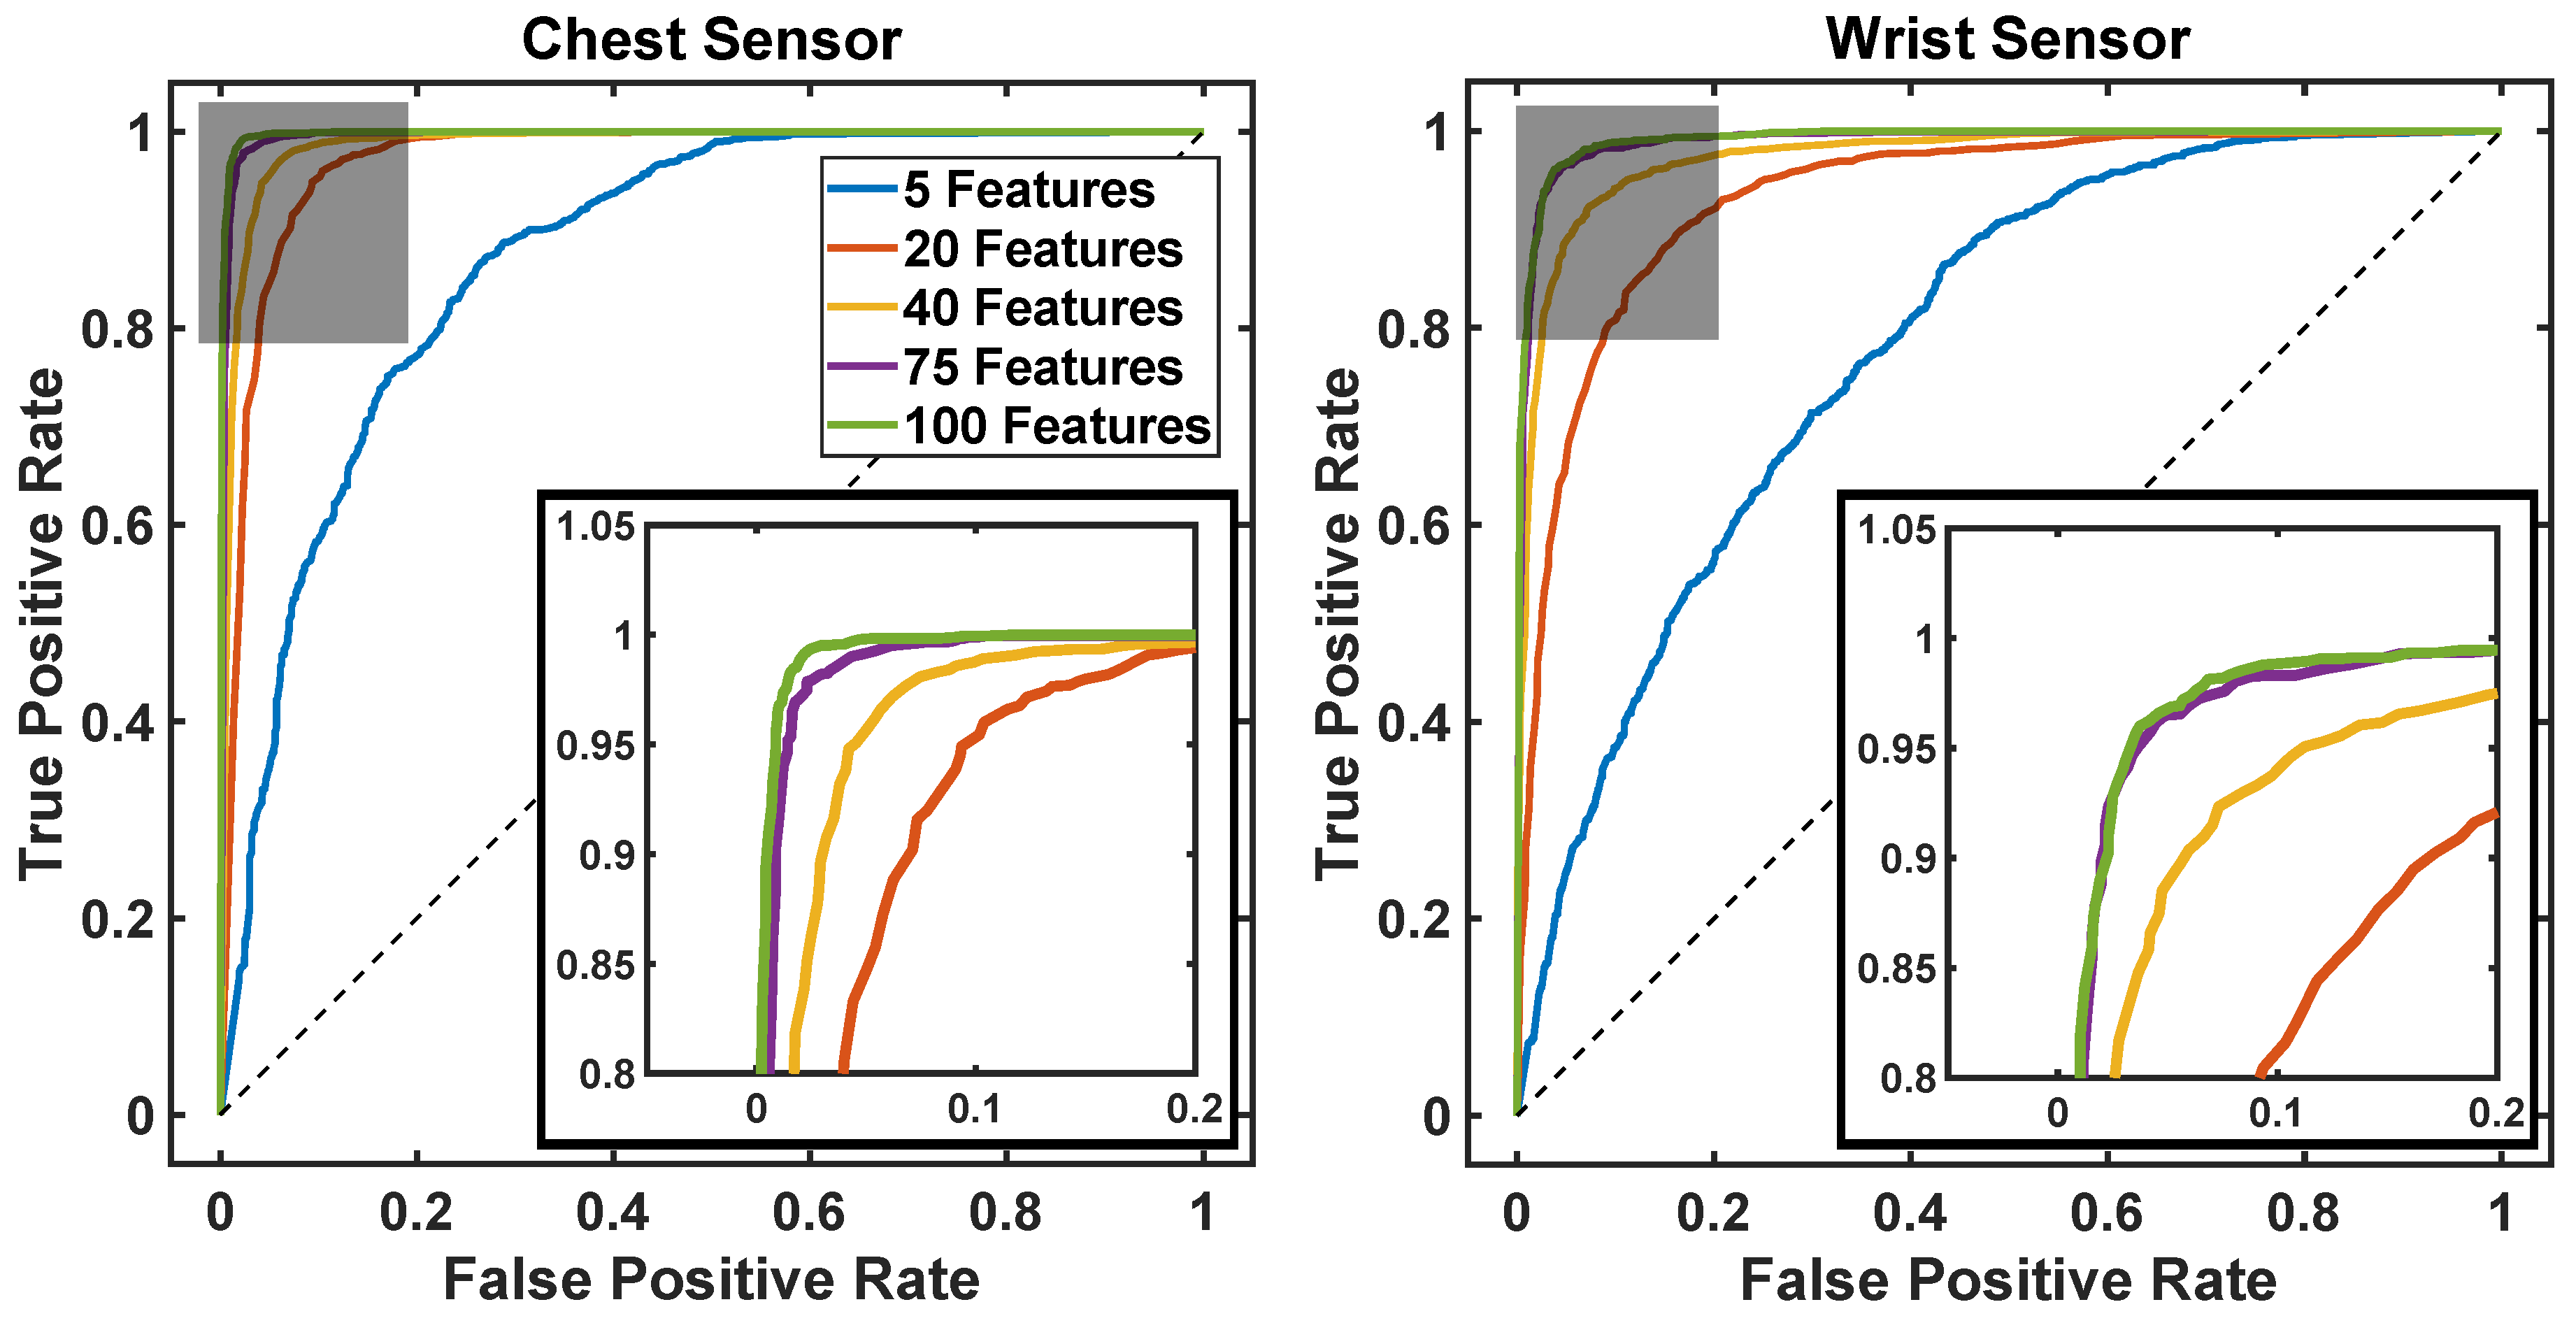
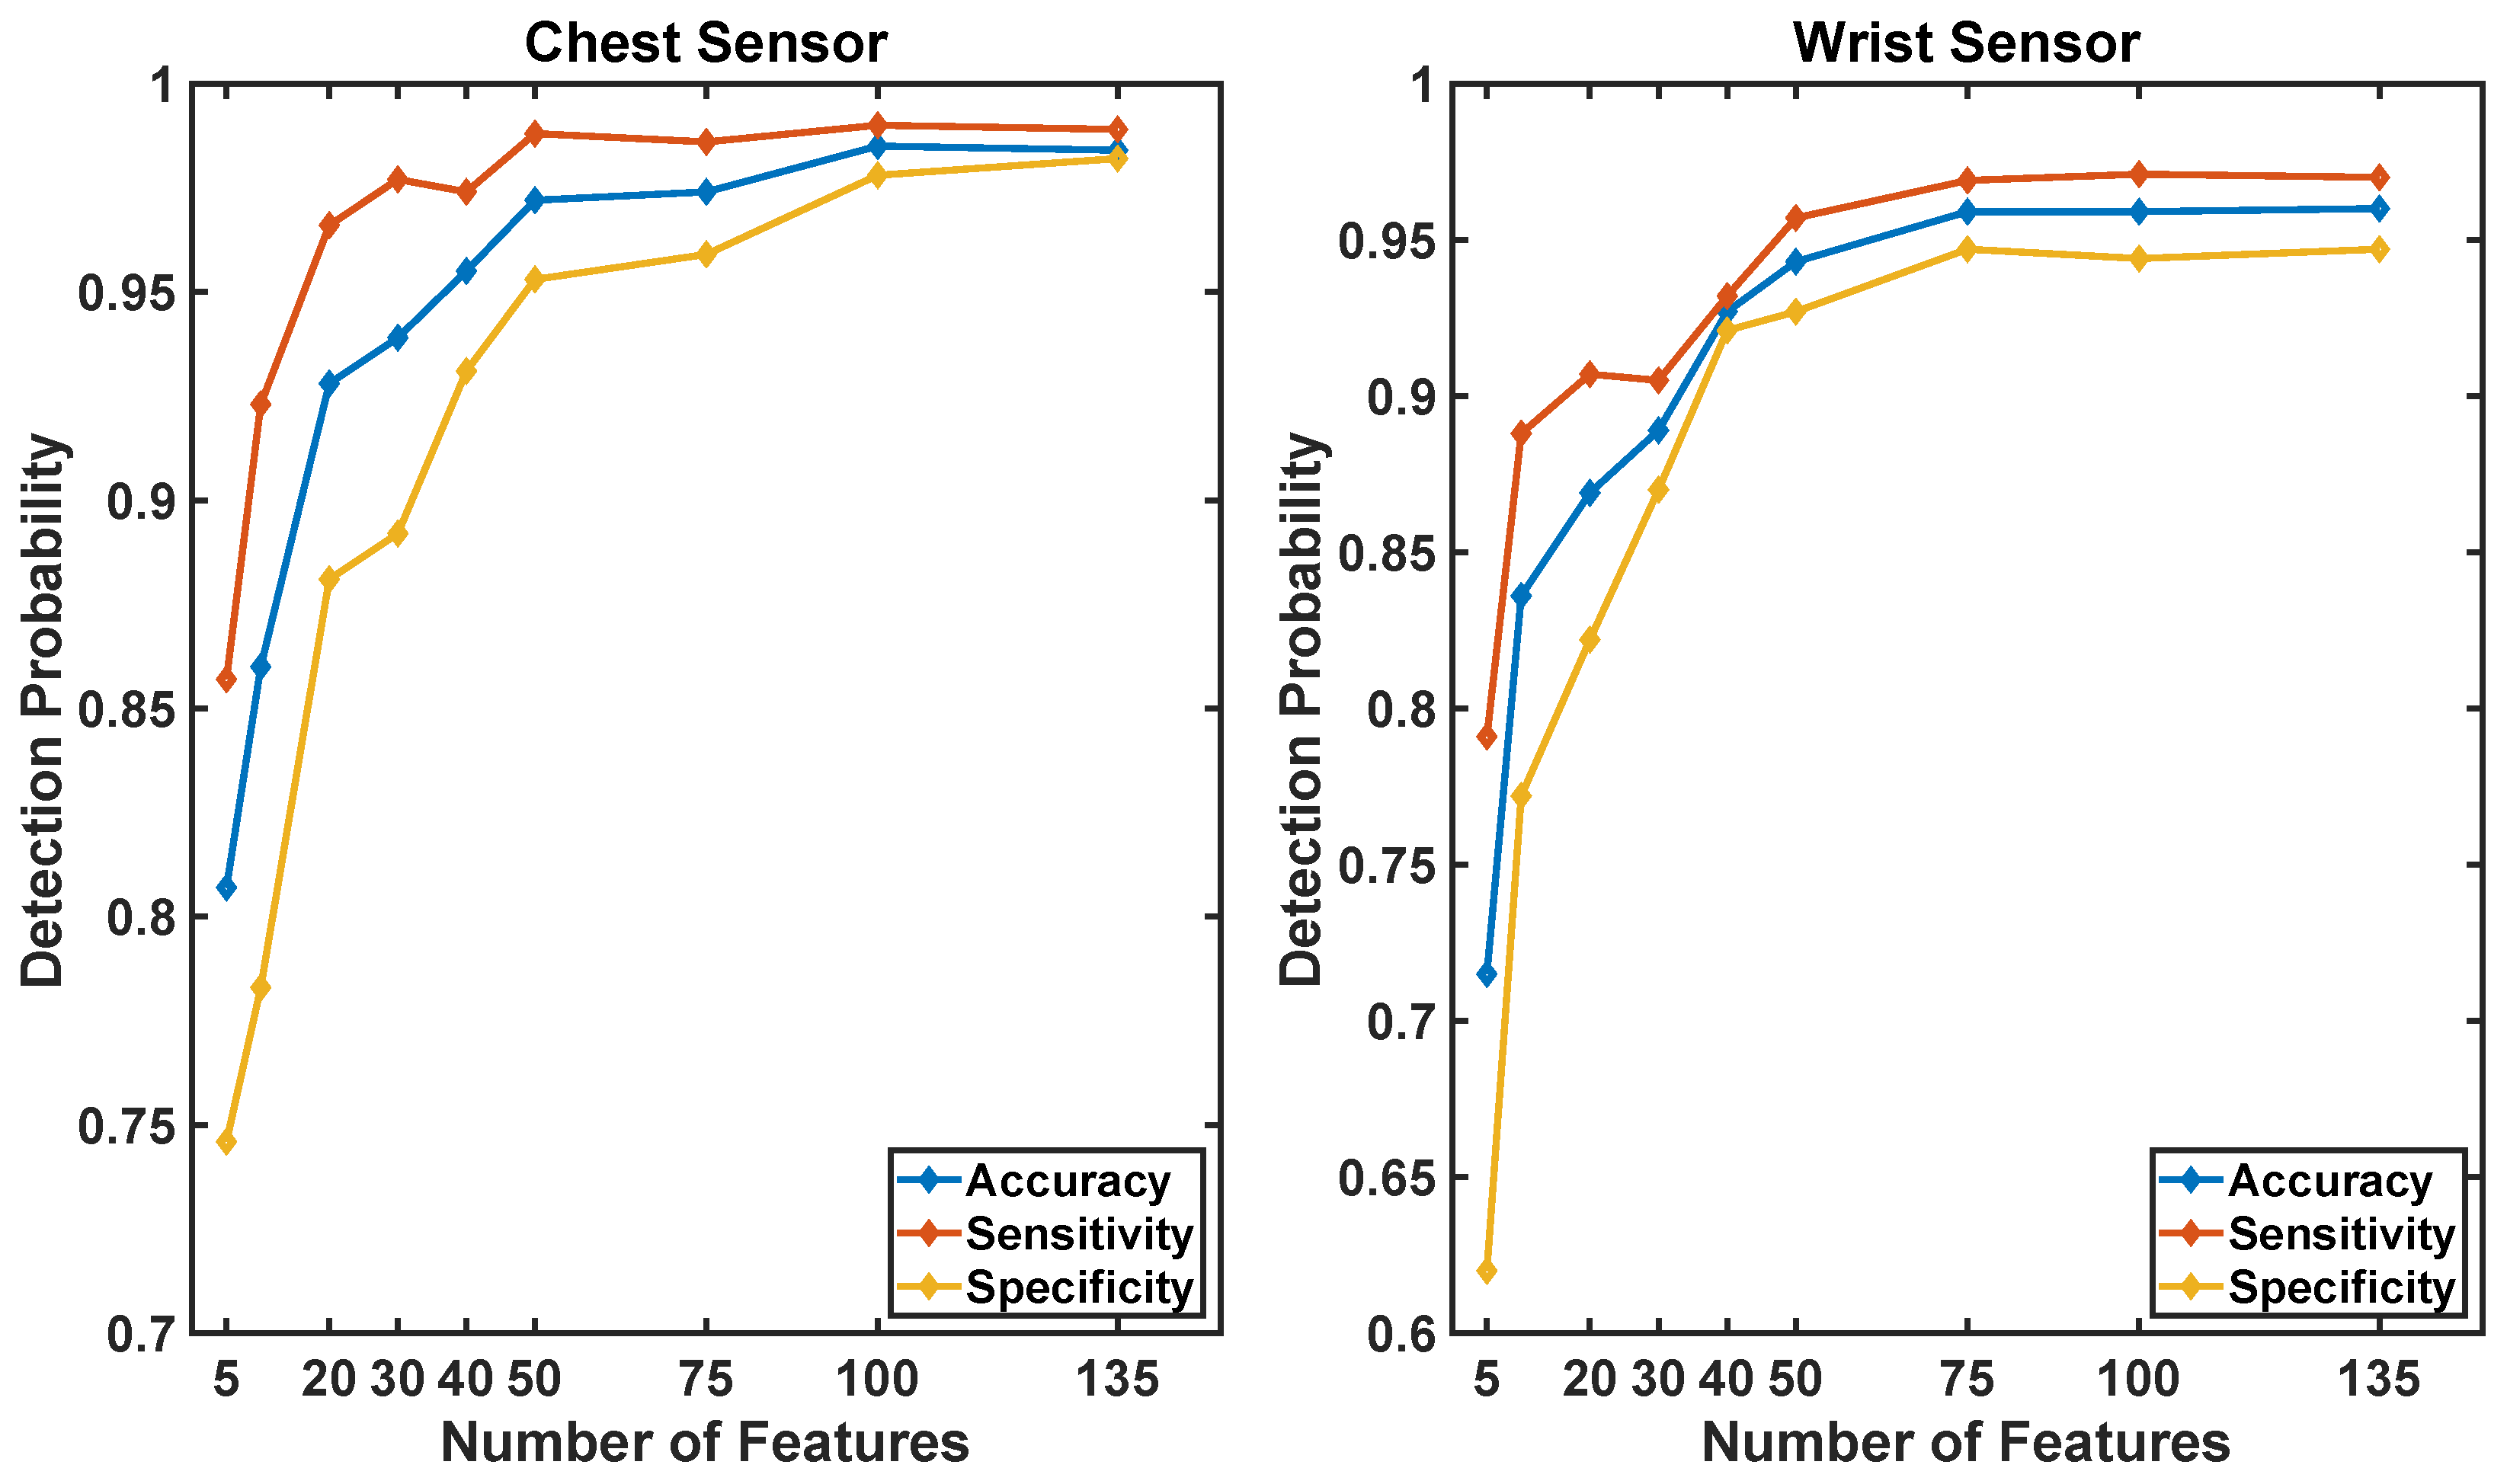
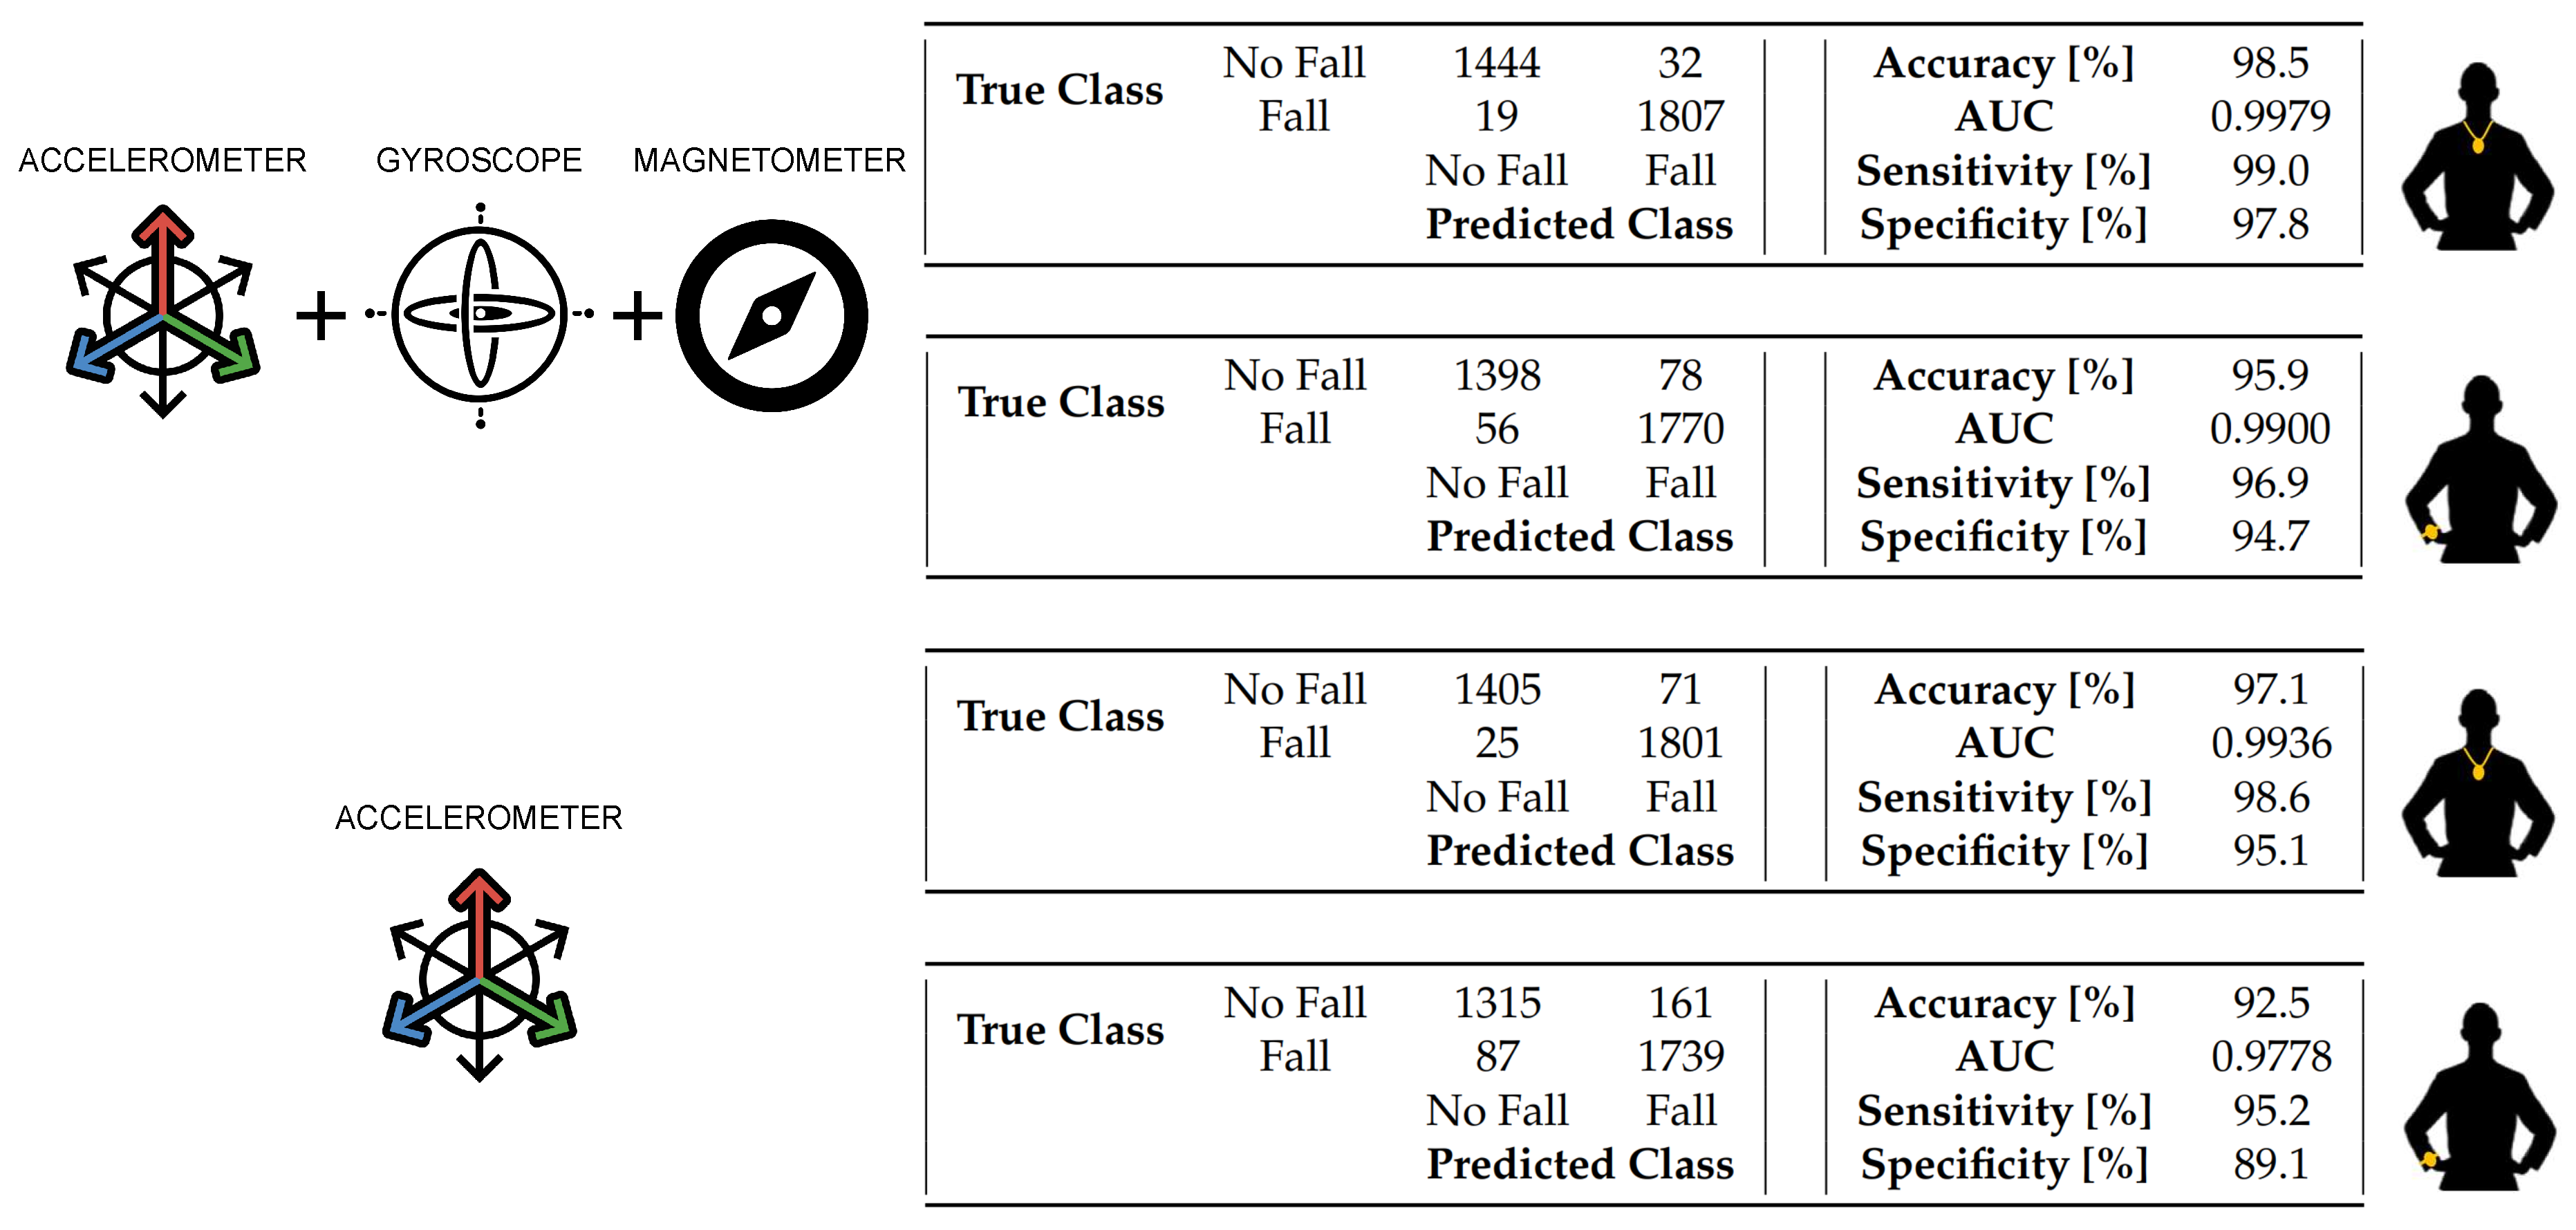
5.1. Fall Detection Algorithm
5.2. WSN Performance
5.3. Position Tracking
5.3.1. 1D Static Measurements in LOS Conditions
5.3.2. 2D Static Measurements in LOS Conditions
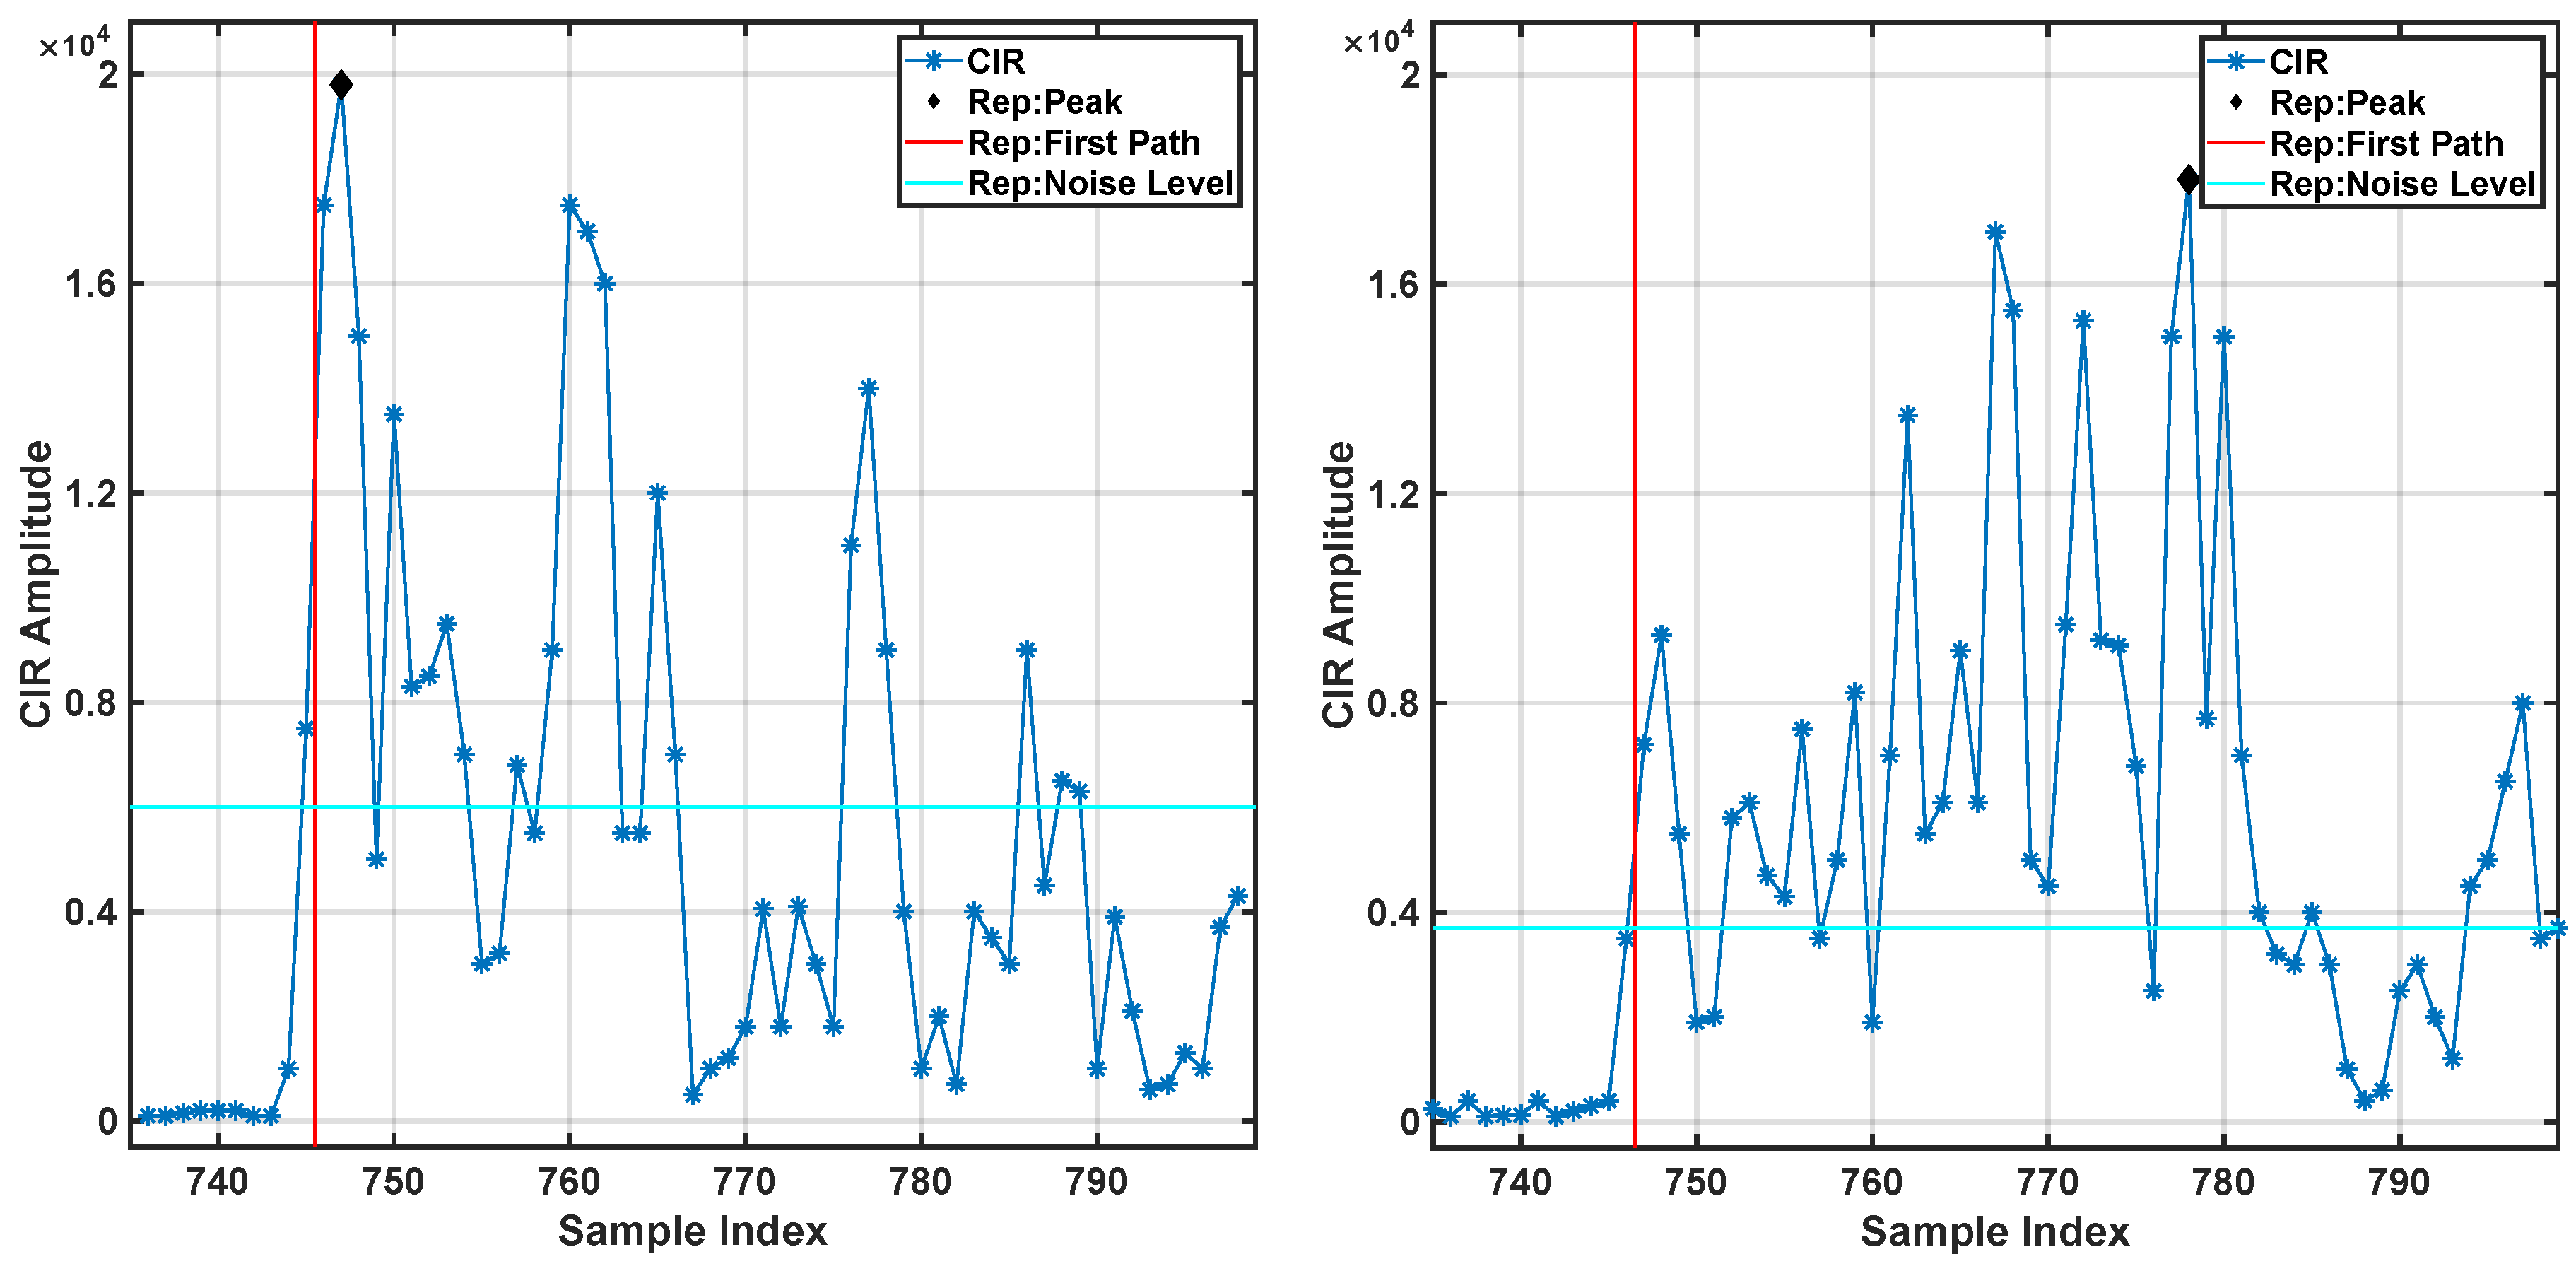
5.3.3. 2D Static Measurements in NLOS Conditions—NLOS Detection
5.3.4. 2D Static Measurements in NLOS Conditions and NLOS Mitigation
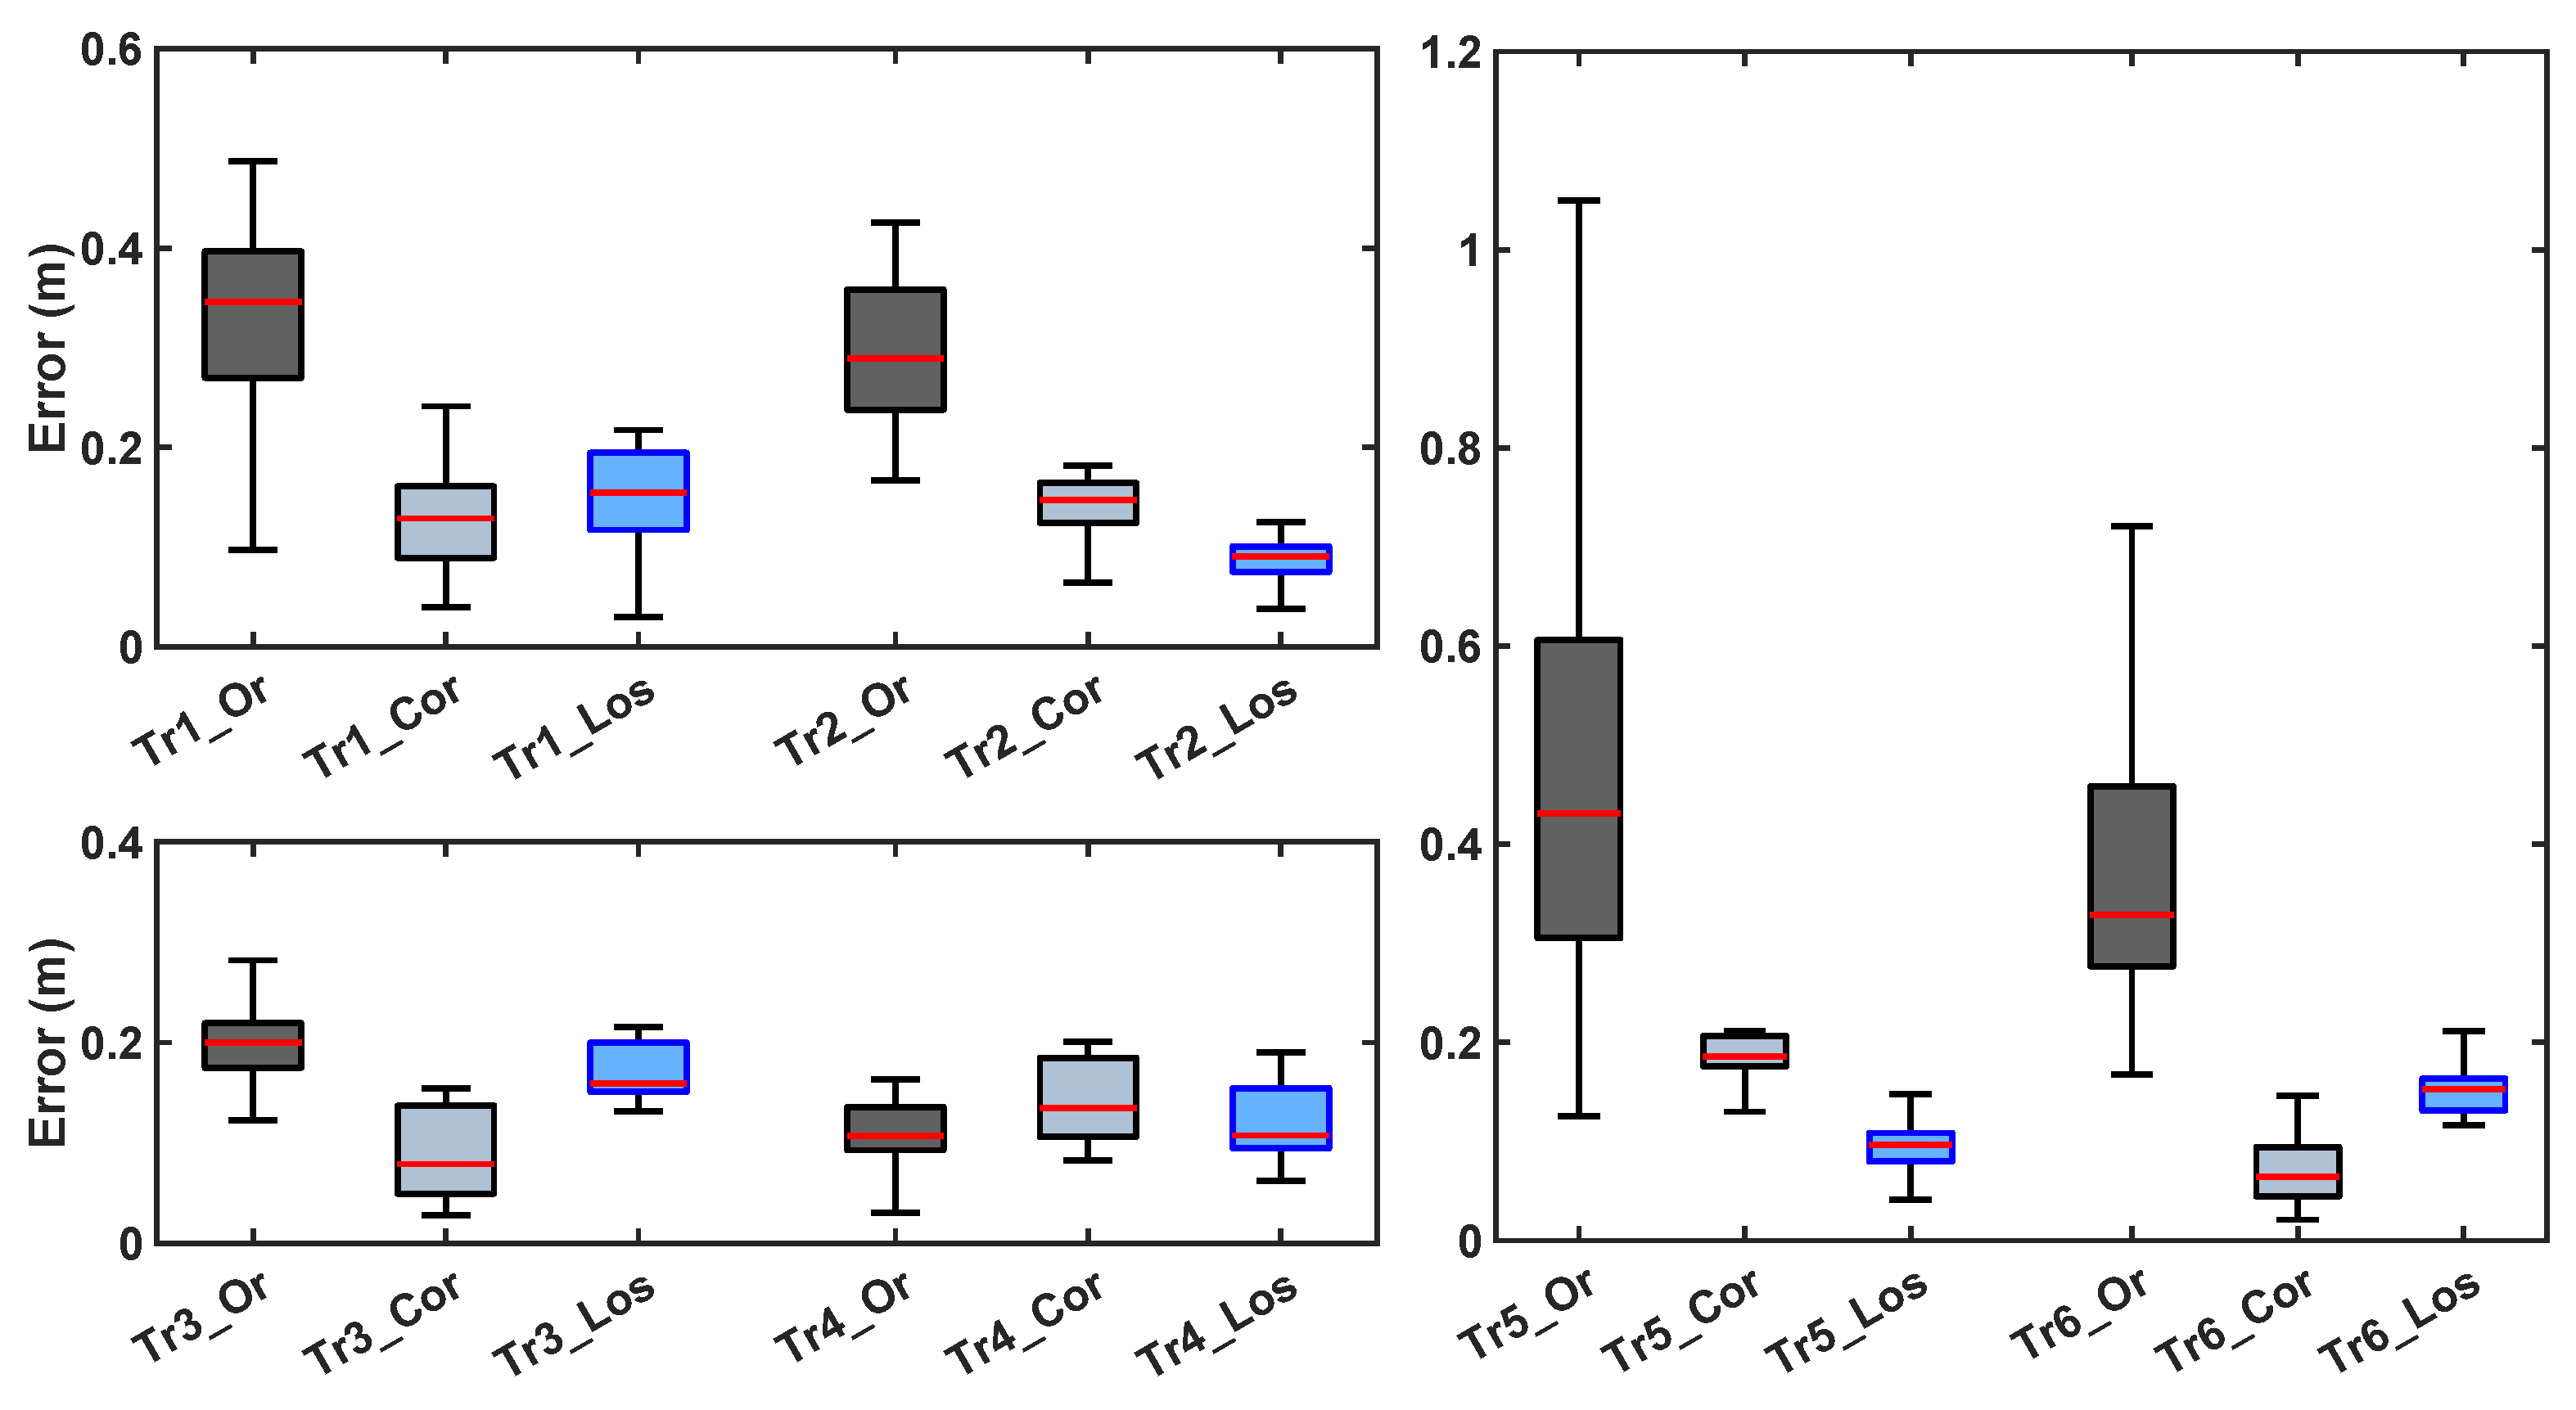
5.3.5. 2D Dynamic Measurements in NLOS Conditions
6. Discussion and Conclusions
Supplementary Materials
Author Contributions
Funding
Acknowledgments
Conflicts of Interest
References
- Nari, M.; Suprapto, S.; Kusumah, I.; Adiprawita, W. A simple design of wearable device for fall detection with accelerometer and gyroscope. In Proceedings of the 2016 International Symposium on Electronics and Smart Devices (ISESD), Bandung, Indonesia, 29–30 November 2016; pp. 88–91. [Google Scholar] [CrossRef]
- TruSense. Available online: https://www.mytrusense.com/ (accessed on 7 August 2020).
- GoLiveClip. Available online: https://www.goliveclip.eu/ (accessed on 7 August 2020).
- Telepresence Robot. Available online: https://telepresencerobots.com/ (accessed on 7 August 2020).
- Luzovo. Available online: https://www.luvozo.com/ (accessed on 7 August 2020).
- Bagalà, F.; Becker, C.; Cappello, A.; Chiari, L.; Aminian, K.; Hausdorff, J.M.; Zijlstra, W.; Klenk, J. Evaluation of Accelerometer-Based Fall Detection Algorithms on Real-World Falls. Available online: https://doi.org/10.1371/journal.pone.0037062. (accessed on 18 September 2020).
- Bonizzoni, E.; Puiatti, A.; Sapienza, S.; Ros, P.M.; Demarchi, D.; Bonato, P. UWB Tracking for Home Care Systems with Off-the-Shelf Components. In Proceedings of the 2018 IEEE International Symposium on Circuits and Systems (ISCAS), Florence, Italy, 27–30 May 2018; pp. 1–5. [Google Scholar]
- Yavari, M.; Nickerson, B.G. Ultra Wideband Wireless Positioning Systems; Technical Report; University of New Brunswick: Fredericton, NB, Canada, 2014. [Google Scholar]
- Chaaraoui, A.; Padilla-López, J.; Ferrandez, J.; Nieto-Hidalgo, M.; Flórez-Revuelta, F. A Vision-Based System for Intelligent Monitoring: Human Behaviour Analysis and Privacy by Context. Sensors 2014, 14, 8895–8925. [Google Scholar] [CrossRef] [PubMed]
- Lu, K.L.; Chu, E.T.H. An Image-Based Fall Detection System for the Elderly. Appl. Sci. 2018, 8, 1995. [Google Scholar] [CrossRef]
- De Miguel, K.; Brunete, A.; Hernando, M.; Gambao, E. Home Camera-Based Fall Detection System for the Elderly. Sensors 2017, 17, 2864. [Google Scholar] [CrossRef] [PubMed]
- Williams, A.; Ganesan, D.; Hanson, A. Aging in Place: Fall Detection and Localization in a Distributed Smart Camera Network. In Proceedings of the 15th ACM International Conference on Multimedia; Association for Computing Machinery (MM ’07), New York, NY, USA, 24–29 September 2007; pp. 892–901. [Google Scholar] [CrossRef]
- Iliev, I.; Tabakov, S.; Dotsinsky, I. Two Steps Approach for Falls Detection in the Elderly. Annu. J. Electron. 2011, 5, 46–48. [Google Scholar]
- Kianoush, S.; Savazzi, S.; Vicentini, F.; Rampa, V.; Giussani, M. Device-Free RF Human Body Fall Detection and Localization in Industrial Workplaces. IEEE Internet Things J. 2016, 4, 351–362. [Google Scholar] [CrossRef]
- Ma, L.; Liu, M.; Wang, N.; Wang, L.; Yang, Y.; Wang, H. Room-Level Fall Detection Based on Ultra-Wideband (UWB) Monostatic Radar and Convolutional Long Short-Term Memory (LSTM). Sensors 2020, 20, 1105. [Google Scholar] [CrossRef] [PubMed]
- Vecchio, A.; Cola, G. Fall detection using ultra-wideband positioning. In Proceedings of the 2016 IEEE SENSORS, Orlando, FL, USA, 30 October–3 November 2016; pp. 1–3. [Google Scholar]
- Khawaja, W.; Koohifar, F.; Guvenc, I. UWB radar based beyond wall sensing and tracking for ambient assisted living. In Proceedings of the 2017 14th IEEE Annual Consumer Communications Networking Conference (CCNC), Las Vegas, NV, USA, 8–11 January 2017; pp. 142–147. [Google Scholar]
- Kolakowski, J.; Djaja-Josko, V.; Kolakowski, M. UWB monitoring system for AAL applications. Sensors 2017, 17, 2092. [Google Scholar] [CrossRef] [PubMed]
- Gharghan, S.; Mohammed, S.; Al-Naji, A.A. Accurate Fall Detection and Localization for Elderly People Based on Neural Network and Energy-Efficient Wireless Sensor Network. Energies 2018, 11, 2866. [Google Scholar] [CrossRef]
- Fung, N.M.; Wong Sing Ann., J.; Tung, Y.H.; Seng Kheau, C.; Chekima, A. Elderly Fall Detection and Location Tracking System Using Heterogeneous Wireless Networks. In Proceedings of the 2019 IEEE 9th Symposium on Computer Applications Industrial Electronics (ISCAIE), Sabah, Malaysia, 27–28 April 2019; pp. 44–49. [Google Scholar]
- Mynotify. Available online: https://www.mynotifi.com/ (accessed on 7 August 2020).
- Decawave. Source Code Guide, DecaRangeRTLS ARM Source Code, Understanding and Using the DecaRangeRTLS ARM Source Code, 2.2 ed.; Decawave: Dublin, Ireland, 2015. [Google Scholar]
- Decawave. TREK1000 Quick Start Guide, Two Way Ranging(TWR) Evaluation Kit, 1.3 ed.; Decawave: Dublin, Ireland, 2016. [Google Scholar]
- Weiss, A.J.; Friedlander, B. Fading effects on antenna arrays in cellular communications. IEEE Trans. Signal Process. 1997, 45, 1109–1117. [Google Scholar] [CrossRef]
- Ghobadi, C.; Shepherd, P.R.; Pennock, S.R. The study of beyond line-of-sight indoor propagation channels and diversity techniques. In Proceedings of the IEE Colloquium on Propagation Characteristics and Related System Techniques for Beyond Line-of-Sight Radio (Ref. No. 1997/390), London, UK, 24 November 1997; pp. 7/1–7/6. [Google Scholar]
- Gentner, P.K.; Hilton, G.; Beach, M.A.; Mecklenbräuker, C.F. Near and farfield analysis of ultra wideband impulse radio beamforming in the time domain. In Proceedings of the 2010 IEEE International Conference on Ultra-Wideband, Nanjing, China, 20–23 September 2010; Volume 2, pp. 1–4. [Google Scholar]
- Sani, A.; Alomainy, A.; Santas, J.; Yang, H. Time domain characterisation of ultra wideband wearable antennas and radio propagation for body-centric wireless networks in healthcare applications. In Proceedings of the 2008 5th International Summer School and Symposium on Medical Devices and Biosensors, Hong Kong, China, 1–3 June 2008; pp. 129–132. [Google Scholar]
- Bunin, S.G. Data rate in impulse ultra wideband radio networks. In Proceedings of the 2010 5th International Confernce on Ultrawideband and Ultrashort Impulse Signals, Sevastopol, Ukraine, 6–10 September 2010; pp. 141–143. [Google Scholar]
- Sereewattanapong, T.; Promwong, S. Performance evaluation scheme of ultra wideband impulse radio transmission. In Proceedings of the ECTI-CON2010: The 2010 ECTI International Confernce on Electrical Engineering/Electronics, Computer, Telecommunications and Information Technology, Chiang Mai, Thailand, 19–21 May 2010; pp. 405–409. [Google Scholar]
- Wang, J.; Raja, A.K.; Pang, Z. Prototyping and Experimental Comparison of IR-UWB Based High Precision Localization Technologies. In Proceedings of the 2015 IEEE 12th Intl Conf on Ubiquitous Intelligence and Computing and 2015 IEEE 12th Intl Conf on Autonomic and Trusted Computing and 2015 IEEE 15th Intl Conf on Scalable Computing and Communications and Its Associated Workshops (UIC-ATC-ScalCom), Beijing, China, 10–14 August 2015; pp. 1187–1192. [Google Scholar]
- Crepaldi, M.; Ros, P.M.; Bonanno, A.; Morello, M.; Demarchi, D. A non-coherent IR-UWB receiver for high sensitivity short distance estimation. In Proceedings of the 2014 IEEE International Symposium on Circuits and Systems (ISCAS), Melbourne VIC, Australia, 1–5 June 2014; pp. 1905–1908. [Google Scholar]
- Crepaldi, M.; Stoppa, M.; Motto Ros, P.; Demarchi, D. An Analog-Mode Impulse Radio System for Ultra-Low Power Short-Range Audio Streaming. IEEE Trans. Circuits Syst. I Regul. Pap. 2015, 62, 2886–2897. [Google Scholar] [CrossRef]
- Motto Ros, P.; Crepaldi, M.; Bonanno, A.; Demarchi, D. Wireless Multi-channel Quasi-digital Tactile Sensing Glove-Based System. In Proceedings of the 2013 Euromicro Conference on Digital System Design, Los Alamitos, CA, USA, 4–6 September 2013; pp. 673–680. [Google Scholar]
- Shahshahani, A.; Shahshahani, M.; Motto Ros, P.; Bonanno, A.; Crepaldi, M.; Martina, M.; Demarchi, D.; Masera, G. An all-digital spike-based ultra-low-power IR-UWB dynamic average threshold crossing scheme for muscle force wireless transmission. In Proceedings of the 2015 Design, Automation Test in Europe Conference Exhibition (DATE), Grenoble, France, 9–13 March 2015; pp. 1479–1484. [Google Scholar]
- Damilano, A.; Motto Ros, P.; Sanginario, A.; Chiolerio, A.; Bocchini, S.; Roppolo, I.; Pirri, C.F.; Carrara, S.; Demarchi, D.; Crepaldi, M. A Robust Capacitive Digital Read-Out Circuit for a Scalable Tactile Skin. IEEE Sens. J. 2017, 17, 2682–2695. [Google Scholar] [CrossRef]
- Stoppa, M.; Ros, P.M.; Crepaldi, M.; Chiolerio, A.; Demarche, D. A quasi-digital pressure/touch sensor prototype for orbital targets contact event monitoring. In Proceedings of the 2016 IEEE International Symposium on Circuits and Systems (ISCAS), Montreal, QC, Canada, 22–25 May 2016; pp. 2843–2846. [Google Scholar]
- Motto Ros, P.; Miccoli, B.; Sanginario, A.; Demarchi, D. Low-power architecture for integrated CMOS bio-sensing. In Proceedings of the 2017 IEEE Biomedical Circuits and Systems Conference (BioCAS), Turin, Italy, 19–21 October 2017; pp. 1–4. [Google Scholar]
- Sharif, Z.; Sha’ameri, A.Z. The Application of Cross Correlation Technique for Estimating Impulse Response and Frequency Response of Wireless Communication Channel. In Proceedings of the 2007 5th Student Conference on Research and Development, Selangor, Malaysia, 11–12 December 2007; pp. 1–5. [Google Scholar]
- Ozdemir, A. An Analysis on Sensor Locations of the Human Body for Wearable Fall Detection Devices: Principles and Practice. Sensors 2016, 16, 1161. [Google Scholar] [CrossRef] [PubMed]
- Kononenko, I.; Šimec, E.; Robnik-Sikonja, M. Overcoming the Myopia of Inductive Learning Algorithms with RELIEFF. Appl. Intell. 1997, 7, 39–55. [Google Scholar] [CrossRef]
- Ozdemir, A.; Barshan, B. Detecting Falls with Wearable Sensors Using Machine Learning Techniques. Sensors 2014, 14, 10691–10708. [Google Scholar] [CrossRef] [PubMed]
- Yu, K.; Guo, Y.J.; Oppermann, I. Modified Taylor Series Expansion Based Positioning Algorithms. In Proceedings of the VTC Spring 2008—IEEE Vehicular Technology Conference, Singapore, 11–14 May 2008; pp. 2656–2660. [Google Scholar]
- Vicon. Available online: https://www.vicon.com/ (accessed on 7 August 2020).
- Jiménez Ruiz, A.R.; Seco Granja, F. Comparing Ubisense, BeSpoon, and DecaWave UWB Location Systems: Indoor Performance Analysis. IEEE Trans. Instrum. Meas. 2017, 66, 2106–2117. [Google Scholar] [CrossRef]
- Jiménez, A.R.; Seco, F. Comparing Decawave and Bespoon UWB location systems: Indoor/outdoor performance analysis. In Proceedings of the 2016 International Conference on Indoor Positioning and Indoor Navigation (IPIN), Alcala de Henares, Spain, 4–7 October 2016; pp. 1–8. [Google Scholar]
- Sang, C.L.; Adams, M.; Korthals, T.; Hörmann, T.; Hesse, M.; Rückert, U. A Bidirectional Object Tracking and Navigation System using a True-Range Multilateration Method. In Proceedings of the 2019 International Conference on Indoor Positioning and Indoor Navigation (IPIN), Pisa, Italy, 30 September–3 October 2019; pp. 1–8. [Google Scholar]


| Name | Class | Sensor Type | Location | |
|---|---|---|---|---|
| Research Systems | Lu et al. [10] | vision-based | cameras | indoor |
| De Miguel et al. [11] | vision-based | cameras | indoor | |
| Williams et al. [12] | vision-based | cameras | indoor | |
| Dotsinsky et al. [13] | vision-based | cameras | indoor | |
| Kianoush et al. [14] | ambient-based | radio-frequency antennas | indoor | |
| Ma et al. [15] | ambient-based | UWB | indoor | |
| Vecchio et al. [16] | ambient-based | UWB | indoor | |
| Khawaja et al. [17] | ambient-based | UWB | indoor | |
| Kolakowski et al. [18] | wearable-based | UWB + MEMS | indoor | |
| Gharghan et al. [19] | wearable-based | accelerometer + Zigbee WSN | indoor | |
| Fung et al. [20] | wearable-based | GPS + GSM + smartphone | indoor/outdoor | |
| Commercial Systems | TruSense [2] | wearable-based | wearable + motion +contact sensors | indoor/outdoor |
| GoLiveClip [3] | wearable-based | wearable sensor + smartphone | indoor/outdoor | |
| MyNotify [21] | wearable-based | wearable sensor + smartphone/hub | indoor |
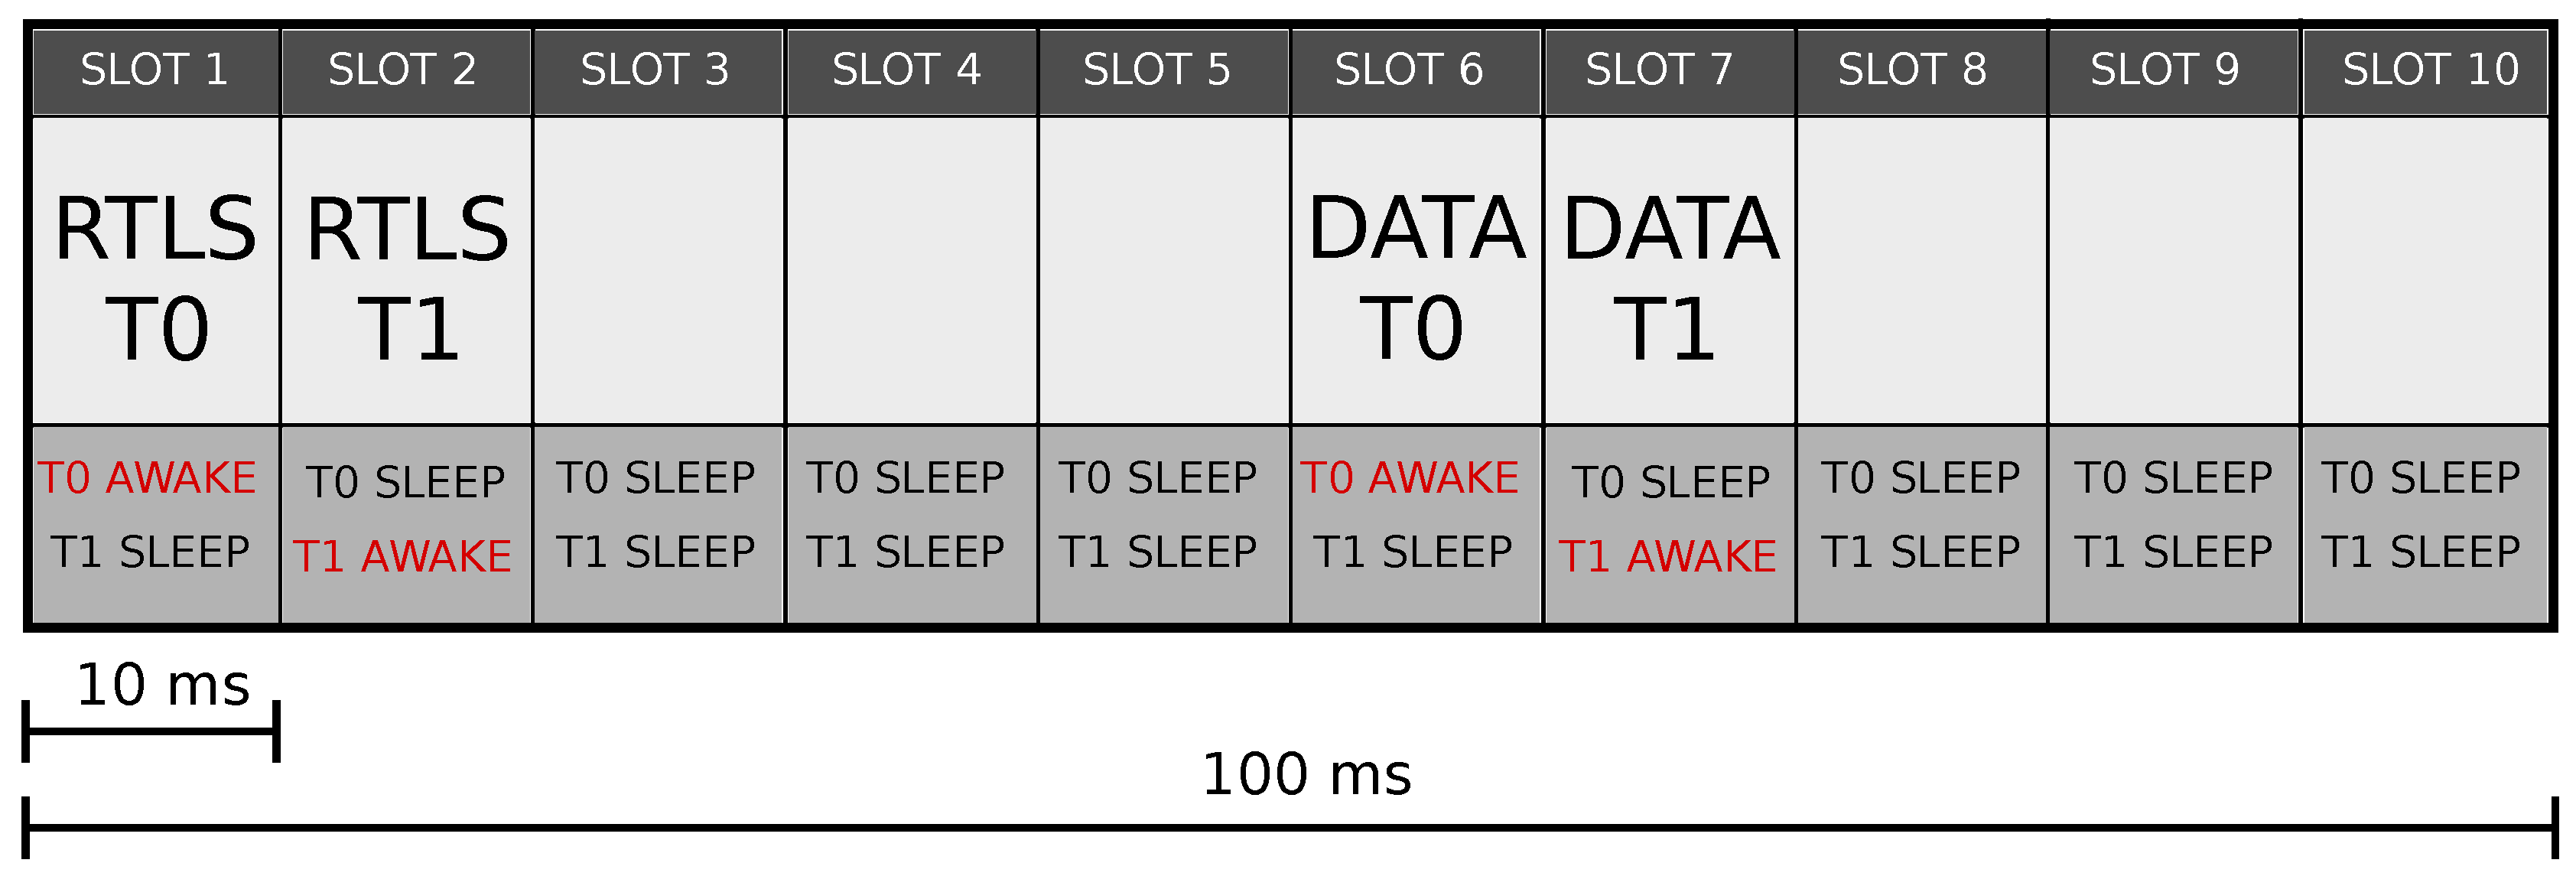
| SLOT 1 | SLOT 2 | SLOT 3 | SLOT 4 | SLOT 5 | SLOT 6 | SLOT 7 | SLOT 8 | SLOT 9 | SLOT 10 | |
|---|---|---|---|---|---|---|---|---|---|---|
| # of messages | 38,387 | 38,359 | 38,375 | 38,178 | 38,945 | 37,955 | 38,366 | 38,311 | 38,663 | 38,002 |
| min time [ms] | 57 | 67 | 77 | 87 | 97 | 7 | 17 | 27 | 37 | 47 |
| max time [ms] | 66 | 76 | 86 | 96 | 106 | 16 | 26 | 36 | 46 | 56 |
| 8 Anchors | 4 Anchors | |||
|---|---|---|---|---|
| Correction | No Correction | Correction | No Correction | |
| Error in the middle [m] | 0.0552 | 0.1015 | 0.0517 | 0.1305 |
| Error at the edges [m] | 0.111 | 0.1180 | 0.093 | 0.196 |
| True Class | LOS | 4921 | 1 |
| NLOS | 8 | 1670 | |
| LOS | NLOS | ||
| Predicted class | |||
© 2020 by the authors. Licensee MDPI, Basel, Switzerland. This article is an open access article distributed under the terms and conditions of the Creative Commons Attribution (CC BY) license (http://creativecommons.org/licenses/by/4.0/).
Share and Cite
Capra, M.; Sapienza, S.; Motto Ros, P.; Serrani, A.; Martina, M.; Puiatti, A.; Bonato, P.; Demarchi, D. Assessing the Feasibility of Augmenting Fall Detection Systems by Relying on UWB-Based Position Tracking and a Home Robot. Sensors 2020, 20, 5361. https://doi.org/10.3390/s20185361
Capra M, Sapienza S, Motto Ros P, Serrani A, Martina M, Puiatti A, Bonato P, Demarchi D. Assessing the Feasibility of Augmenting Fall Detection Systems by Relying on UWB-Based Position Tracking and a Home Robot. Sensors. 2020; 20(18):5361. https://doi.org/10.3390/s20185361
Chicago/Turabian StyleCapra, Maurizio, Stefano Sapienza, Paolo Motto Ros, Alessio Serrani, Maurizio Martina, Alessandro Puiatti, Paolo Bonato, and Danilo Demarchi. 2020. "Assessing the Feasibility of Augmenting Fall Detection Systems by Relying on UWB-Based Position Tracking and a Home Robot" Sensors 20, no. 18: 5361. https://doi.org/10.3390/s20185361
APA StyleCapra, M., Sapienza, S., Motto Ros, P., Serrani, A., Martina, M., Puiatti, A., Bonato, P., & Demarchi, D. (2020). Assessing the Feasibility of Augmenting Fall Detection Systems by Relying on UWB-Based Position Tracking and a Home Robot. Sensors, 20(18), 5361. https://doi.org/10.3390/s20185361