Effect of an Inflatable Air Mattress with Variable Rigidity on Sleep Quality


Abstract
1. Introduction
2. Methodology
2.1. Study Design
2.2. Participants
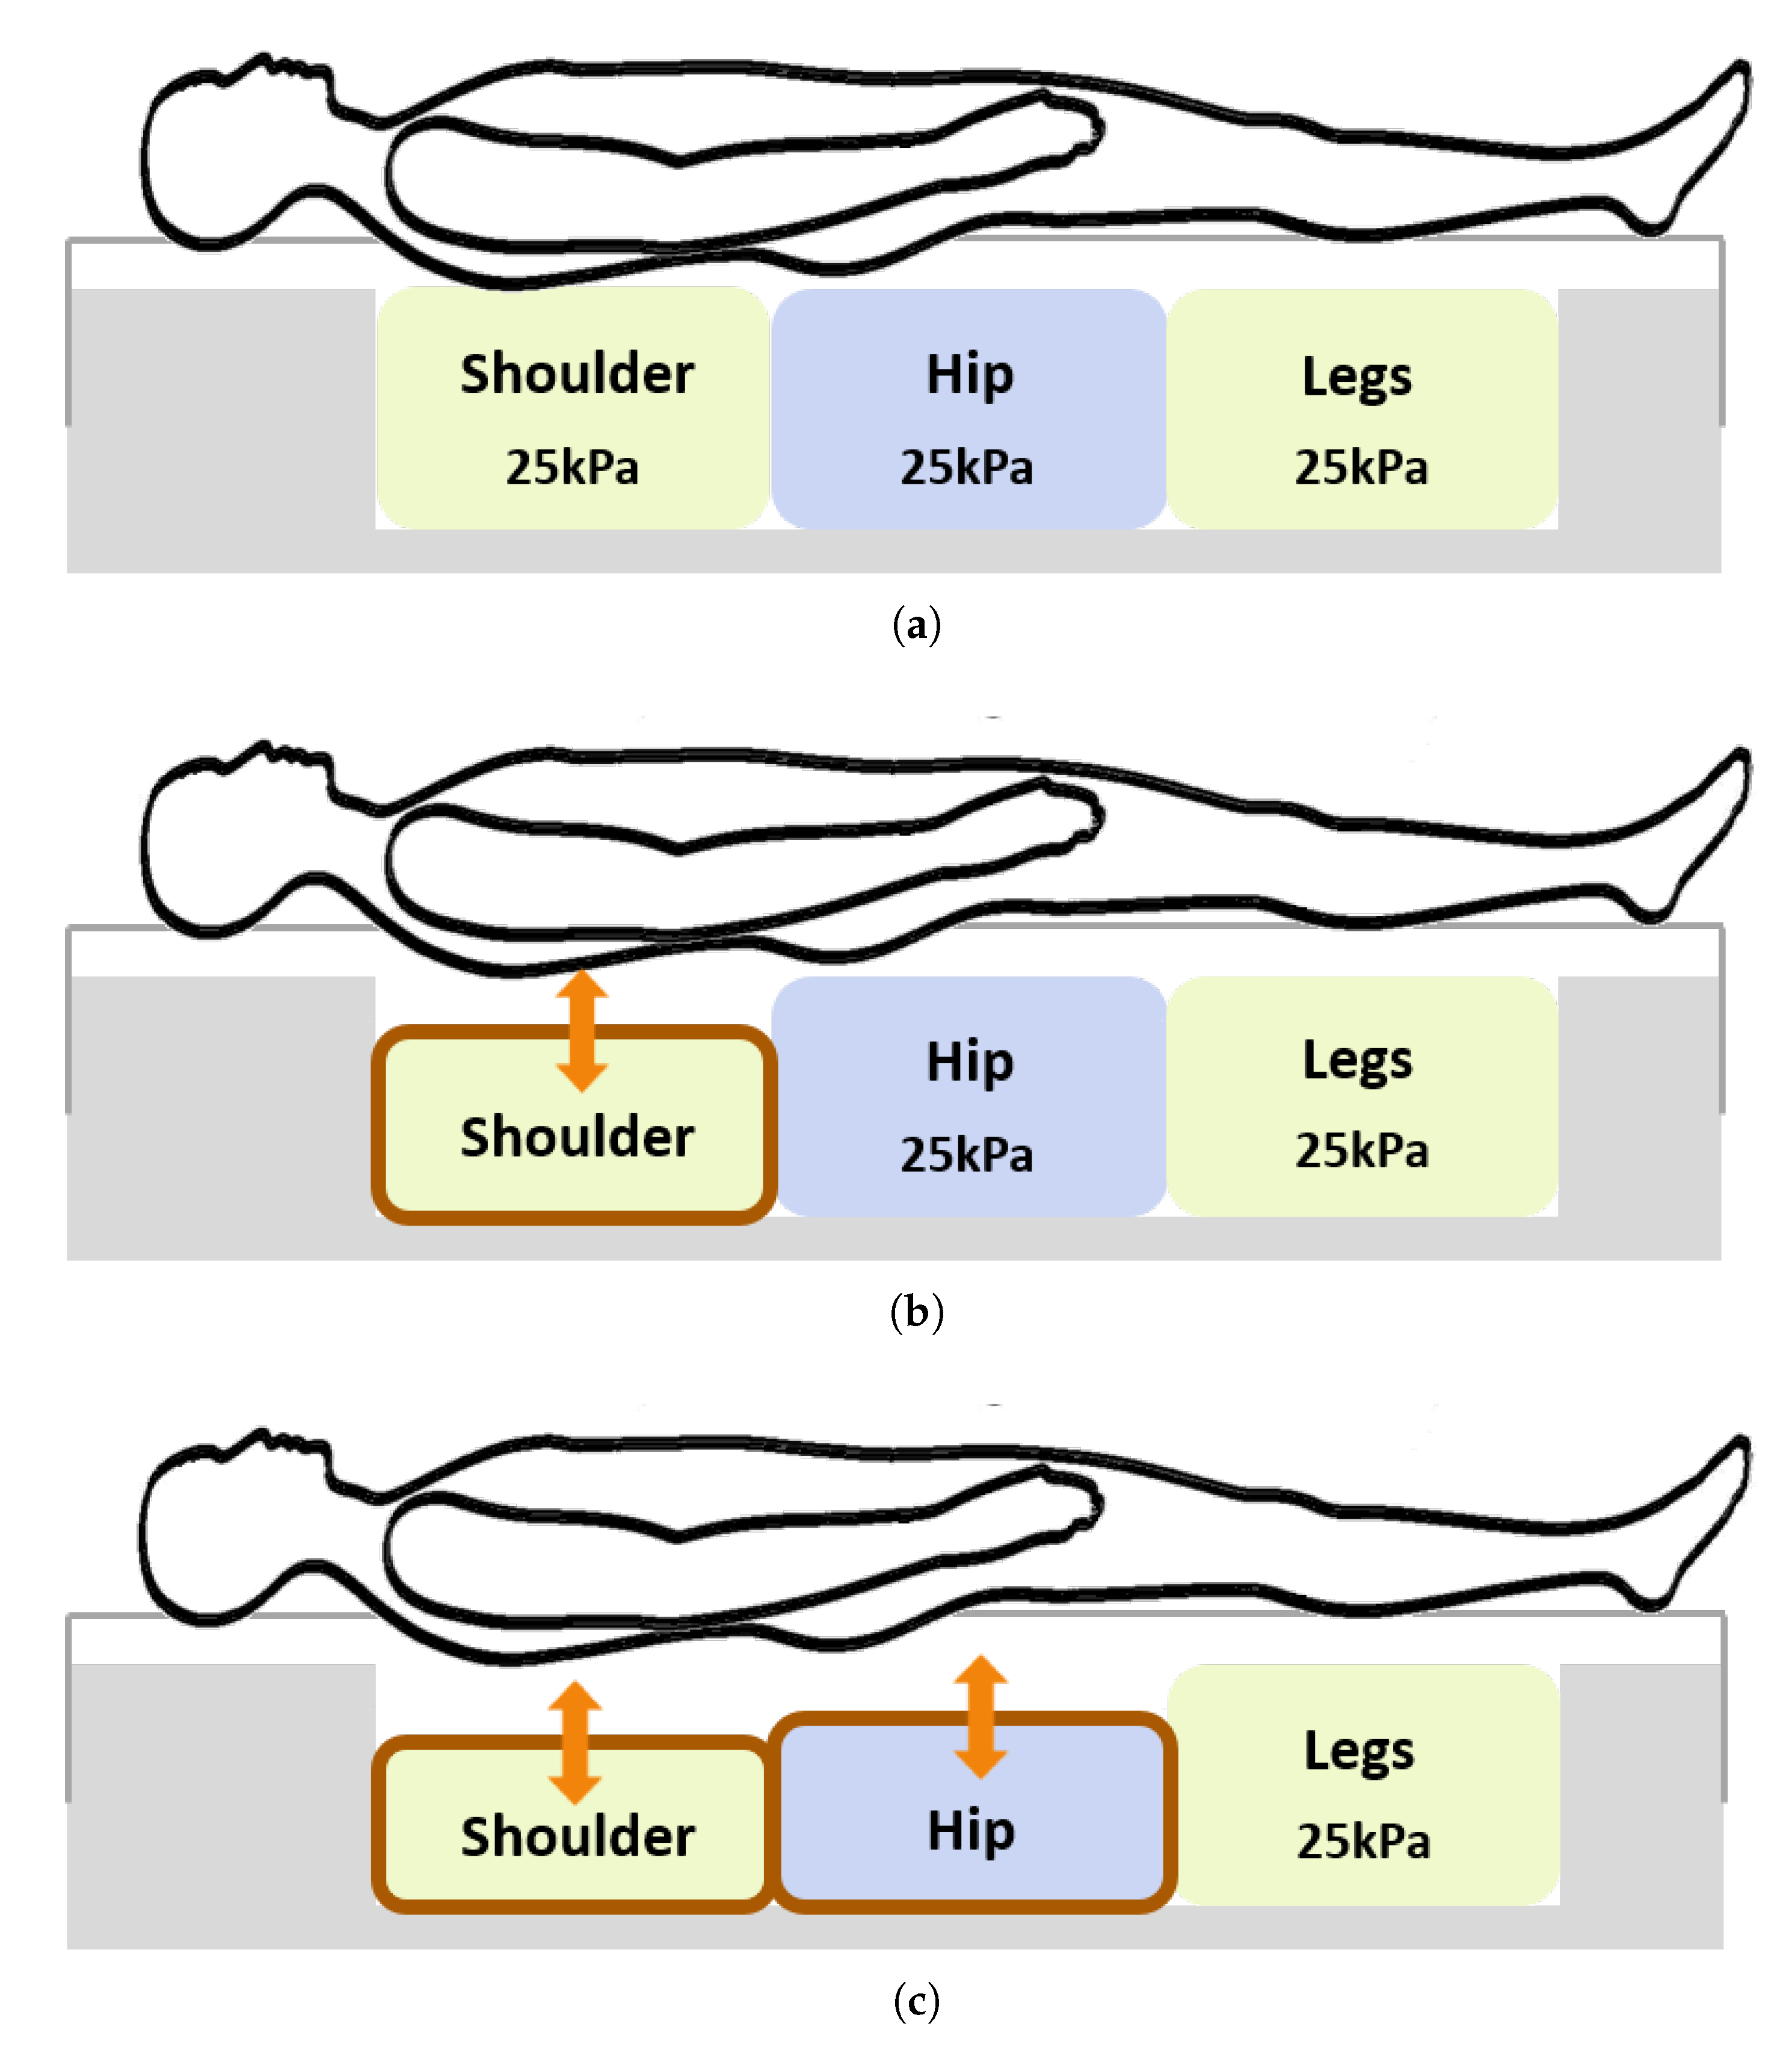
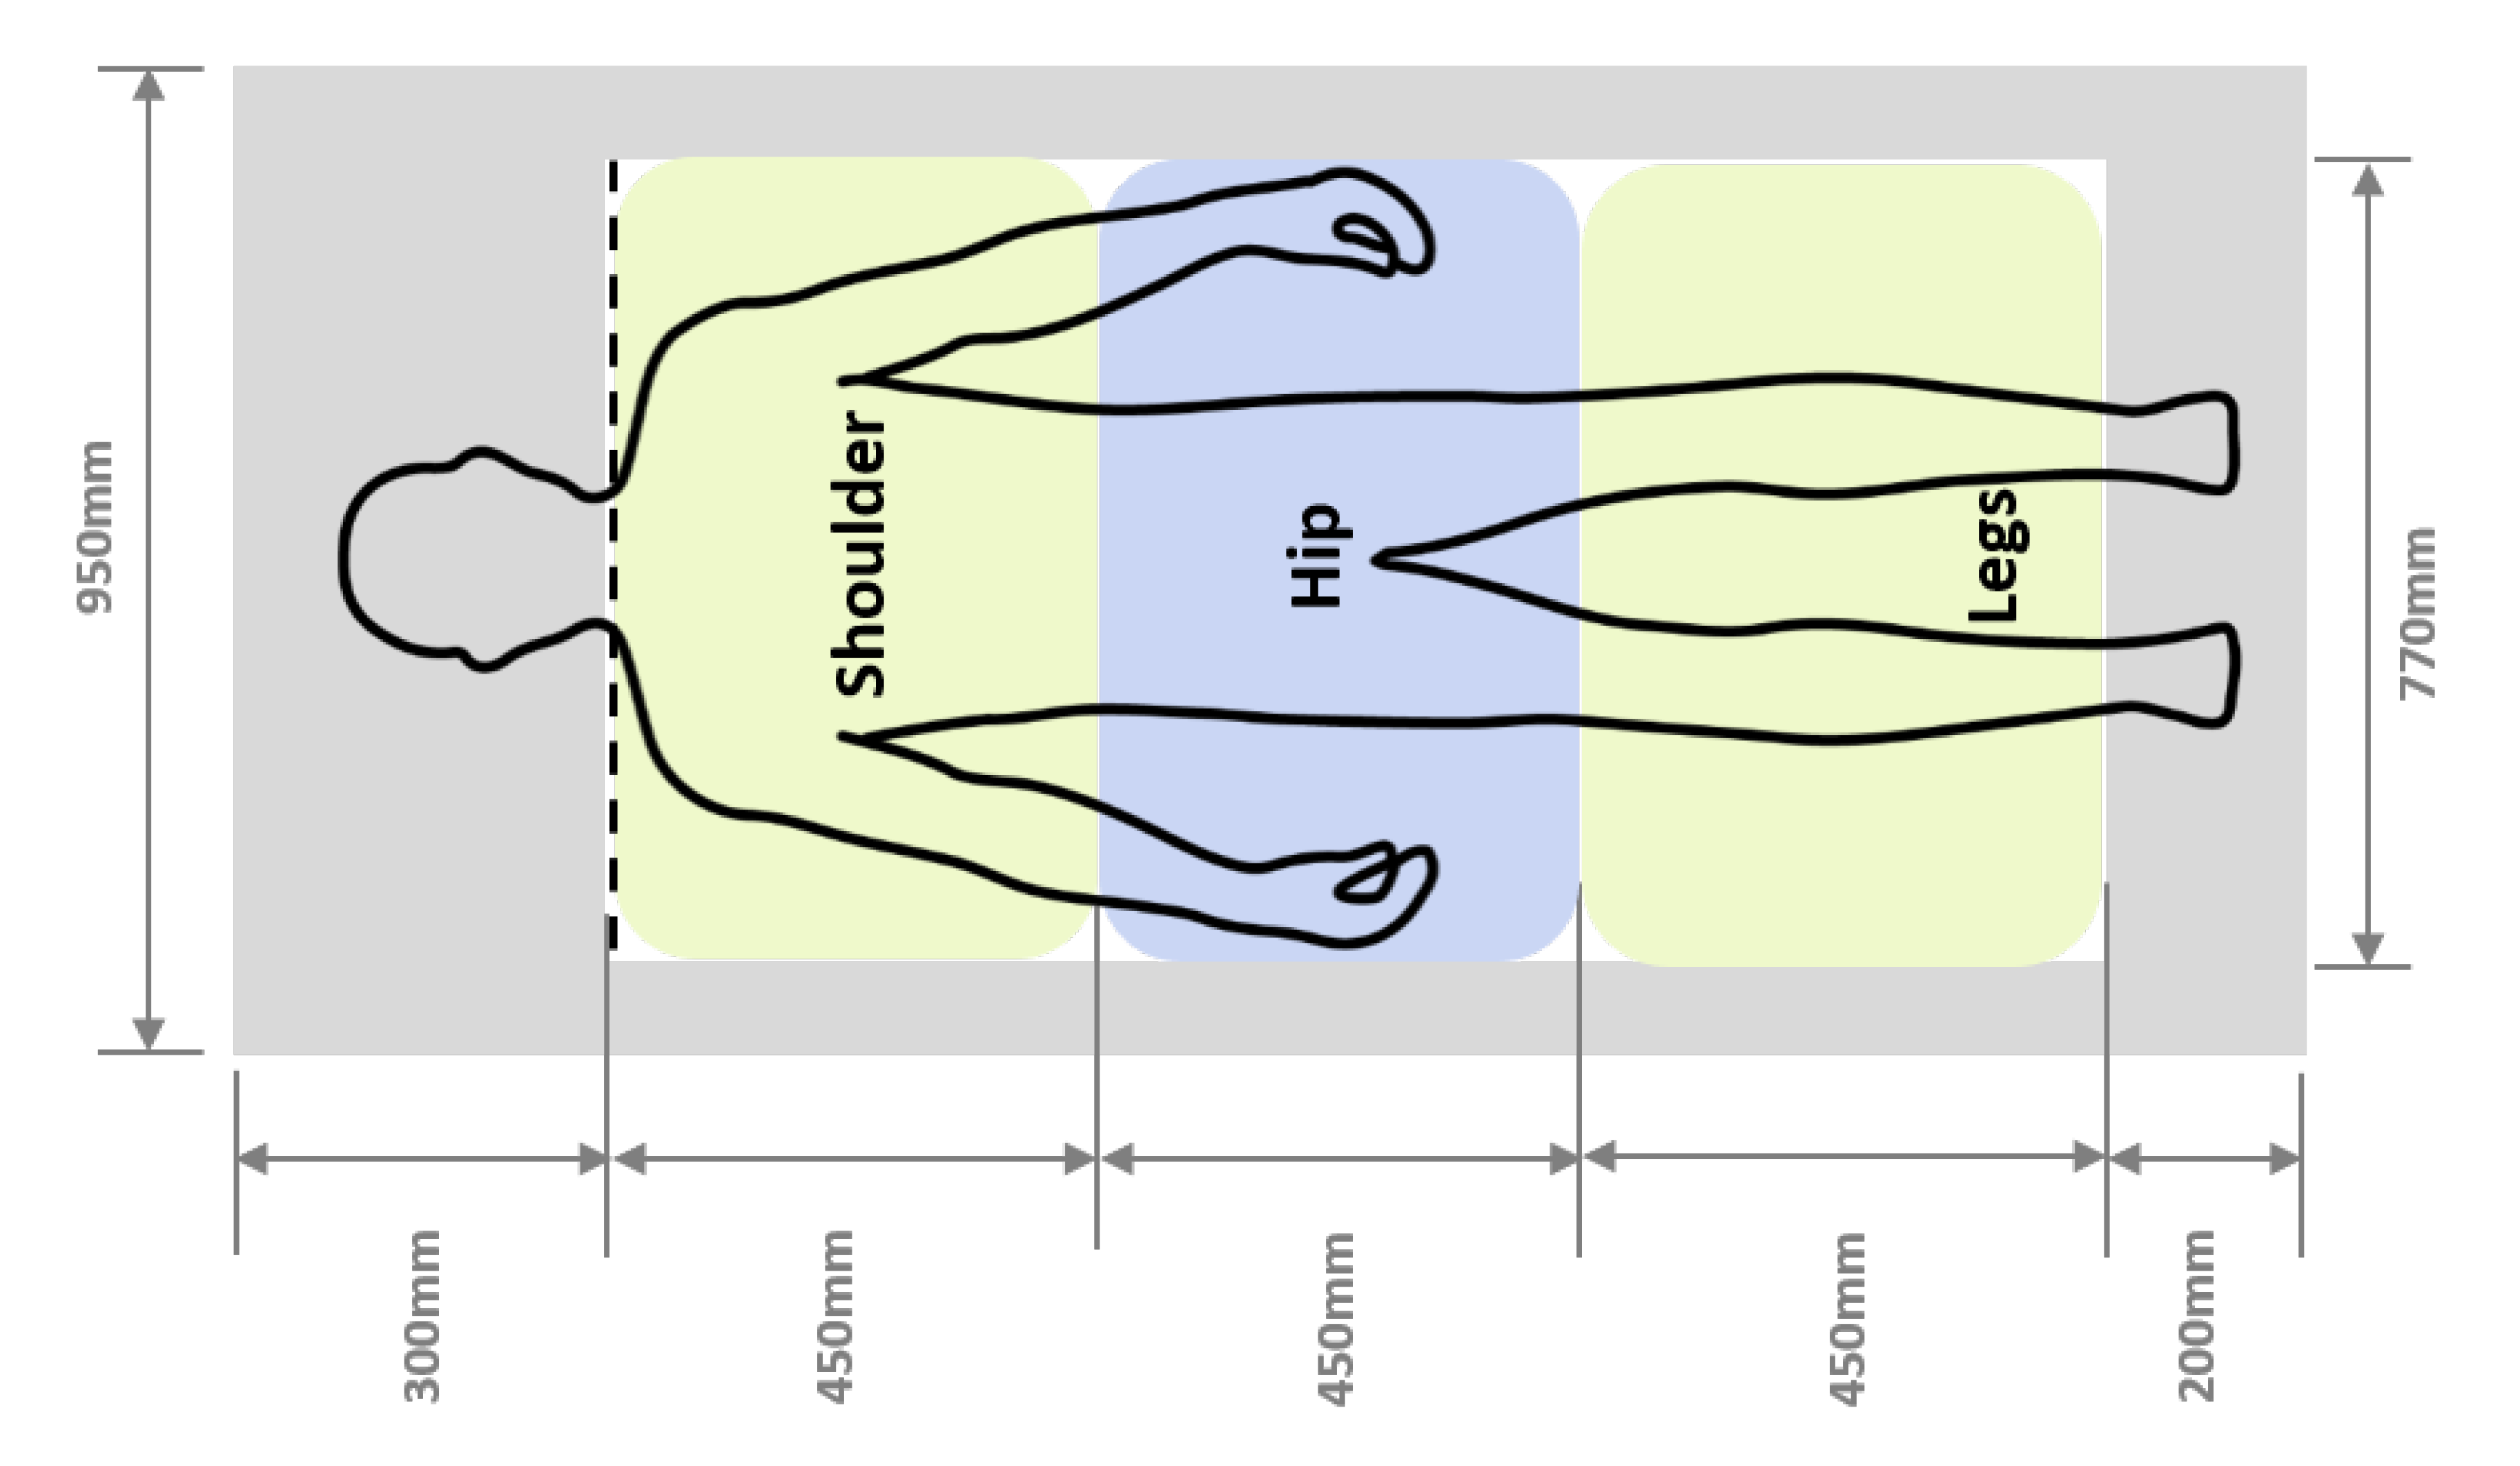
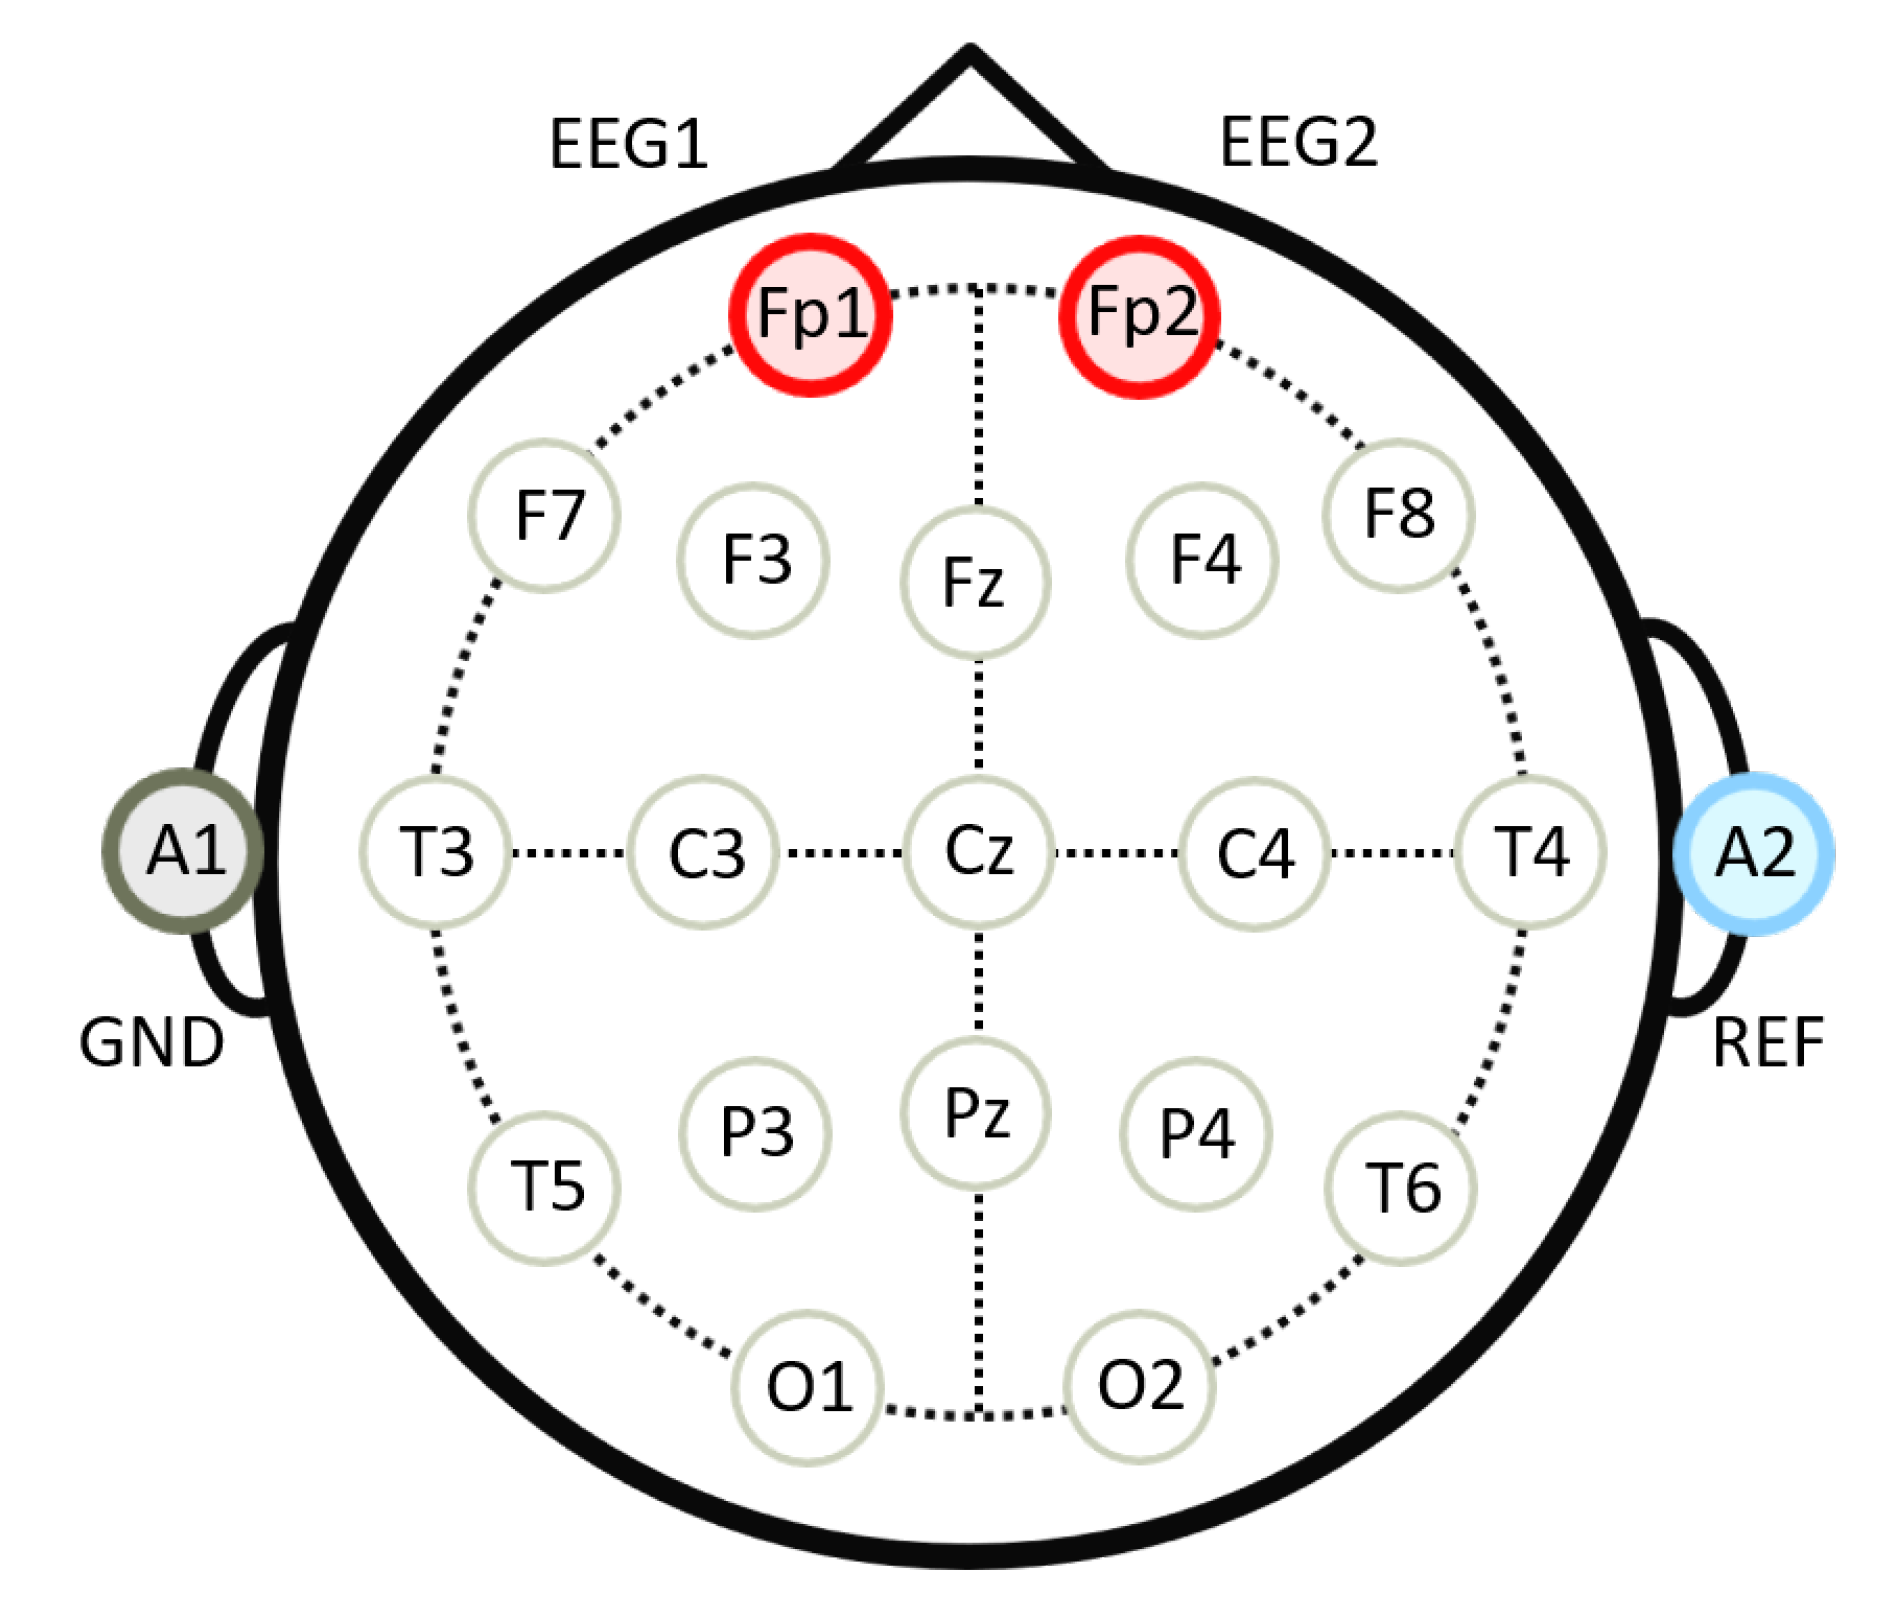
2.3. Materials
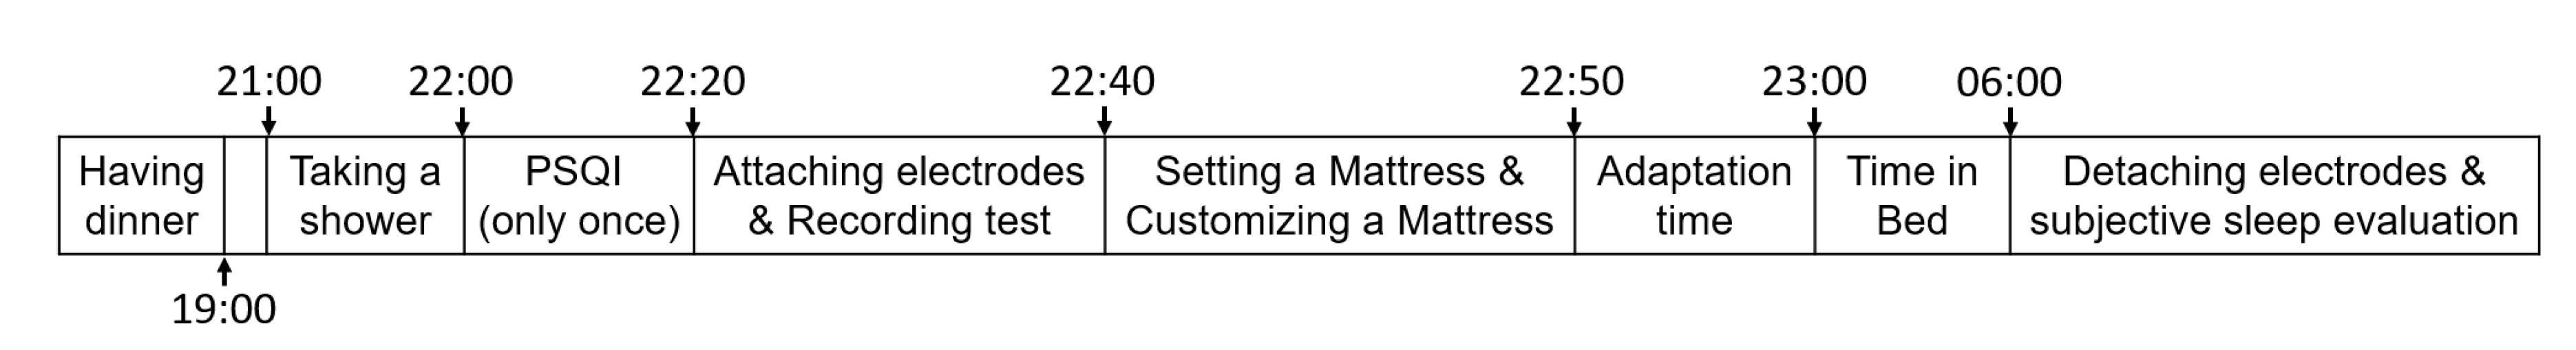
2.4. Procedure
2.5. Sleep Scoring Algorithm
2.6. Analyses
3. Results
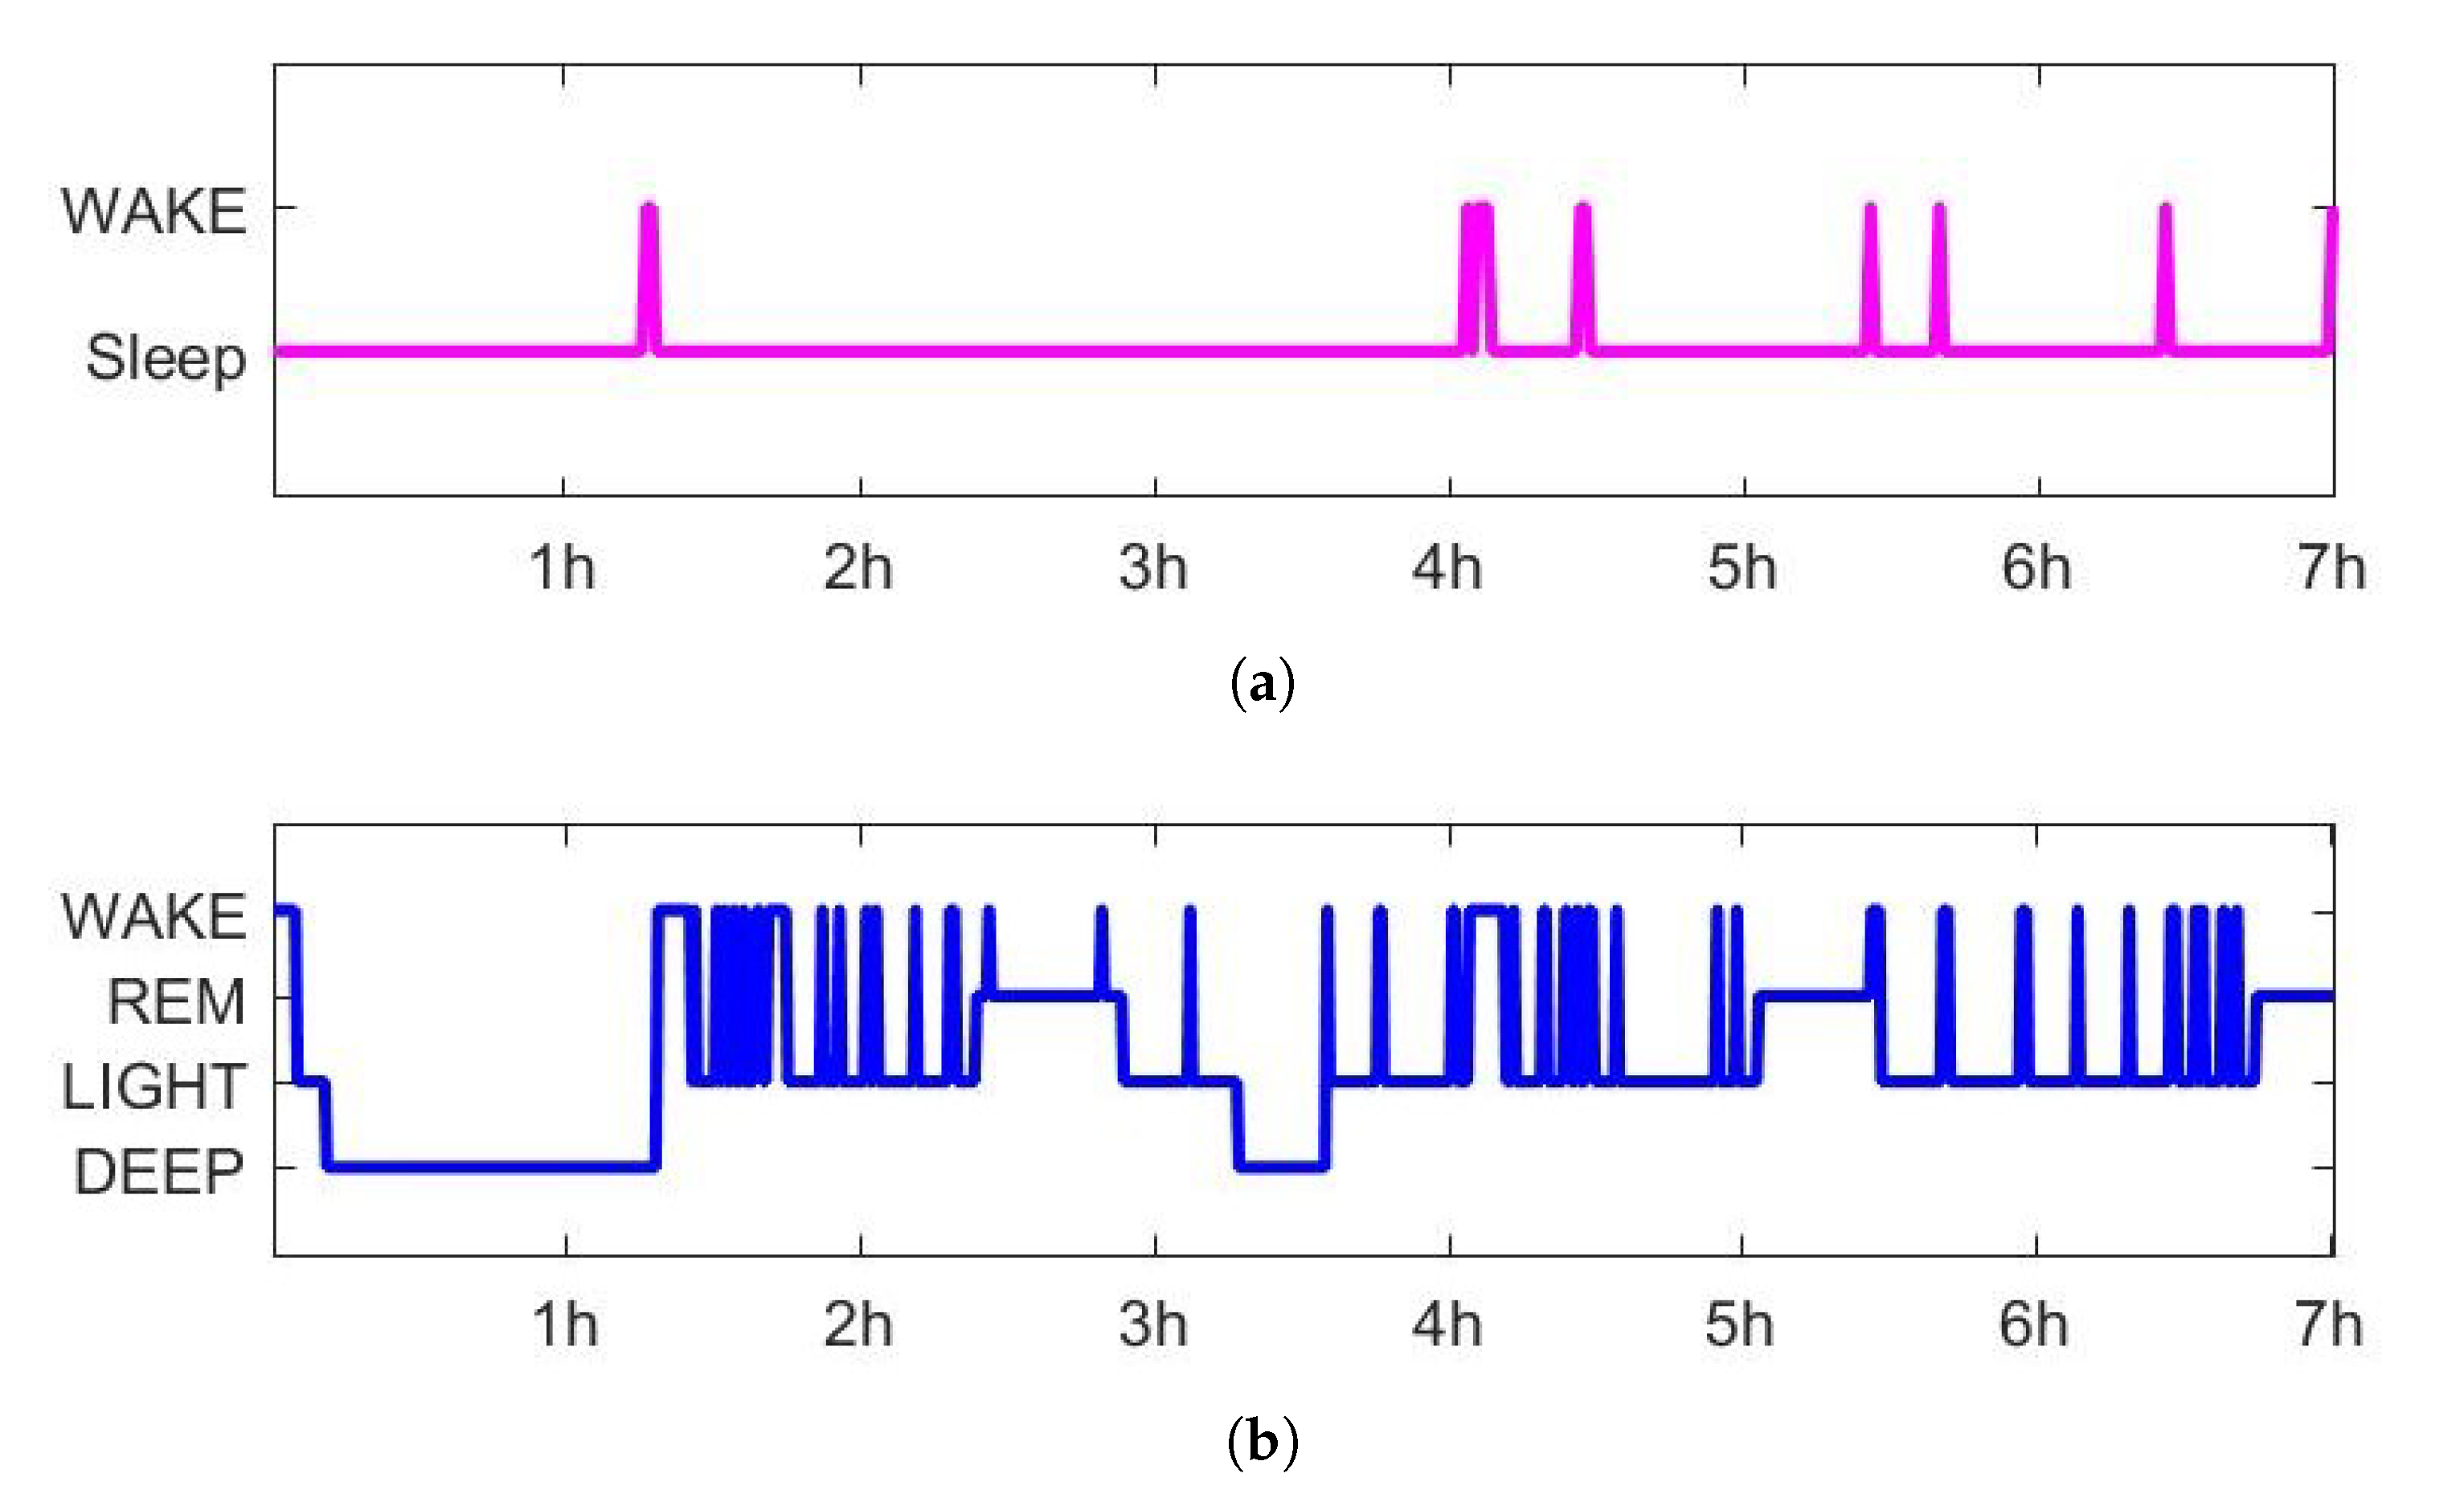
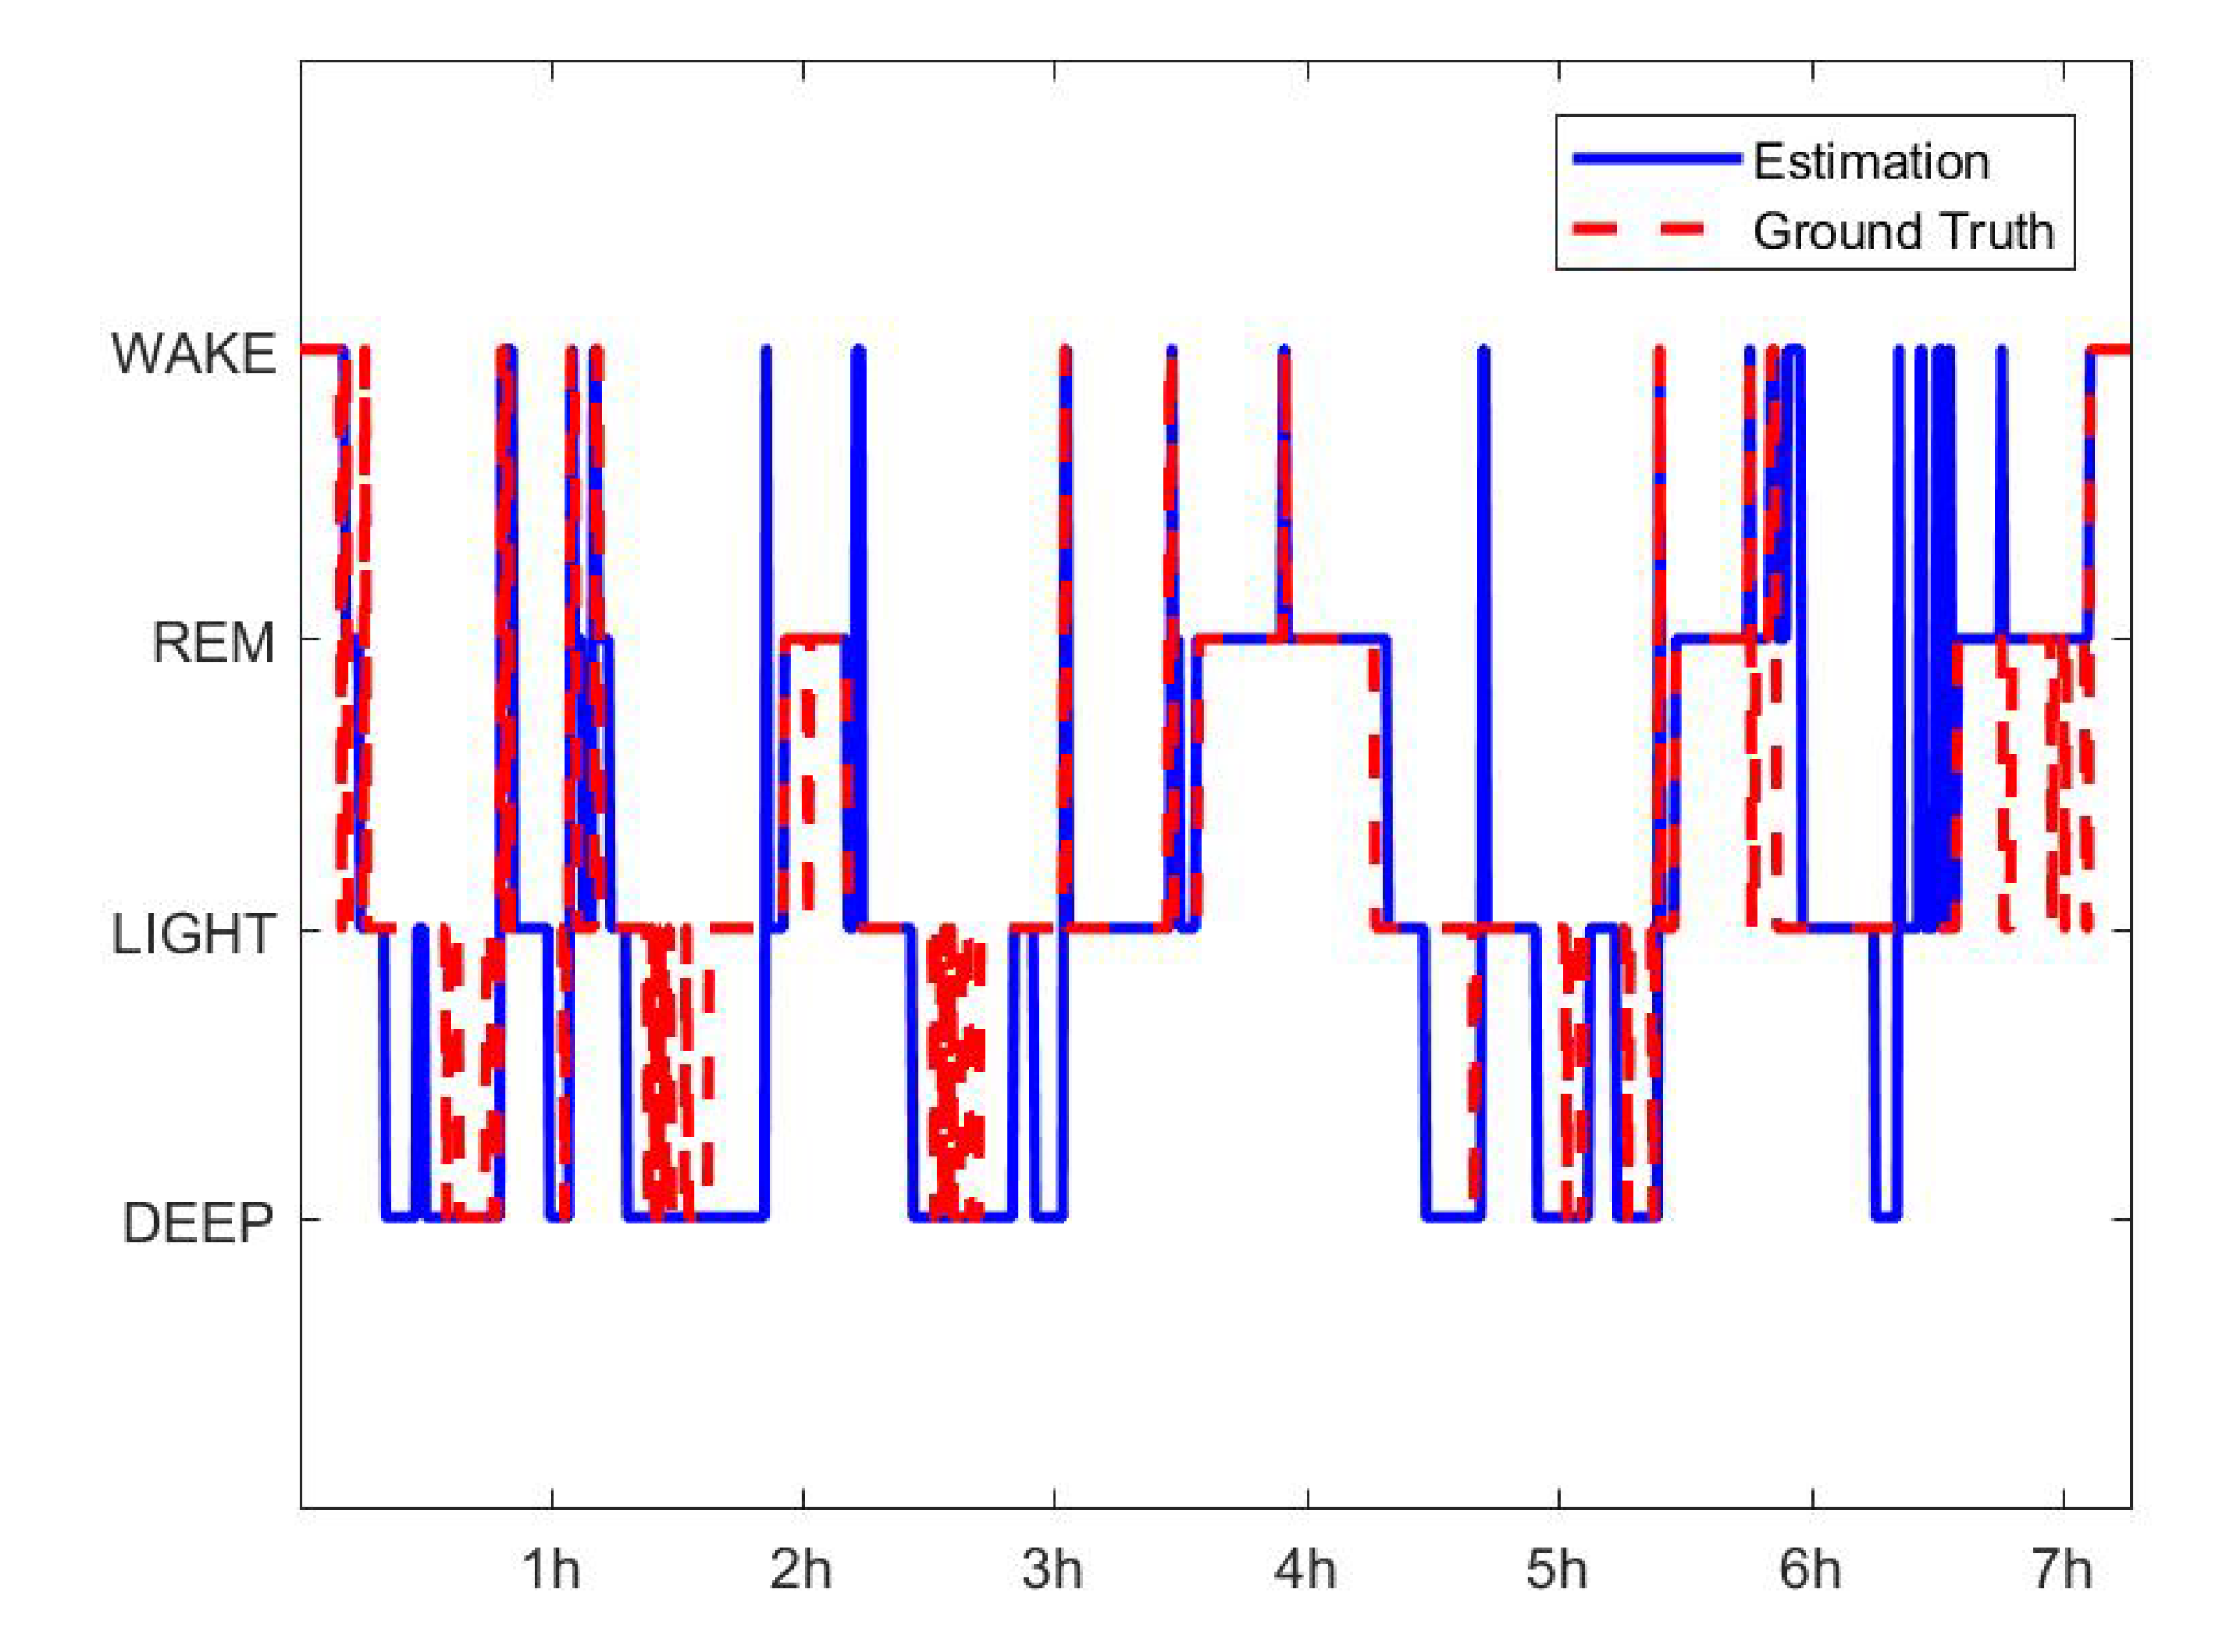
3.1. Sleep Scoring
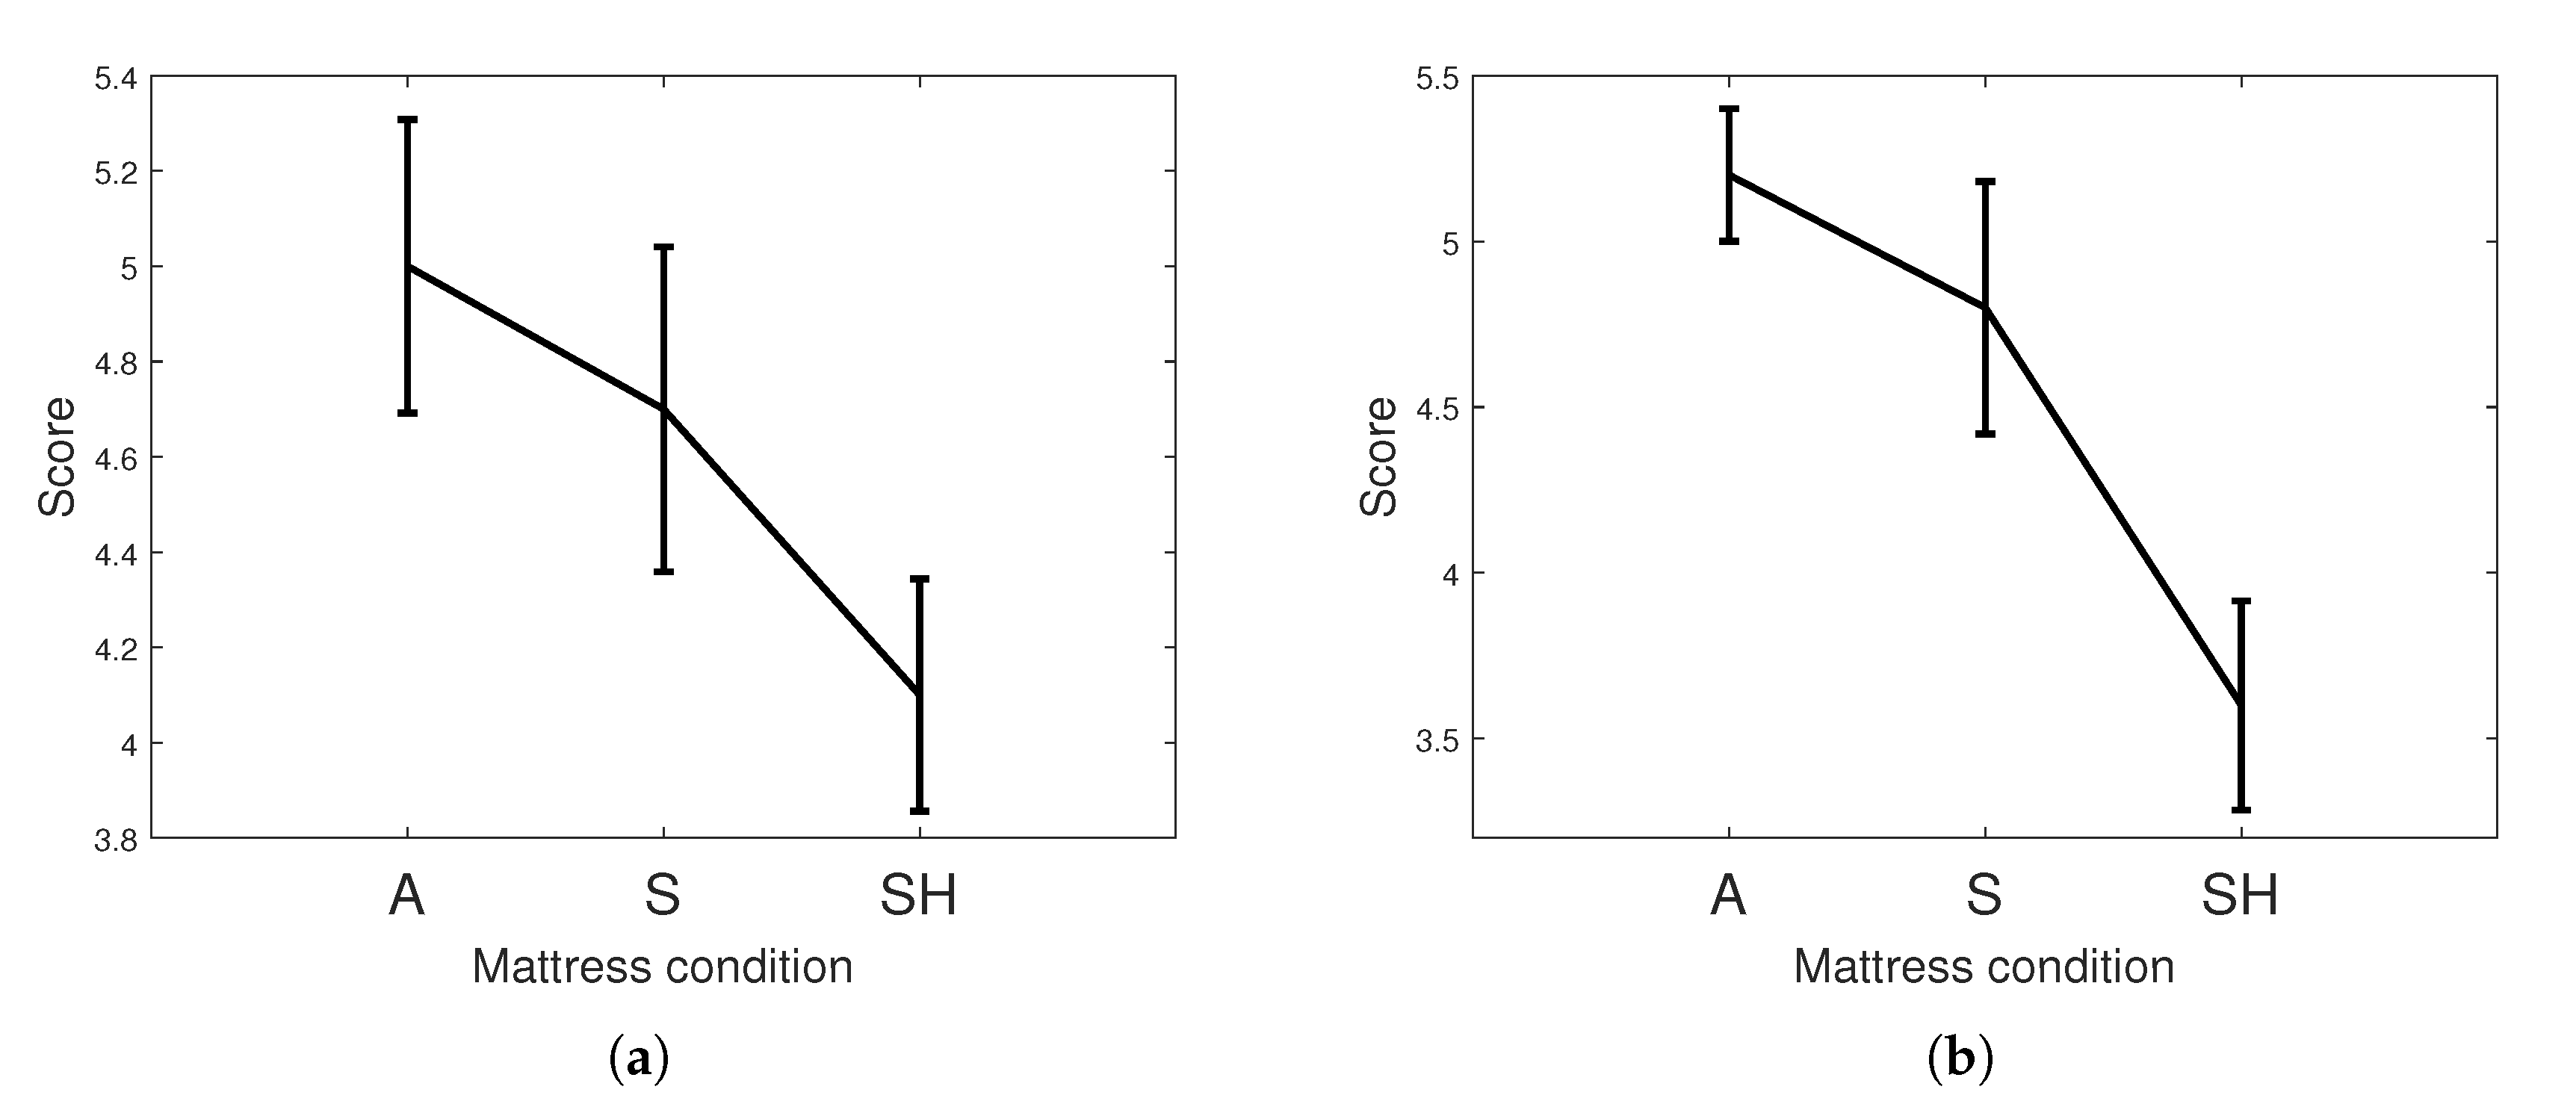
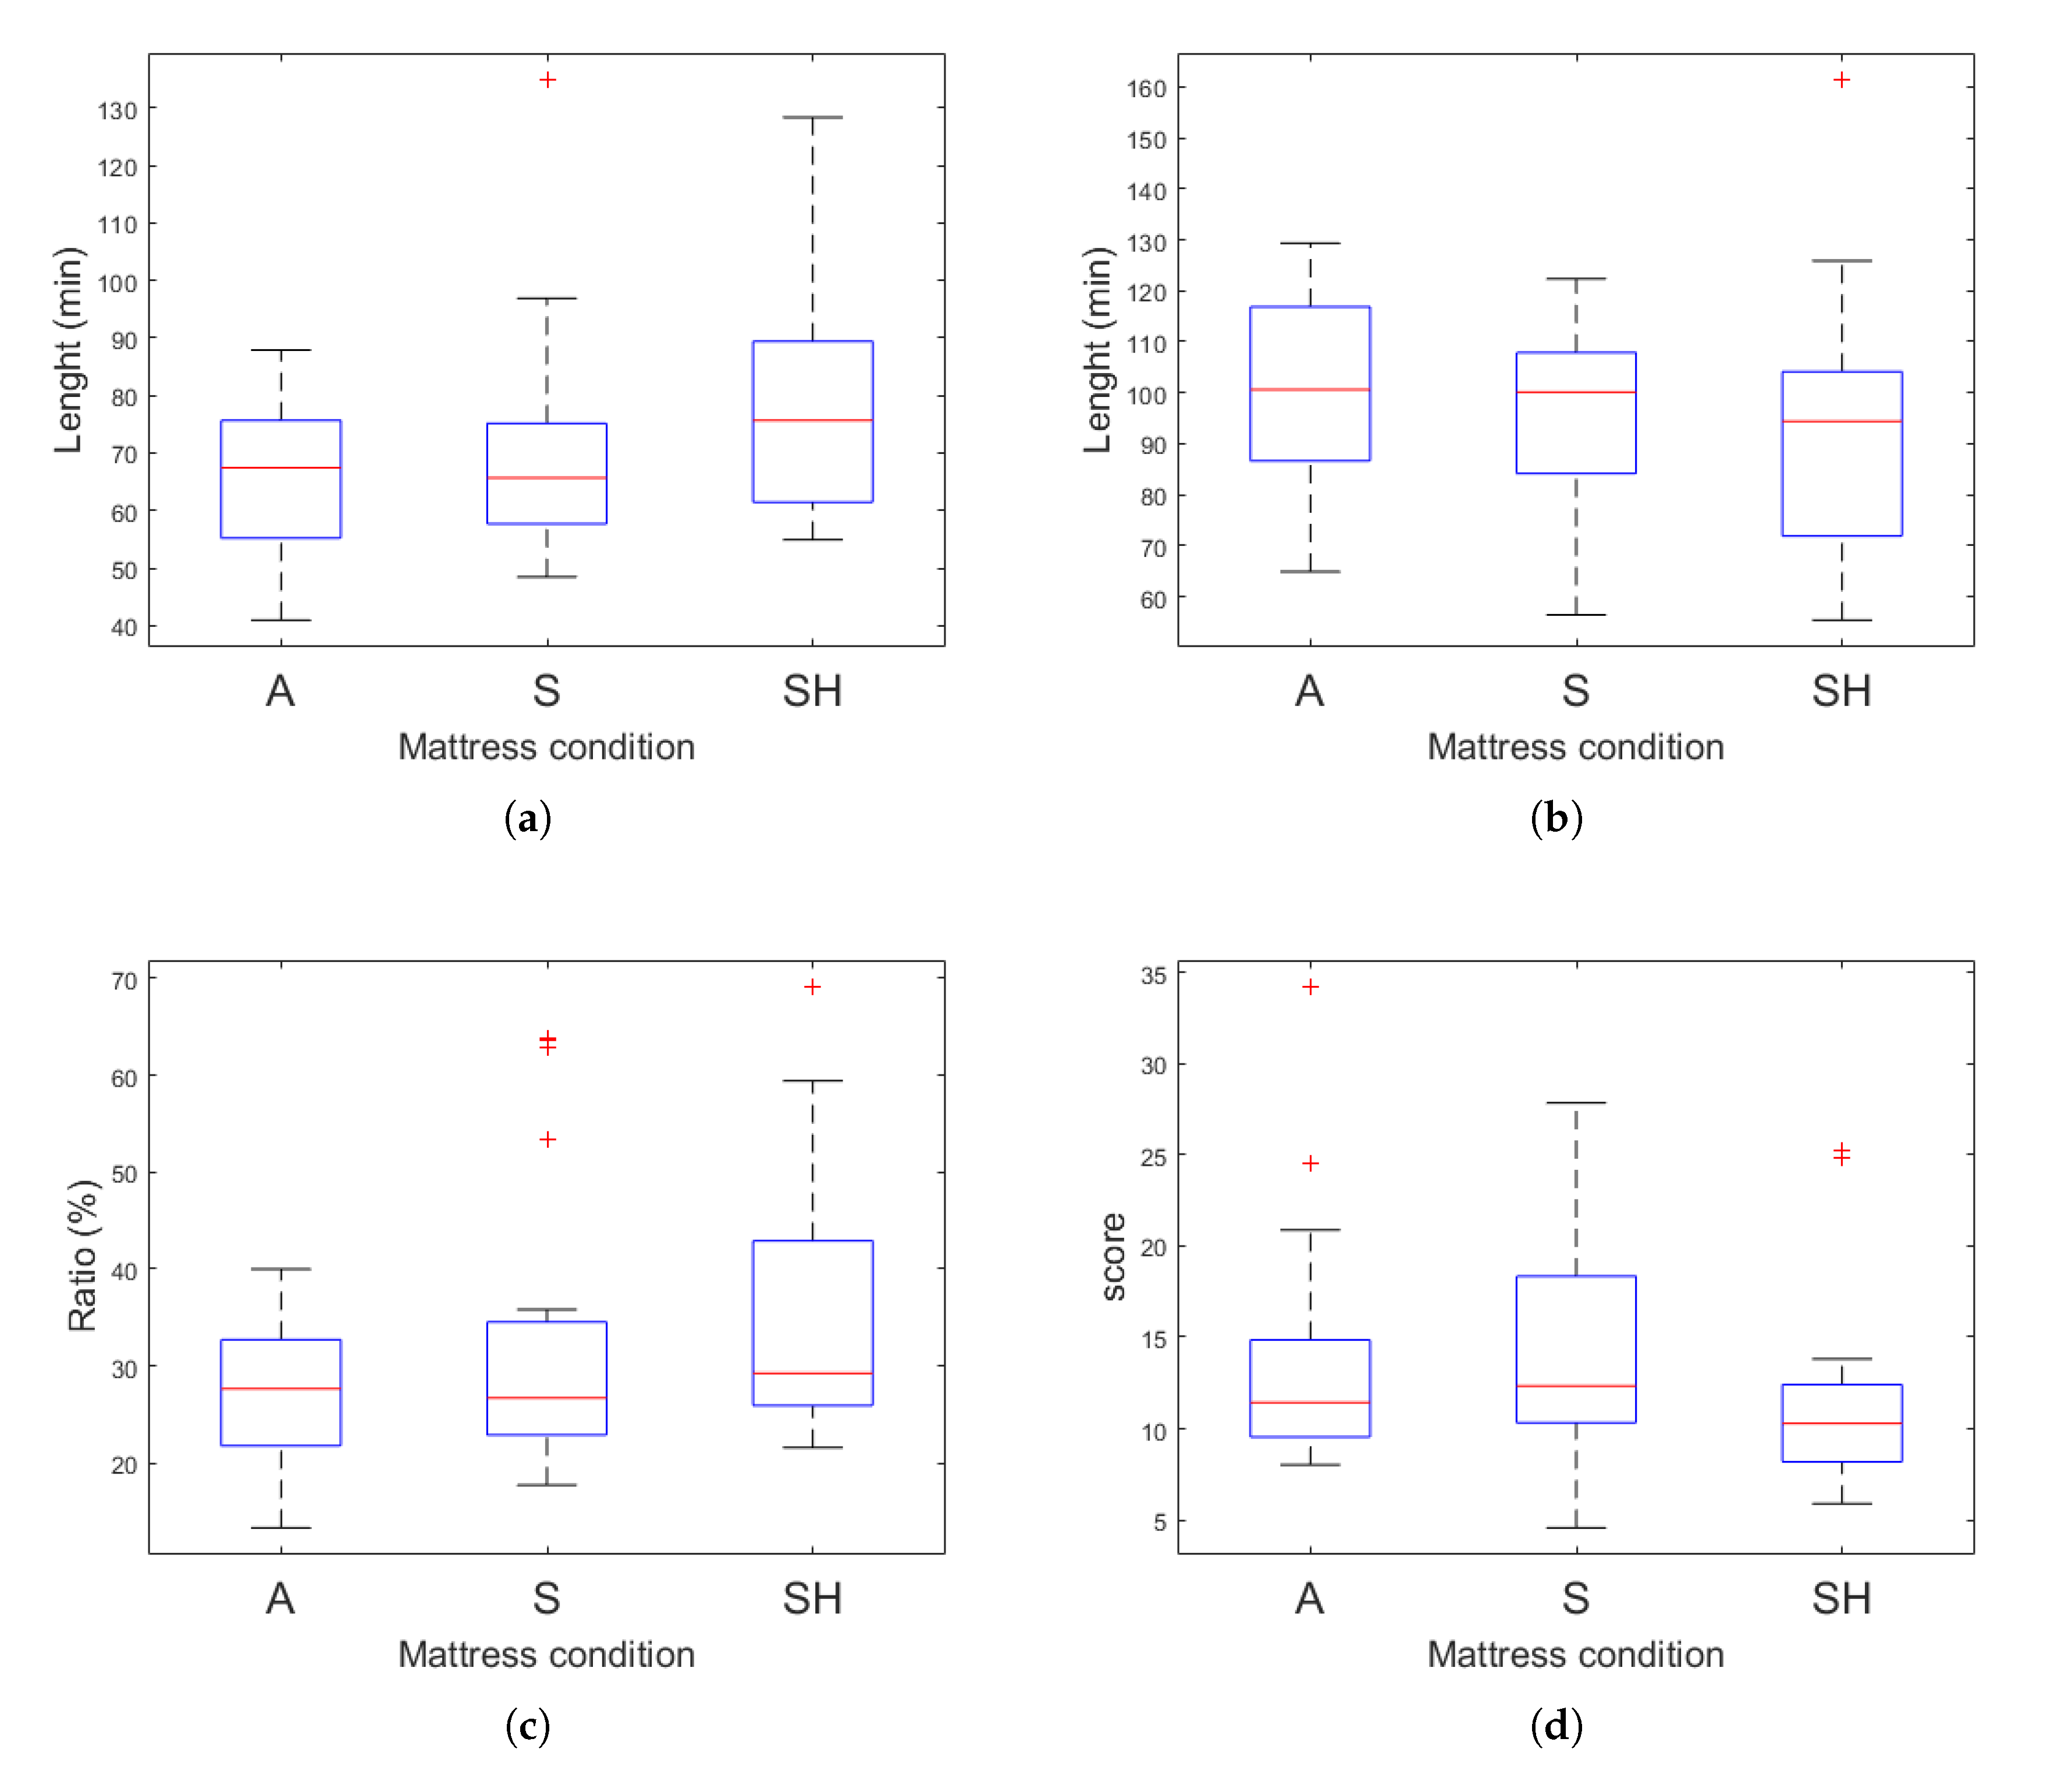
3.2. Sleep Quality Analysis
4. Discussion
5. Conclusions
Author Contributions
Funding
Conflicts of Interest
Abbreviations
| BMI | Body mass index |
| EEG | electroencephalogram |
| PSQI | Pittsburgh Sleep Quality Index |
| PSG | Polysomnography |
| FP(1 or 2) | Frontal-pole on the location of scalp electrodes |
| A(1 or 2) | Auricular point on the location of scalp electrodes |
| SWS | Slow wave sleep |
| RNR | REM to Non-REM ratio |
| SSI | Stage shift index |
| SE | Sleep efficiency |
| TST | Total sleep time |
| SOL | Sleep onset latency |
| WASO | Wake after sleep onset |
| EM algorithm | expectation-maximization algorithm |
| HMM | Hidden Markov model |
| EOG | Electrooculogram |
| EMG | Electromyogram |
| REM sleep | Rapid eye movement sleep |
| TP | True-positive |
| TN | True-negative |
| FP | False-positive |
| FN | False-negative |
| BCG | Ballistocardiogram |
| MSQ | Mini sleep questionnaire |
References
- Brown, L.K. Can sleep deprivation studies explain why human adults sleep? Curr. Opin. Pulm. Med. 2012, 18, 541–545. [Google Scholar] [CrossRef]
- Lammers-van der Holst, H.M.; Kerkhof, G.A. Shift work tolerance and the importance of sleep quality: A study of police officers. Biol. Rhythm Res. 2015, 46, 257–264. [Google Scholar] [CrossRef]
- Shepard, J.W.; Buysse, D.J.; Chesson, A.L.; Dement, W.C.; Goldberg, R.; Guilleminault, C.; Harris, C.D.; Iber, C.; Mignot, E.; Mitler, M.M.; et al. History of the development of sleep medicine in the United States. J. Clin. Sleep Med. Off. Publ. Am. Acad. Sleep Med. 2005, 1, 61–82. [Google Scholar] [CrossRef]
- Hsu, H.C.; Lin, M.H. Exploring quality of sleep and its related factors among menopausal women. J. Nurs. Res. 2005, 13, 153–164. [Google Scholar] [CrossRef] [PubMed]
- Jean-Louis, G.; Williams, N.J.; Sarpong, D.; Pandey, A.; Youngstedt, S.; Zizi, F.; Ogedegbe, G. Associations between inadequate sleep and obesity in the US adult population. BMC Public Health 2014, 14, 290. [Google Scholar] [CrossRef]
- Grandner, M.A.; Hale, L.; Moore, M.; Patel, N.P. Mortality associated with short sleep duration: The evidence, the possible mechanisms, and the future. Sleep Med. Rev. 2010, 14, 191–203. [Google Scholar] [CrossRef]
- Åkerstedt, T. Psychosocial stress and impaired sleep. Scand. J. Work Environ. Health 2006, 32, 493–501. [Google Scholar] [CrossRef]
- Pailhous, E.; Benoit, O.; Goldenberg, F.; Bouard, G.; Payant, C. Psychological profile and sleep organization in young subjects with poor quality of sleep. Psychiatry Res. 1988, 26, 327–336. [Google Scholar] [CrossRef]
- Weller, L.; Avinir, O. Hassles, uplifts, and quality of sleep. Percept. Mot. Ski. 1993, 76, 571–576. [Google Scholar] [CrossRef]
- Pilcher, J.J.; Ginter, D.R.; Sadowsky, B. Sleep quality versus sleep quantity: Relationships between sleep and measures of health, well-being and sleepiness in college students. J. Psychosom. Res. 1997, 42, 583–596. [Google Scholar] [CrossRef]
- Scott, J.P.; McNaughton, L.R.; Polman, R.C. Effects of sleep deprivation and exercise on cognitive, motor performance and mood. Physiol. Behav. 2006, 87, 396–408. [Google Scholar] [CrossRef] [PubMed]
- Lee, K.A.; Ward, T.M. Critical components of a sleep assessment for clinical practice settings. Issues Ment. Health Nurs. 2005, 26, 739–750. [Google Scholar] [CrossRef] [PubMed]
- Chilcott, L.A.; Shapiro, C.M. The socioeconomic impact of insomnia: An overview. Pharm. Econ. 1996, 10, 1–14. [Google Scholar] [CrossRef] [PubMed]
- Drake, C.; Richardson, G.; Roehrs, T.; Scofield, H.; Roth, T. Vulnerability to stress-related sleep disturbance and hyperarousal. Sleep 2004, 27, 285–291. [Google Scholar] [CrossRef]
- Hillman, D.R.; Murphy, A.S.; Antic, R.; Pezzullo, L. The economic cost of sleep disorders. Sleep 2006, 29, 299–305. [Google Scholar] [CrossRef]
- Mukherjee, S.; Patel, S.R.; Kales, S.N.; Ayas, N.T.; Strohl, K.P.; Gozal, D.; Malhotra, A. An official American Thoracic Society statement: The importance of healthy sleep: Recommendations and future priorities. Am. J. Respir. Crit. Care Med. 2015, 191, 1450–1458. [Google Scholar] [CrossRef]
- Robbins, R.; Affouf, M.; Seixas, A.; Beaugris, L.; Avirappattu, G.; Jean-Louis, G. Four-Year Trends in Sleep Duration and Quality: A Longitudinal Study Using Data from a Commercially Available Sleep Tracker. J. Med. Internet Res. 2020, 22, e14735. [Google Scholar] [CrossRef]
- Taylor, D.J.; Lichstein, K.L.; Durrence, H.H. Insomnia as a Health Risk Factor. Behav. Sleep Med. 2003, 227–247. [Google Scholar] [CrossRef]
- Brindle, R.C.; Conklin, S.M. Daytime sleep accelerates cardiovascular recovery after psychological stress. Int. J. Behav. Med. 2012, 19, 111–114. [Google Scholar] [CrossRef]
- Palma, J.A.; Urrestarazu, E.; Iriarte, J. Sleep loss as risk factor for neurologic disorders: A review. Sleep Med. 2013, 14, 229–236. [Google Scholar] [CrossRef]
- Harvey, A.G.; Stinson, K.; Whitaker, K.L.; Moskovitz, D.; Virk, H. The subjective meaning of sleep quality: A comparison of individuals with and without insomnia. Sleep 2008, 31, 383–393. [Google Scholar] [CrossRef] [PubMed]
- Kyle, S.D.; Morgan, K.; Espie, C.A. Insomnia and health-related quality of life. Sleep Med. Rev. 2010, 14, 69–82. [Google Scholar] [CrossRef] [PubMed]
- Drake, C.L.; Roehrs, T.; Roth, T. Insomnia causes, consequences, and therapeutics: An overview. Depress. Anxiety 2003, 18, 163–176. [Google Scholar] [CrossRef] [PubMed]
- Jacobson, B.H.; Gemmell, H.A.; Hayes, B.M.; Altena, T.S. Effectiveness of a selected bedding system on quality of sleep, low back pain, shoulder pain, and spine stiffness. J. Manip. Physiol. Ther. 2002, 25, 88–92. [Google Scholar] [CrossRef] [PubMed]
- Jacobson, B.H.; Wallace, T.; Gemmell, H. Subjective rating of perceived back pain, stiffness and sleep quality following introduction of medium-firm bedding systems. J. Chiropr. Med. 2006, 5, 128–134. [Google Scholar] [CrossRef]
- Lee, H.; Park, S. Quantitative effects of mattress types (comfortable vs. uncomfortable) on sleep quality through polysomnography and skin temperature. Int. J. Ind. Ergon. 2006, 36, 943–949. [Google Scholar] [CrossRef]
- Jacobson, B.H.; Wallace, T.J.; Smith, D.B.; Kolb, T. Grouped comparisons of sleep quality for new and personal bedding systems. Appl. Ergon. 2008, 39, 247–254. [Google Scholar] [CrossRef]
- Li, X.; Zhou, B.; Shen, L.; Wu, Z. Exploring the effect of mattress cushion materials on human–mattress interface temperatures, pre-sleep thermal state and sleep quality. Indoor Built Environ. 2020, 1–15. [Google Scholar] [CrossRef]
- Lan, L.; Tsuzuki, K.; Liu, Y.F.; Lian, Z.W. Thermal environment and sleep quality: A review. Energy Build. 2017, 149, 101–113. [Google Scholar] [CrossRef]
- Moon, I.; Kang, S.J.; Kim, G.S.; Mun, M.S. Control of air-cell mattress for preventing pressure ulcer based on approximate anthropometric model. In Proceedings of the 2005 IEEE 9th International Conference on Rehabilitation Robotics, Chicago, IL, USA, 28 June–1 July 2005; pp. 164–167. [Google Scholar] [CrossRef]
- Li, X.; Shen, L.; Califano, R. The comparative study of thermal comfort and sleep quality for innovative designed mattress in hot weather. Sci. Technol. Built Environ. 2020, 26, 643–657. [Google Scholar] [CrossRef]
- Bader, G.G.; Engdal, S. The influence of bed firmness on sleep quality. Appl. Ergon. 2000, 31, 487–497. [Google Scholar] [CrossRef]
- Kovacs, F.M.; Abraira, V.; Peña, A.; Martín-Rodríguez, J.G.; Sánchez-Vera, M.; Ferrer, E.; Ruano, D.; Guillén, P.; Gestoso, M.; Muriel, A.; et al. Effect of firmness of mattress on chronic non-specific low-back pain: Randomised, double-blind, controlled, multicentre trial. Lancet 2003, 362, 1599–1604. [Google Scholar] [CrossRef]
- Tonetti, L.; Martoni, M.; Natale, V. Effects of different mattresses on sleep quality in healthy subjects: An actigraphic study. Biol. Rhythm Res. 2011, 42, 89–97. [Google Scholar] [CrossRef]
- Okamoto, K.; Nakabayashi, K.; Mizuno, K.; Okudaira, N. Effects of truss mattress upon sleep and bed climate. Appl. Hum. Sci. J. Physiol. Anthropol. 1998, 17, 233–237. [Google Scholar] [CrossRef] [PubMed]
- Wu, F.G.; Shen, T.Y.; Tan, S.H. An innovative Mattress design to improve sleep quality and thermal comfort. In International Conference on Human-Computer Interaction; LNCS 10902; Springer: Cham, Switzerland, 2018; pp. 228–237. [Google Scholar] [CrossRef]
- Kim, J.Y.; Min, S.N.; Lee, M.H.; Jeong, J.H.; An, J.H.; Shin, Y.S. Measurement of user experience to select a comfortable mattress. In International Conference of Design, User Experience, and Usability; 6770 LNCS; Springer: Berlin/Heidelberg, Germany, 2011; pp. 449–458. [Google Scholar] [CrossRef]
- Park, S.J.; Kim, J.S.; Kim, C.B. Comfort evaluation and bed adjustment according to sleeping positions. Hum. Factors Ergon. Manuf. Serv. Ind. 2009, 19, 145–157. [Google Scholar] [CrossRef]
- Yoshida, H.; Kamijo, M.; Shimizu, Y. A Study to Investigate the Sleeping Comfort of Mattress using Finite Element Method. Kansei Eng. Int. J. 2012, 11, 155–162. [Google Scholar] [CrossRef][Green Version]
- Doi, Y.; Minowa, M.; Uchiyama, M.; Okawa, M. Subjective sleep quality and sleep problems in the general Japanese adult population. Psychiatry Clin. Neurosci. 2001, 55, 213–215. [Google Scholar] [CrossRef]
- Tang, N.K.; Anne Schmidt, D.; Harvey, A.G. Sleeping with the enemy: Clock monitoring in the maintenance of insomnia. J. Behav. Ther. Exp. Psychiatry 2007, 38, 40–55. [Google Scholar] [CrossRef]
- Buysse, D.J.; Reynolds, C.F.; Monk, T.H.; Berman, S.R.; Kupfer, D. The Pittsburgh Sleep Quality Index: A New Instrument for Psychiatric Practice and Research. Psychiatry Res. 1989, 28, 193–213. [Google Scholar] [CrossRef]
- Landolt, H.P.; Dijk, D.J.; Gaus, S.E.; Borbély, A.A. Caffeine reduces low-frequency delta activity in the human sleep EEG. Neuropsychopharmacology 1995, 12, 229–238. [Google Scholar] [CrossRef]
- Ebrahim, I.O.; Shapiro, C.M.; Williams, A.J.; Fenwick, P.B. Alcohol and Sleep I: Effects on Normal Sleep. Alcohol. Clin. Exp. Res. 2013, 37, 539–549. [Google Scholar] [CrossRef] [PubMed]
- Tang, N.K.; Harvey, A.G. Effects of cognitive arousal and physiological arousal on sleep perception. Sleep 2004, 27, 69–78. [Google Scholar] [CrossRef] [PubMed]
- Kim, Y. The 7th Size Korea Project; Technical Report; Agency for Technology and Standards, Chemistry and Service Standards Division, Korea, 10 December 2015; Available online: https://sizekorea.kr/page/report/1 (accessed on 16 September 2020).
- Hassan, A.R.; Bhuiyan, M.I.H. Automated identification of sleep states from EEG signals by means of ensemble empirical mode decomposition and random under sampling boosting. Comput. Methods Programs Biomed. 2017, 140, 201–210. [Google Scholar] [CrossRef]
- Sors, A.; Bonnet, S.; Mirek, S.; Vercueil, L.; Payen, J.F. A convolutional neural network for sleep stage scoring from raw single-channel EEG. Biomed. Signal Process. Control 2018, 42, 107–114. [Google Scholar] [CrossRef]
- Onton, J.A.; Kang, D.Y.; Coleman, T.P. Visualization of whole-night sleep EEG from 2-channel mobile recording device reveals distinct deep sleep stages with differential electrodermal activity. Front. Hum. Neurosci. 2016, 10, 605. [Google Scholar] [CrossRef]
- Herbst, E.; Metzler, T.J.; Lenoci, M.; McCaslin, S.E.; Inslicht, S.; Marmar, C.R.; Neylan, T.C. Adaptation effects to sleep studies in participants with and without chronic posttraumatic stress disorder. Psychophysiology 2010, 47, 1127–1133. [Google Scholar] [CrossRef] [PubMed]
- Teplan, M. Fundamentals of eeg measurement. Meas. Sci. Rev. 2002, 2, 1–11. [Google Scholar]
- Verhaert, V.; Haex, B.; de Wilde, T.; Berckmans, D.; Verbraecken, J.; de Valck, E.; van der Sloten, J. Ergonomics in bed design: The effect of spinal alignment on sleep parameters. Ergonomics 2011, 54, 169–178. [Google Scholar] [CrossRef]
- Xia, L.; Lan, L.; Tang, J.; Wan, Y.; Lin, Y.; Wang, Z. Bed heating improves the sleep quality and health of the elderly who adapted to no heating in a cold environment. Energy Build. 2020, 210, 109687. [Google Scholar] [CrossRef]
- Åkerstedt, T.; Hume, K.; Minors, D.; Waterhouse, J. The meaning of good sleep: A longitudinal study of polysomnography and subjective sleep quality. J. Sleep Res. 1994, 3, 152–158. [Google Scholar] [CrossRef]
- Mendonça, F.; Mostafa, S.S.; Morgado-Dias, F.; Ravelo-Garcia, A.G.; Penzel, T. A Review of Approaches for Sleep Quality Analysis. IEEE Access 2019, 7, 24527–24546. [Google Scholar] [CrossRef]
- Vertes, R.P.; Eastman, K.E. The case against memory consolidation in REM sleep. Behav. Brain Sci. 2000, 23, 867–876. [Google Scholar] [CrossRef]
- Sopp, M.R.; Michael, T.; Weeß, H.G.; Mecklinger, A. Remembering specific features of emotional events across time: The role of REM sleep and prefrontal theta oscillations. Cogn. Affect. Behav. Neurosci. 2017, 17, 1186–1209. [Google Scholar] [CrossRef]
- Léger, D.; Debellemaniere, E.; Rabat, A.; Bayon, V.; Benchenane, K.; Chennaoui, M. Slow-wave sleep: From the cell to the clinic. Sleep Med. Rev. 2018, 41, 113–132. [Google Scholar] [CrossRef] [PubMed]
- Onton, J.A.; Matthews, S.C.; Kang, D.Y.; Coleman, T.P. In-home sleep recordings in military veterans with posttraumatic stress disorder reveal less REM and deep sleep <1 Hz. Front. Hum. Neurosci. 2018, 12, 196. [Google Scholar] [CrossRef]
- Nainan, S.; Kulkarni, V. Synergy in voice and lip movement for automatic person recognition. IEIE Trans. Smart Process. Comput. 2019, 8, 279–289. [Google Scholar] [CrossRef]
- Cho, W.; Na, M.H.; Kim, S. Understanding human action using a Bayesian HMM with a continuous Gaussian-Wishart emission model. IEIE Trans. Smart Process. Comput. 2018, 7, 132–139. [Google Scholar] [CrossRef]
- Luo, G.; Yang, Z. The application of ECG cancellation in diaphragmatic electromyographic by using stationary wavelet transform. Biomed. Eng. Lett. 2018, 8, 259–266. [Google Scholar] [CrossRef]
- Kumar, A.; Komaragiri, R.; Kumar, M. Time–frequency localization using three-tap biorthogonal wavelet filter bank for electrocardiogram compressions. Biomed. Eng. Lett. 2019, 9, 407–411. [Google Scholar] [CrossRef]
- Lo, C.C.; Bartsch, R.P.; Ivanov, P.C. Asymmetry and basic pathways in sleep-stage transitions. EPL 2013, 102, 10008. [Google Scholar] [CrossRef]
- Rabiner, L.R.; Juang, B.H. An Introduction to Hidden Markov Models. IEEE ASSP Mag. 1986, 3, 4–16. [Google Scholar] [CrossRef]
- Stankiewicz, O.; Domański, M. Depth map estimation based on maximum a posteriori probability. IEIE Trans. Smart Process. Comput. 2018, 7, 49–61. [Google Scholar] [CrossRef]
- Kemp, B.; Zwinderman, A.H.; Tuk, B.; Kamphuisen, H.A.C.; Oberye, J.J.L. Analysis of a sleep-dependent neuronal feedback loop: The slow-wave microcontinuity of the EEG. IEEE Trans. Biomed. Eng. 2000, 47, 1185–1194. [Google Scholar] [CrossRef]
- Goldberger, A.; Amaral, L.; Glass, L.; Hausdorff, J.; Ivanov, P.C.; Mark, R.; Mietus, J.E.; Moody, G.B.; Peng, C.K.; Stanley, H.E. PhysioBank, PhysioToolkit, and PhysioNet: Components of a new research resource for complex physiologic signals. Circulation 2000, 101, e215–e220. [Google Scholar] [CrossRef]
- Sadeh, A.; Hauri, P.J.; Kripke, D.F.; Lavie, P. The role of actigraphy in the evaluation of sleep disorders. Sleep 1995, 18, 288–302. [Google Scholar] [CrossRef]
- Park, K.S.; Choi, S.H. Smart technologies toward sleep monitoring at home. Biomed. Eng. Lett. 2019, 9, 73–85. [Google Scholar] [CrossRef]
- Woolson, R.F. Wilcoxon Signed-Rank Test. In Wiley Encyclopedia of Clinical Trials; American Cancer Society: Atlanta, GA, USA, 2008; pp. 1–3. [Google Scholar] [CrossRef]
- Cheng, S.P.; Mei, H. A personalized sleep quality assessment mechanism based on sleep pattern analysis. In Proceedings of the 3rd International Conference on Innovations in Bio-Inspired Computing and Applications, IBICA 2012, Kaohsiung, Taiwan, 26–28 September 2012; pp. 133–138. [Google Scholar] [CrossRef]
- Shrivastava, D.; Jung, S.; Saadat, M.; Sirohi, R.; Crewson, K. How to interpret the results of a sleep study. J. Commun. Hosp. Intern. Med. Perspect. 2014, 4, 24983. [Google Scholar] [CrossRef] [PubMed]
- Reed, D.L.; Sacco, W.P. Measuring sleep efficiency: What should the denominator be? J. Clin. Sleep Med. 2016, 12, 263–266. [Google Scholar] [CrossRef]
- Chae, K.Y.; Kripke, D.F.; Poceta, J.S.; Shadan, F.; Jamil, S.M.; Cronin, J.W.; Kline, L.E. Evaluation of immobility time for sleep latency in actigraphy. Sleep Med. 2009, 10, 621–625. [Google Scholar] [CrossRef]


| Wake (%) | REM (%) | Light (%) | Deep (%) | |
|---|---|---|---|---|
| Accuracy | 87.72 | 86.97 | 77.15 | 89.58 |
| Precision | 65.18 | 61.16 | 92.02 | 58.59 |
| Recall | 80.52 | 83.46 | 60.27 | 87.19 |
| F1 score | 72.05 | 70.63 | 72.85 | 72.09 |
| Mean (SD) | ||||
|---|---|---|---|---|
| A | S | SH | ||
| Actigraphy | SE (%) | 91.08 (8.82) | 91.32 (5.81) | 92.80 (6.01) |
| TST (min) | 382.57 (37.04) | 383.56 (24.40) | 389.77 (25.25) | |
| SOL (min) | 1.1 (0.31) | 1.2 (0.62) | 1.0 (0) | |
| WASO (min) | 36.1 (35.64) | 35.6 (24.29) | 30.2 (25.33) | |
| EEG | SE (%) | 74.87 (8.08) | 72.54 (9.30) | 75.18 (8.30) |
| TST (min) | 314.45 (33.95) | 304.66 (39.04) | 315.75 (34.86) | |
| SOL (min) * | 4.05 (4.28) | 7.33 (13.02) | 7.4 (6.32) | |
| WASO (min) | 102.63 (34.67) | 109.15 (31.53) | 97.98 (34.37) | |
| Questionnaire | Depth * | 5.0 (1.38) | 4.7 (1.53) | 4.1 (1.25) |
| Length ** | 5.2 (0.89) | 4.8 (1.70) | 3.6 (1.47) | |
| Mean (SD) | |||||
|---|---|---|---|---|---|
| A | S | SH | |||
| Poor sleeper | Subjective | Depth | 5.4(1.26) | 5.2(1.23) | 4.2(1.23) |
| Length * | 5.6 (5.16) | 5.4 (1.26) | 4.6 (1.08) | ||
| Objective | REM ** | 58.03 (12.03) | 66.82 (16.94) | 81.05 (20.39) | |
| Deep | 101.08 (17.38) | 85.00 (19.01) | 84.95 (31.58) | ||
| RNR * | 23.87 (8.65) | 34.66 (18.32) | 36.65 (14.20) | ||
| SSI ** | 15.23 (8.03) | 14.64 (8.01) | 8.80 (1.75) | ||
| Good sleeper | Subjective | Depth | 4.6 (1.43) | 4.2 (1.69) | 4.0 (1.33) |
| Length ** | 4.8 (1.03) | 4.2 (1.93) | 2.6 (1.08) | ||
| Objective | REM | 73.51 (13.13) | 74.51 (22.69) | 76.81 (20.14) | |
| Deep | 101.68 (19.52) | 105.42 (12.50) | 100.03 (17.67) | ||
| RNR | 30.79 (6.19) | 30.58 (12.31) | 33.09 (13.21) | ||
| SSI | 12.34 (4.90) | 13.71 (4.17) | 14.03 (6.12) | ||
| ACT-SE | ACT-TST | ACT-SOL | ACT-WASO | REM | Deep | |
|---|---|---|---|---|---|---|
| Depth | −0.2400 | −0.2400 | −0.0674 | 0.2269 | 0.0781 | −0.0695 |
| Length | −0.1532 | −0.1532 | 0.0024 | 0.1382 | −0.1429 | 0.1398 |
| EEG-SE | EEG-TST | EEG-SOL | EEG-WASO | RNR | SSI | |
| Depth | 0.2733 | 0.0163 | −0.0717 | −0.0137 | 0.0375 | 0.0773 |
| Length | 0.0419 | 0.0419 | −0.2076 | 0.0084 | −0.1700 | −0.1204 |
© 2020 by the authors. Licensee MDPI, Basel, Switzerland. This article is an open access article distributed under the terms and conditions of the Creative Commons Attribution (CC BY) license (http://creativecommons.org/licenses/by/4.0/).
Share and Cite
Yu, H.; Shin, O.-S.; Kim, S.; Park, C. Effect of an Inflatable Air Mattress with Variable Rigidity on Sleep Quality. Sensors 2020, 20, 5317. https://doi.org/10.3390/s20185317
Yu H, Shin O-S, Kim S, Park C. Effect of an Inflatable Air Mattress with Variable Rigidity on Sleep Quality. Sensors. 2020; 20(18):5317. https://doi.org/10.3390/s20185317
Chicago/Turabian StyleYu, Hyunsoo, Oh-Soon Shin, Sayup Kim, and Cheolsoo Park. 2020. "Effect of an Inflatable Air Mattress with Variable Rigidity on Sleep Quality" Sensors 20, no. 18: 5317. https://doi.org/10.3390/s20185317
APA StyleYu, H., Shin, O.-S., Kim, S., & Park, C. (2020). Effect of an Inflatable Air Mattress with Variable Rigidity on Sleep Quality. Sensors, 20(18), 5317. https://doi.org/10.3390/s20185317