Simple Wireless Impedance Pneumography System for Unobtrusive Sensing of Respiration †

 ,
,  ,
,  , , and
Abstract
1. Introduction
2. Impedance Pneumography Measurement Device
2.1. Safety Considerations
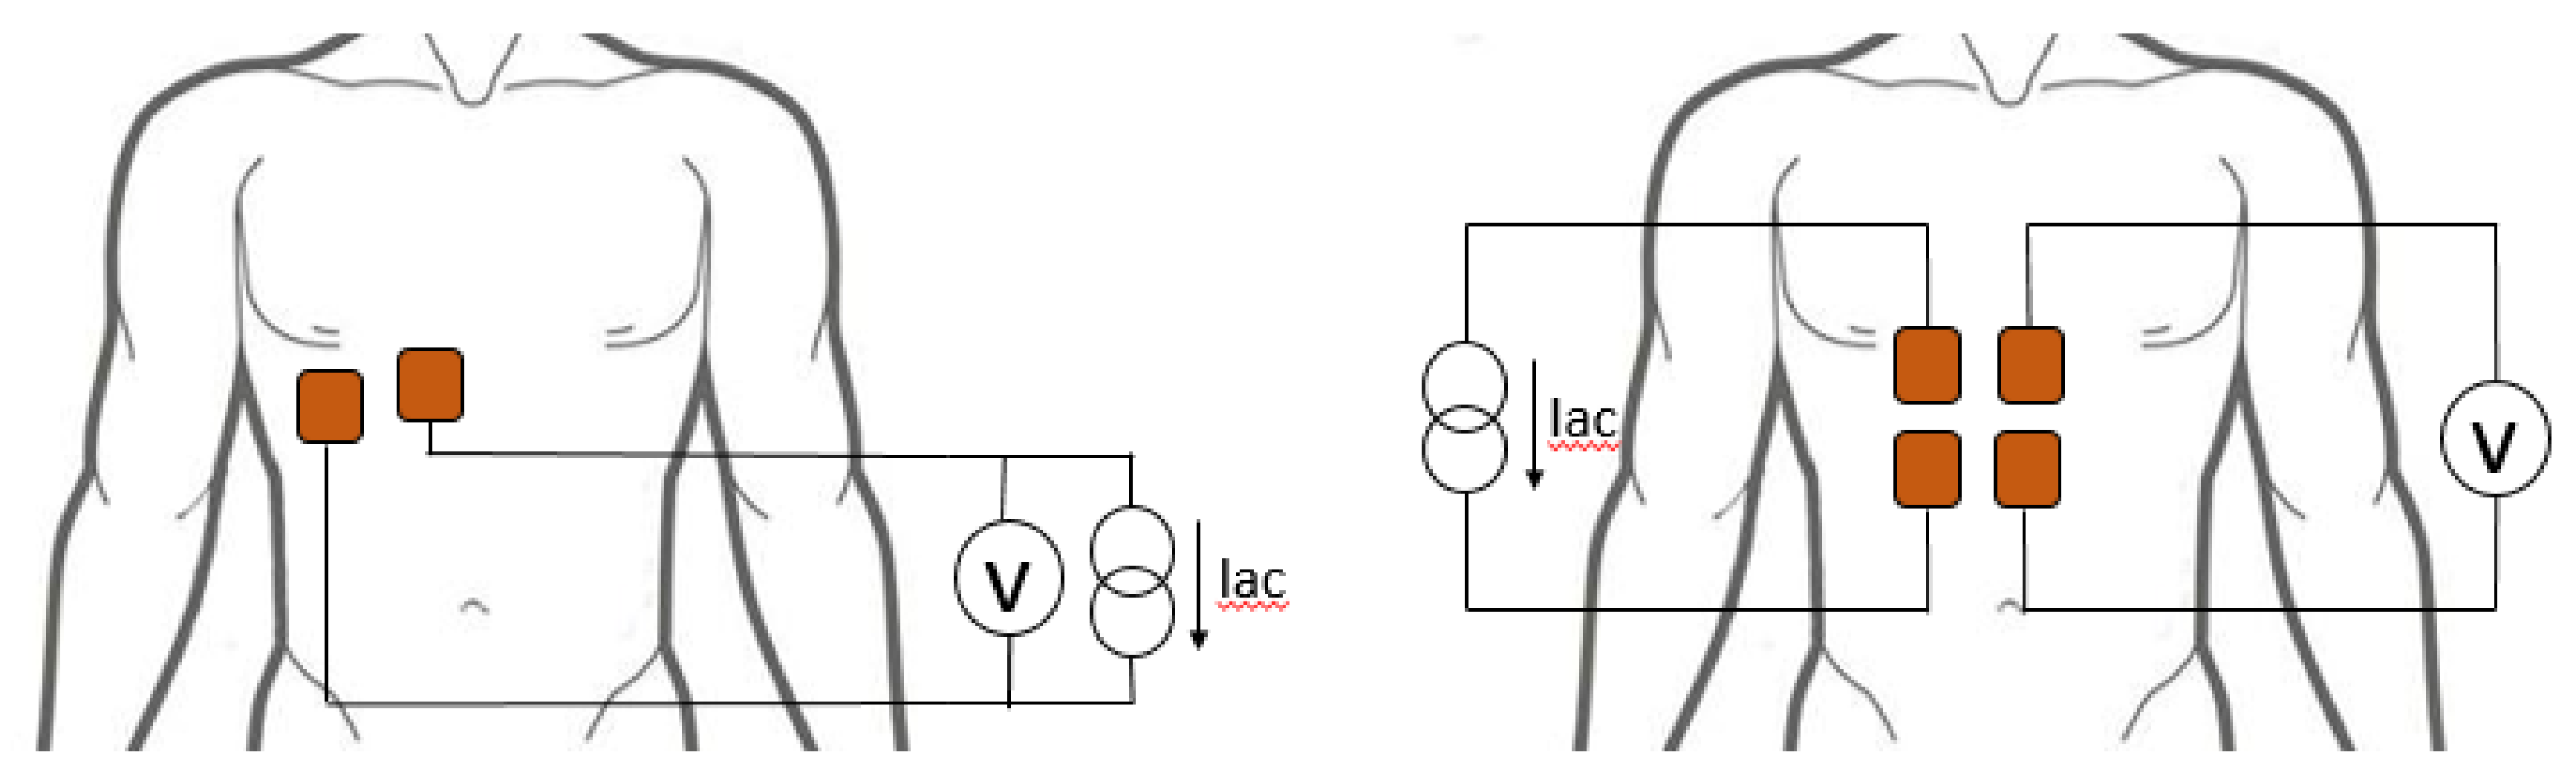
2.2. Electrode Configuration
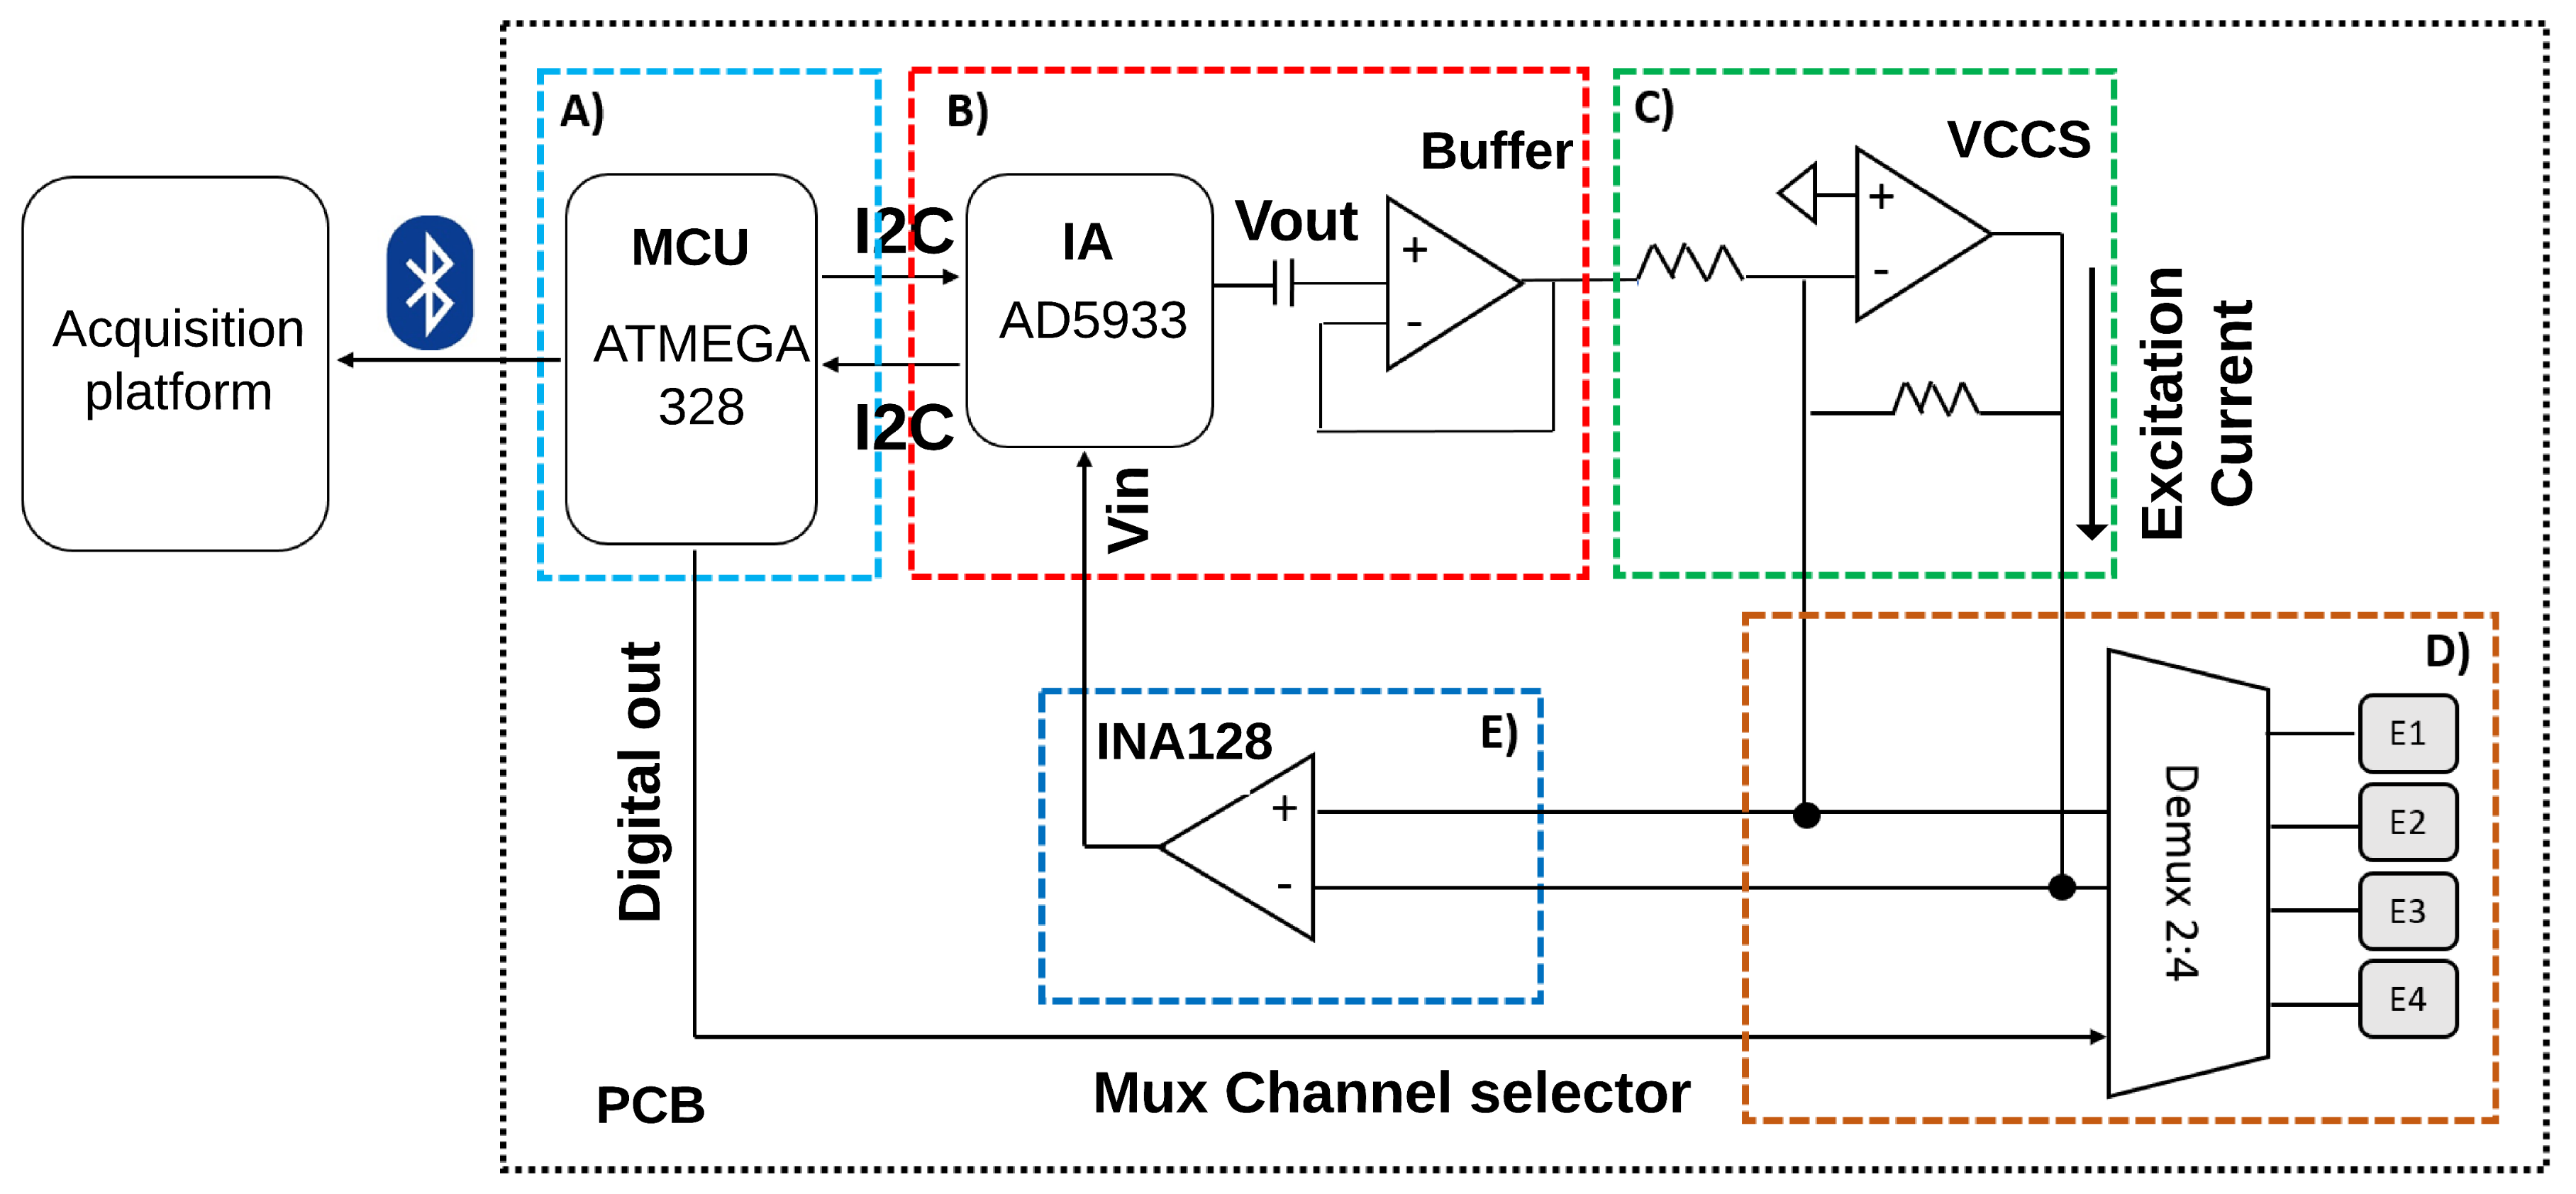
2.3. Hardware Design
2.3.1. Control Stage
2.3.2. Excitation Signal Generation Stage
2.3.3. Distribution and Acquisition of the Excitation Signal
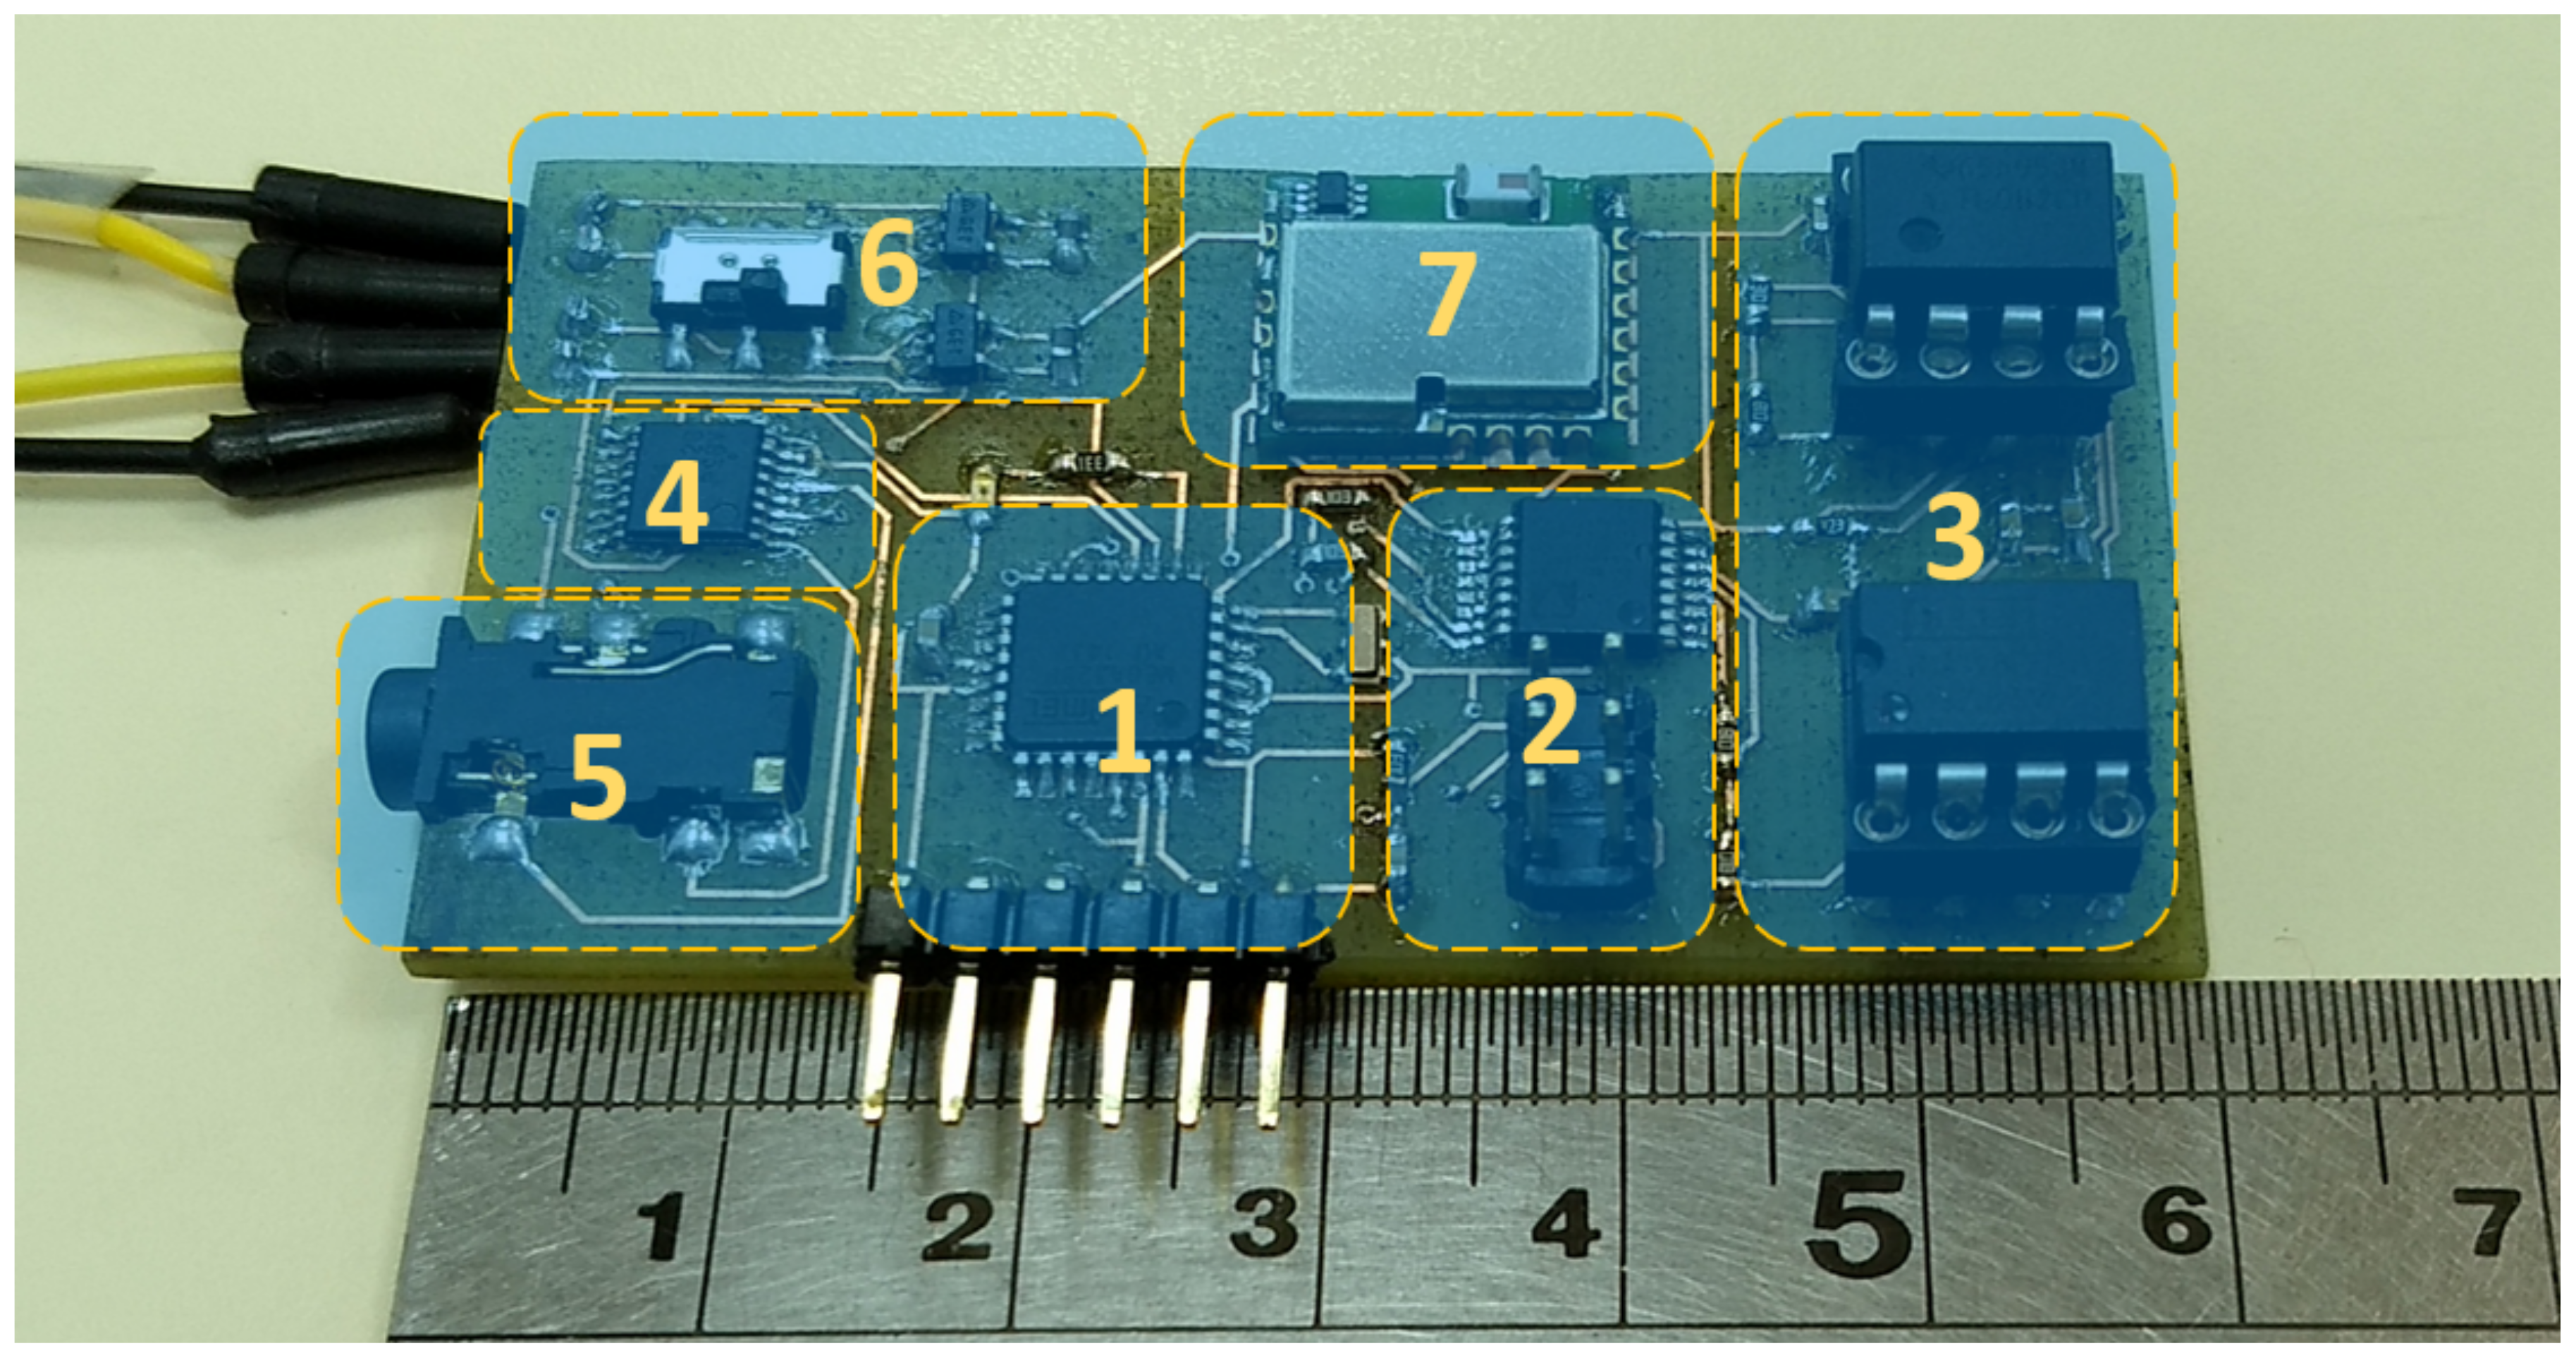
2.4. Implementation
2.4.1. Bioimpedance Pcb
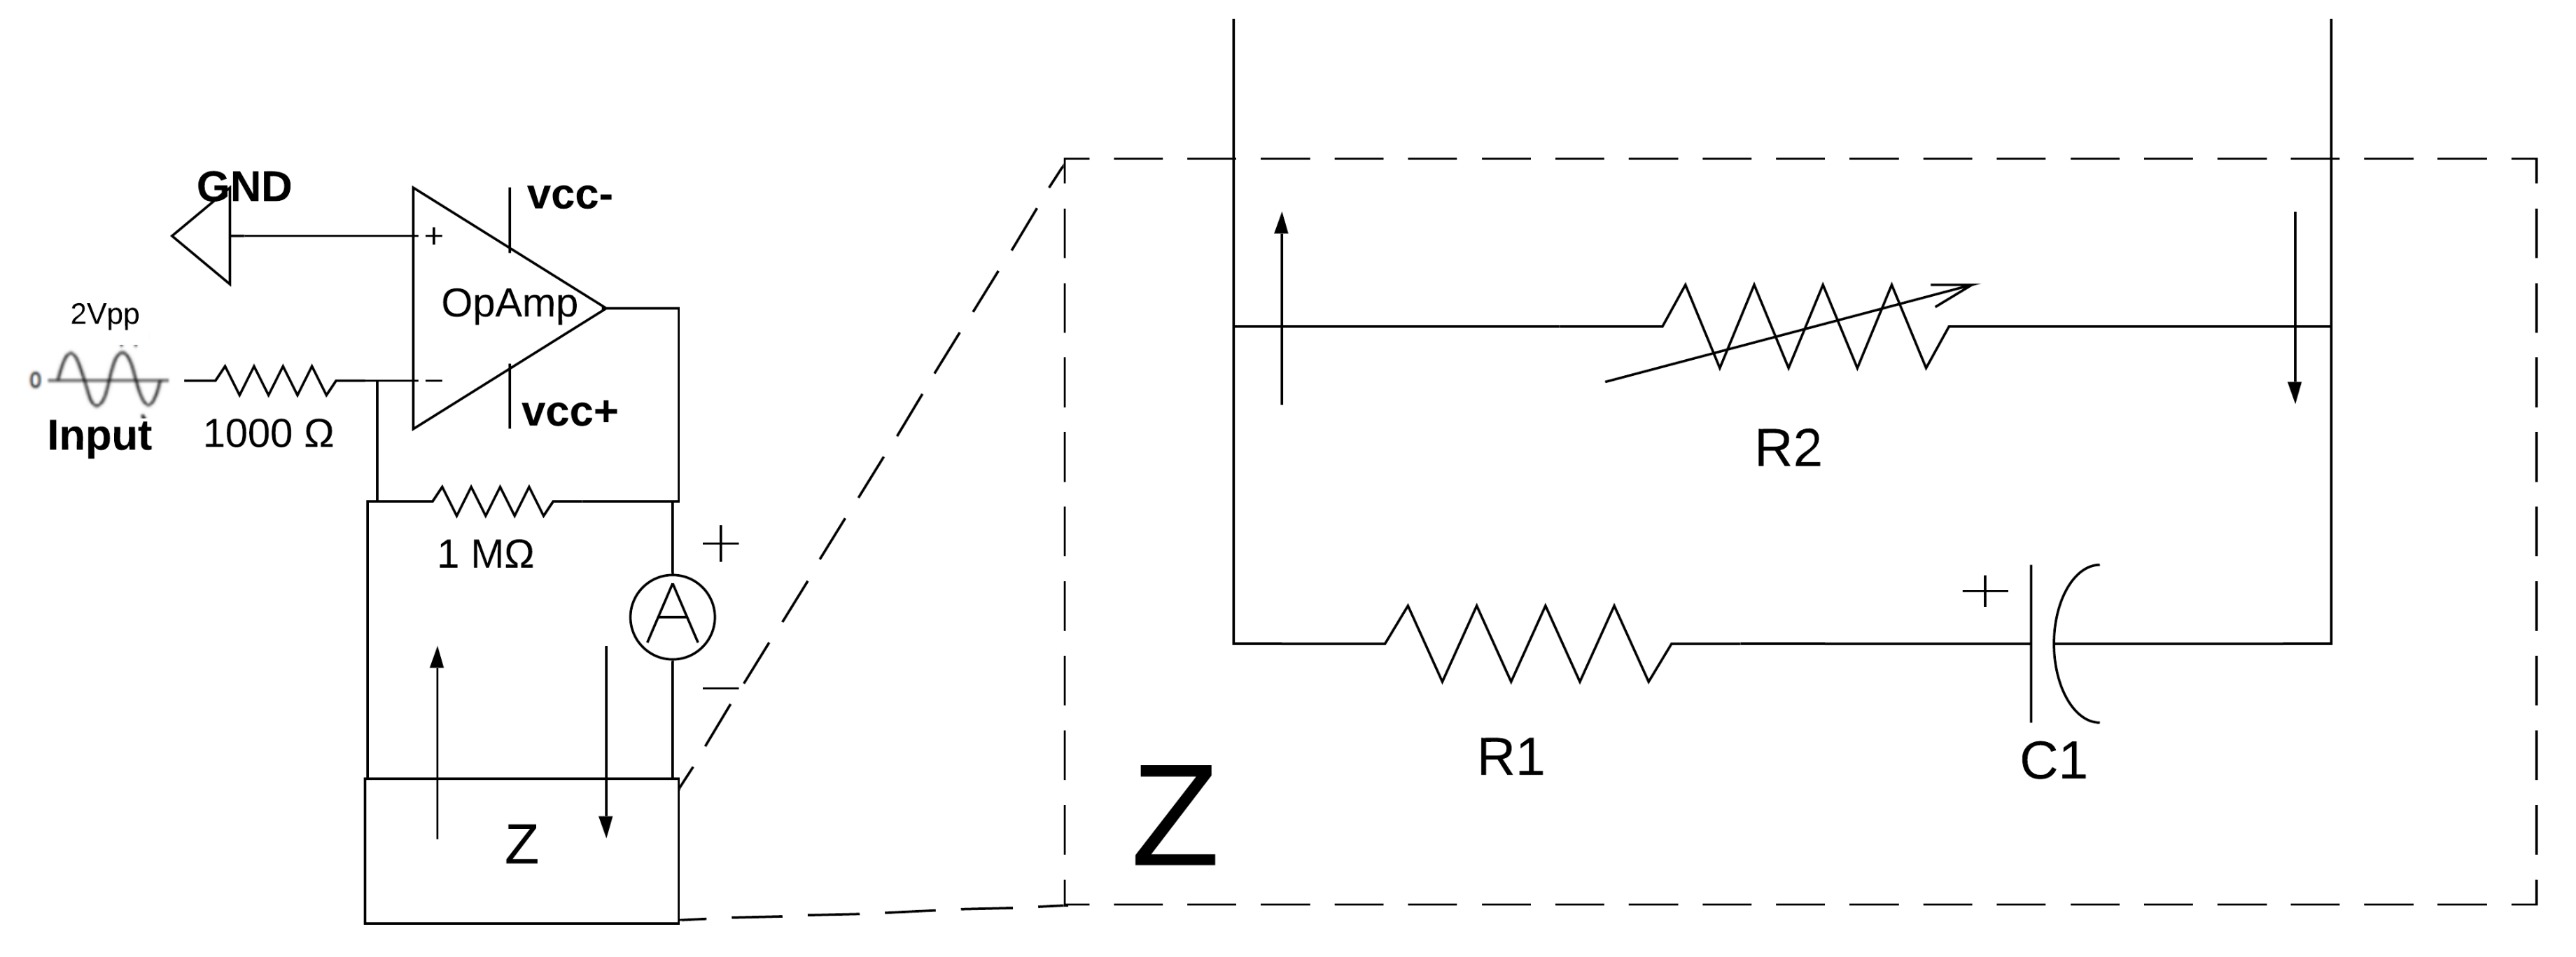
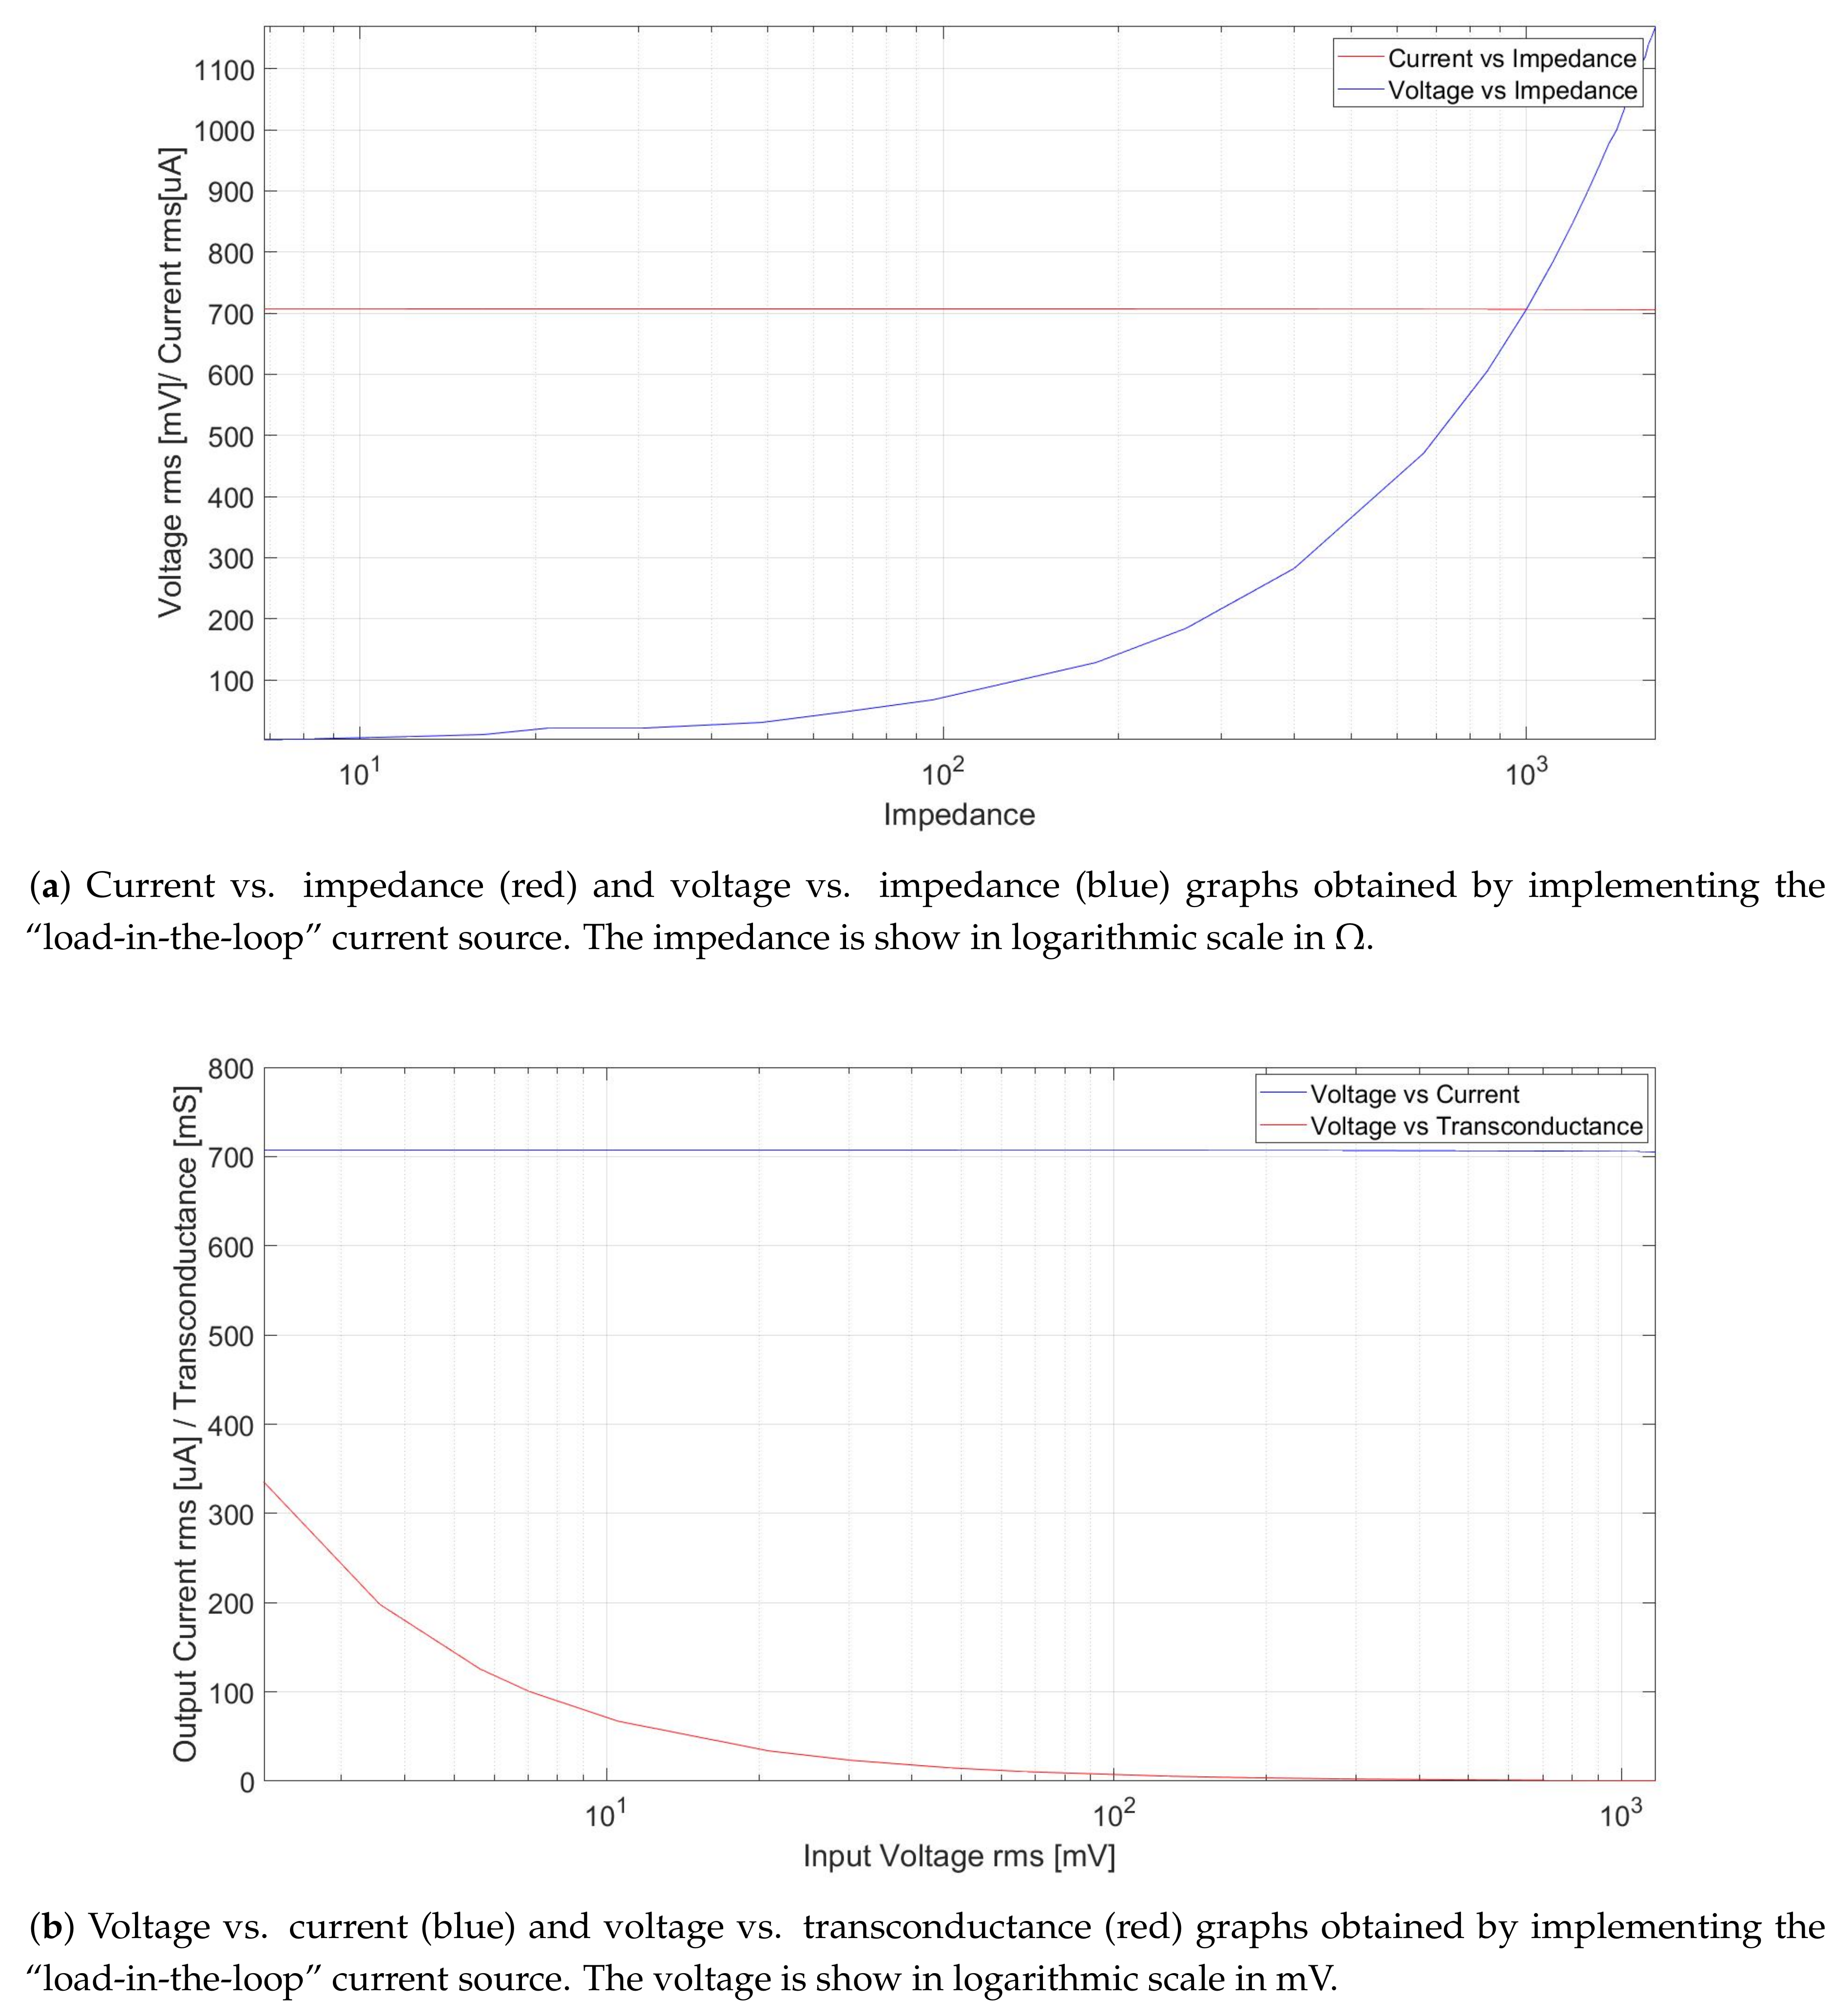
2.4.2. Vccs Testing
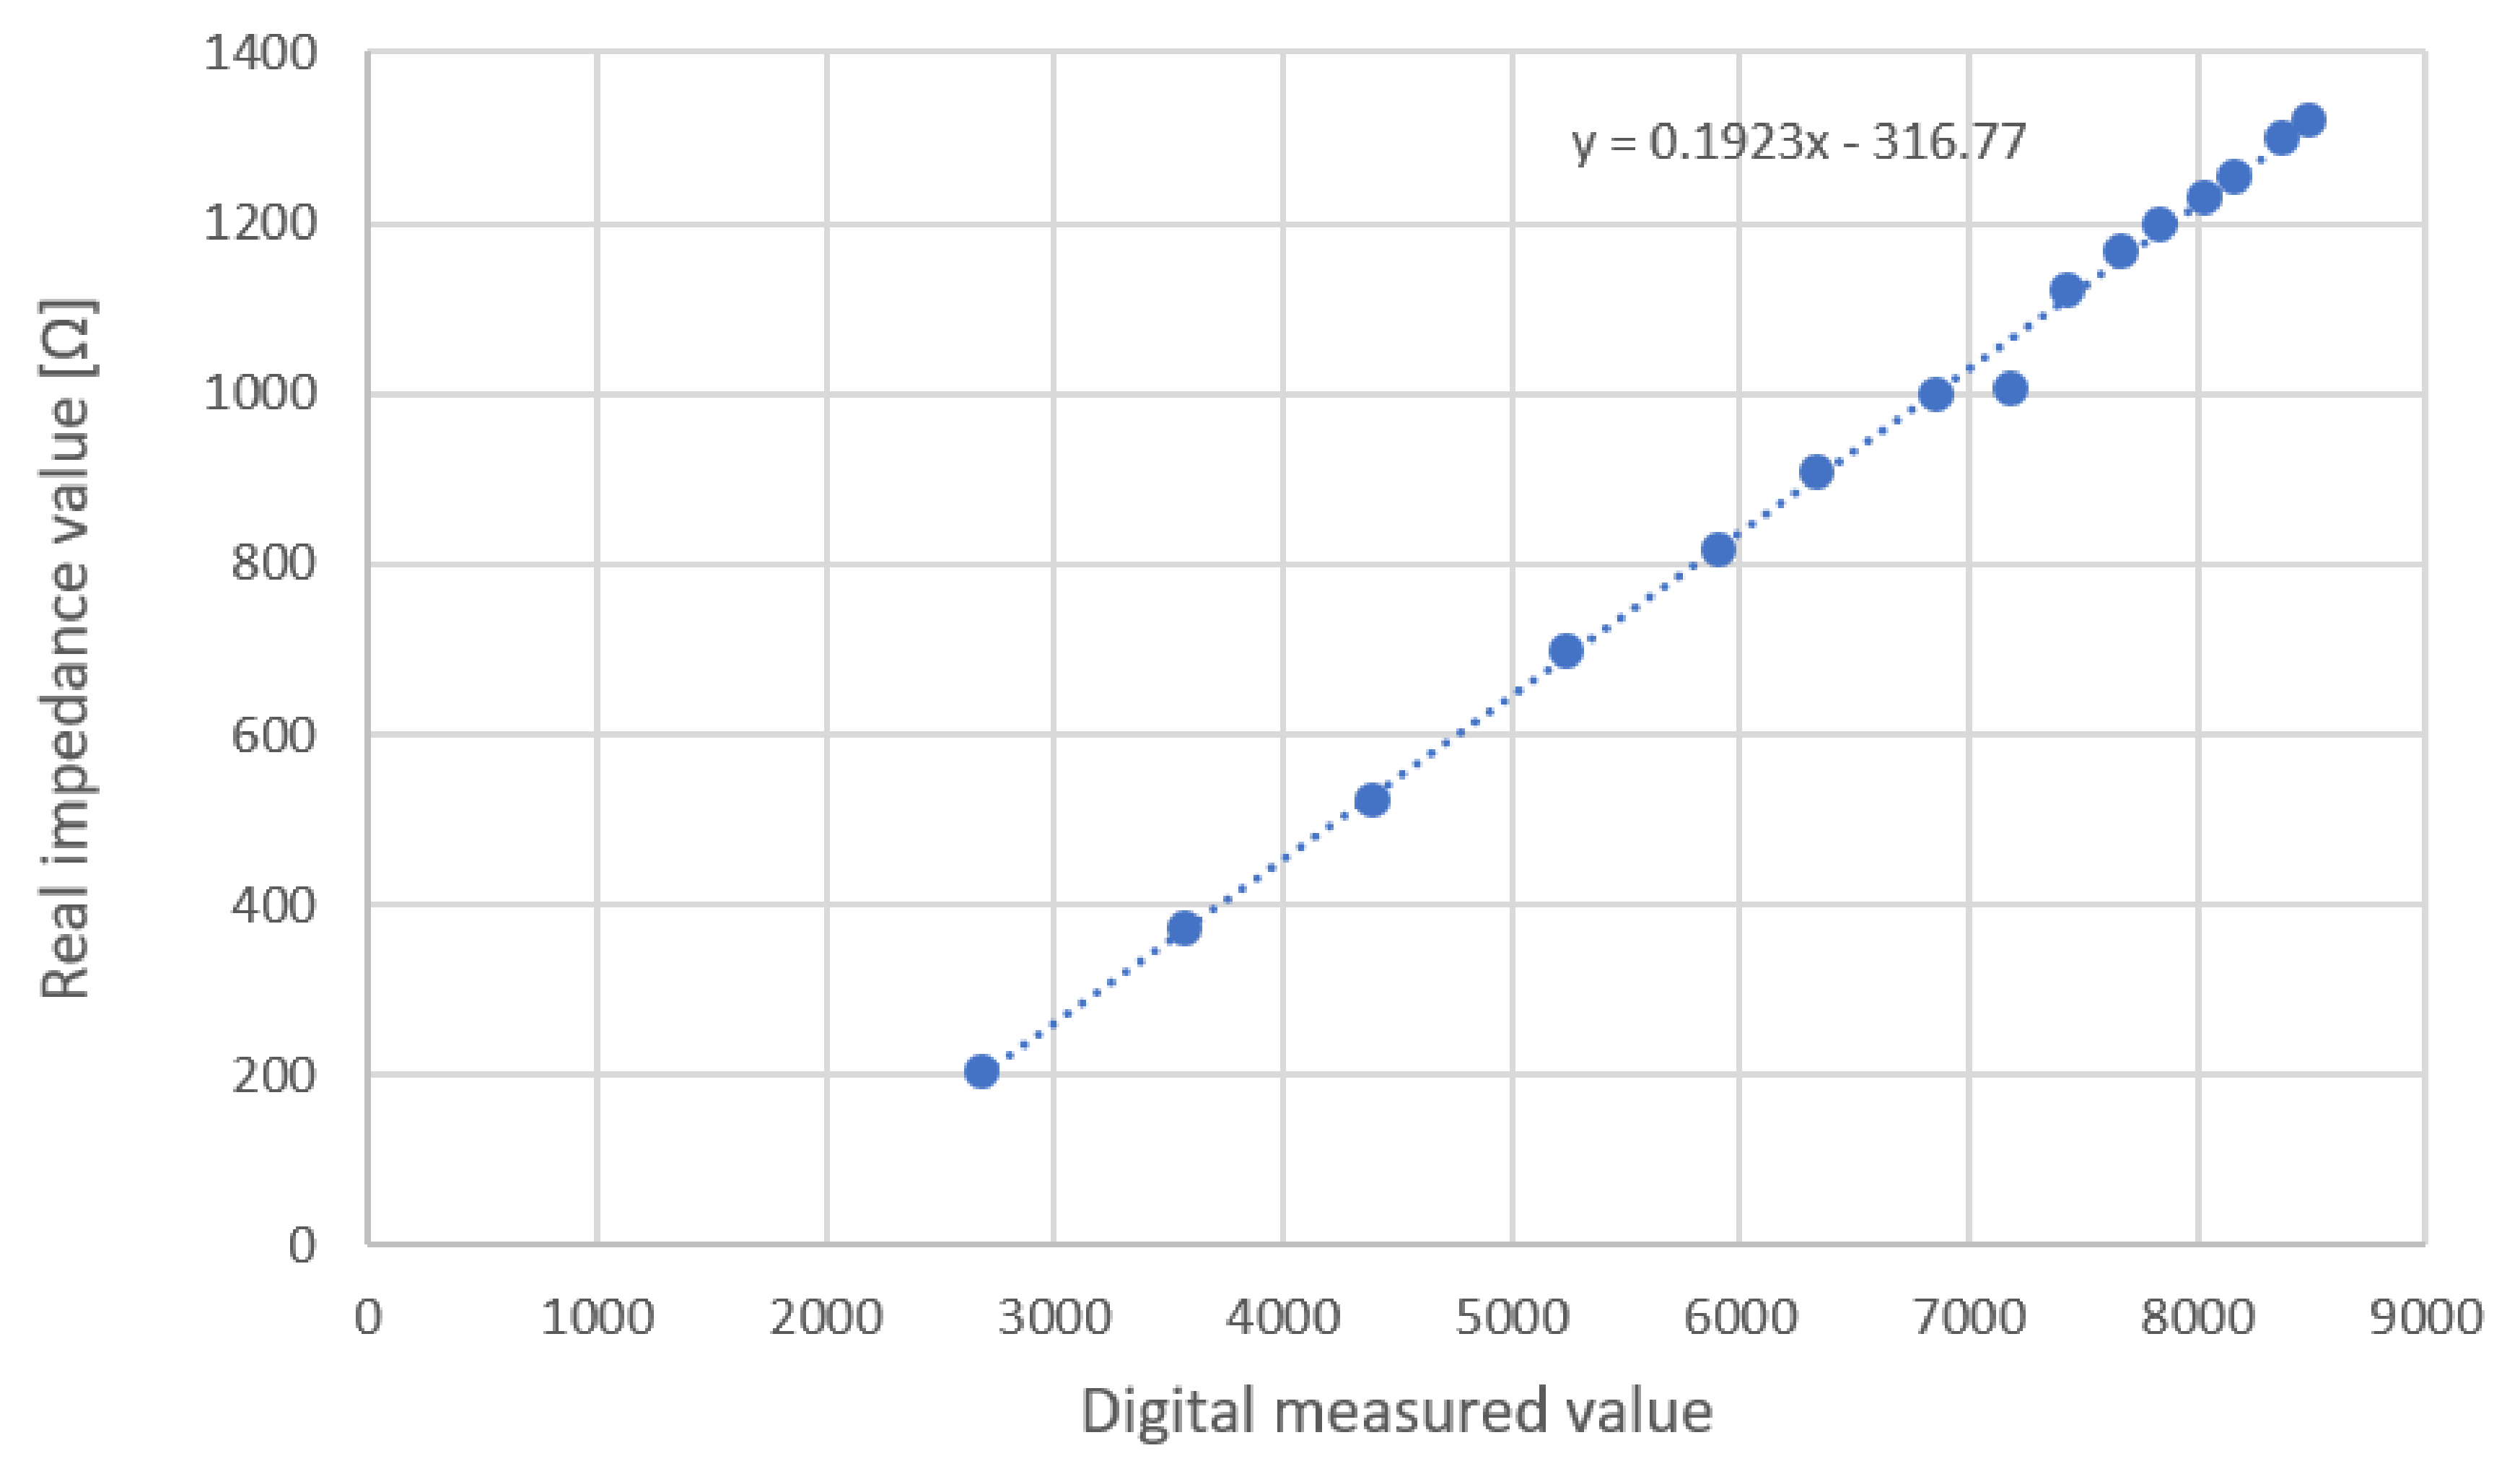
2.4.3. Calibration
3. Acquisition and Processing
3.1. Volunteer Enrollment
3.2. Measurement Protocol
- Uncover the thorax of the volunteer.
- Clean the area where the four electrodes will be positioned with alcohol-soaked cotton to eliminate any traces of creams and grease.
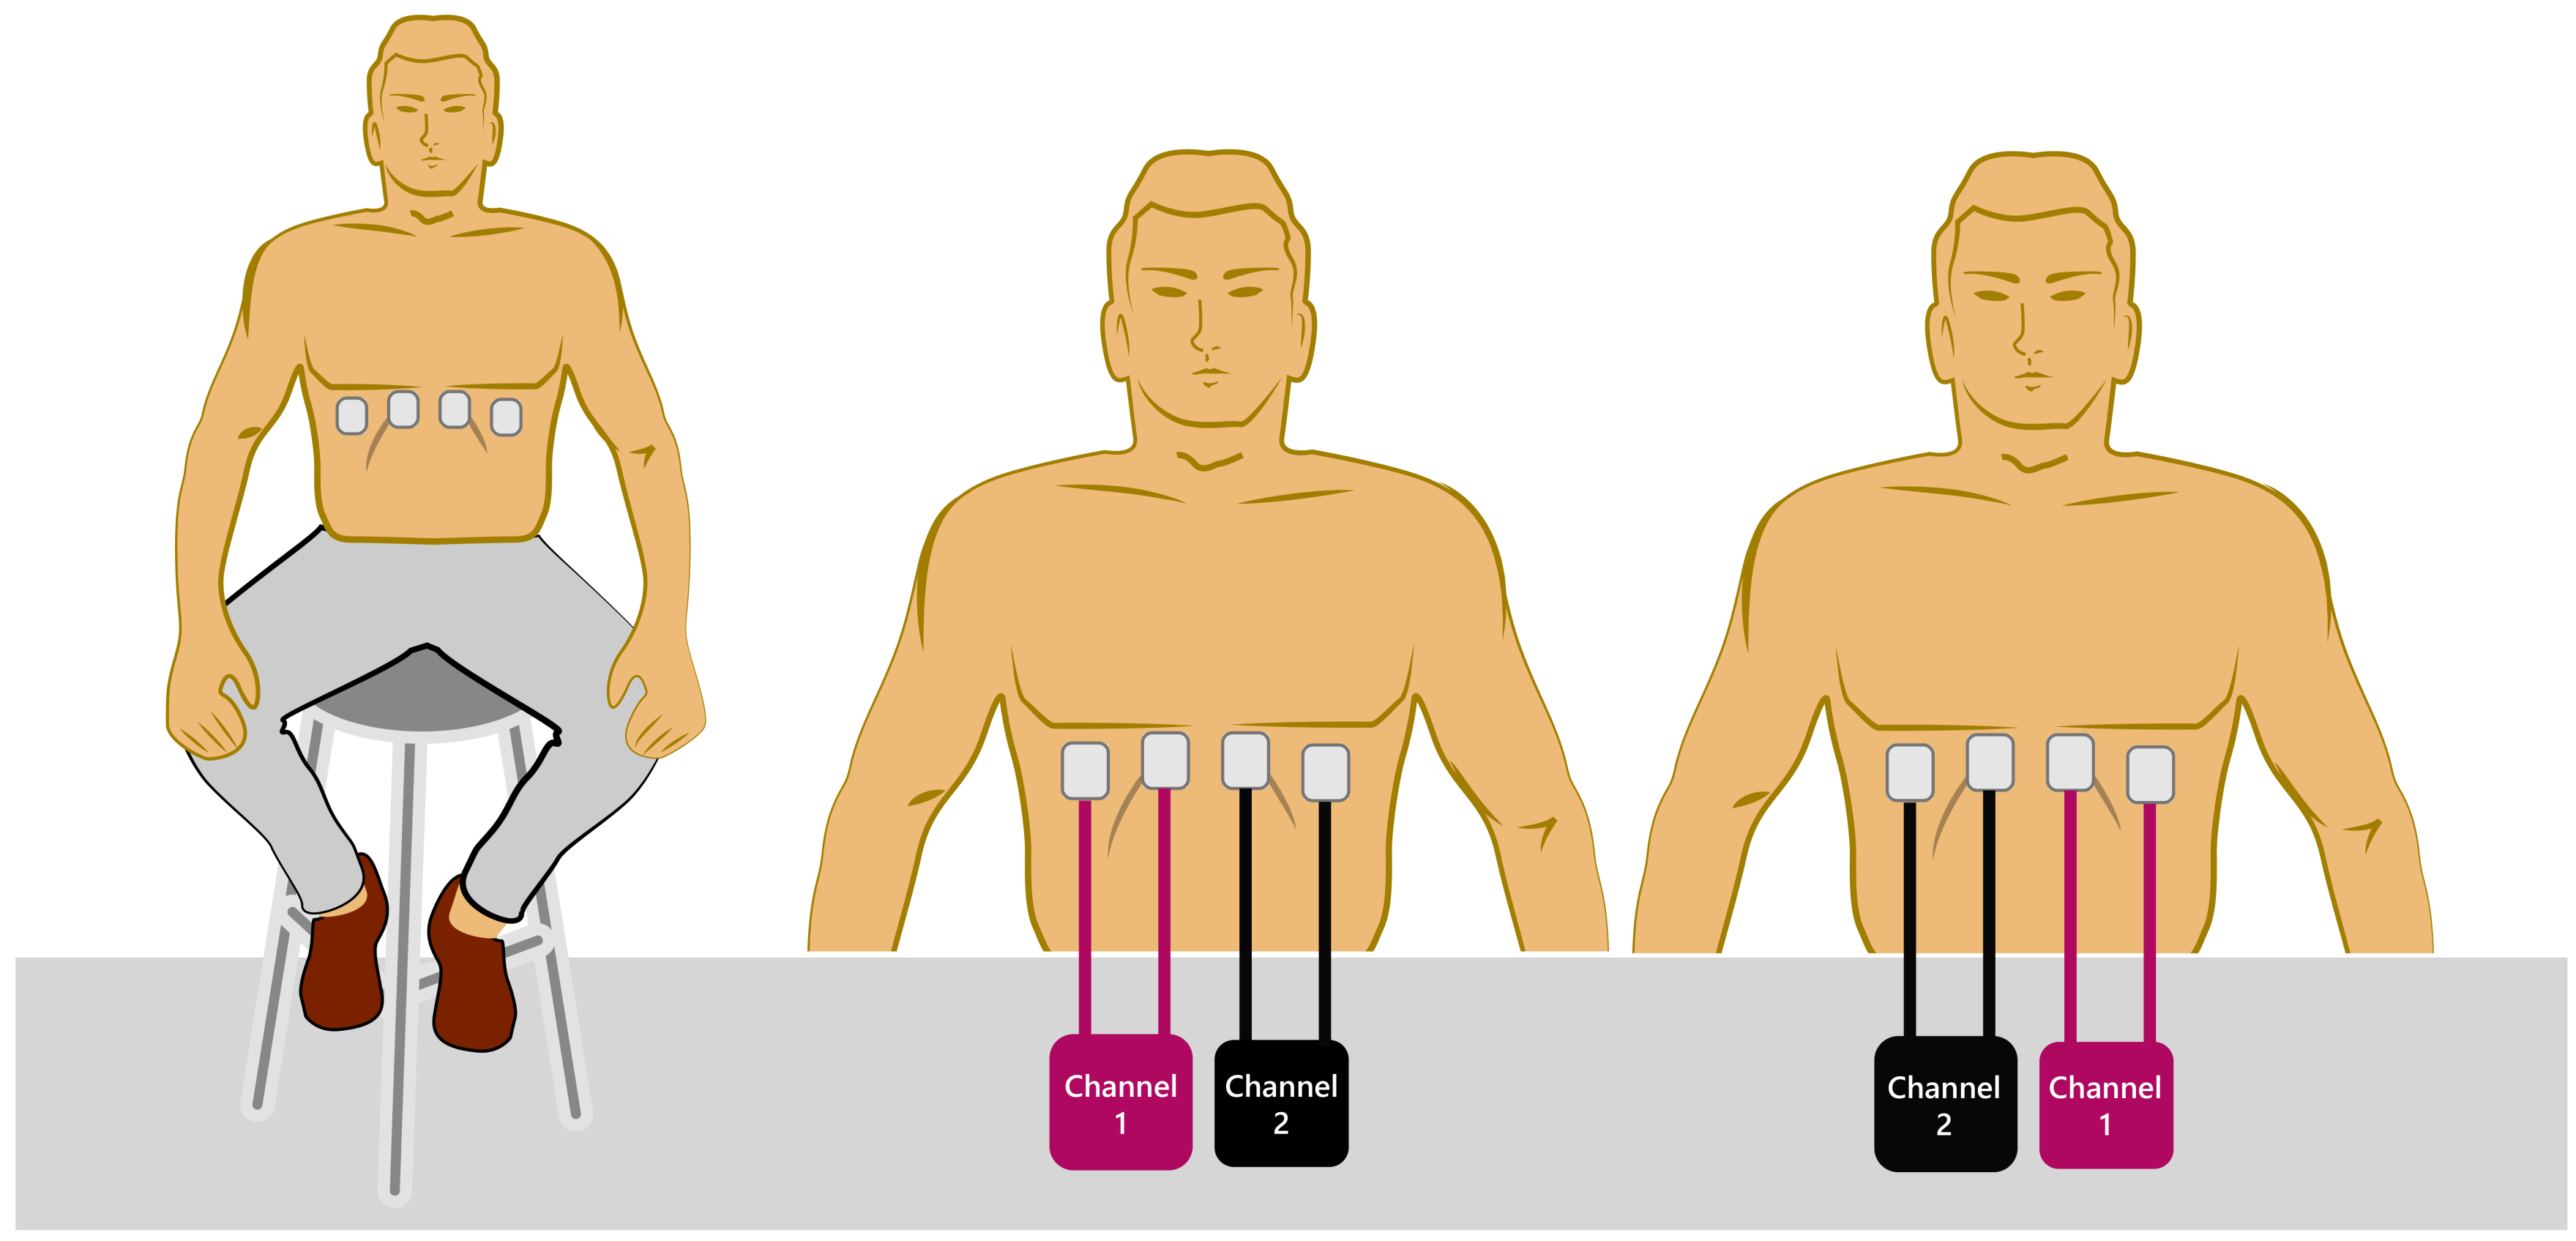
- Two electrodes were symmetrically placed in the left ventral chest and two in the right ventral chest (Figure 7).
- Sit the volunteer in a chair.
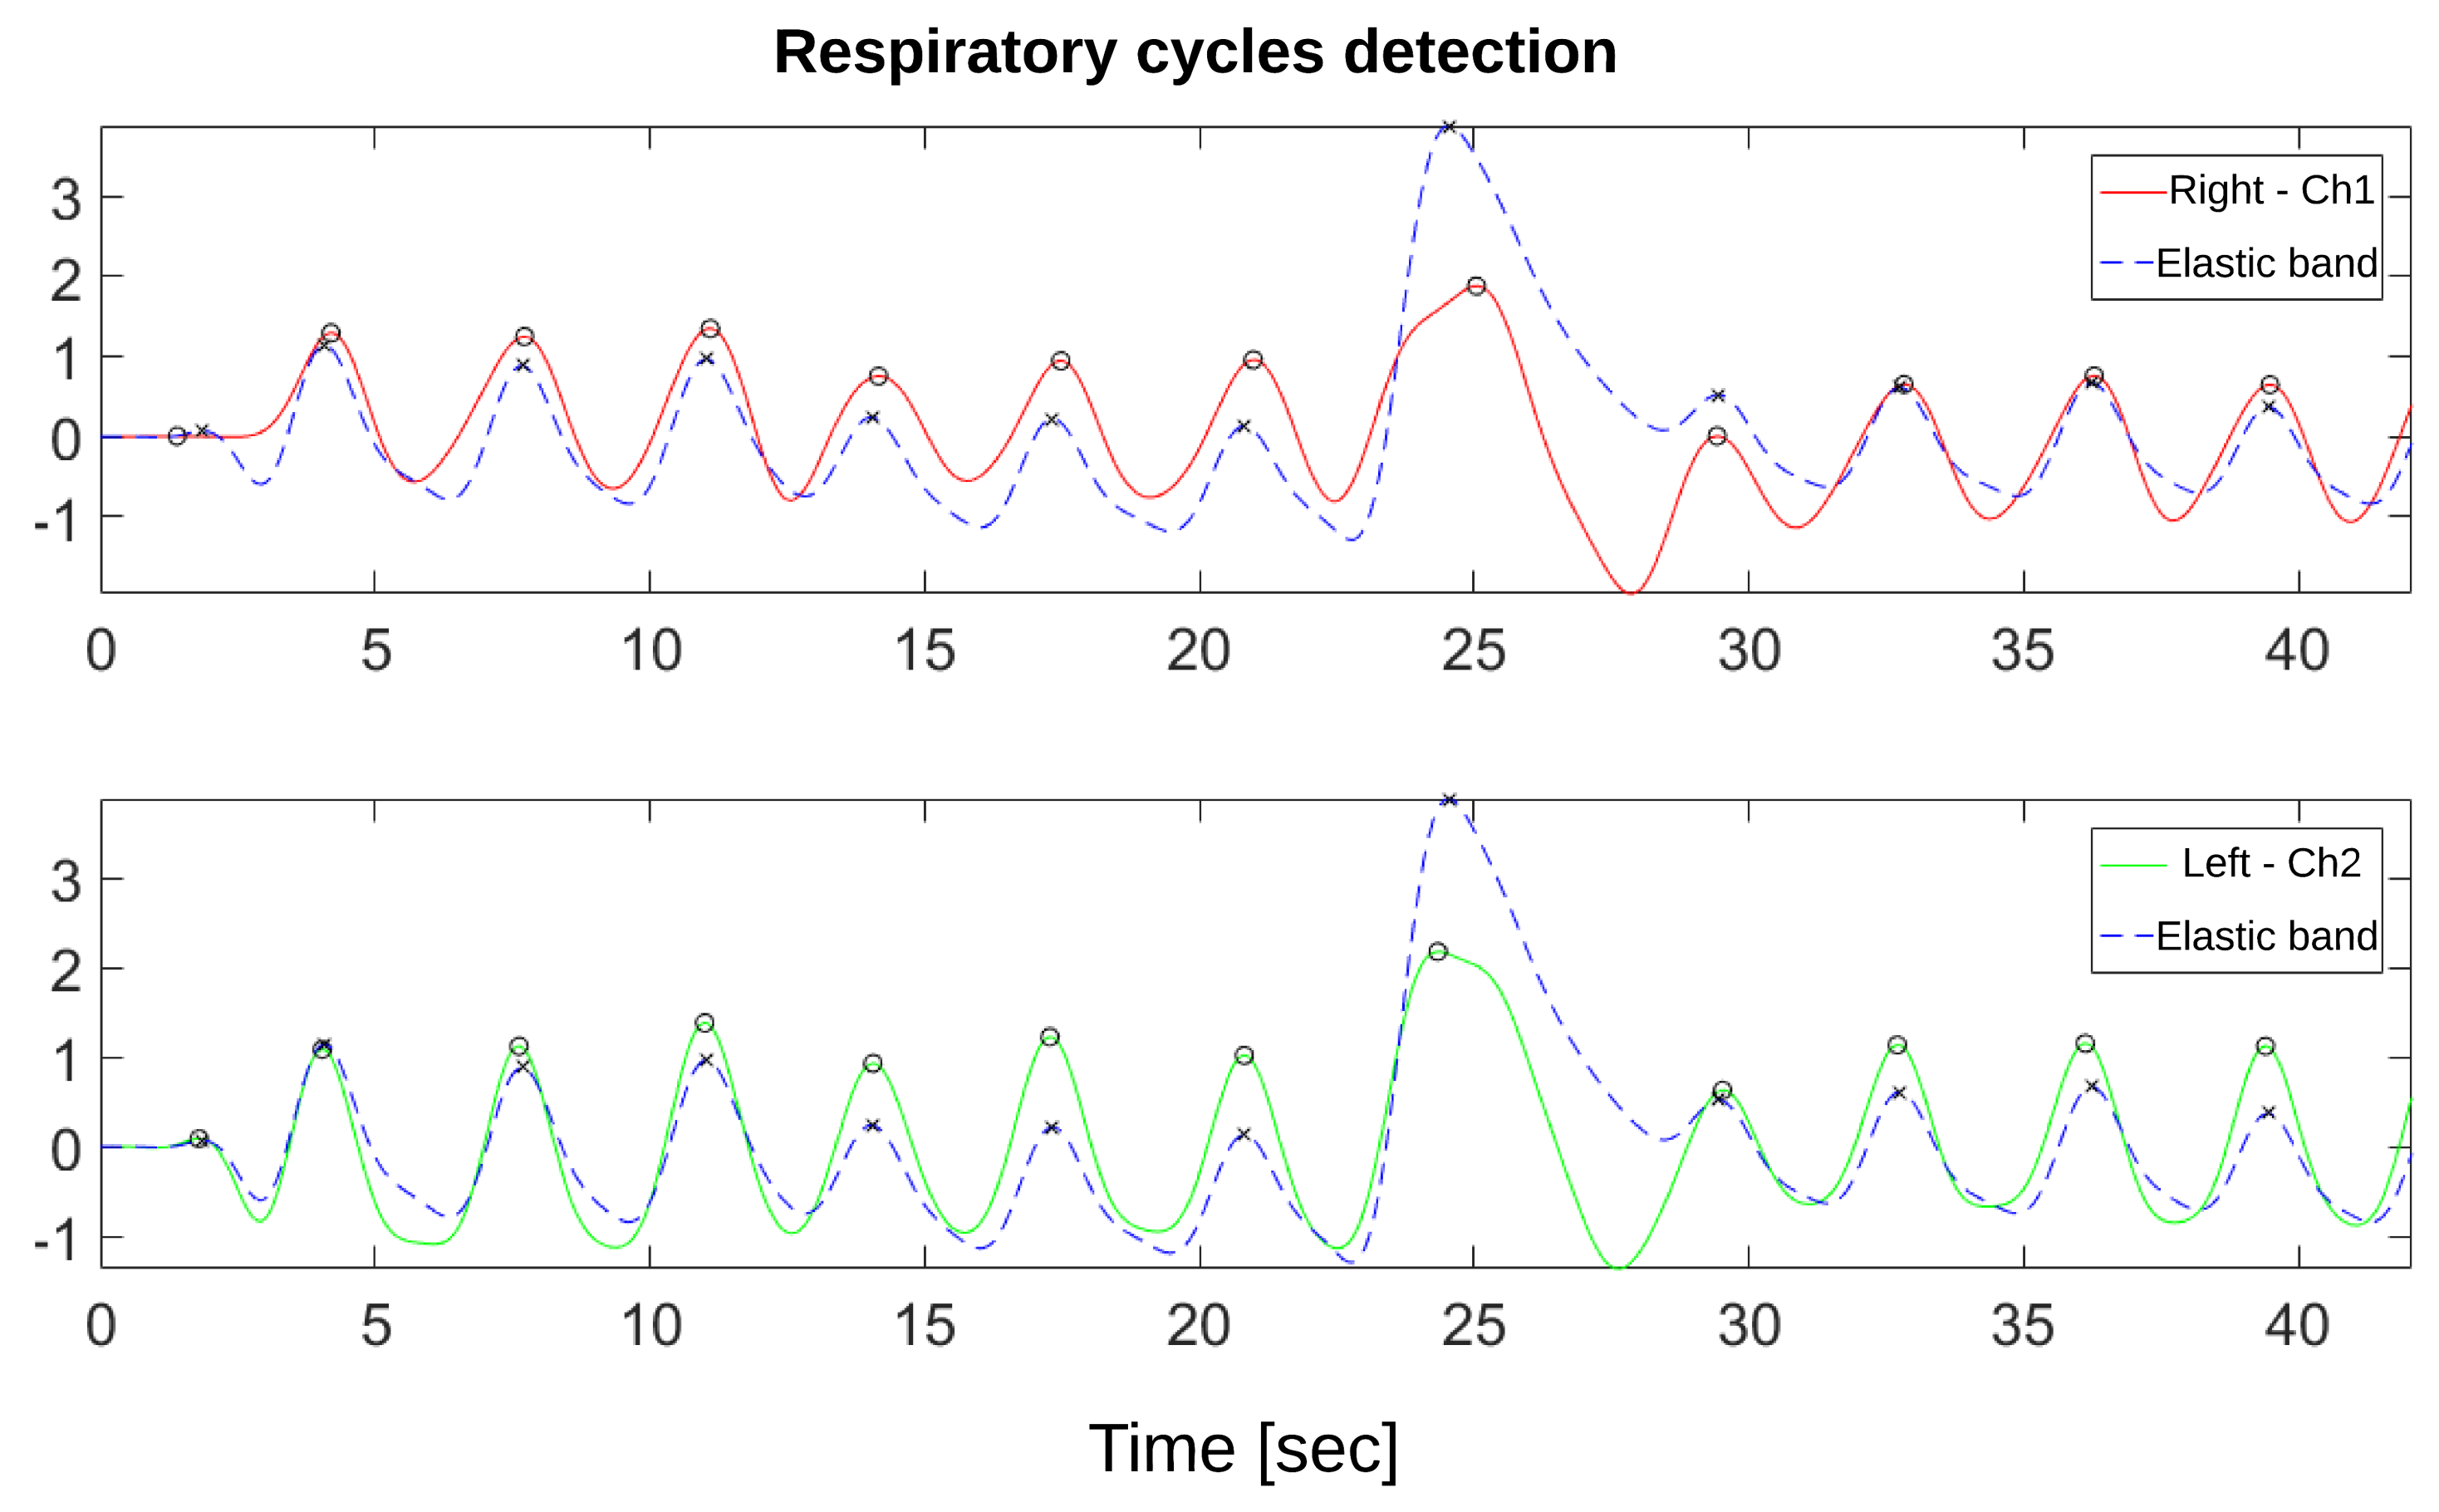
- Place the Velcro belt with an elastic resistive band SS5LB (Biopac Systems Inc, Goleta, CA, USA) to record the respiratory movement, and to validate TEB estimation of respiratory frequency (see Figure 8) using a Biopac MP36 data acquisition unit (Biopac Systems Inc, Goleta, CA, USA).
- Start the measurement. In the first 30 s, breathe normally, then perform maximum inspiration, and then a maximum expiration (like a spirometry measurement).
- Continue breathing normally for another 20 s.
- Exchange measurement channels without moving the electrodes and reverse the channel order to ensure channel-independent TEB measurements.
- Repeat measurement, as indicated in step 7.
- Disconnect the TEB system and all electrodes from the subject.
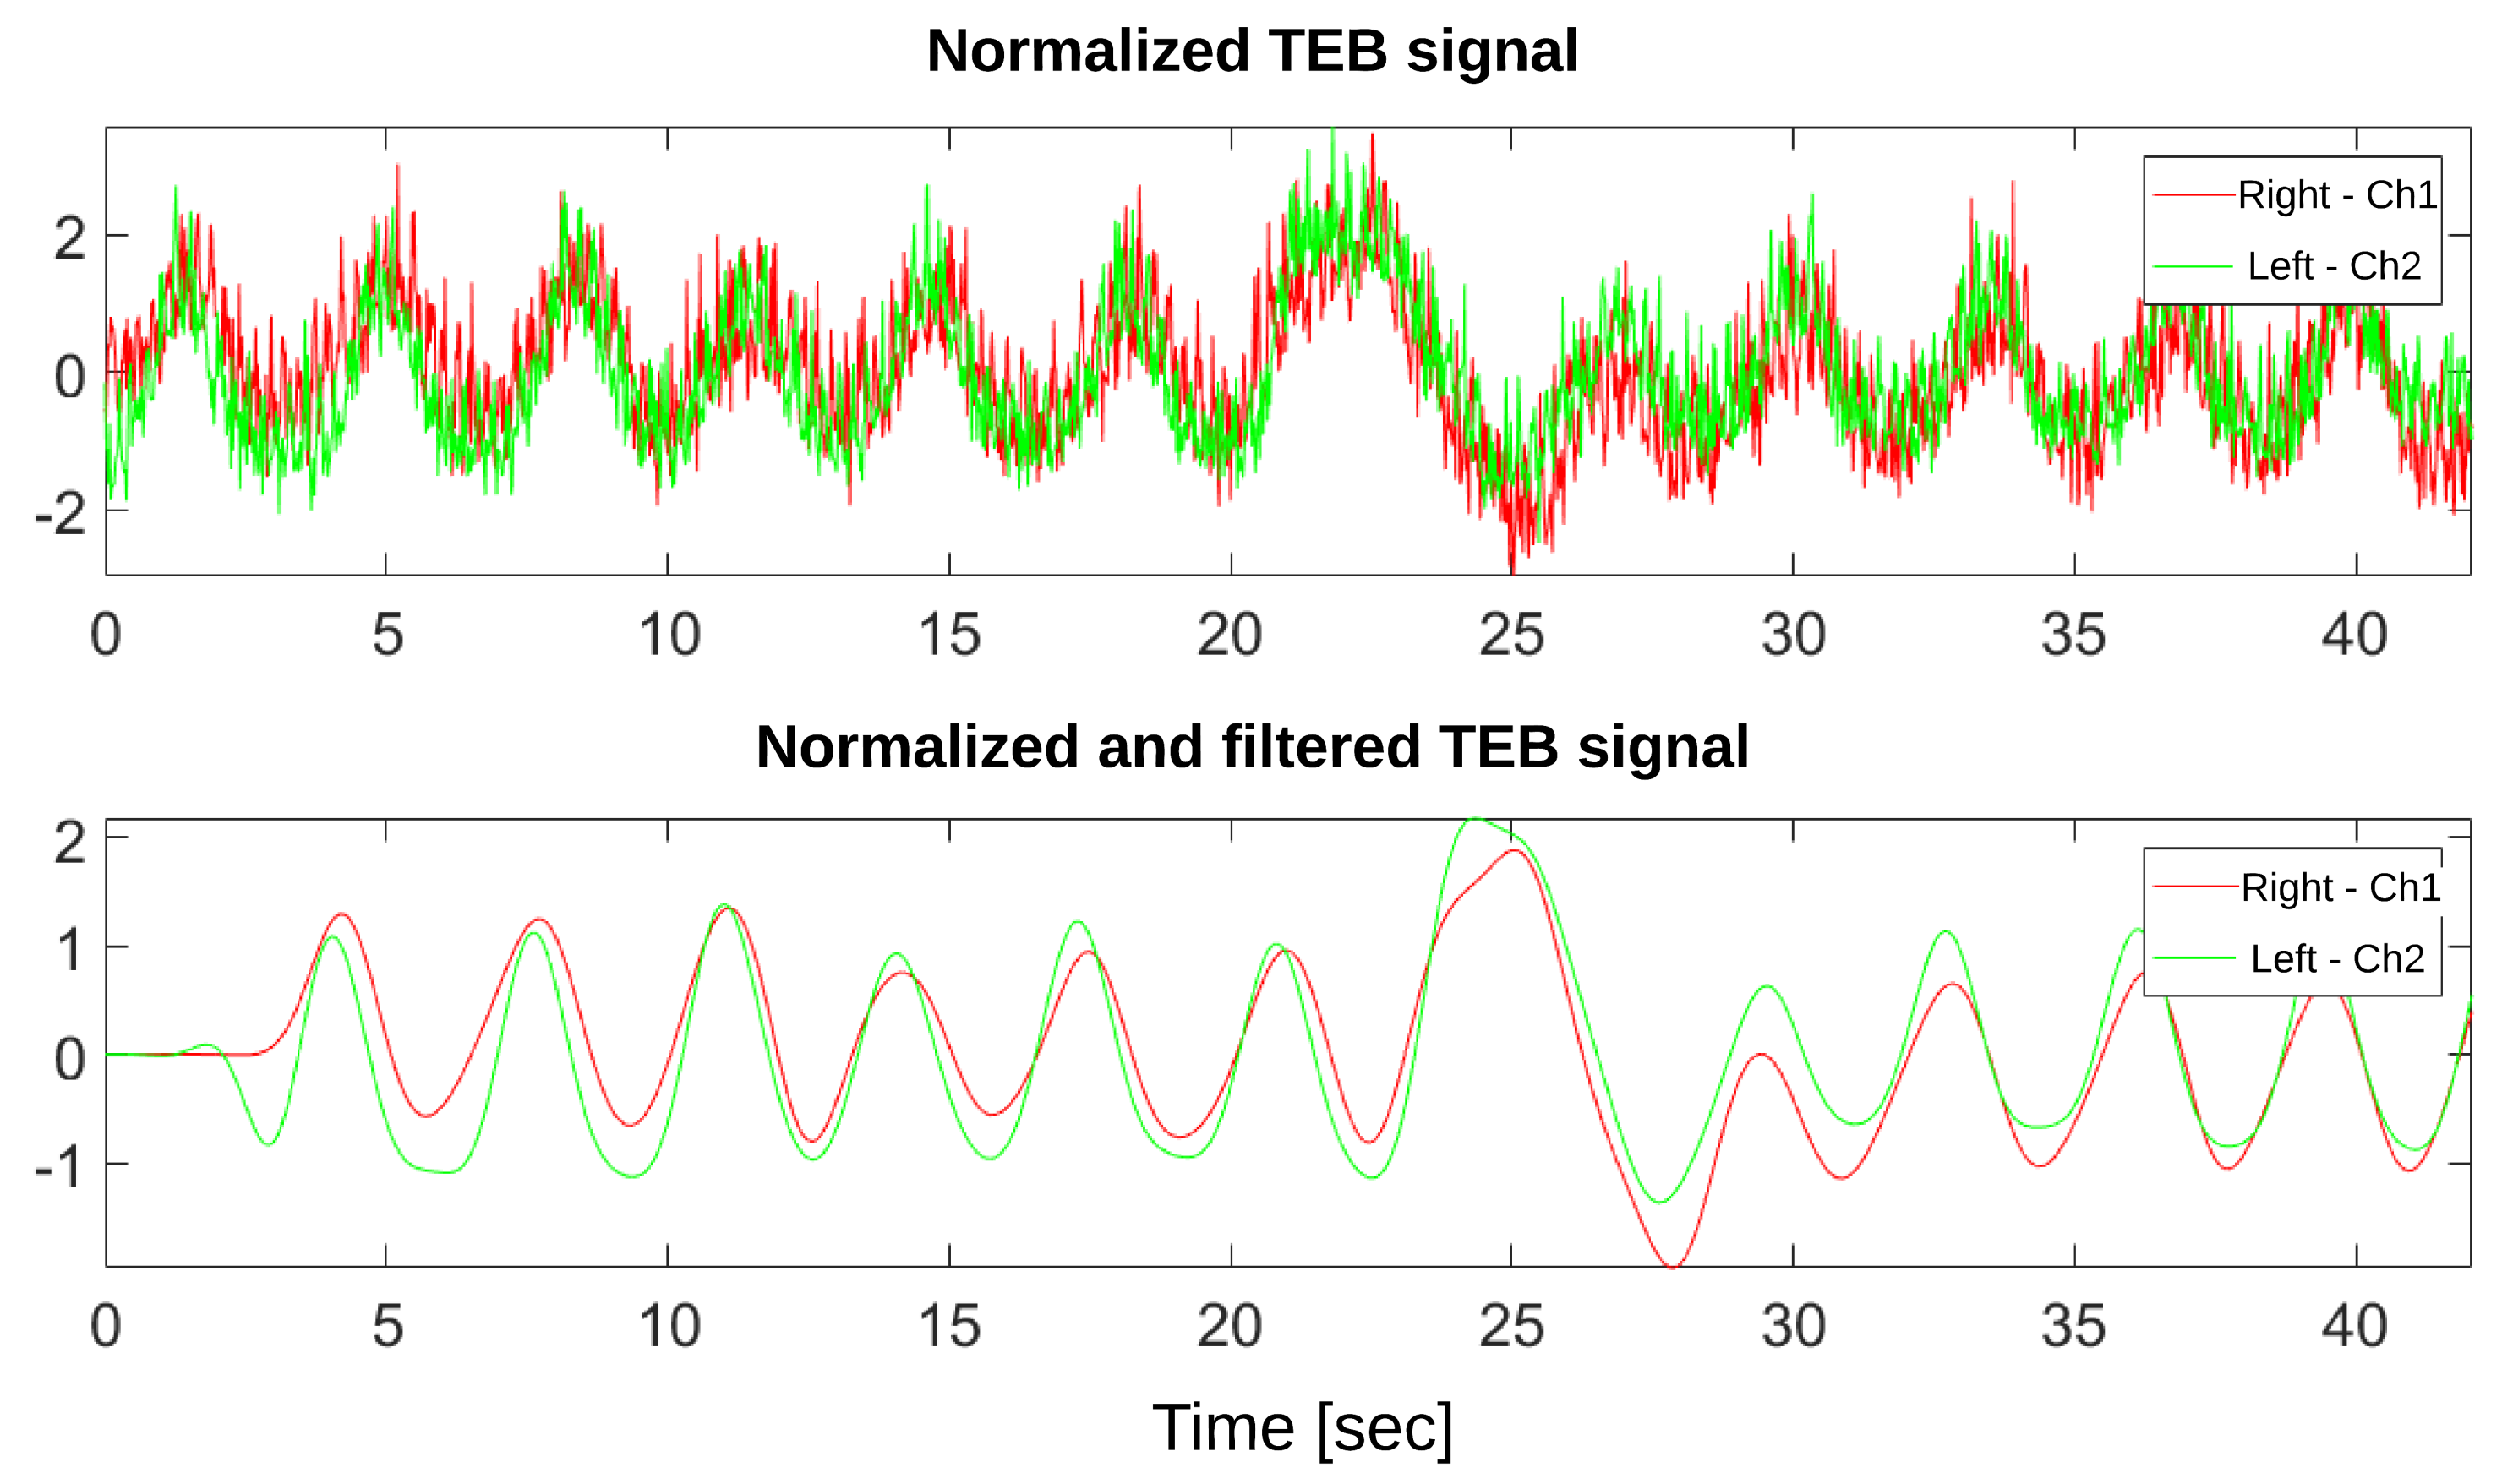
3.3. Signal Processing
4. Results
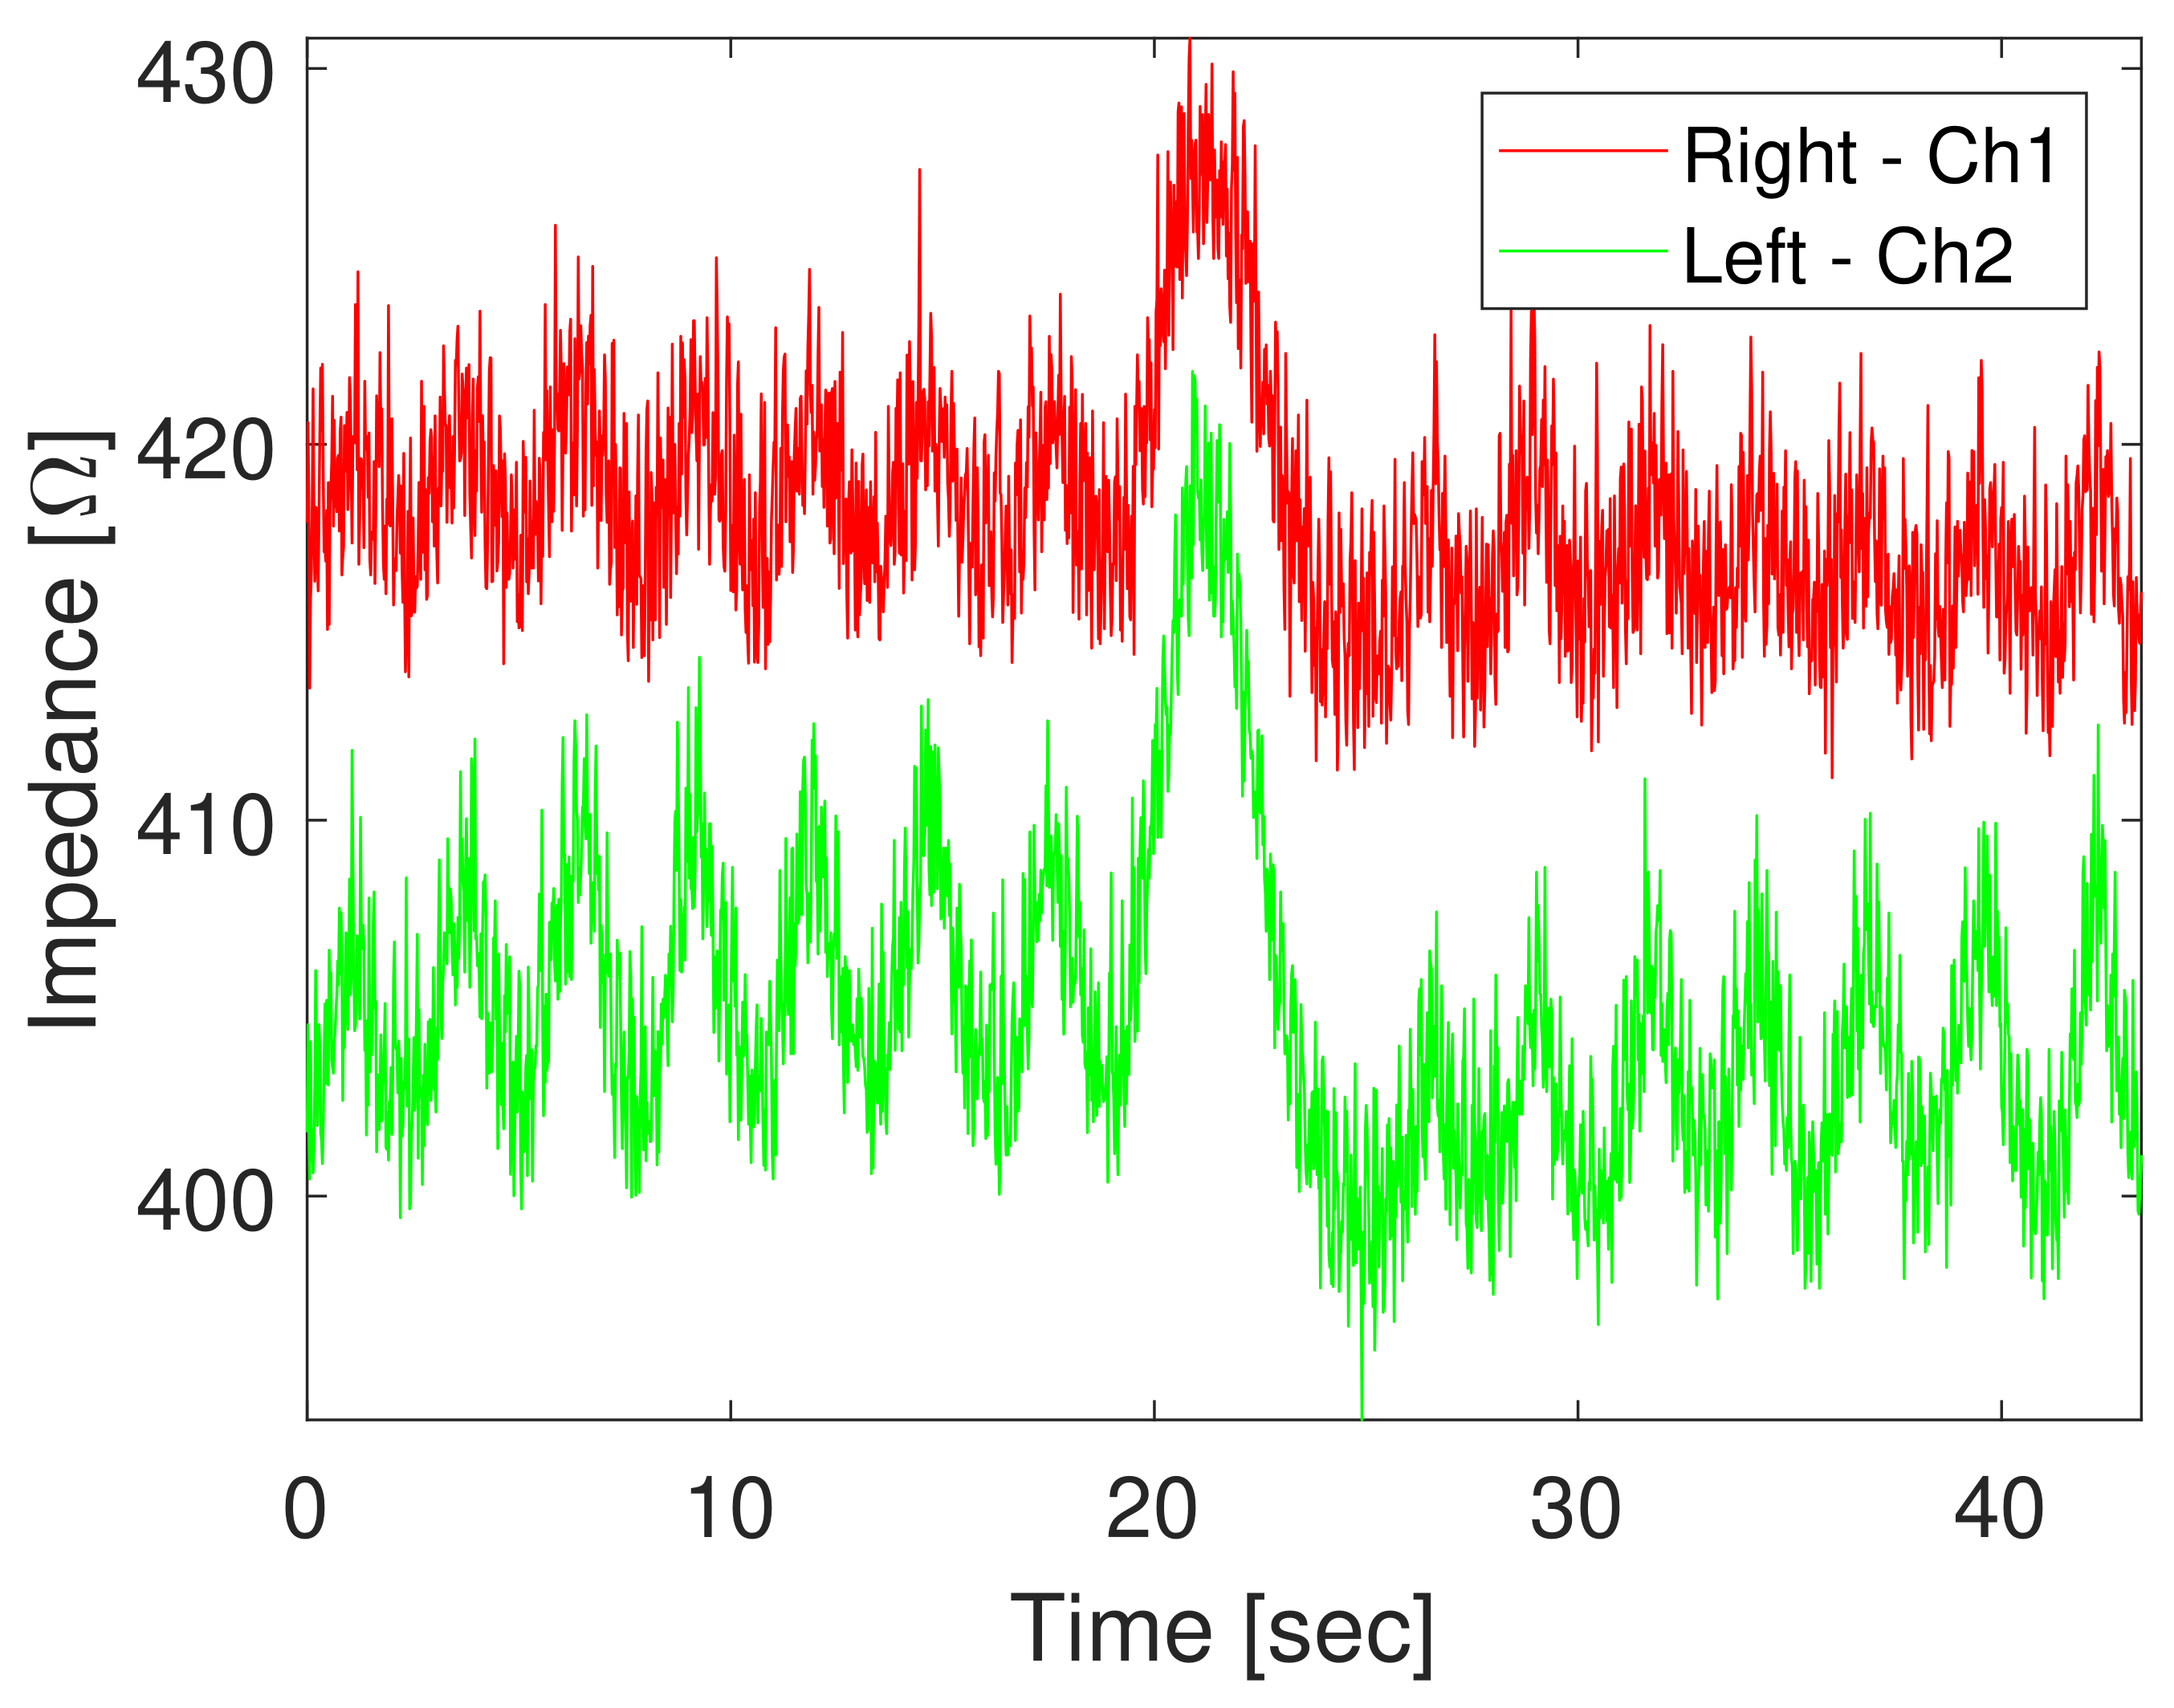
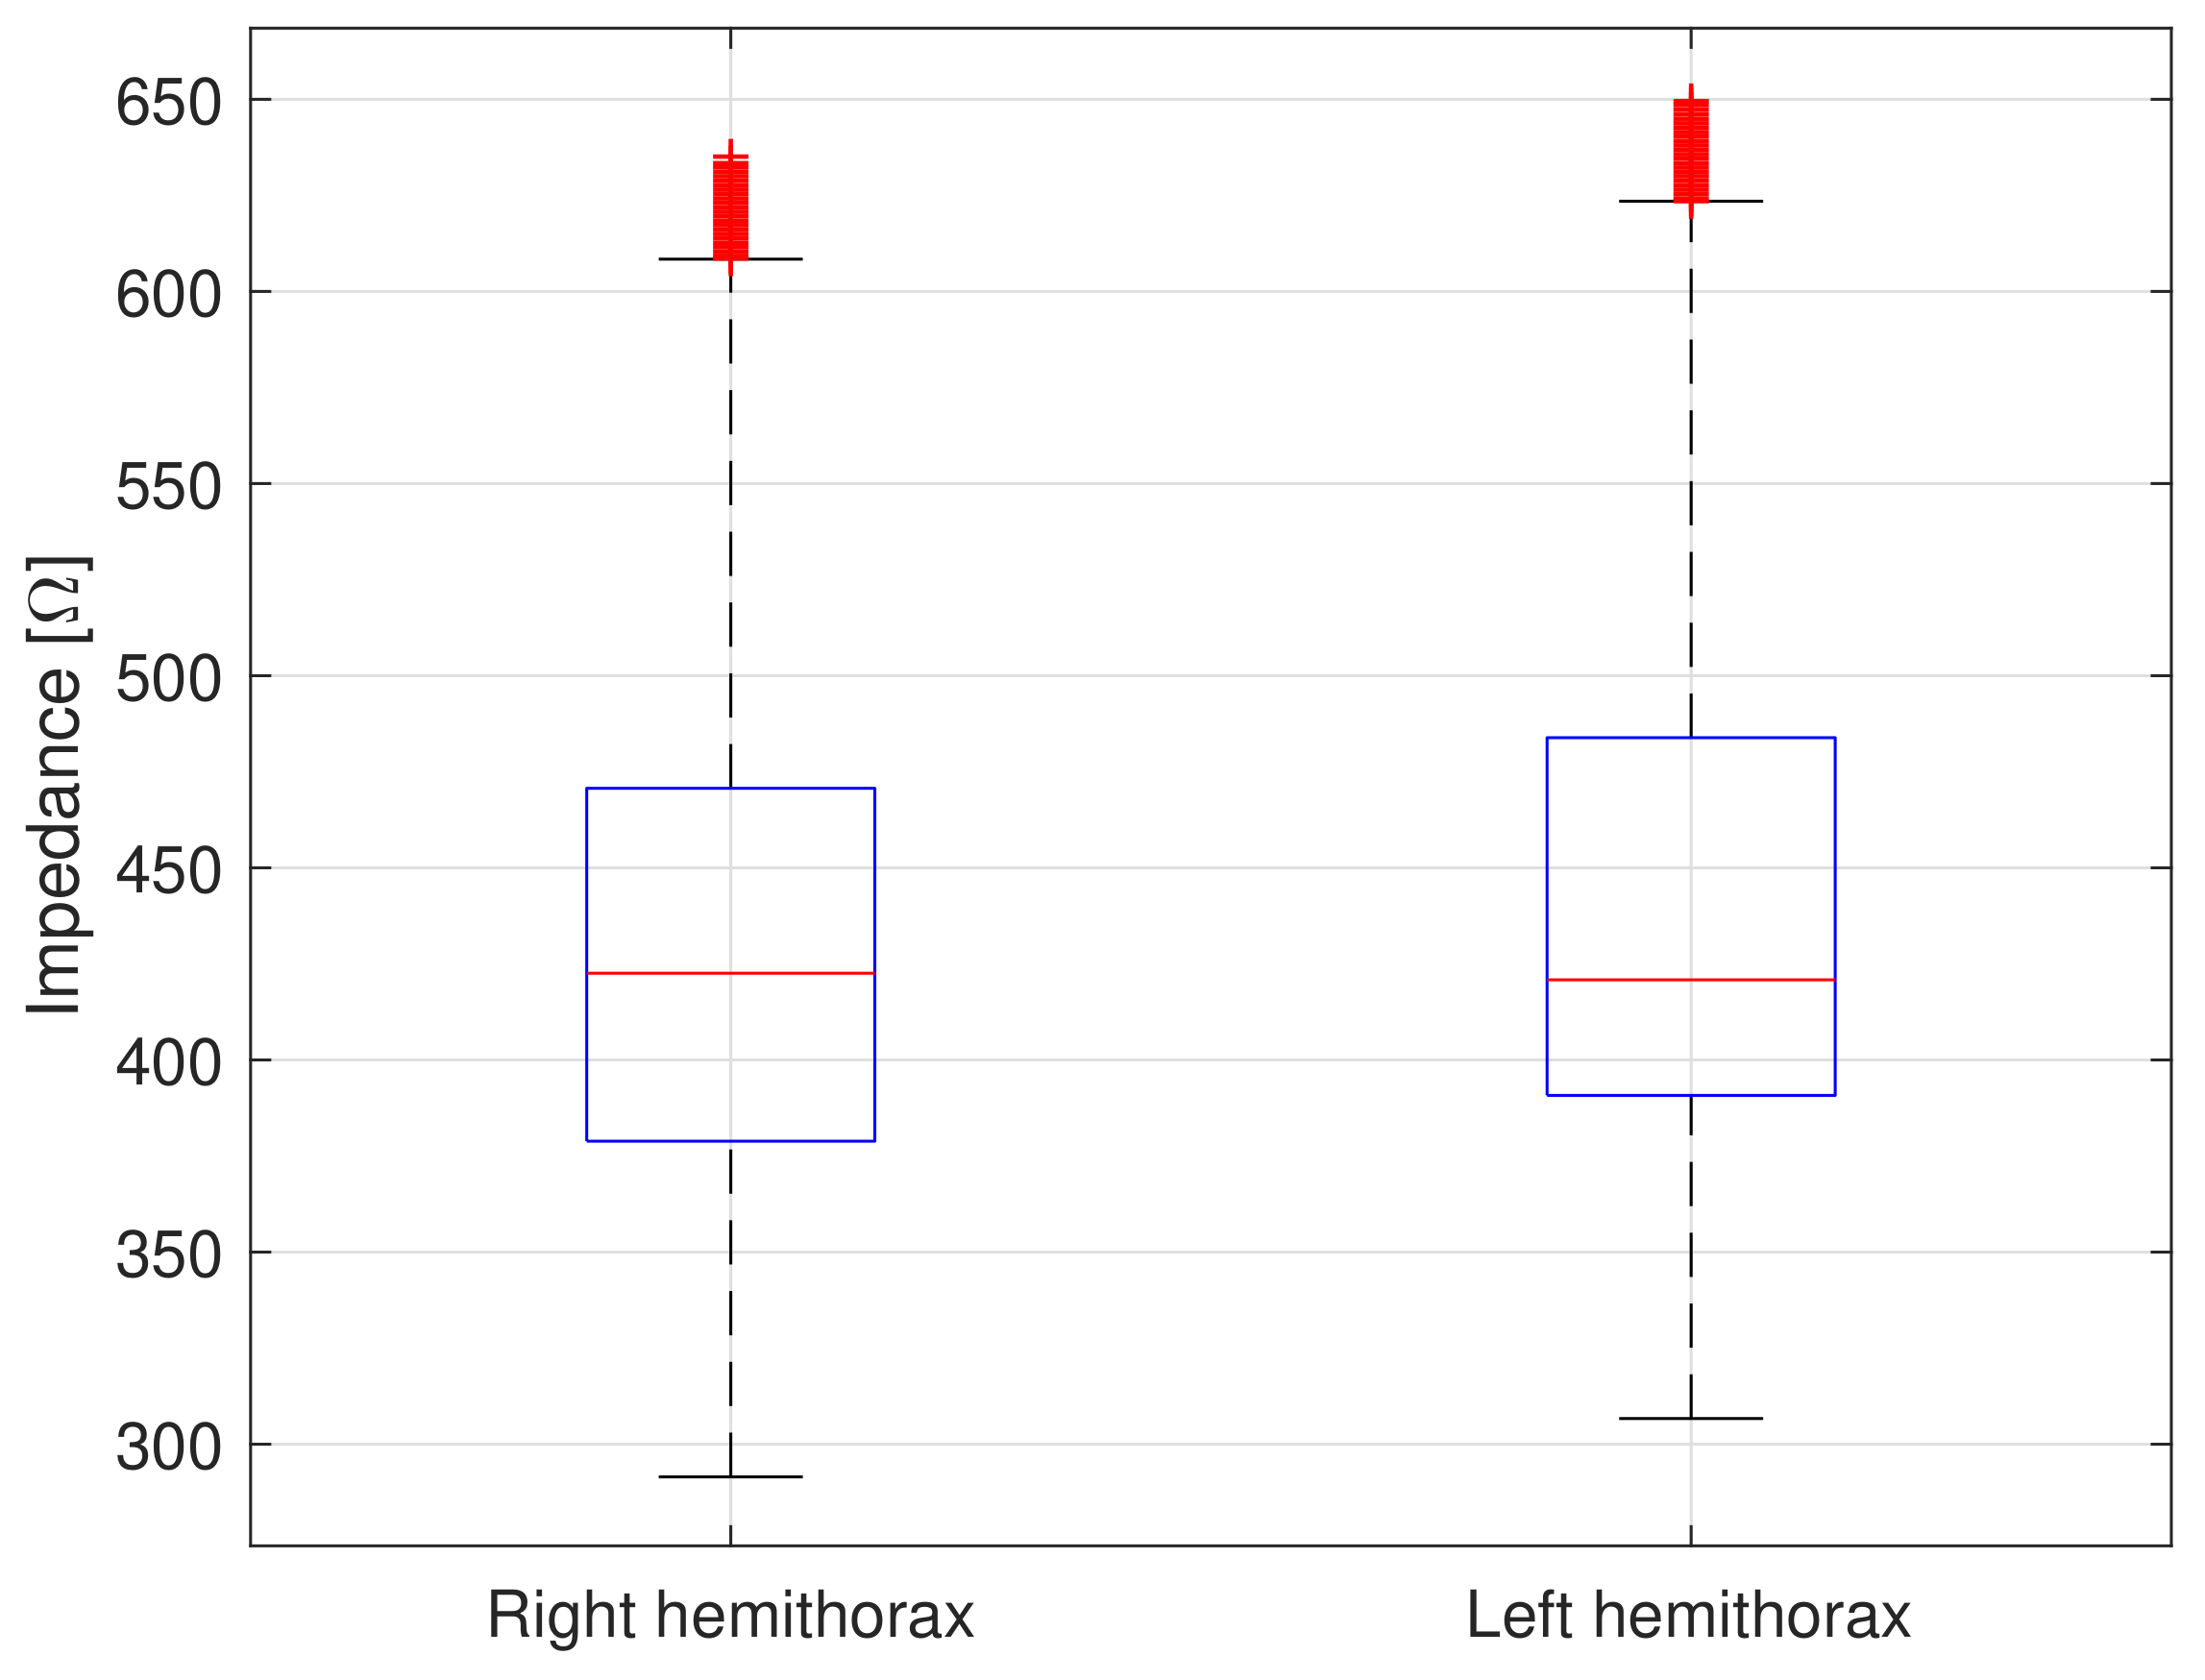
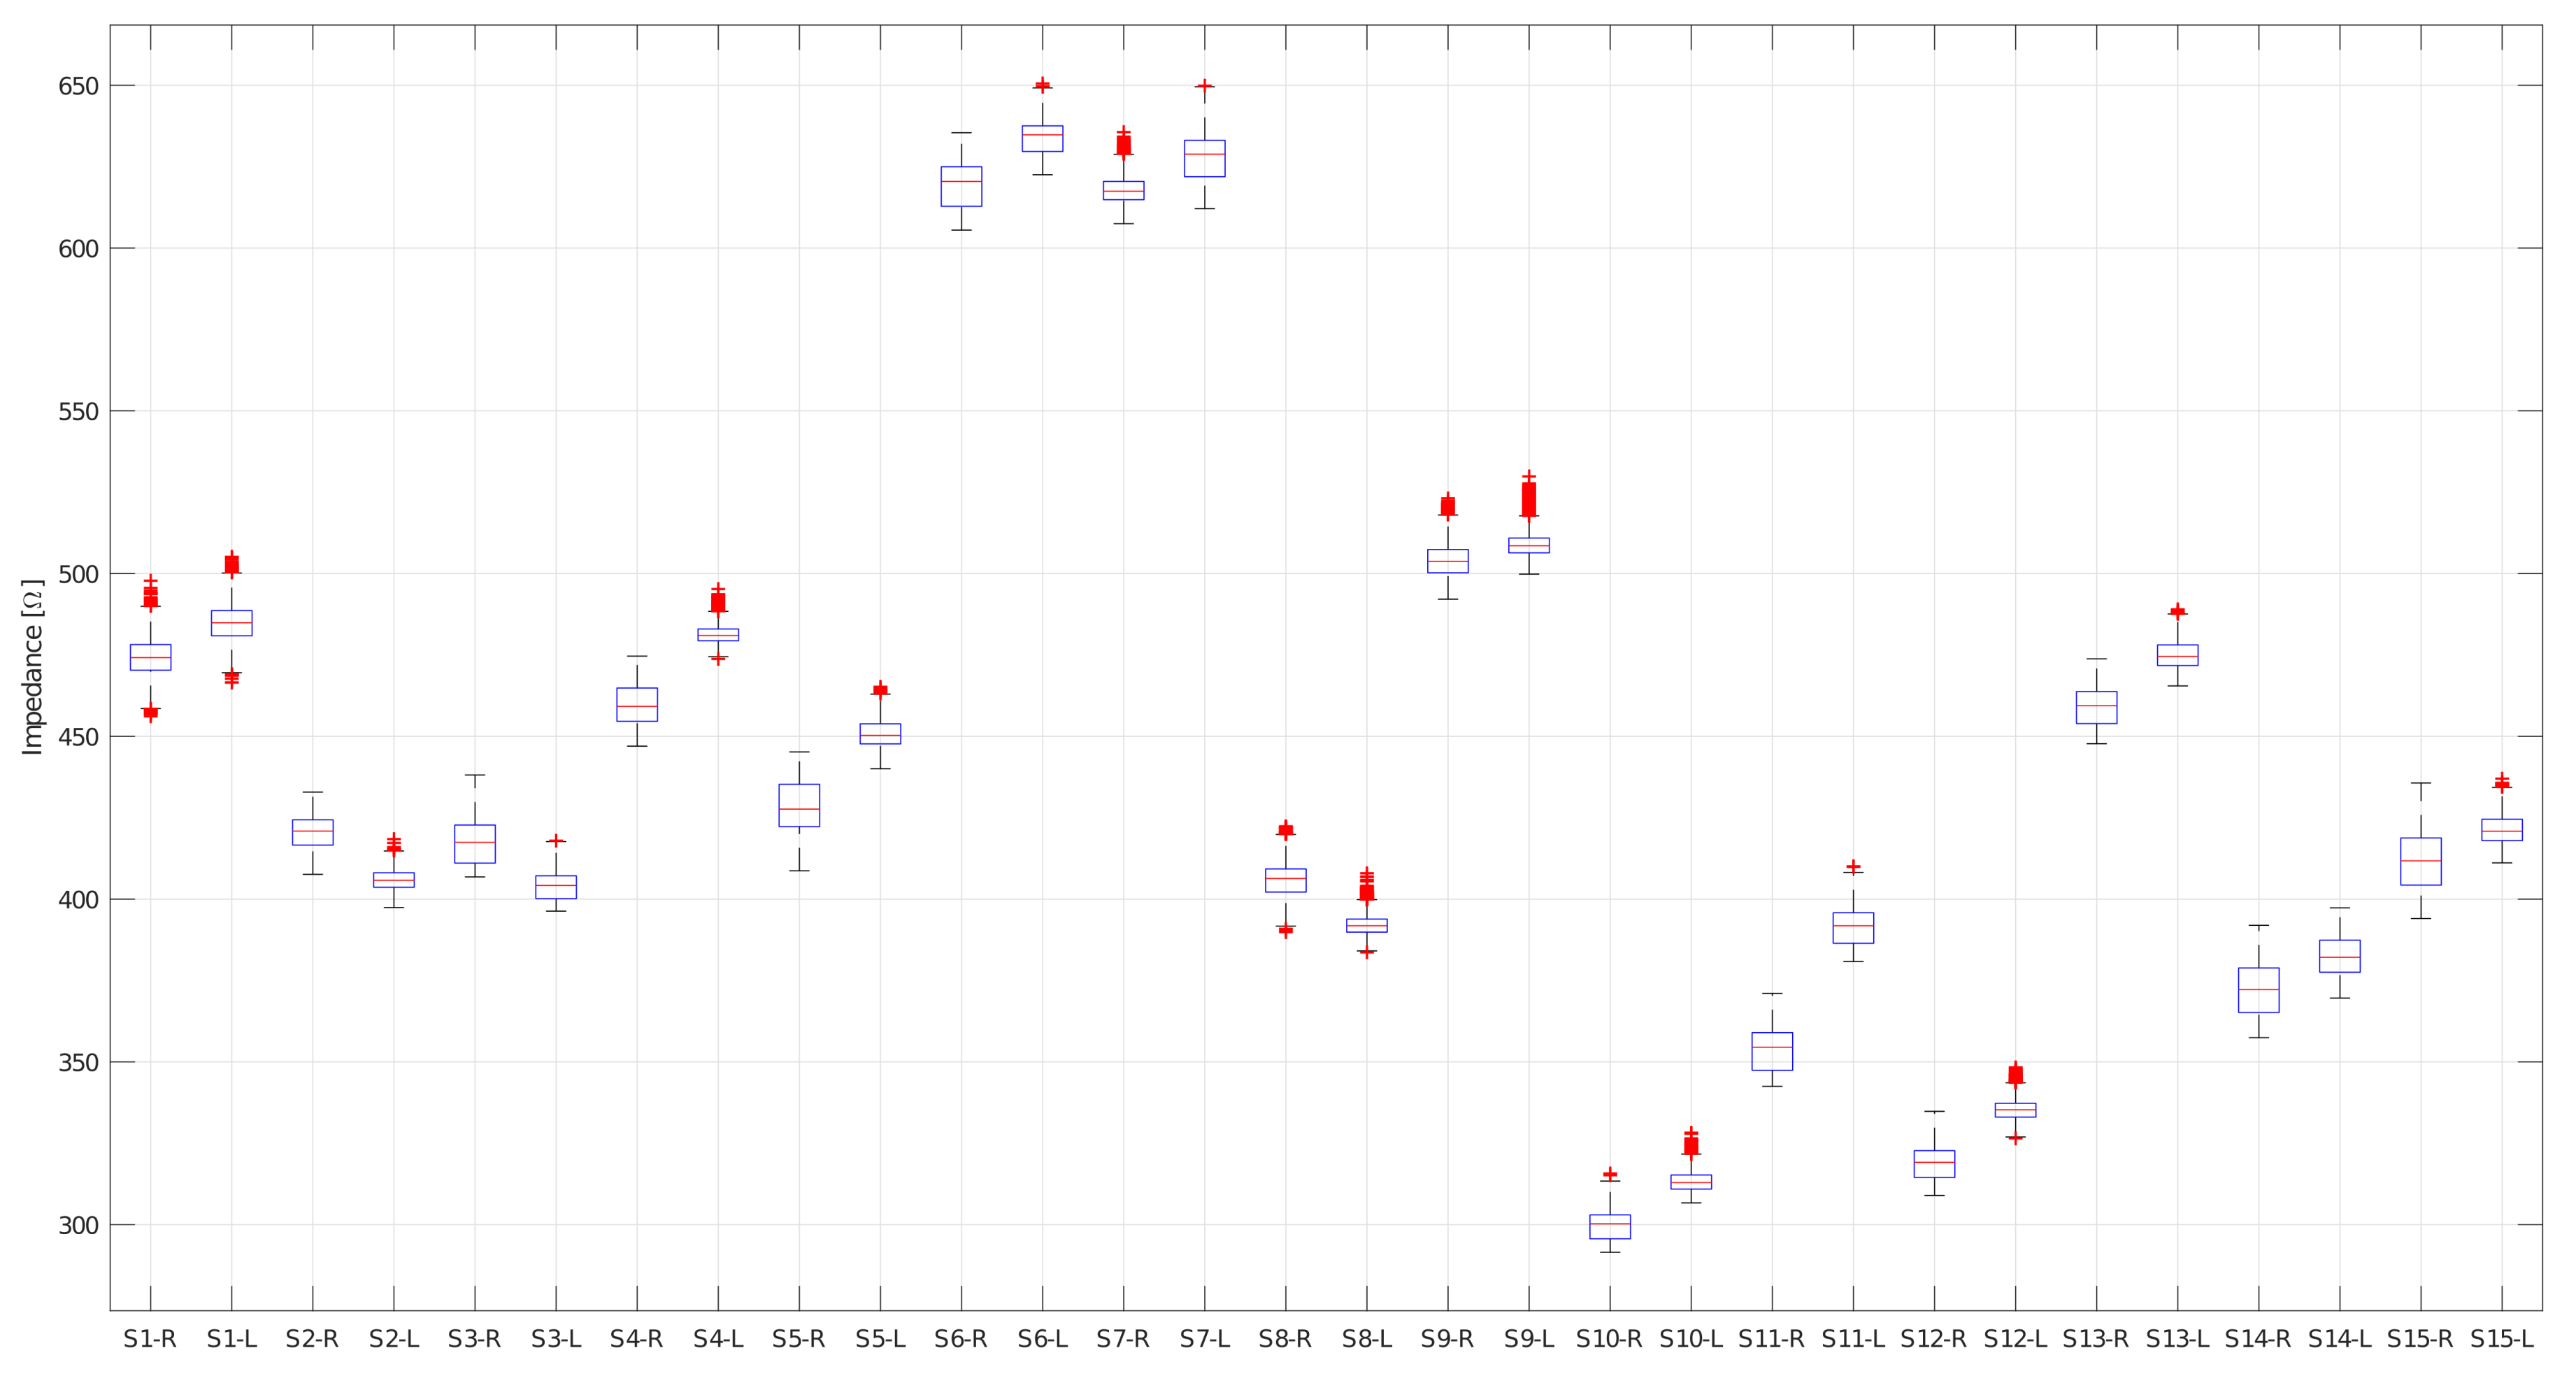
4.1. Bioimpedance Measurements
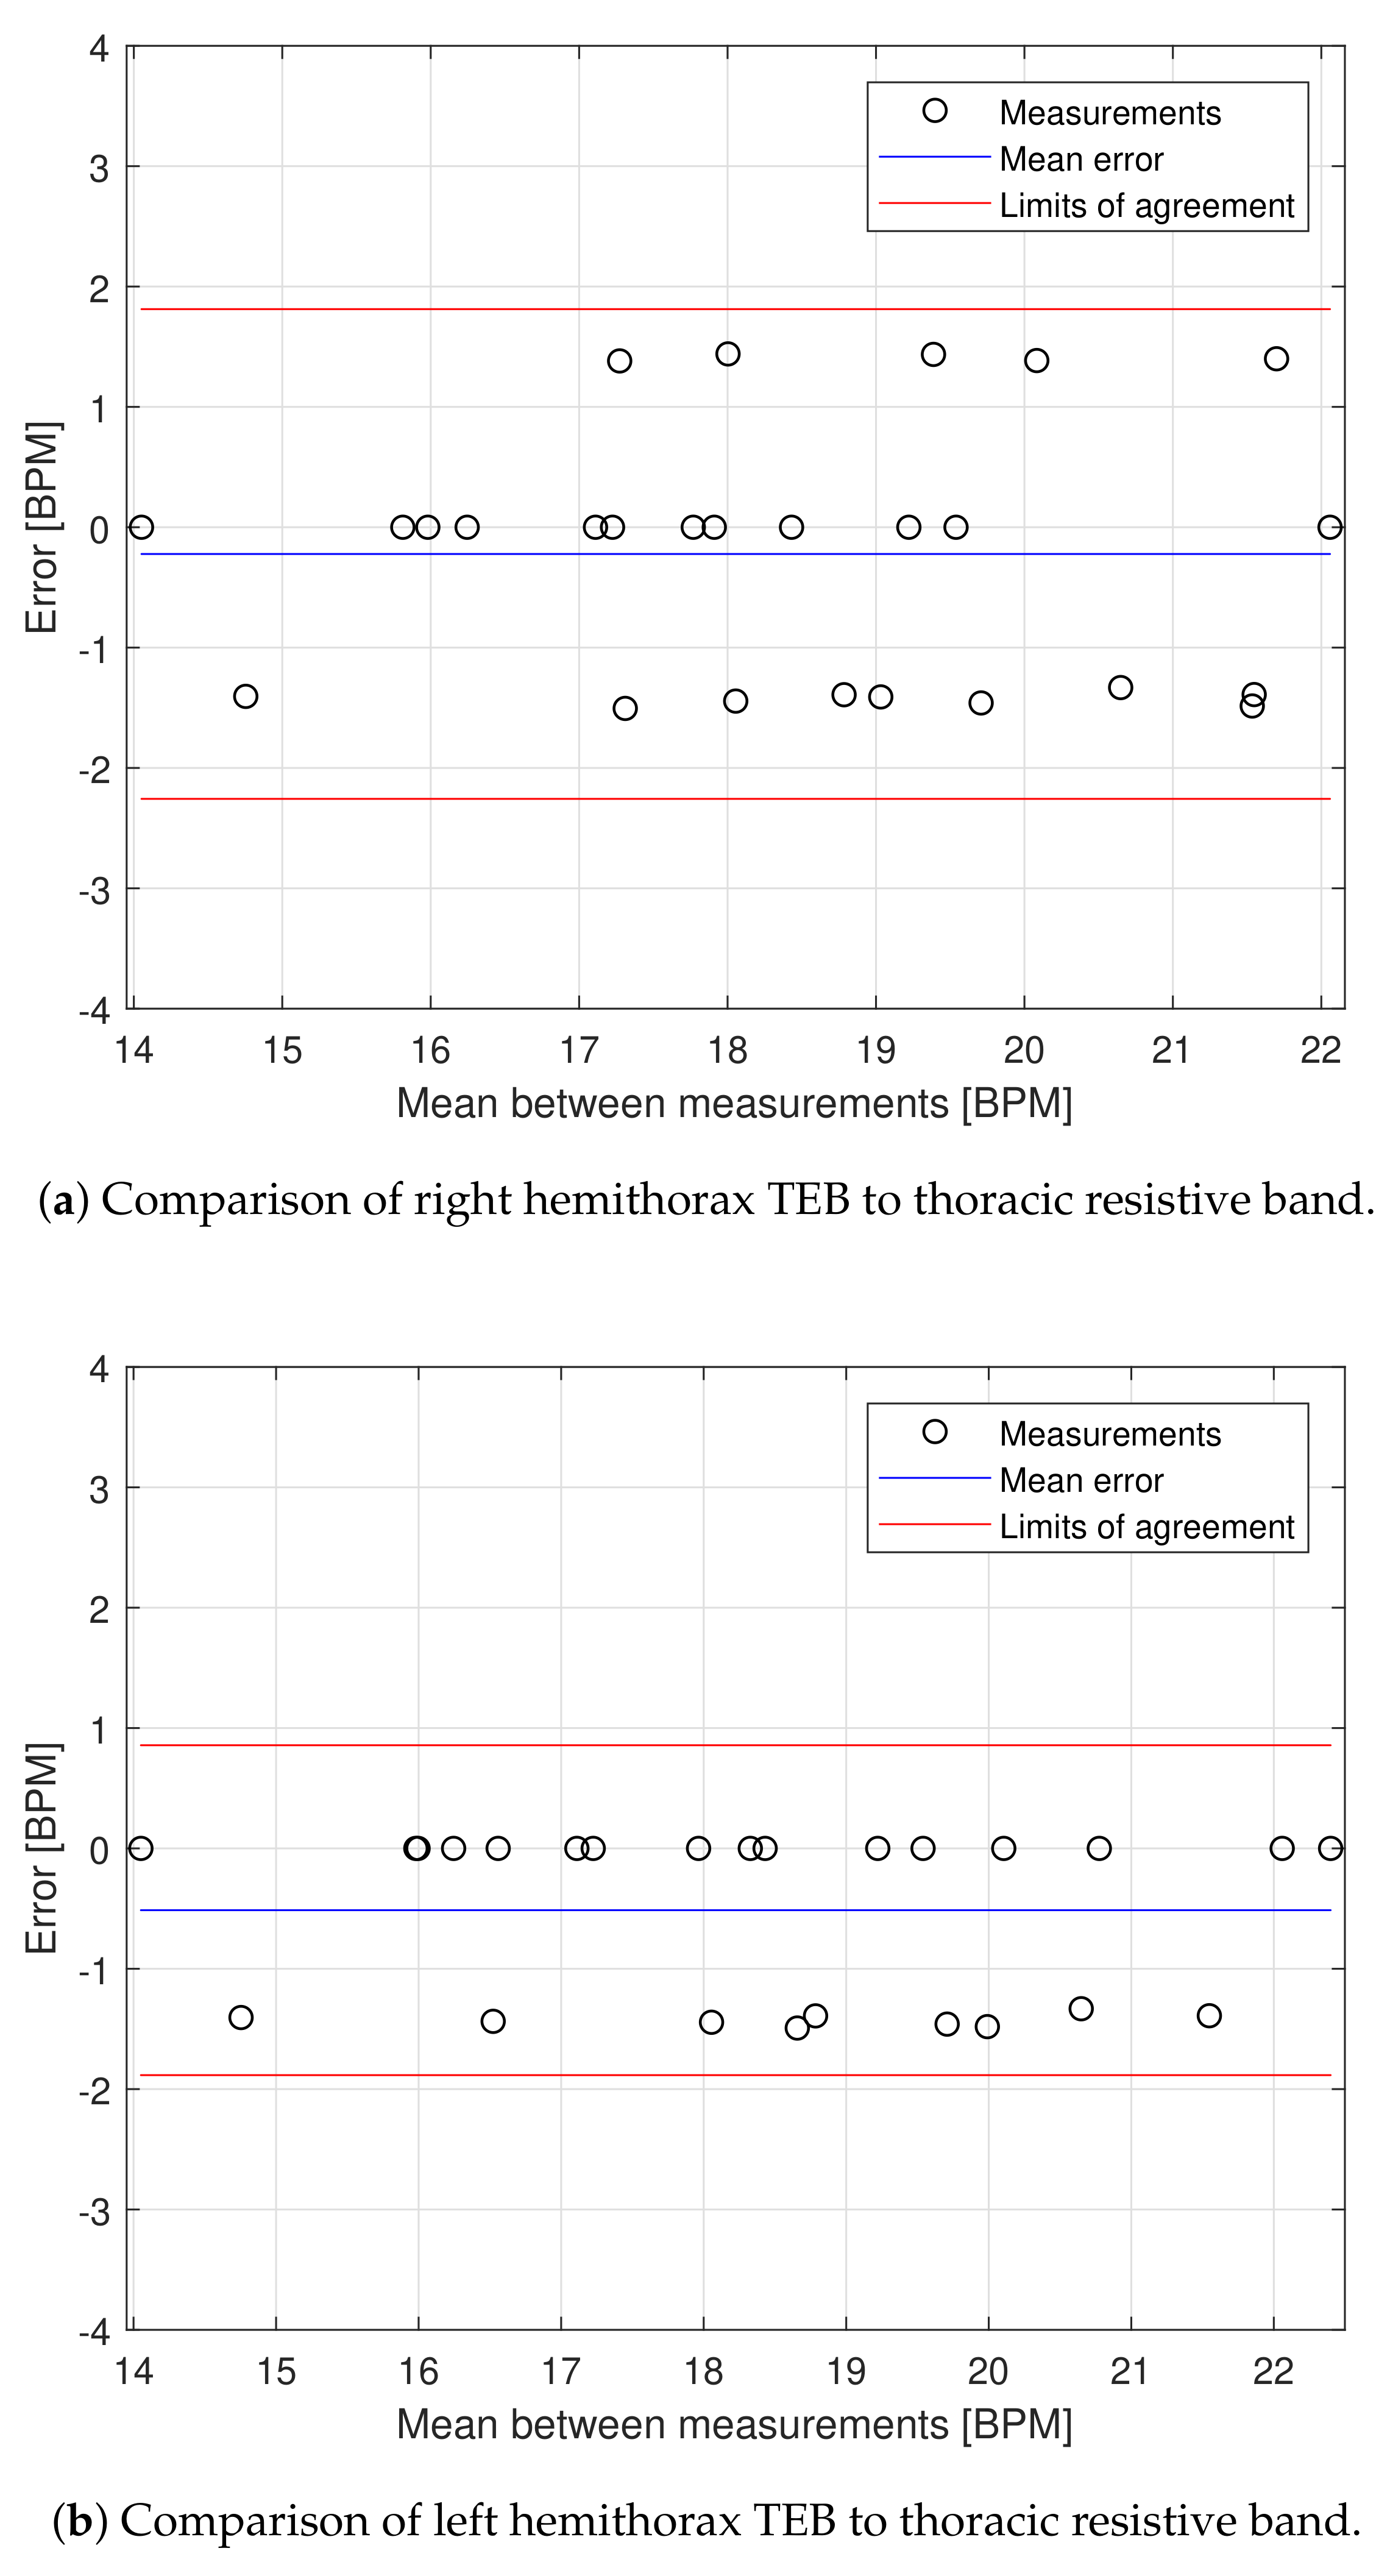
4.2. Respiratory Rate Validation
5. Discussion
6. Conclusions
Author Contributions
Funding
Acknowledgments
Conflicts of Interest
References
- Khalil, S.; Mohktar, M.; Ibrahim, F. The Theory and Fundamentals of Bioimpedance Analysis in Clinical Status Monitoring and Diagnosis of Diseases. Sensors 2014, 14, 10895–10928. [Google Scholar] [CrossRef] [PubMed]
- Xu, Z.; Yao, J.; Wang, Z.; Liu, Y.; Wang, H.; Chen, B.; Wu, H. Development of a portable electrical impedance tomography system for biomedical applications. IEEE Sens. J. 2018, 18, 8117–8124. [Google Scholar] [CrossRef]
- Cordes, A.; Foussier, J.; Leonhardt, S. Breathing detection with a portable impedance measurement system: First measurements. In Proceedings of the 2009 Annual International Conference of the IEEE Engineering in Medicine and Biology Society, Minneapolis, MN, USA, 3–6 September 2009; pp. 2767–2770. [Google Scholar]
- Al-Ali, A.A.; Maundy, B.J.; Elwakil, A.S. Design and Implementation of Portable Impedance Analyzers; Springer: New York, NY, USA, 2019; pp. 1–11, Chapter 1. [Google Scholar]
- Hong, S.; Lee, J.; Yoo, H.J. Wearable lung-health monitoring system with electrical impedance tomography. In Proceedings of the 2015 37th Annual International Conference of the IEEE Engineering in Medicine and Biology Society (EMBC), Milan, Italy, 25–29 August 2015; pp. 1707–1710. [Google Scholar]
- Weyer, S.; Menden, T.; Leicht, L.; Leonhardt, S.; Wartzek, T. Development of a wearable multi-frequency impedance cardiography device. J. Med. Eng. Technol. 2015, 39, 131–137. [Google Scholar] [CrossRef]
- Menolotto, M.; Rossi, S.; Dario, P.; Della Torre, L. Towards the development of a wearable electrical impedance tomography system: A study about the suitability of a low power bioimpedance front-end. In Proceedings of the 2015 37th Annual International Conference of the IEEE Engineering in Medicine and Biology Society (EMBC), Milan, Italy, 25–29 August 2015; pp. 3133–3136. [Google Scholar]
- Mosquera, V.H.; Arregui, A.; Bragós Bardia, R.; Rengifo, C.F. Implementation of a low cost prototype for electrical impedance tomography based on the integrated circuit for body composition measurement AFE4300. In Proceedings of the 11th International Joint Conference on Biomedical Engineering Systems and Technologies (BIOSTEC 2018), Funchal, Madeira, Portugal, 19–21 January 2018; Scitepress: Setúbal, Portugal, 2018; pp. 121–127. [Google Scholar]
- Lee, M.H.; Jang, G.Y.; Kim, Y.E.; Yoo, P.J.; Wi, H.; Oh, T.I.; Woo, E.J. Portable multi-parameter electrical impedance tomography for sleep apnea and hypoventilation monitoring: Feasibility study. Physiol. Meas. 2018, 39, 124004. [Google Scholar] [CrossRef] [PubMed]
- Seoane, F.; Ferreira, J.; Sanchéz, J.J.; Bragós, R. An analog front-end enables electrical impedance spectroscopy system on-chip for biomedical applications. Physiol. Meas. 2008, 29, S267. [Google Scholar] [CrossRef] [PubMed]
- Melwin, A.; Rajasekaran, K. Implementation of Bioimpedance Instrument Kit in ARM7. Int. J. Adv. Res. Comput. Sci. Softw. Eng. 2013, 3, 1271–1273. [Google Scholar]
- Wu, Y.; Jiang, D.; Duan, J.; Liu, X.; Bayford, R.; Demosthenous, A. Towards a High Accuracy Wearable Hand Gesture Recognition System Using EIT. In Proceedings of the 2018 IEEE International Symposium on Circuits and Systems (ISCAS), Florence, Italy, 27–30 May 2018; pp. 1–4. [Google Scholar] [CrossRef]
- Frerichs, I.; Amato, M.B.; Van Kaam, A.H.; Tingay, D.G.; Zhao, Z.; Grychtol, B.; Bodenstein, M.; Gagnon, H.; Böhm, S.H.; Teschner, E.; et al. Chest electrical impedance tomography examination, data analysis, terminology, clinical use and recommendations: Consensus statement of the TRanslational EIT developmeNt stuDy group. Thorax 2017, 72, 83–93. [Google Scholar] [CrossRef]
- Allison, R.D.; Holmes, E.; Nyboer, J. Volumetric dynamics of respiration as measured by electrical impedance plethysmography. J. Appl. Physiol. 1964, 19, 166–173. [Google Scholar] [CrossRef]
- Baker, L.; Hill, D. The use of electrical impedance techniques for the monitoring of respiratory pattern during anaesthesia. BJA Br. J. Anaesth. 1969, 41, 2–17. [Google Scholar] [CrossRef]
- Barber, D.C.; Seagar, A.D. Fast reconstruction of resistance images. Clin. Phys. Physiol. Meas. 1987, 8, 47. [Google Scholar] [CrossRef]
- Brown, B.H.; Seagar, A.D. The Sheffield data collection system. Clin. Phys. Physiol. Meas. 1987, 8, 91. [Google Scholar] [CrossRef] [PubMed]
- H Brown, B. Electrical impedance tomography (EIT): A review. J. Med. Eng. Technol. 2003, 27, 97–108. [Google Scholar] [CrossRef] [PubMed]
- Bayford, R. Bioimpedance Tomography (Electrical Impedance Tomography). Annu. Rev. Biomed. Eng. 2006, 8, 63–91. [Google Scholar] [CrossRef] [PubMed]
- Kohli, K.; Liu, J.; Schellenberg, D.; Karvat, A.; Parameswaran, A.; Grewal, P.; Thomas, S. Prototype development of an electrical impedance based simultaneous respiratory and cardiac monitoring system for gated radiotherapy. Biomed. Eng. Online 2014, 13, 144. [Google Scholar] [CrossRef] [PubMed]
- Młyńczak, M.; Niewiadomski, W.; Żyliński, M.; Cybulski, G. Assessment of calibration methods on impedance pneumography accuracy. Biomed. Eng./Biomed. Tech. 2016, 61, 587–593. [Google Scholar] [CrossRef] [PubMed]
- Bachmann, M.C.; Morais, C.; Bugedo, G.; Bruhn, A.; Morales, A.; Borges, J.B.; Costa, E.; Retamal, J. Electrical impedance tomography in acute respiratory distress syndrome. Crit. Care 2018, 22, 1–11. [Google Scholar] [CrossRef]
- Walsh, B.K.; Smallwood, C.D. Electrical impedance tomography during mechanical ventilation. Respir. Care 2016, 61, 1417–1424. [Google Scholar] [CrossRef]
- Seppä, V.P.; Hyttinen, J.; Viik, J. Impedance Pneumography for Ambulatory Assessment of Obstructive Respiratory Diseases; IOS Press: Amsterdam, The Netherlands, 2015. [Google Scholar]
- Redmond, C. Trans-thoracic impedance measurements in patient monitoring. EDN Netw. 2013. Available online: https://www.analog.com/en/technical-articles/transthoracic-impedance-measurements-in-patient-monitoring.html (accessed on 1 May 2018).
- Martinsen, O.G.; Grimnes, S. Bioimpedance and Bioelectricity Basics; Academic Press: Cambridge, MA, USA, 2011; Chapter 6. [Google Scholar]
- Fein, A.; Grossman, R.F.; Jones, J.G.; Goodman, P.; Murray, J. Evaluation of transthoracic electrical impedance in the diagnosis of pulmonary edema. Circulation 1979, 60, 1156–1160. [Google Scholar] [CrossRef]
- Liu, S.; Cao, R.; Huang, Y.; Ouypornkochagorn, T.; Jia, J. Time Sequence Learning for Electrical Impedance Tomography Using Bayesian Spatiotemporal Priors. IEEE Trans. Instrum. Meas. 2020, 69, 6045–6057. [Google Scholar] [CrossRef]
- Balleza, M.; Calaf, N.; Feixas, T.; González, M.; Antón, D.; Riu, P.J.; Casan, P. Measuring breathing pattern in patients with chronic obstructive pulmonary disease by electrical impedance tomography. Arch. Bronconeumol. 2009, 45, 320–324. [Google Scholar] [CrossRef]
- Balleza, M.; Vargas, M.; Kashina, S.; Huerta, M.; Delgadillo, I.; Moreno, G. Respiration monitoring by Electrical Bioimpedance (EBI) Technique in a group of healthy males. Calibration equations. J. Phys. Conf. Ser. 2017, 792, 012048. [Google Scholar] [CrossRef]
- Blanco-Almazán, D.; Groenendaal, W.; Catthoor, F.; Jané, R. Chest Movement and Respiratory Volume both contribute to thoracic Bioimpedance during Loaded Breathing. Sci. Rep. 2019, 9, 1–11. [Google Scholar] [CrossRef] [PubMed]
- Devices, A. MSPS, 12 bit Impedance Converter Network Analyzer. Available online: http://www.analog.com/en/index.html (accessed on 1 January 2018).
- Pliquett, U.; Barthel, A. Interfacing the AD5933 for bio-impedance measurements with front ends providing galvanostatic or potentiostatic excitation. J. Phys. Conf. Ser. 2012, 407, 1–4. [Google Scholar] [CrossRef]
- Potdar, S.V.; Panditrao, A.; Khambete, N.D. Monitoring breathing rate using bio-impedance technique. In Proceedings of the 2016 International Conference on Computing Communication Control and Automation (ICCUBEA), Pune, India, 12–13 August 2016; pp. 1–3. [Google Scholar] [CrossRef]
- Garcia, A.; Sabuncu, A.C. Electrical System for Bioelectric Impedance using AD5933 Impedance Converter. SMU J. Undergrad. Res. 2019, 2, 3. [Google Scholar] [CrossRef]
- Pino, E.J.; Gómez, B.; Monsalve, E.; Aqueveque, P. Wireless Low–Cost Bioimpedance Measurement Device for Lung Capacity Screening. In Proceedings of the 2019 41st Annual International Conference of the IEEE Engineering in Medicine and Biology Society (EMBC), Berlin, Germany, 23–27 July 2019; pp. 1187–1190. [Google Scholar]
- Lionheart, W.R.; Kaipio, J.; McLeod, C.N. Generalized optimal current patterns and electrical safety in EIT. Physiol. Meas. 2001, 22, 85. [Google Scholar] [CrossRef]
- Folliot, D. Efectos Fisiológicos de la Electricidad. In Enciclopedia de Salud y Seguridad en el Trabajo. OIT Cap; INSST: Madrid, Spain, 2002; Available online: https://www.insst.es/documents/94886/161958/Sumario+del+Volumen+I/18ea3013-6f64-4997-88a1-0aadd719faac (accessed on 1 January 2018). (In Spanish)
- Standard, Z.B.O. Guide for Safety in AC Substation Grounding; IEEE Standards Association: Piscataway, NJ, USA, 2006; pp. 80–2000. [Google Scholar]
- National Institutes of Health (US); Office of Medical Applications of Research. Bioelectrical Impedance Analysis in Body Composition Measurement, Proceedings of the National Institutes of Health Technology Assessment Conference Statement, Bethesda, MD, USA, 12–14 December 1994; NIH Office of Medical Applications of Research: Oxford/London, UK, 1994. [CrossRef]
- Gupta, A.K. Respiration Rate Measurement Based on Impedance Pneumography; Texas Instruments Application Report; SPIE Digital Library: Bellingham, WA, USA, 2011. [Google Scholar] [CrossRef]
- Fish, R.M.; Geddes, L.A. Conduction of Electrical Current to and Through the Human Body: A Review. Eplasty 2009, 9, e44. [Google Scholar]
- Ellis, K.J.; Bell, S.J.; Chertow, G.M.; Chumlea, W.C.; Knox, T.A.; Kotler, D.P.; Lukaski, H.C.; Schoeller, D.A. Bioelectrical impedance methods in clinical research: A follow-up to the NIH Technology Assessment Conference. Nutrition 1999, 15, 874–880. [Google Scholar] [CrossRef]
- Bertemes-Filho, P.; Noveletto, F.; Dutra, D. Analog Front-End for the Integrated Circuit AD5933 Used in Electrical Bioimpedance Measurements; Springer: New, York, NY, USA, 2016; pp. 48–51. [Google Scholar] [CrossRef]
- Seoane, F.; Macias, R.; Bragos, R.; Lindecrantz, K. Simple voltage-controlled current source for wideband electrical bioimpedance spectroscopy: Circuit dependences and limitations. Meas. Sci. Technol. 2011, 22, 115801. [Google Scholar] [CrossRef]
- Webster, J.G. Medical Instrumentation Application and Design; John Wiley & Sons: Hoboken, NJ, USA, 2009; pp. 377–436. [Google Scholar]
- Urooj, S.; Khan, M.; Ansari, A.Q.; Salhan, A.K.; Lay-Ekuakille, A. Measurement of Thoracic Impedance & Approximations: A Diagnosis Technique for Clinical Pulmonology. Indian J. Ind. Appl. Math. 2012, 3, 85–93. [Google Scholar]


| Right Hemithorax | Left Hemithorax | |||||||
|---|---|---|---|---|---|---|---|---|
| Subject | [Ω] | [Ω] | Min [Ω] | Max [Ω] | [Ω] | [Ω] | Min [Ω] | Max [Ω] |
| Subject 1 | 475.5 | 2.6 | 470.3 | 484.4 | 487.4 | 1.8 | 483.7 | 493.2 |
| Subject 1 | 473.2 | 2.7 | 668.0 | 482.0 | 482.2 | 1.4 | 479.4 | 486.6 |
| Subject 2 | 424.3 | 1.8 | 419.4 | 428.9 | 405.7 | 2.2 | 402.1 | 411.6 |
| Subject 2 | 416.7 | 2.4 | 409.8 | 424.7 | 406.0 | 3.1 | 399.0 | 413.4 |
| Subject 3 | 423.2 | 2.8 | 419.8 | 434.1 | 407.4 | 1.5 | 405.4 | 414.8 |
| Subject 3 | 411.1 | 0.8 | 409.6 | 414.5 | 400.2 | 0.6 | 398.8 | 401.8 |
| Subject 4 | 464.9 | 2.0 | 461.1 | 471.1 | 481.8 | 2.3 | 478.8 | 490.9 |
| Subject 4 | 454.3 | 1.3 | 451.5 | 458.1 | 480.8 | 2.3 | 477.6 | 489.9 |
| Subject 5 | 433.2 | 5.1 | 419.7 | 440.2 | 453.5 | 2.5 | 448.7 | 460.1 |
| Subject 5 | 422.8 | 4.4 | 411.1 | 429.2 | 447.8 | 1.8 | 444.3 | 453.8 |
| Subject 6 | 613.3 | 3.0 | 607.9 | 622.7 | 630.5 | 3.7 | 626.2 | 644.4 |
| Subject 6 | 625.0 | 2.3 | 620.1 | 632.4 | 637.4 | 1.9 | 635.1 | 647.4 |
| Subject 7 | 618.8 | 2.8 | 614.2 | 627.2 | 622.0 | 2.9 | 616.9 | 631.1 |
| Subject 7 | 616.7 | 3.7 | 611.1 | 631.4 | 633.3 | 2.5 | 629.9 | 644.7 |
| Subject 8 | 409.5 | 3.1 | 405.6 | 419.3 | 393.5 | 2.3 | 389.4 | 401.8 |
| Subject 8 | 402.7 | 2.6 | 399.5 | 412.3 | 390.5 | 2.7 | 386.9 | 400.1 |
| Subject 9 | 507.1 | 3.3 | 501.7 | 519.4 | 510.8 | 3.5 | 506.3 | 525.3 |
| Subject 9 | 500.9 | 3.2 | 495.6 | 512.1 | 507.6 | 3.7 | 504.2 | 521.3 |
| Subject 10 | 303.2 | 2.0 | 300.9 | 311.6 | 315.2 | 2.2 | 312.0 | 323.7 |
| Subject 10 | 296.0 | 1.9 | 294.1 | 305.2 | 311.7 | 2.2 | 309.8 | 321.5 |
| Subject 11 | 359.0 | 1.9 | 356.4 | 366.2 | 395.8 | 2.3 | 392.3 | 405.2 |
| Subject 11 | 347.8 | 1.8 | 346.1 | 356.3 | 386.9 | 2.0 | 385.1 | 396.7 |
| Subject 12 | 322.6 | 2.1 | 319.2 | 381.6 | 336.9 | 1.9 | 334.1 | 345.3 |
| Subject 12 | 315.2 | 1.9 | 312.6 | 324.3 | 333.6 | 1.8 | 331.4 | 342.3 |
| Subject 13 | 463.6 | 2.1 | 459.8 | 470.3 | 477.7 | 2.5 | 472.6 | 486.2 |
| Subject 13 | 454.2 | 1.5 | 452.0 | 461.5 | 472.2 | 2.5 | 468.4 | 483.1 |
| Subject 14 | 378.9 | 3.6 | 373.1 | 386.8 | 387.3 | 2.7 | 382.5 | 392.6 |
| Subject 14 | 365.2 | 2.6 | 361.2 | 372.6 | 377.3 | 1.8 | 374.2 | 383.3 |
| Subject 15 | 418.8 | 4.4 | 411.4 | 431.7 | 424.2 | 3.1 | 419.3 | 432.8 |
| Subject 15 | 404.8 | 3.6 | 399.1 | 418.6 | 418.2 | 2.4 | 414.8 | 427.3 |
| 437.4 | 2.6 | 438.3 | 446.4 | 445.7 | 2.3 | 442.2 | 454.45 | |
© 2020 by the authors. Licensee MDPI, Basel, Switzerland. This article is an open access article distributed under the terms and conditions of the Creative Commons Attribution (CC BY) license (http://creativecommons.org/licenses/by/4.0/).
Share and Cite
Aqueveque, P.; Gómez, B.; Monsalve, E.; Germany, E.; Ortega-Bastidas, P.; Dubo, S.; Pino, E.J. Simple Wireless Impedance Pneumography System for Unobtrusive Sensing of Respiration. Sensors 2020, 20, 5228. https://doi.org/10.3390/s20185228
Aqueveque P, Gómez B, Monsalve E, Germany E, Ortega-Bastidas P, Dubo S, Pino EJ. Simple Wireless Impedance Pneumography System for Unobtrusive Sensing of Respiration. Sensors. 2020; 20(18):5228. https://doi.org/10.3390/s20185228
Chicago/Turabian StyleAqueveque, Pablo, Britam Gómez, Emyrna Monsalve, Enrique Germany, Paulina Ortega-Bastidas, Sebastián Dubo, and Esteban J. Pino. 2020. "Simple Wireless Impedance Pneumography System for Unobtrusive Sensing of Respiration" Sensors 20, no. 18: 5228. https://doi.org/10.3390/s20185228
APA StyleAqueveque, P., Gómez, B., Monsalve, E., Germany, E., Ortega-Bastidas, P., Dubo, S., & Pino, E. J. (2020). Simple Wireless Impedance Pneumography System for Unobtrusive Sensing of Respiration. Sensors, 20(18), 5228. https://doi.org/10.3390/s20185228