Development of the User Requirements for the Canadian WildFireSat Satellite Mission

 , , ,
, , ,  , and
, and
Abstract
1. Introduction
2. Wildfire Management Needs Assessment
2.1. Wildfire Management Engagement
Survey Results
2.2. Summary of Wildfire Manager Needs
2.2.1. Fast and Consistent Data Delivery
2.2.2. Mapping of Active and Inactive Wildfire Areas
2.2.3. Wildfire Behavior and Threat Estimates
2.2.4. Detection in Remote Regions
2.2.5. Smoke and Air Quality Information
2.3. Fire Management Functionalities:
- (1)
- The Area of Interest (AoI) is defined as the whole vegetated Canadian landmass (Figure 2);
- (2)
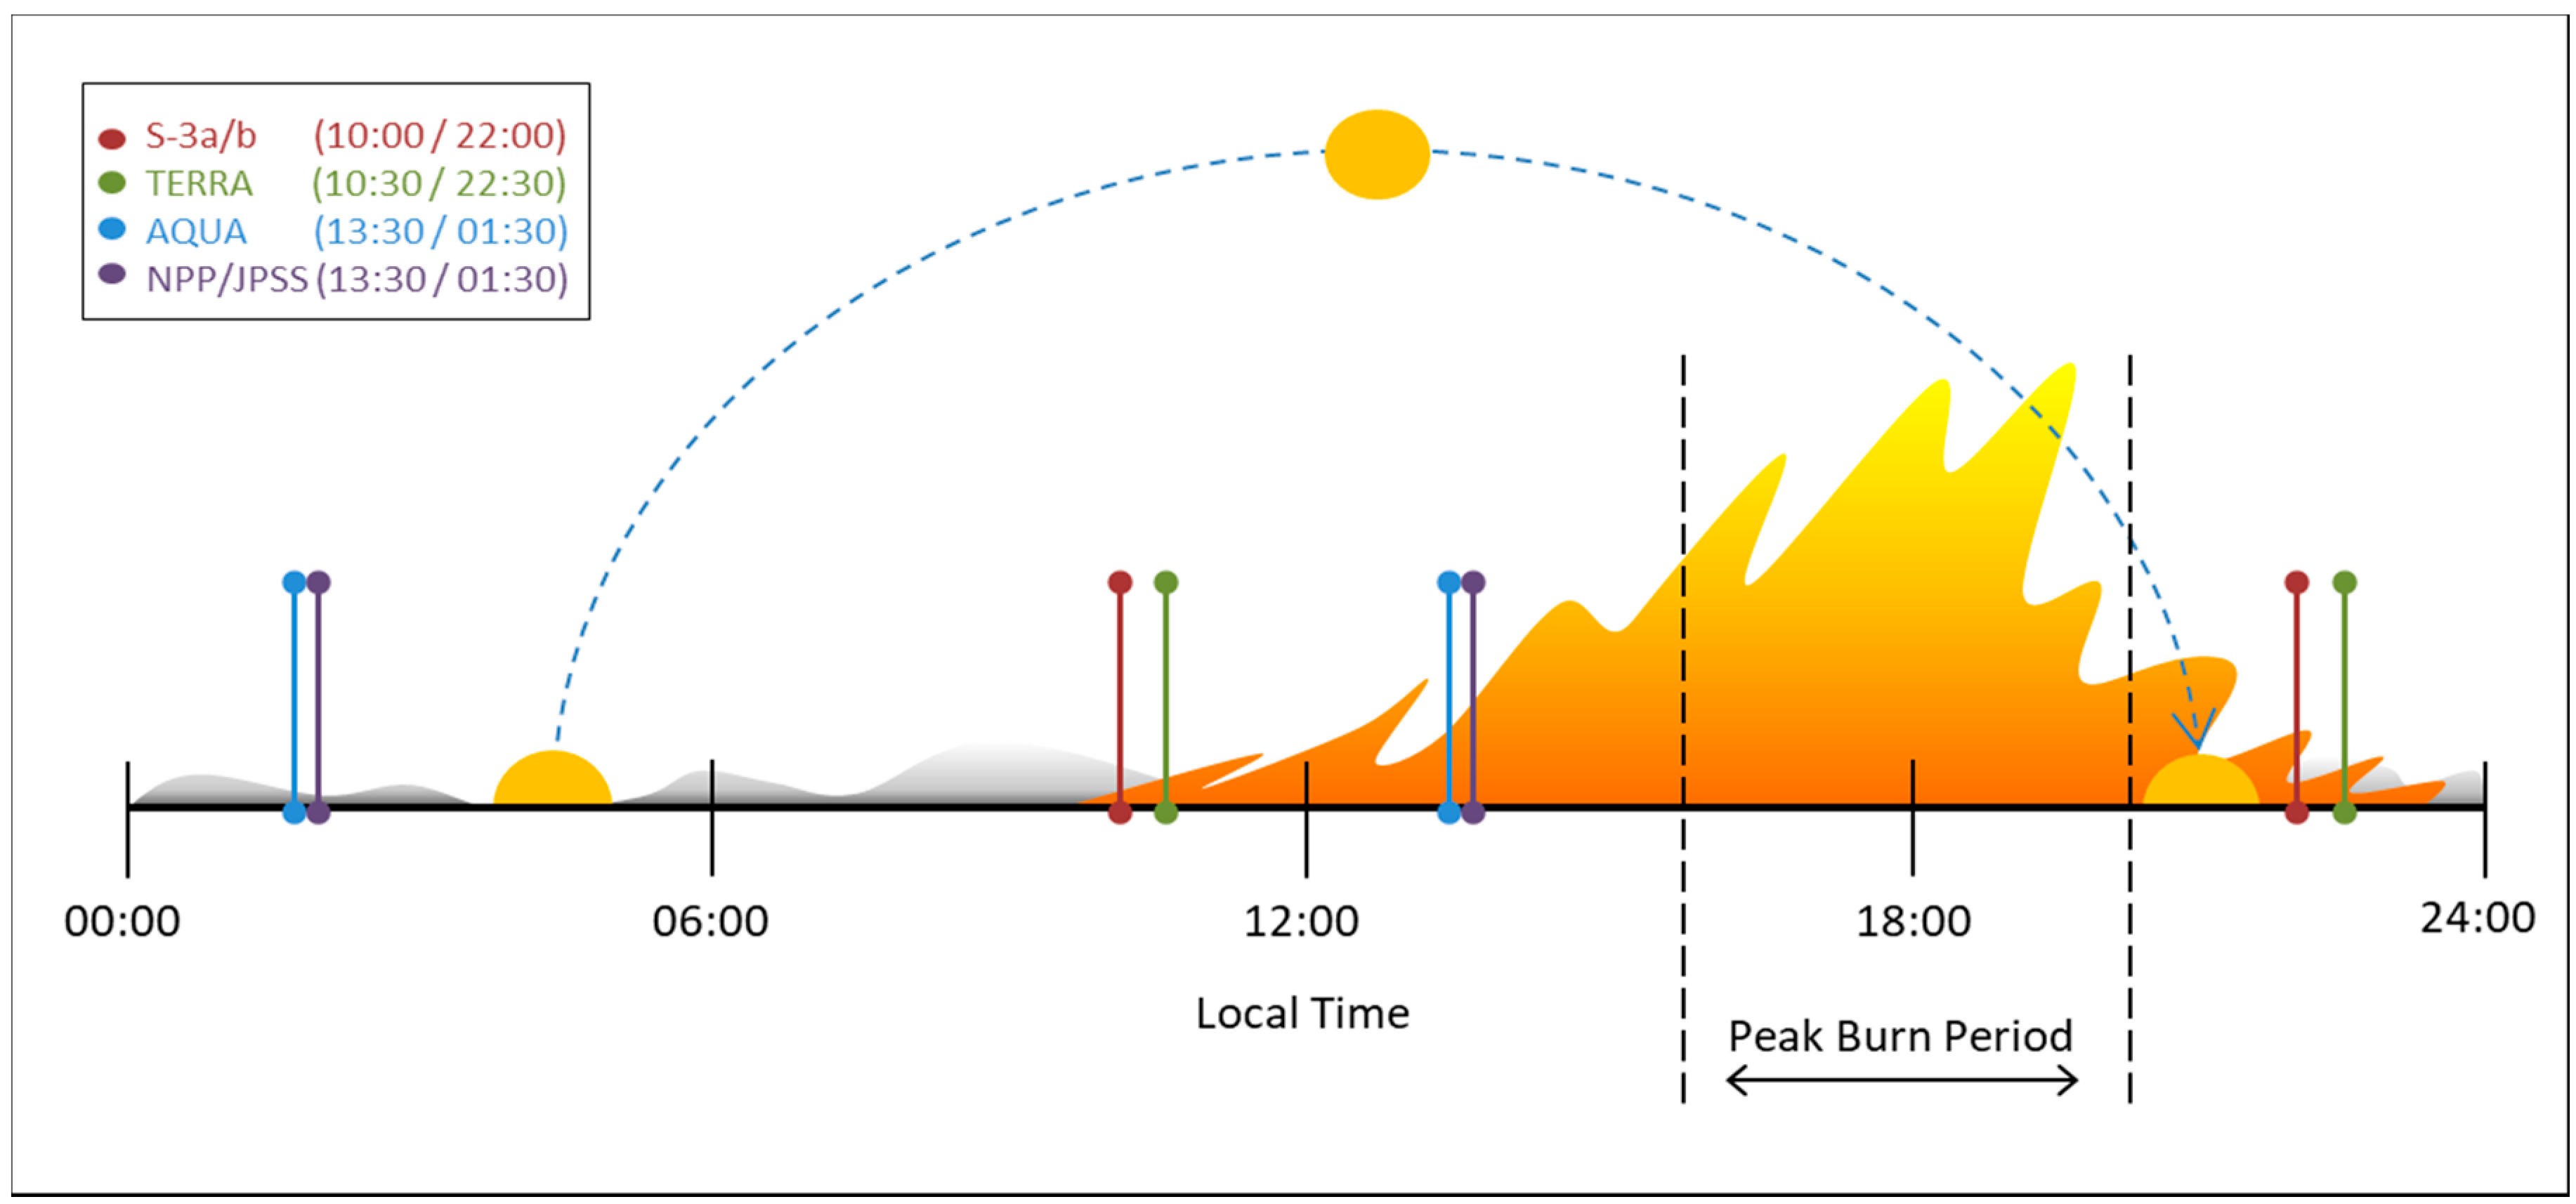
- Daily (or better) coverage of the AoI at a specific and consistent time of day including peak burn (1600–2000 local time), with data delivery (to end-users) before the start of the operational response period (~0700 local) for overnight observations and before the end of day planning period (~1900 local) for peak burn observations;
- (3)
- Detection and mapping of wildfires and their plumes, specifically:
- i.
- The ability to detect wildfires with comparable or improved sensitivity to existing satellite systems, and to serve as an early-detection system for remote access wildfires;
- ii.
- There must be sufficient spatial resolution and geolocation accuracy for locating and mapping wildfires in relation to their previous position and other landscape features;
- (4)
- Estimation of wildfire behavior, specifically:
- i.
- The ability to collect FRP measurements;
- ii.
- The ability to characterize sub-pixel wildfire features (e.g., temperature and area);
- (5)
- Compatibility with other available EO data sources and formats;
- (6)
- Near-real-time data, with tactical products to be delivered within 30 min, and a 2-h latency for all end-user products as threshold for utility.
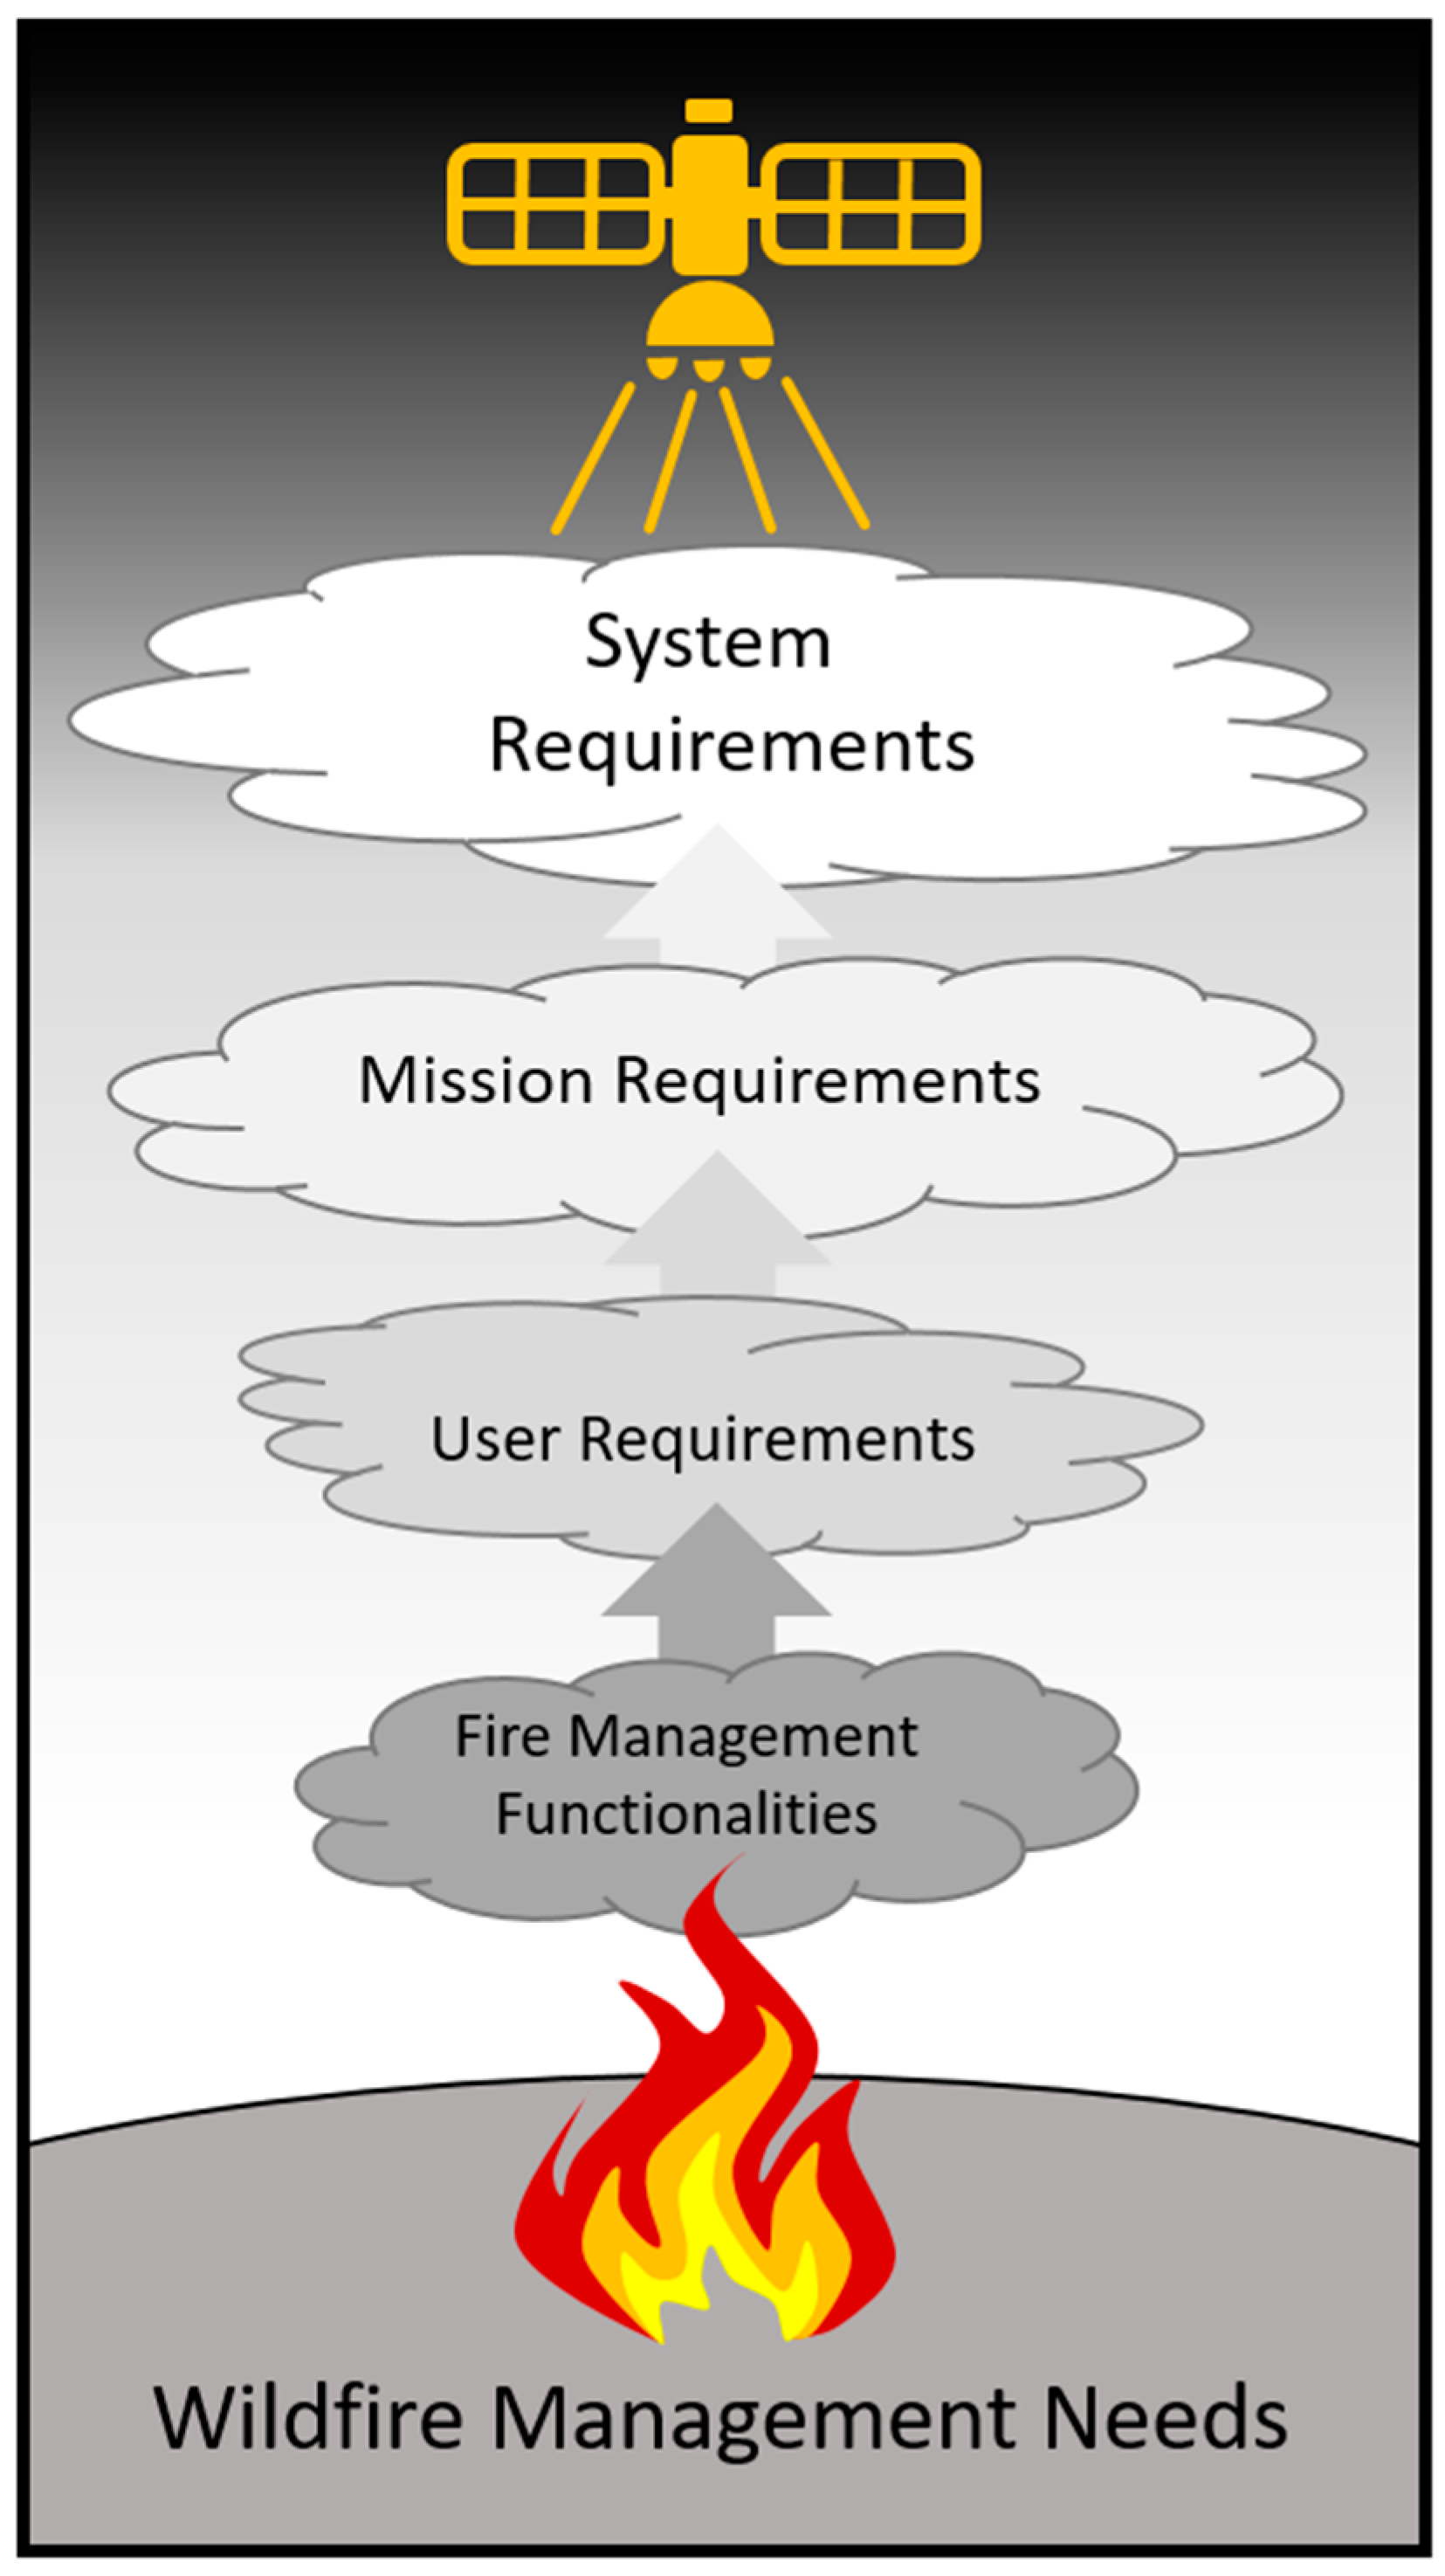
3. Definition of the User Requirements
3.1. Observation Requirements
3.1.1. Coverage Requirements
3.1.2. Latency Requirements
3.2. Measurement Requirements
3.2.1. MWIR and LWIR Band Requirements
3.2.2. VIS and NIR Requirements
3.3. Precision Requirements
3.3.1. Sensitivity and Noise Requirements
3.3.2. Co-Registration Requirements
3.3.3. Image Quality and Geo-Location Requirements
4. Discussion
5. Conclusions
Author Contributions
Funding
Acknowledgments
Conflicts of Interest
References
- Hall, J.V.; Zhang, R.; Schroeder, W.; Huang, C.; Giglio, L. Validation of GOES-16 ABI and MSG SEVIRI active fire products. Int. J. Appl. Earth Obs. Geoinf. 2019, 83, 101928. [Google Scholar] [CrossRef]
- Freeborn, P.; Wooster, M.J.; Roberts, G. Addressing the spatiotemporal sampling design of MODIS to provide estimates of the fire radiative energy emitted from Africa. Remote Sens. Environ. 2011, 115, 475–489. [Google Scholar] [CrossRef]
- Freeborn, P.H.; Wooster, M.J.; Roberts, G.; Malamud, B.D.; Xu, W. Development of a virtual active fire product for Africa through a synthesis of geostationary and polar orbiting satellite data. Remote Sens. Environ. 2009, 113, 1700–1711. [Google Scholar] [CrossRef]
- Sirish, U.; Changyong, C.; Xi, S. Geo-Leo intercalibration to evaluate the radiometric performance of NOAA-20 VIIRS and GOES-16 ABI. Proc. SPIE 2019, 11127. [Google Scholar] [CrossRef]
- Lindley, T.; Anderson, A.; Mahale, V.; Curl, T.; Line, W.; Lindstrom, S.; Bachmeier, S. Wildfire detection notifications for impact-based decision support services in Oklahoma using geostationary super rapid scan satellite imagery. J. Oper. Meteorol. 2016, 4, 182–191. [Google Scholar] [CrossRef]
- MNP. A Review of the 2016 Horse River Wildfire: Alberta Agriculture and Forestry Preparedness and Response; MNP LLP: Edmonton, AB, Canada, 2017; Available online: https://open.alberta.ca/publications/a-review-of-the-2016-horse-river-wildfire-alberta-agriculture-and-forestry-preparedness-and-response (accessed on 24 August 2020).
- Schmidt, C. Chapter 13—Monitoring Fires with the GOES-R Series. In The GOES-R Series; Goodman, S.J., Schmit, T.J., Daniels, J., Redmon, R.J., Eds.; Elsevier: Amsterdam, The Netherlands, 2020; pp. 145–163. [Google Scholar] [CrossRef]
- Fischer, C.; Klein, D.; Kerr, G.; Stein, E.; Lorenz, E.; Frauenberger, O.; Borg, E. Data Validation and Case Studies Using the TET-1 Thermal Infrared Satellite System. Int. Arch. Photogramm. Remote Sens. Spat. Inf. Sci. 2015, XL-7/W3, 1177–1182. [Google Scholar] [CrossRef]
- Zhukov, B.; Briess, K.; Lorenz, E.; Oertel, D.; Skrbek, W. Detection and analysis of high-temperature events in the BIRD mission. Acta Astronaut. 2005, 56, 65–71. [Google Scholar] [CrossRef]
- Zhukov, B.; Lorenz, E.; Oertel, D.; Wooster, M.; Roberts, G. Spaceborne detection and characterization of fires during the bi-spectral infrared detection (BIRD) experimental small satellite mission (2001–2004). Remote Sens. Environ. 2006, 100, 29–51. [Google Scholar] [CrossRef]
- GEO. Global Wildfire Information System (GWIS). 2020. Available online: https://gwis.jrc.ec.europa.eu/ (accessed on 24 August 2020).
- Stocks, B.J.; Mason, J.A.; Todd, J.B.; Bosch, E.M.; Wotton, B.M.; Amiro, B.D.; Flannigan, M.D.; Hirsch, K.G.; Logan, K.A.; Martell, D.L.; et al. Large forest fires in Canada, 1959–1997. J. Geophys. Res. 2002, 108. [Google Scholar] [CrossRef]
- CIFFC Glossary Task Team and Training Working Group. Canadian Wildland Fire Management Glossary; Canadian Interagency Forest Fire Centre: Winnipeg, MB, Canada, 2017; Available online: https://www.ciffc.ca/sites/default/files/2019-03/CIFFC_Canadian_Wildland_Fire_Mgmt_Glossary_2017_10_24.pdf (accessed on 24 August 2020).
- Tymstra, C.; Stocks, B.J.; Cai, X.; Flannigan, M.D. Wildfire management in Canada: Review, challenges and opportunities. Prog. Disaster Sci. 2020, 5, 100045. [Google Scholar] [CrossRef]
- McAlpine, R.S.; Hirsch, K.G. LEOPARDS—Level of Protection Analysis Software. For. Chron. 1998, 75, 615–621. [Google Scholar] [CrossRef]
- Wotton, B.M.; Stocks, B.J. Fire Management in Canada: Vulnerability and Risk Trends. In Canadian Wildland Fire Strategy: Background Synthesis, Analysis, and Perspectives; Hirsch, K., Fuglem, P., Eds.; Canadian Council of Forest Ministers, Natural Resources Canada, Canadian Forest Service, Northern Forestry Centre: Edmonton, AB, Canada, 2006; pp. 49–55. [Google Scholar]
- Hanes, C.C.; Wang, X.; Jain, P.; Parisien, M.-A.; Little, J.M.; Flannigan, M.D. Fire-regime changes in Canada over the last half century. Can. J. For. Res. 2018, 49, 256–269. [Google Scholar] [CrossRef]
- Podur, J.; Wotton, M. Will climate change overwhelm fire management capacity? Ecol. Mod. 2010, 221, 1301–1309. [Google Scholar] [CrossRef]
- Wotton, B.M.; Flannigan, M.D.; Marshall, G.A. Potential climate change impacts on fire intensity and key wildfire suppression thresholds in Canada. Environ. Res. Lett. 2017, 12, 095003. [Google Scholar] [CrossRef]
- Kourtz, P. The Need for Improved Forest Fire Detection. For. Chron. 1987, 63, 272–277. [Google Scholar] [CrossRef]
- Flannigan, M.D.; Vonder Haar, T.H. Forest fire monitoring using NOAA satellite AVHRR. Can. J. For. Res. 1986, 16, 975–982. [Google Scholar] [CrossRef]
- Johnston, J.M.; Johnston, L.M.; Wooster, M.J.; Brookes, A.; McFayden, C.; Cantin, A.S. Satellite detection limitations of sub-canopy smouldering wildfires in the North American boreal forest. Fire 2018, 1, 28. [Google Scholar] [CrossRef]
- McFayden, C.B.; Boychuk, D.; Woolford, D.G.; Wheatley, M.J.; Johnston, L. Impacts of wildland fire effects on resources and assets through expert elicitation to support fire response decisions. Int. J. Wildland Fire 2019, 28, 885–900. [Google Scholar] [CrossRef]
- Munoz-Alpizar, R.; Pavlovic, R.; Moran, M.D.; Chen, J.; Gravel, S.; Henderson, S.B.; Ménard, S.; Racine, J.; Duhamel, A.; Gilbert, S.; et al. Multi-Year (2013–2016) PM2.5 Wildfire Pollution Exposure over North America as Determined from Operational Air Quality Forecasts. Atmosphere 2017, 8, 179. [Google Scholar] [CrossRef]
- Beverly, J.L.; Bothwell, P. Wildfire evacuations in Canada 1980–2007. Nat. Hazards 2011, 59, 571–596. [Google Scholar] [CrossRef]
- Johnston, L.M.; Wang, X.; Erni, S.; Taylor, S.W.; McFayden, C.B.; Oliver, J.A.; Stockdale, C.; Christianson, A.; Boulanger, Y.; Gauthier, S.; et al. Wildland fire risk research in Canada. Environ. Rev. 2020, 28, 164–186. [Google Scholar] [CrossRef]
- McGee, T.; McFarlane, B.; Tymstra, C. Wildfire: A Canadian Perspective. In Wildfire Hazards, Risks, and Disasters; Paton, D., Ed.; Elsevier: Waltham, MA, USA, 2015. [Google Scholar] [CrossRef]
- D’Amours, R.; Malo, A.; Flesch, T.; Wilson, J.; Gauthier, J.-P.; Servranckx, R. The Canadian Meteorological Centre’s Atmospheric Transport and Dispersion Modelling Suite. Atmos. Ocean 2015, 53, 176–199. [Google Scholar] [CrossRef]
- Schigas, R.; Stull, R. BlueSky Canada Part 3—BlueSky Canada Wildfire Smoke: Status at UBC. Can. Smoke Newsl. 2013, 2013, 29–32. [Google Scholar]
- Pavlovic, R.; Chen, J.; Anderson, K.; Moran, M.D.; Beaulieu, P.-A.; Davignon, D.; Cousineau, S. The FireWork air quality forecast system with near-real-time biomass burning emissions: Recent developments and evaluation of performance for the 2015 North American wildfire season. J. Air Waste Manag. Assoc. 2016, 66, 819–841. [Google Scholar] [CrossRef] [PubMed]
- Mota, B.; Wooster, M.J. A new top-down approach for directly estimating biomass burning emissions and fuel consumption rates and totals from geostationary satellite fire radiative power (FRP). Remote Sens. Environ. 2018, 206, 45–62. [Google Scholar] [CrossRef]
- Wooster, M.J.; Roberts, G.; Perry, G.L.W.; Kaufman, Y.J. Retrieval of biomass combustion rates and totals from fire radiative power observations: FRP derivation and calibration relationships between biomass consumption and fire radiative energy release. J. Geophys. Res. 2005, 110, D24311. [Google Scholar] [CrossRef]
- Kaiser, J.W.; Heil, A.; Andreae, M.O.; Benedetti, A.; Chubarova, N.; Jones, L.; Morcrette, J.-J.; Razinger, M.; Schultz, M.G.; Suttie, M.; et al. Biomass burning emissions estimated with a global fire assimilation system based on observed fire radiative power. Biogeosciences 2012, 9, 527–554. [Google Scholar] [CrossRef]
- Coogan, S.C.P.; Robinne, F.-N.; Jain, P.; Flannigan, M.D. Scientists’ warning on wildfire—A Canadian perspective. Can. J. For. Res. 2019, 49, 1015–1023. [Google Scholar] [CrossRef]
- Flannigan, M.D.; Krawchuk, M.A.; de Groot, W.J.; Wotton, B.M.; Gowman, L.M. Impacts of changing climate for global wildland fire. Int. J. Wildland Fire 2009, 18, 483–507. [Google Scholar] [CrossRef]
- Boulanger, Y.; Parisien, M.-A.; Wang, X. Model-specification uncertainty in future area burned by wildfires in Canada. Int. J. Wildland Fire 2018, 27, 164–175. [Google Scholar] [CrossRef]
- Flannigan, M.D.; Wotton, B.M.; Marshall, G.A.; de Groot, W.J.; Johnston, J.; Jurko, N.; Cantin, A.S. Fuel moisture sensitivity to temperature and precipitation: Climate change implications. Clim. Change 2016, 134, 59–71. [Google Scholar] [CrossRef]
- Krawchuk, M.A.; Moritz, M.A.; Parisien, M.-A.; Van Dorn, J.; Hayhoe, K. Global Pyrogeography: The Current and Future Distribution of Wildfire. PLoS ONE 2009, 4, e5102. [Google Scholar] [CrossRef] [PubMed]
- Woolford, D.G.; Dean, C.; Martell, D.L.; Cao, J.; Wotton, B. Lightning-caused forest fire risk in Northwestern Ontario, Canada, is increasing and associated with anomalies in fire weather. Environmetrics 2014, 25, 406–416. [Google Scholar] [CrossRef]
- Wotton, B.M.; Nock, C.A.; Flannigan, M.D. Forest fire occurrence and climate change in Canada. Int. J. Wildland Fire 2010, 19, 253–271. [Google Scholar] [CrossRef]
- Xianli, W.; Kala, S.; Marc-Andre, P.; Steve, W.T.; Jean-Noël, C.; Yan, B.; Mike, D.F. Projected changes in fire size from daily spread potential in Canada over the 21st century. Environ. Res. Lett. 2020. [Google Scholar] [CrossRef]
- Wang, X.; Thompson, D.K.; Marshall, G.A.; Tymstra, C.; Carr, R.; Flannigan, M.D. Increasing frequency of extreme fire weather in Canada with climate change. Clim. Chang. 2015, 130, 573–586. [Google Scholar] [CrossRef]
- Van Mierlo, H. Business Case for WildFireSat; Canadian Space Agency, Ed.; Space Utilization: St Hubert, QC, Canada, 2019. [Google Scholar]
- Ngo Phong, L.; Pancrati, O.; Marchese, M.; Châteauneuf, F. Spaceborne linear arrays of 512 × 3 microbolometers. Proc. SPIE 2013, 8614. [Google Scholar] [CrossRef]
- Hamel, J.-F.; St-Amour, A.; de Lafontaine, J.; Van Mierlo, M.; Lawrence, B.; Ngo Phong, L.; Lynham, T.J.; Johnston, J.M.; Cain, J.; Lihou, M.; et al. The innovative microsatellite-based Canadian wildland fire monitoring system. In Proceedings of the 66th International Astronautical Congress, Jerusalem, Israel, 12–16 October 2015; pp. 1–7. [Google Scholar]
- Ngo Phong, L.; Dufour, D.; Johnston, J.; Chevalier, C.; Côté, P.; Fisette, B.; Wang, M.; Châteauneuf, F. A low resource imaging radiometer for nanosatellite based fire diagnosis. Proc. SPIE 2018, 10765. [Google Scholar] [CrossRef]
- Schroeder, W.; Oliva, P.; Giglio, L.; Csiszar, I.A. The New VIIRS 375 m active fire detection data product: Algorithm description and initial assessment. Remote Sens. Environ. 2014, 143, 85–96. [Google Scholar] [CrossRef]
- Xu, W.; Wooster, M.J.; He, J.; Zhang, T. First study of Sentinel-3 SLSTR active fire detection and FRP retrieval: Night-time algorithm enhancements and global intercomparison to MODIS and VIIRS AF products. Remote Sens. Environ. 2020, 248, 111947. [Google Scholar] [CrossRef]
- Lynham, T.J.; Johnston, J.M.; Ball, D.; Phong, L.N.; Ng, A.; Lawrence, B. Canadian Wildland Fire Monitoring System User Requirements Document, version 4.0; Canadian Space Agency: St Hubert, QC, Canada, 2015; in press. [Google Scholar]
- Jackson, N.; Johnston, J.M. WildFireSat: Mission Requirements Document Rev-A.; Canadian Space Agency: St Hubert, QC, Canada, 2020; p. 51. [Google Scholar]
- Johnston, J.M.; van Mierlo, H. Wildfire Remote Sensing Workshop, Report. In Proceedings of the EO Summit 2017, Montreal, QC, Canada, 11 April 2018; p. 54. Available online: https://crss-sct.ca/wp-content/uploads/2018/04/EO-Summit-2017-Wildfire-Remote-Sensing-Workshop-Report-2018-04-11.pdf (accessed on 24 August 2020).
- Scott, J.H.; Thompson, M.P.; Calkin, D.E. A Wildland Fire Risk Assessment Framework for Land and Resource Management; RMRS-GTR-315; U.S. Department of Agriculture, Forest Service, Rocky Mountain Research Station: Fort Collins, CO, USA, 2013. [Google Scholar] [CrossRef]
- Taber, M.A.; Elenz, L.M.; Langowski, P.G. Decision Making for Wildfires: A Guide for Applying a Risk Management Process at the Incident Level; General Technical Report RMRS-GTR-298; U.S. Department of Agriculture, Forest Service, Rocky Mountain Research Station: Fort Collins, CO, USA, 2013. [Google Scholar] [CrossRef]
- Rapp, C.; Rabung, E.; Wilson, R.; Toman, E. Wildfire decision support tools: An exploratory study of use in the United States. Int. J. Wildland Fire 2020, 29, 581–594. [Google Scholar] [CrossRef]
- Oliva, P.; Schroeder, W. Assessment of VIIRS 375m active fire detection product for direct burned area mapping. Remote Sens. Environ. 2015, 160, 144–155. [Google Scholar] [CrossRef]
- Johnston, J.M.; Wheatley, M.J.; Wooster, M.J.; Paugam, R.; Davies, G.M.; DeBoer, K.A. Flame-Front Rate of Spread Estimates for Moderate Scale Experimental Fires Are Strongly Influenced by Measurement Approach. Fire 2018, 1, 16. [Google Scholar] [CrossRef]
- McRae, D.J.; Jin, J.-Z.; Conard, S.G.; Sukhinin, A.I.; Ivanova, G.A.; Blake, T.W. Infrared characterization of fine-scale variability in behaviour of boreal forest fires. Can. J. For. Res. 2005, 35, 2194–2206. [Google Scholar] [CrossRef]
- Johnston, J.M.; Wooster, M.J.; Paugam, R.; Wang, X.; Lynham, T.J.; Johnston, L.M. Direct Estimation of Byram’s fire intensity from infrared remote sensing imagery. Int. J. Wildland Fire 2017, 26, 668–684. [Google Scholar] [CrossRef]
- Johnston, L.M.; Flannigan, M.D. Mapping Canadian wildland fire interface areas. Int. J. Wildland Fire 2018, 27, 1–14. [Google Scholar] [CrossRef]
- McFayden, C.B.; Woolford, D.G.; Stacey, A.; Boychuk, D.; Johnston, J.M.; Wheatley, M.J.; Martell, D.L. Risk assessment for wildland fire aerial detection patrol route planning in Ontario, Canada. Int. J. Wildland Fire 2020, 29, 28–41. [Google Scholar] [CrossRef]
- Kochi, I.; Donovan, G.H.; Champ, P.A.; Loomis, J.B. The economic cost of adverse health effects from wildfire-smoke exposure: A review. Int. J. Wildland Fire 2010, 19, 803–817. [Google Scholar] [CrossRef]
- Krstic, N.; Henderson, S.B. Use of MODIS data to assess atmospheric aerosol before, during, and after community evacuations related to wildfire smoke. Remote Sens. Environ. 2015, 166, 1–7. [Google Scholar] [CrossRef]
- Richardson, L.A.; Champ, P.A.; Loomis, J.B. The hidden cost of wildfires: Economic valuation of health effects of wildfire smoke exposure in Southern California. J. For. Econ. 2012, 18, 14–35. [Google Scholar] [CrossRef]
- Yao, J.; Henderson, S.B. An empirical model to estimate daily forest fire smoke exposure over a large geographic area using air quality, meteorological, and remote sensing data. J. Expo. Sci. Environ. Epidemiol. 2014, 24, 328–335. [Google Scholar] [CrossRef] [PubMed]
- Lee, S.-Y.; Gan, C.; Chew, B.N. Visibility deterioration and hygroscopic growth of biomass burning aerosols over a tropical coastal city: A case study over Singapore’s airport. Atmos. Sci. Lett. 2016, 17, 624–629. [Google Scholar] [CrossRef]
- Chen, J.; Anderson, K.; Pavlovic, R.; Moran, M.D.; Englefield, P.; Thompson, D.K.; Munoz-Alpizar, R.; Landry, H. The FireWork v2.0 air quality forecast system with biomass burning emissions from the Canadian Forest Fire Emissions Prediction System v2.03. Geosci. Model Dev. 2019, 12, 3283–3310. [Google Scholar] [CrossRef]
- Larkin, N.K.; O’Neill, S.M.; Solomon, R.; Raffuse, S.; Strand, T.; Sullivan, D.C.; Krull, C.; Rorig, M.; Peterson, J.; Ferguson, S.A. The BlueSky smoke modeling framework. Int. J. Wildland Fire 2009, 18, 906–920. [Google Scholar] [CrossRef]
- Gonzi, S.; Palmer, P.I.; Paugam, R.; Wooster, M.; Deeter, M.N. Quantifying pyroconvective injection heights using observations of fire energy: Sensitivity of spaceborne observations of carbon monoxide. Atmos. Chem. Phys. 2015, 15, 4339–4355. [Google Scholar] [CrossRef]
- Paugam, R.; Wooster, M.J.; Atherton, J.; Freitas, S.R.; Schultz, M.G.; Kaiser, J.W. Development and optimization of a wildfire plume rise model based on remote sensing data inputs—Part 2. Atmos. Chem. Phys. Discuss. 2015, 15, 9815–9895. [Google Scholar] [CrossRef]
- Johnston, J.M. Infrared Remote Sensing of Fire Behaviour in Canadian Wildland Forest Fuels. Ph.D. Thesis, King’s College London, London, UK, 2016. [Google Scholar]
- Sperling, S.; Wooster, M.J.; Malamud, B.D. Influence of Satellite Sensor Pixel Size and Overpass Time on Undercounting of Cerrado/Savannah Landscape-Scale Fire Radiative Power (FRP): An Assessment Using the MODIS Airborne Simulator. Fire 2020, 3, 11. [Google Scholar] [CrossRef]
- Johnston, J.M.; Paugam, R.; Whitman, E.; Schiks, T.; Cantin, A.S. Remote Sensing of Fire Behavior. In Encyclopedia of Wildfires and Wildland-Urban Interface (WUI) Fires; Manzello, S.L., Ed.; Springer International Publishing: Cham, Switzerland, 2019; pp. 1–5. Available online: https://link.springer.com/content/pdf/10.1007%2F978-3-319-51727-8_174-1.pdf (accessed on 24 August 2020). [CrossRef]
- Dozier, J. A Method for Satellite Identification of Surface Temperature Fields of Subpixel Resolution. Remote Sens. Environ. 1981, 11, 221–229. [Google Scholar] [CrossRef]
- Giglio, L.; Schroeder, W.; Justice, C.O. The Collection 6 MODIS Active Fire Detection Algorithm and Fire Products. Remote Sens. Environ. 2016, 178, 31–41. [Google Scholar] [CrossRef]
- Wooster, M.J.; Xu, W.; Nightingale, T. Sentinel-3 SLSTR active fire detection and FRP product: Pre-launch algorithm development and performance evaluation using MODIS and ASTER datasets. Remote Sens. Environ. 2012, 120, 236–254. [Google Scholar] [CrossRef]
- Smith, A.M.S.; Wooster, M.J. Remote classification of head and backfire types from MODIS fire radiative power and smoke plume observations. Int. J. Wildland Fire 2005, 14, 249–254. [Google Scholar] [CrossRef]
- Wooster, M.J.; Zhang, Y.H. Boreal forest fires burn less intensely in Russia than in North America. Geophys. Res. Lett. 2004, 31. [Google Scholar] [CrossRef]
- Zhang, T.; Wooster, M.J.; Xu, W. Approaches for synergistically exploiting VIIRS I- and M-Band data in regional active fire detection and FRP assessment: A demonstration with respect to agricultural residue burning in Eastern China. Remote Sens. Environ. 2017, 198, 407–424. [Google Scholar] [CrossRef]
- Whitman, E.; Johnston, J.M.; Schiks, T.; Paugam, R.; Cantin, A.S. Imaging Postfire Environments. In Encyclopedia of Wildfires and Wildland-Urban Interface (WUI) Fires; Manzello, S.L., Ed.; Springer International Publishing: Cham, Switzerland, 2019; pp. 1–6. Available online: https://link.springer.com/content/pdf/10.1007%2F978-3-319-51727-8_175-1.pdf (accessed on 24 August 2020). [CrossRef]
- Giglio, L.; Randerson, J.T.; van der Werf, G.R. Analysis of daily, monthly, and annual burned area using the fourth-generation global fire emissions database (GFED4). J. Geophys. Res. Biogeosci. 2013, 118, 317–328. [Google Scholar] [CrossRef]
- Chuvieco, E.; Mouillot, F.; van der Werf, G.R.; San Miguel, J.; Tanase, M.; Koutsias, N.; García, M.; Yebra, M.; Padilla, M.; Gitas, I.; et al. Historical background and current developments for mapping burned area from satellite Earth observation. Remote Sens. Environ. 2019, 225, 45–64. [Google Scholar] [CrossRef]
- Hall, R.J.; Skakun, R.S.; Metsaranta, J.M.; Landry, R.; Fraser, R.H.; Raymond, D.; Gartrell, M.; Decker, V.; Little, J. Generating annual estimates of forest fire disturbance in Canada: The National Burned Area Composite. Int. J. Wildland Fire 2020. [Google Scholar] [CrossRef]
- Roy, D.P.; Huang, H.; Boschetti, L.; Giglio, L.; Yan, L.; Zhang, H.H.; Li, Z. Landsat-8 and Sentinel-2 burned area mapping—A combined sensor multi-temporal change detection approach. Remote Sens. Environ. 2019, 231, 111254. [Google Scholar] [CrossRef]
- van der Werf, G.R.; Randerson, J.T.; Giglio, L.; van Leeuwen, T.T.; Chen, Y.; Rogers, B.M.; Mu, M.; van Marle, M.J.E.; Morton, D.C.; Collatz, G.J.; et al. Global fire emissions estimates during 1997–2016. Earth Syst. Sci. Data 2017, 9, 697–720. [Google Scholar] [CrossRef]
- Freeborn, P.; Wooster, M.J.; Hao, W.M.; Ryan, C.A.; Nordgren, B.L.; Baker, S.P.; Ichoku, C. Relationships between energy release, fuel mass loss, and trace gas and aerosol emissions during laboratory biomass fires. J. Geophys. Res. 2008, 113. [Google Scholar] [CrossRef]
- Irons, J.R.; Dwyer, J.L.; Barsi, J.A. The next Landsat satellite: The Landsat Data Continuity Mission. Remote Sens. Environ. 2012, 122, 11–21. [Google Scholar] [CrossRef]
- Giglio, L.; Kendall, J.D. Application of the Dozier retrieval to wildfire characterization: A sensitivity analysis. Remote Sens. Environ. 2001, 77, 34–49. [Google Scholar] [CrossRef]
- Crowley, M.A.; Cardille, J.A.; White, J.C.; Wulder, M.A. Multi-sensor, multi-scale, Bayesian data synthesis for mapping within-year wildfire progression. Remote Sens. Lett. 2019, 10, 302–311. [Google Scholar] [CrossRef]
- Duncan, B.N.; Ott, L.E.; Abshire, J.B.; Brucker, L.; Carroll, M.L.; Carton, J.; Comiso, J.C.; Dinnat, E.P.; Forbes, B.C.; Gonsamo, A.; et al. Space-Based Observations for Understanding Changes in the Arctic-Boreal Zone. Rev. Geophys. 2020, 58, e2019RG000652. [Google Scholar] [CrossRef]
- Kidder, S.Q.; Vonder Haar, T.H. On the Use of Satellites in Molniya Orbits for Meteorological Observation of Middle and High Latitudes. J. Atmos. Ocean. Technol. 1990, 7, 517–522. [Google Scholar] [CrossRef]


| Role in Wildfire Management | Description | Percent of Respondents |
|---|---|---|
| Aerial Operations | Roles range from Air Operations Branch Director, Air Attack Officers, and Aerial Detection Leaders. In some agencies, these staff coordinate high-level infrared services and other mapping/scanning roles. | 17% |
| Incident Commander (IC) Types 1 and 2 | The IC has overall authority and responsibility for conducting incident operations and is responsible for the management of all operations. Levels 1 and 2 are those that lead the most complex wildfire situations. | 22% |
| Incident Commander (IC) Types 3 to 5 | Same as above, however the wildfires are less complex. | 9% |
| Plans Section | Roles range from Planning Section Chiefs, Fire Behaviour Analysts, Situation Unit Leaders, GIS, prediction and forecasting services. In some agencies, these staff coordinate airborne infrared services and other mapping operations. | 13% |
| Group Responses | Consisting of agency-selected individuals including skills from roles above. | 39% |
| Intelligence Type | Product | Tactical Decision Making | Strategic Decision Making | ||||
|---|---|---|---|---|---|---|---|
| Likert Ranking | Ideal Time | Threshold Time | Likert Ranking | Ideal Time | Threshold Time | ||
| Active-Fire Observation | Wildfire detection and clustering | 5 | 1 | 120 | 5 | 15 | 1440 |
| Rate and direction of spread | 4 | 15 | 120 | 4 | 17.5 | 300 | |
| Fire intensity | 5 | 15 | 720 | 5 | 12.5 | 240 | |
| Active-Fire Modeling | Smoke mapping | 2 | 30 | 720 | 3 | 45 | 560 |
| Suppression effectiveness | 3 | 10 | 660 | 3 | 17.5 | 660 | |
| Proximity to interface zones | 5 | 5 | 120 | 5 | 15 | 240 | |
| Risk | 3 | 60 | 190 | 3 | 60 | 360 | |
| Assimilation into FGM | 5 | 5 | 720 | 5 | 5 | 720 | |
| FGM prediction | 3 | 20 | 720 | 3 | 17.5 | 720 | |
| Fuel type verification | 3 | 22.5 | 720 | 3 | 20 | 720 | |
| Pre/Post-Fire Observation | Burned area | 3 | 60 | 1440 | 5 | 60 | 1440 |
| Burn severity | 2 | 120 | 1440 | 3 | 90 | 1440 | |
| Arrival time | 4 | 60 | 840 | 3 | 60 | 1440 | |
| FMFs | URD Parent References | Rationale |
|---|---|---|
| Daily (or better) coverage of the Canadian landmass, with consistent timing and peak burn observation (FMF-1,2) | Temporal resolution (CWFM-URD-0020) | To ensure a minimum of daily coverage is provided |
| Peak burn observation (CWFM-URD-0030/40) | To ensure that the daytime overpass falls in the peak burn period | |
| Detection and mapping of wildfires and smoke plumes (FMF-3) | Spatial resolution (CWFM-URD-0080-90) | Constraints are applied to the spatial resolution to ensure adequate ability to resolve active-fire area and to detect change in its position |
| Swath (CWFM-URD-0110/120) | Minimum swath width to increase the probability of containing the full wildfire within a single observation | |
| Spectral bands, dynamic ranges, and sensitivities (CWFM-URD-0150-251) | Minimum spectral bands and performance requirements to conduct cloud masking, wildfire detection and characterization, and burned area mapping | |
| Band co-registration (CWFM-URD-0260-280) | Wildfire detection, characterization, and mapping requires multispectral measurements. Band co-registration requirements are defined to ensure cross-band analysis is possible across the swath | |
| Geo-coding (CWFM-URD-0300) | Geographical positioning requirements to enable change detection, comparison to landscape features, and response operations | |
| Measurement of wildfire behaviour (FMF-4) | Spatial resolution (CWFM-URD-0080-90) | Spatial resolution is constrained for optimal ROS measurement [70], and FRP accuracy [71] |
| Swath (CWFM-URD-0110/120) | Minimum swath width to increase the probability of containing the full wildfire within a single observation | |
| Spectral bands, dynamic ranges, and sensitivities (CWFM-URD-0150-251) | Minimum spectral bands and performance requirements to conduct wildfire detection, sub-pixel characterization, and collect FRP measurements | |
| Band co-registration (CWFM-URD-0260-280) | Sub-pixel wildfire characterization requires multispectral measurements. Band co-registration requirements are defined to ensure cross-band analysis is possible across the swath | |
| Compatibility with other EO systems (FMF-5) | Spatial resolution (CWFM-URD-0080-90) | The spatial resolution range required to meet FMF-3 and FMF-4 is broad, the specific requirements are chosen to closely match VIIRS I-Band spatial resolution |
| Peak burn observation (CWFM-URD-0030/40) | A peak burn overpass is required to ensure sufficient temporal offset from the VIIRS overpass time (~ 13:00 local) for optimal Rate of Spread measurement at the specified spatial resolution | |
| Near-real-time data (FMF-6) | Data latency (CWFM-URD-0050) | A data latency of no more than 30 min from overpass to end user delivery is required |
| Downlink priority (CWFM-URD-0070) | In the event that not all data can be delivered in near-real-time, priority is given to spectral bands required for active-fire detection and characterization |
| Type | URD Parent Reference | Requirement |
|---|---|---|
| Coverage & Temporal Resolution | CWFM-URD-0020 | The mission SHALL provide the capability to observe at minimum 97% of all points within the AoI at least once per any 48-h period, and all points within the AoI at least once per 72-h period |
| The mission SHALL provide the capability to observe on average 85% of all points within the AoI at least once per any 24-h period | ||
| As a goal, the mission SHOULD provide the capability to observe all points within the AoI at least once per any 24-h period | ||
| Peak Burn Observation | CWFM-URD-0030/40 | The design SHALL provide observation during each peak burning period |
| Data Latency | CWFM-URD-0050 | Time lag between data acquisition and delivery to user SHALL not exceed 30 min for the MWIR, LWIR, NIR, and VIS (red) for 90% of observations and 24 h for all data |
| Time lag between data acquisition and delivery to user SHOULD not exceed 30 min for all data | ||
| Downlink Priority | CWFM-URD-0070 | Priority downlink SHALL be given to MWIR, LWIR, NIR, and VIS (red) bands |
| Swath Width | CWFM-URD-0110/0120 | Swath width for all spectral bands SHALL be no less than 200 km |
| Type | URD Parent Reference | Requirement |
|---|---|---|
| Spatial Resolution | CWFM-URD-0080 | When the spacecraft is nadir-pointing, the design SHALL provide imagery with spatial resolution no larger than:
|
| CWFM-URD-0090 | When the spacecraft is nadir-pointing, the design SHOULD provide imagery with spatial resolution no larger than:
| |
| Spectral Bands | CWFM-URD-0150 | The payload SHALL provide at least one band in each of the following channels:
|
| CWFM-URD-0151 | The payload SHOULD provide at least one band in each of the following channels:
| |
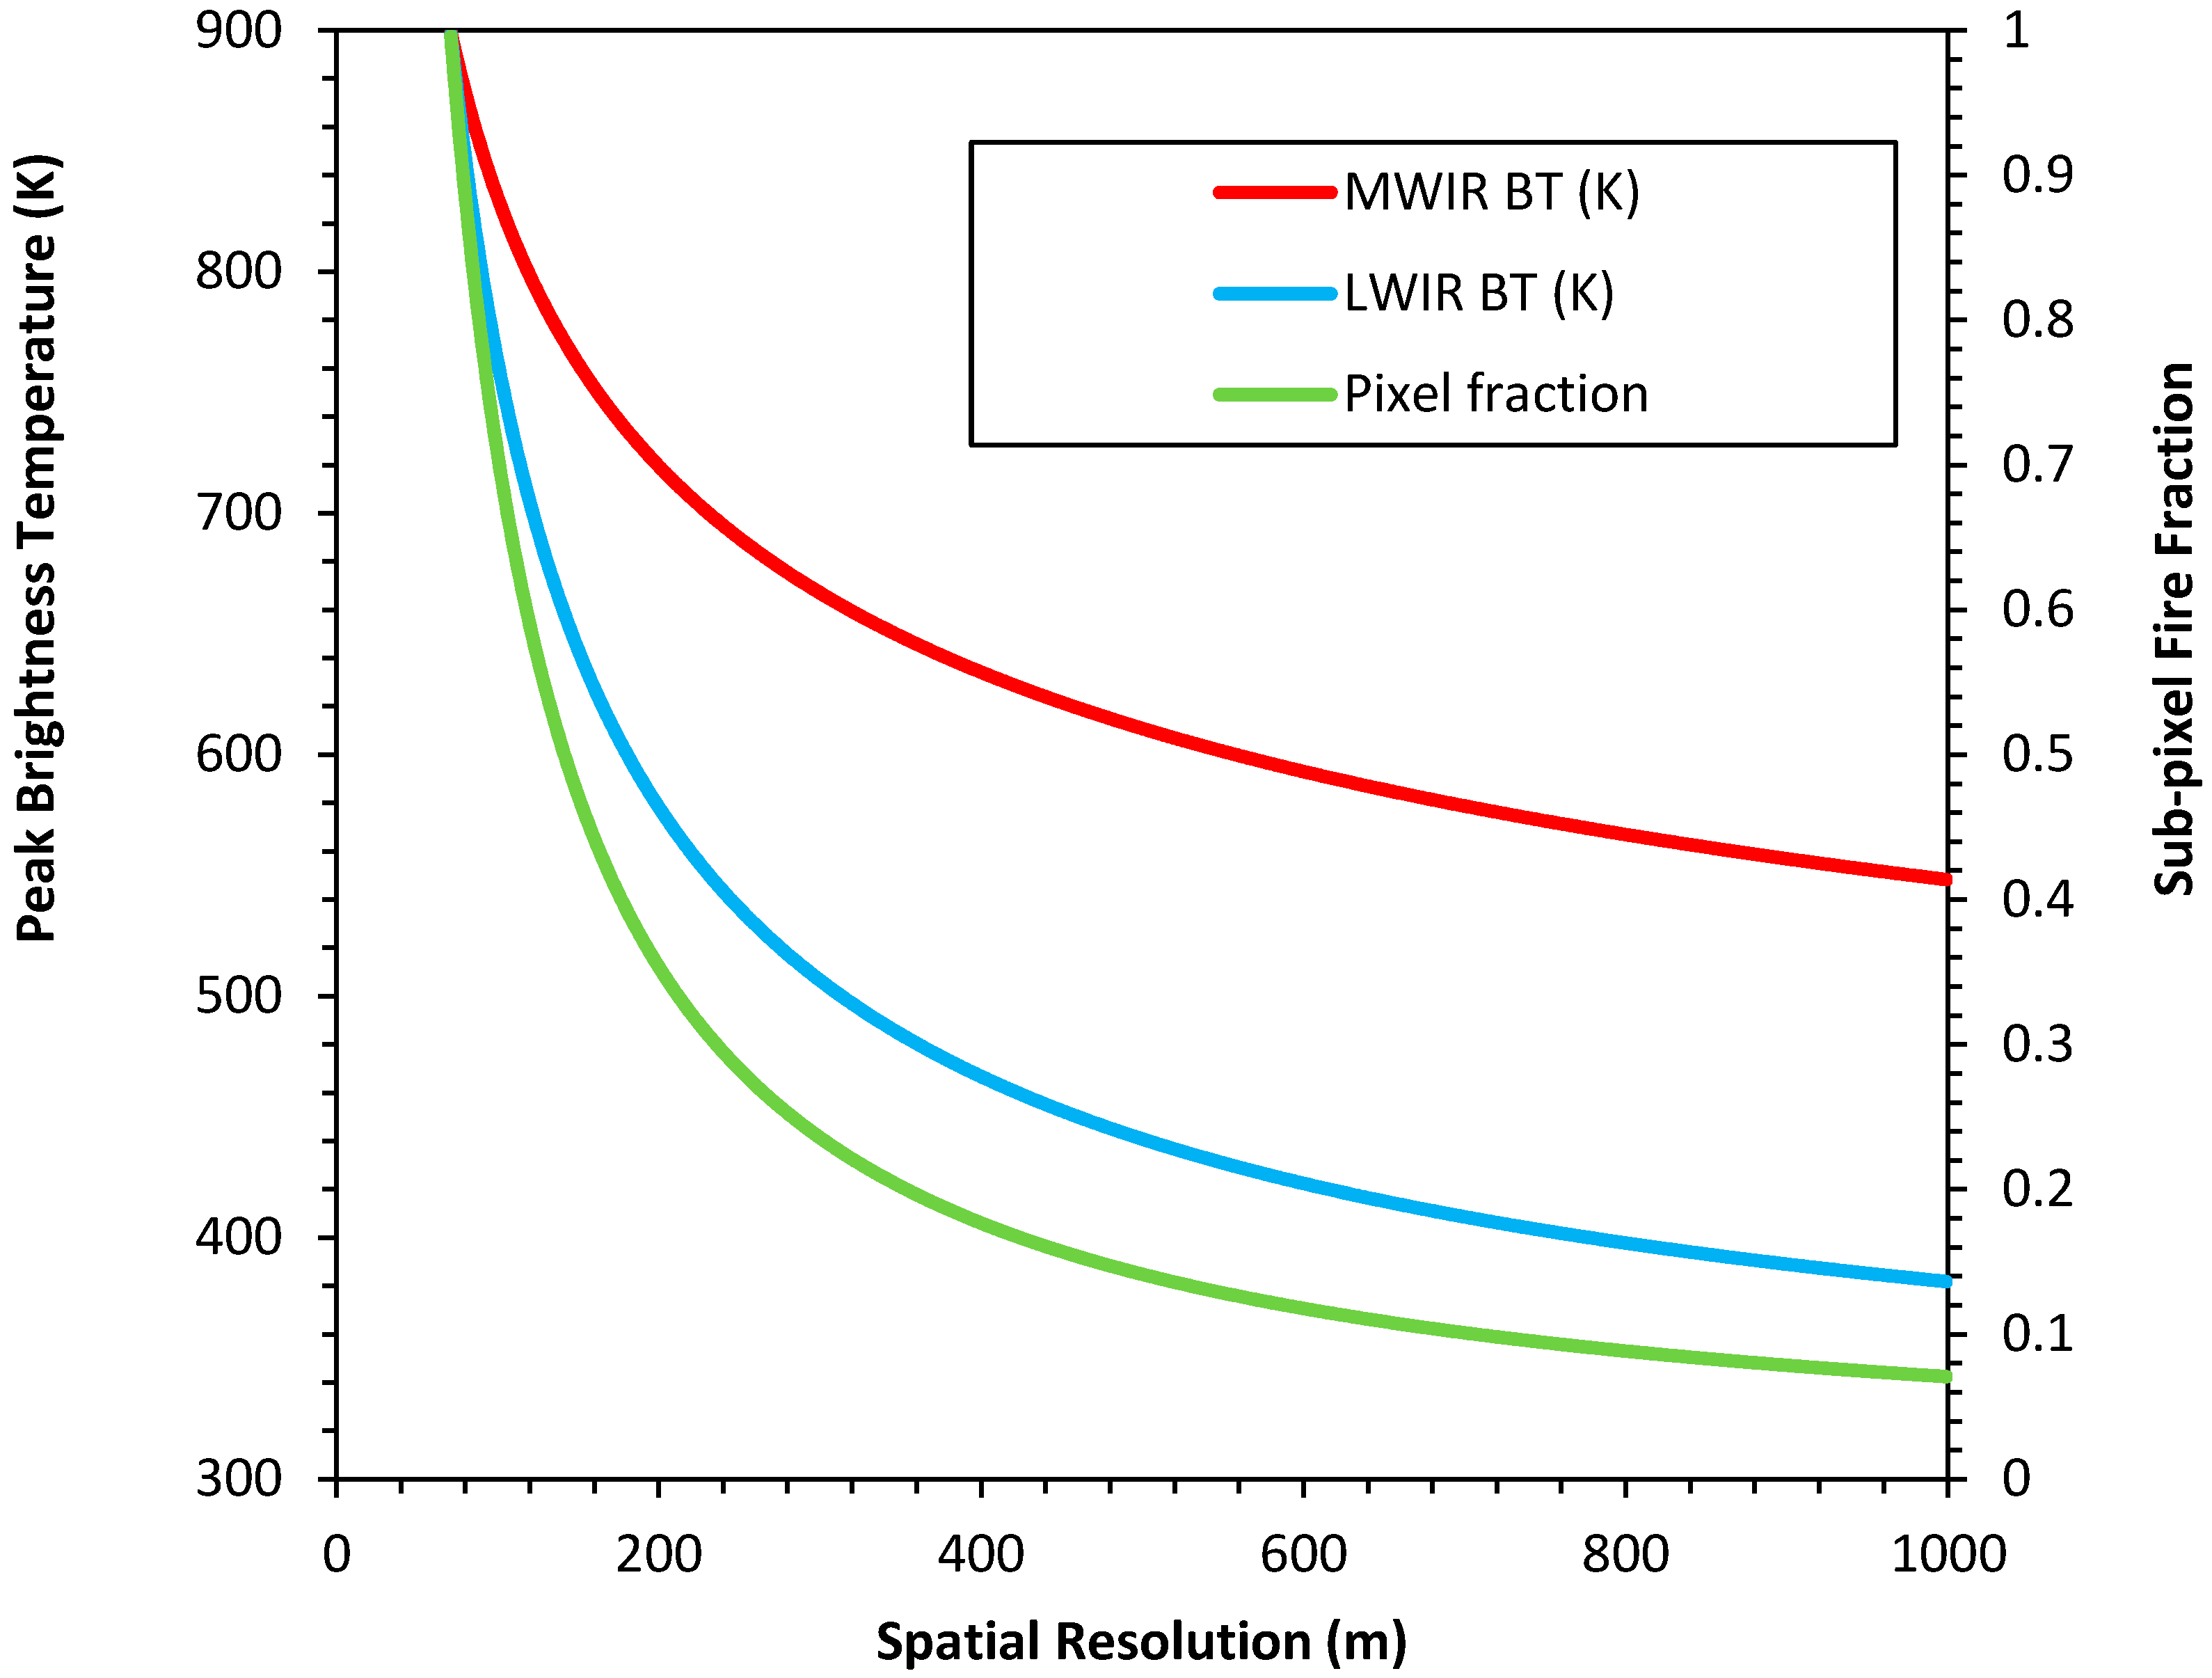
| IR Dynamic Ranges | CWFM-URD-0180 | Brightness temperatures retrieved in the MWIR band(s) SHALL be in the range of at least 300 to 720 K at 200 m spatial resolution, or 300 to 635 K at 400 m, at surface level |
| CWFM-URD-0190 | Brightness temperatures retrieved in the LWIR band(s) SHALL be in the range of at least 300 to 580 K at 200 m spatial resolution, or 300 to 470 K at 400 m, at surface level | |
| VIS-NIR Dynamic Ranges | CWFM-URD-0200 | The NIR and VIS TOA radiance range SHALL be a minimum of:
|
The NIR and VIS TOA radiance range SHALL be a minimum of:
|
| Type | URD Parent Reference | Requirement |
|---|---|---|
| Noise | CWFM-URD-0207 | The VIS/NIR noise SHALL be: |
| CWFM-URD-0208 | The LWIR band SHALL have NESR < 0.12 (W m−2 sr−1 μm−1) when computed for a TOA scene at 300 K | |
| CWFM-URD-0209 | The MWIR band SHALL have NESR < 0.22 (W m−2 sr−1 μm−1) when computed for a TOA scene at 300 K | |
| CWFM-URD-0210 | The band noise SHOULD be: | |
| Sensitivity | CWFM-URD-0220/30 | The design SHALL be capable of measuring the background temperature in the MWIR and LWIR channels with a 2σ uncertainty of no more than 5% at TOA for the sub-satellite pixel |
| The design SHOULD be capable of measuring the background temperature in the MWIR and LWIR channels with a 2σ uncertainty of no more than 3% at TOA for the sub-satellite pixel | ||
| CWFM-URD-0240 | Minimum FRP detectable SHOULD be 5 MW at nadir and 40 MW at edge of swath (up to 45 degree off-nadir) | |
| CWFM-URD-0250 | The uncertainty of the FRP of the center pixel when nadir-pointing SHALL be less than 15% of the FRP, or less than 5 MW (whichever value is larger). | |
| CWFM-URD-0251 | The uncertainty of the FRP of pixels at edge of swath (45 degree off-nadir) when nadir-pointing SHOULD be less than 15% of the FRP, or less than 5 MW (whichever value is larger). | |
| Co-registration | CWFM-URD-0260 | Co-registration between MWIR and LWIR bands SHALL be provided within 1/3 MWIR pixel accuracy for all pixels in each of the bands |
| CWFM-URD-0270/71 | Co-registration between LWIR band and VIS/NIR bands SHALL be provided within 1 LWIR pixel accuracy for all pixels in each of the bands, and SHOULD be within 0.5 LWIR pixel accuracy | |
| CWFM-URD-0272/73 | Co-registration between MWIR band and VIS/NIR bands SHALL be provided within 1 MWIR pixel accuracy for all pixels in each of the bands, and SHOULD be within 0.5 MWIR pixel accuracy | |
| CWFM-URD-0280 | Co-registration between NIR and VIS bands SHOULD be provided within 1-pixel accuracy of either the VIS or NIR band (whichever has the smallest spatial resolution at nadir), for all pixels in each of the bands | |
| Image quality | CWFM-URD-0290 | The Modulation Transfer Function for all bands SHOULD be >0.3 for all frequencies below the Nyquist frequency |
| Geo-location | CWFM-URD-300 | Data provided to the users SHALL be tagged with geo-referencing information accurate to within 0.5-pixel resolution |
© 2020 by the authors. Licensee MDPI, Basel, Switzerland. This article is an open access article distributed under the terms and conditions of the Creative Commons Attribution (CC BY) license (http://creativecommons.org/licenses/by/4.0/).
Share and Cite
Johnston, J.M.; Jackson, N.; McFayden, C.; Ngo Phong, L.; Lawrence, B.; Davignon, D.; Wooster, M.J.; van Mierlo, H.; Thompson, D.K.; Cantin, A.S.; et al. Development of the User Requirements for the Canadian WildFireSat Satellite Mission. Sensors 2020, 20, 5081. https://doi.org/10.3390/s20185081
Johnston JM, Jackson N, McFayden C, Ngo Phong L, Lawrence B, Davignon D, Wooster MJ, van Mierlo H, Thompson DK, Cantin AS, et al. Development of the User Requirements for the Canadian WildFireSat Satellite Mission. Sensors. 2020; 20(18):5081. https://doi.org/10.3390/s20185081
Chicago/Turabian StyleJohnston, Joshua M., Natasha Jackson, Colin McFayden, Linh Ngo Phong, Brian Lawrence, Didier Davignon, Martin J. Wooster, Helena van Mierlo, Dan K. Thompson, Alan S. Cantin, and et al. 2020. "Development of the User Requirements for the Canadian WildFireSat Satellite Mission" Sensors 20, no. 18: 5081. https://doi.org/10.3390/s20185081
APA StyleJohnston, J. M., Jackson, N., McFayden, C., Ngo Phong, L., Lawrence, B., Davignon, D., Wooster, M. J., van Mierlo, H., Thompson, D. K., Cantin, A. S., Johnston, D., Johnston, L. M., Sloane, M., Ramos, R., & Lynham, T. J. (2020). Development of the User Requirements for the Canadian WildFireSat Satellite Mission. Sensors, 20(18), 5081. https://doi.org/10.3390/s20185081