Detection of Focal and Non-Focal Electroencephalogram Signals Using Fast Walsh-Hadamard Transform and Artificial Neural Network


 , ,
, ,  ,
,
Abstract
1. Introduction
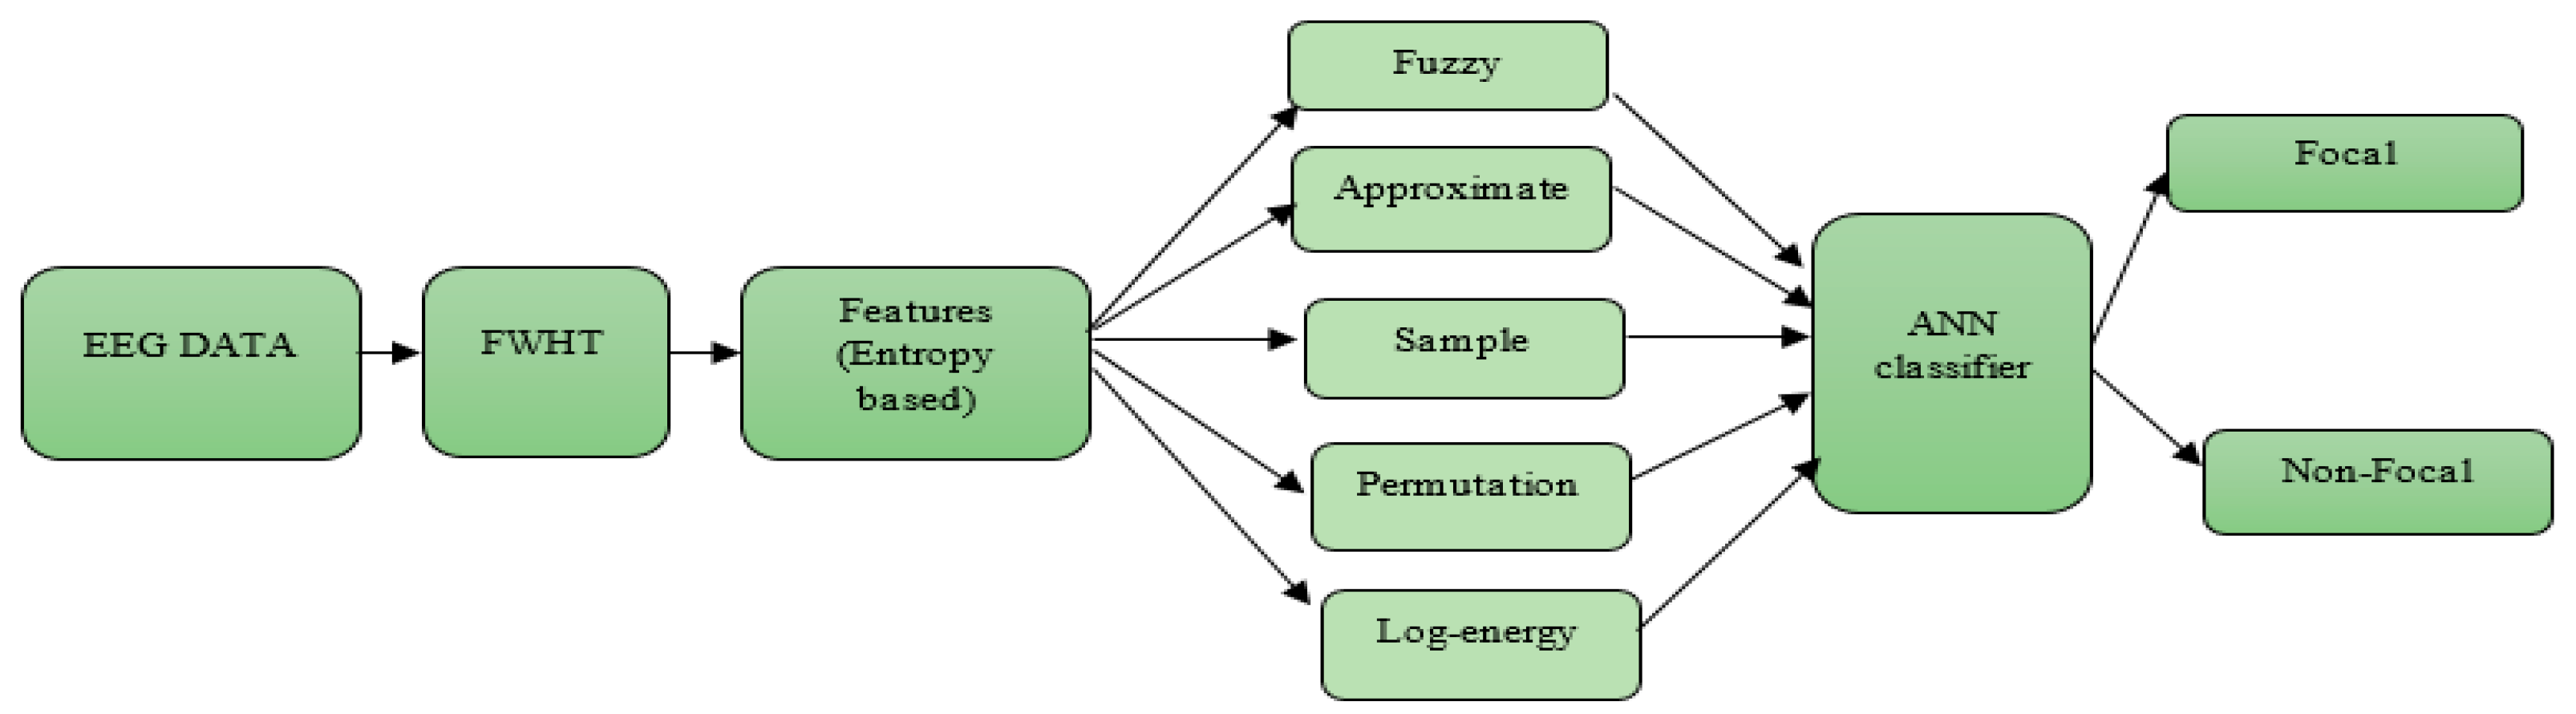
2. Materials and Methods
2.1. Dataset Used
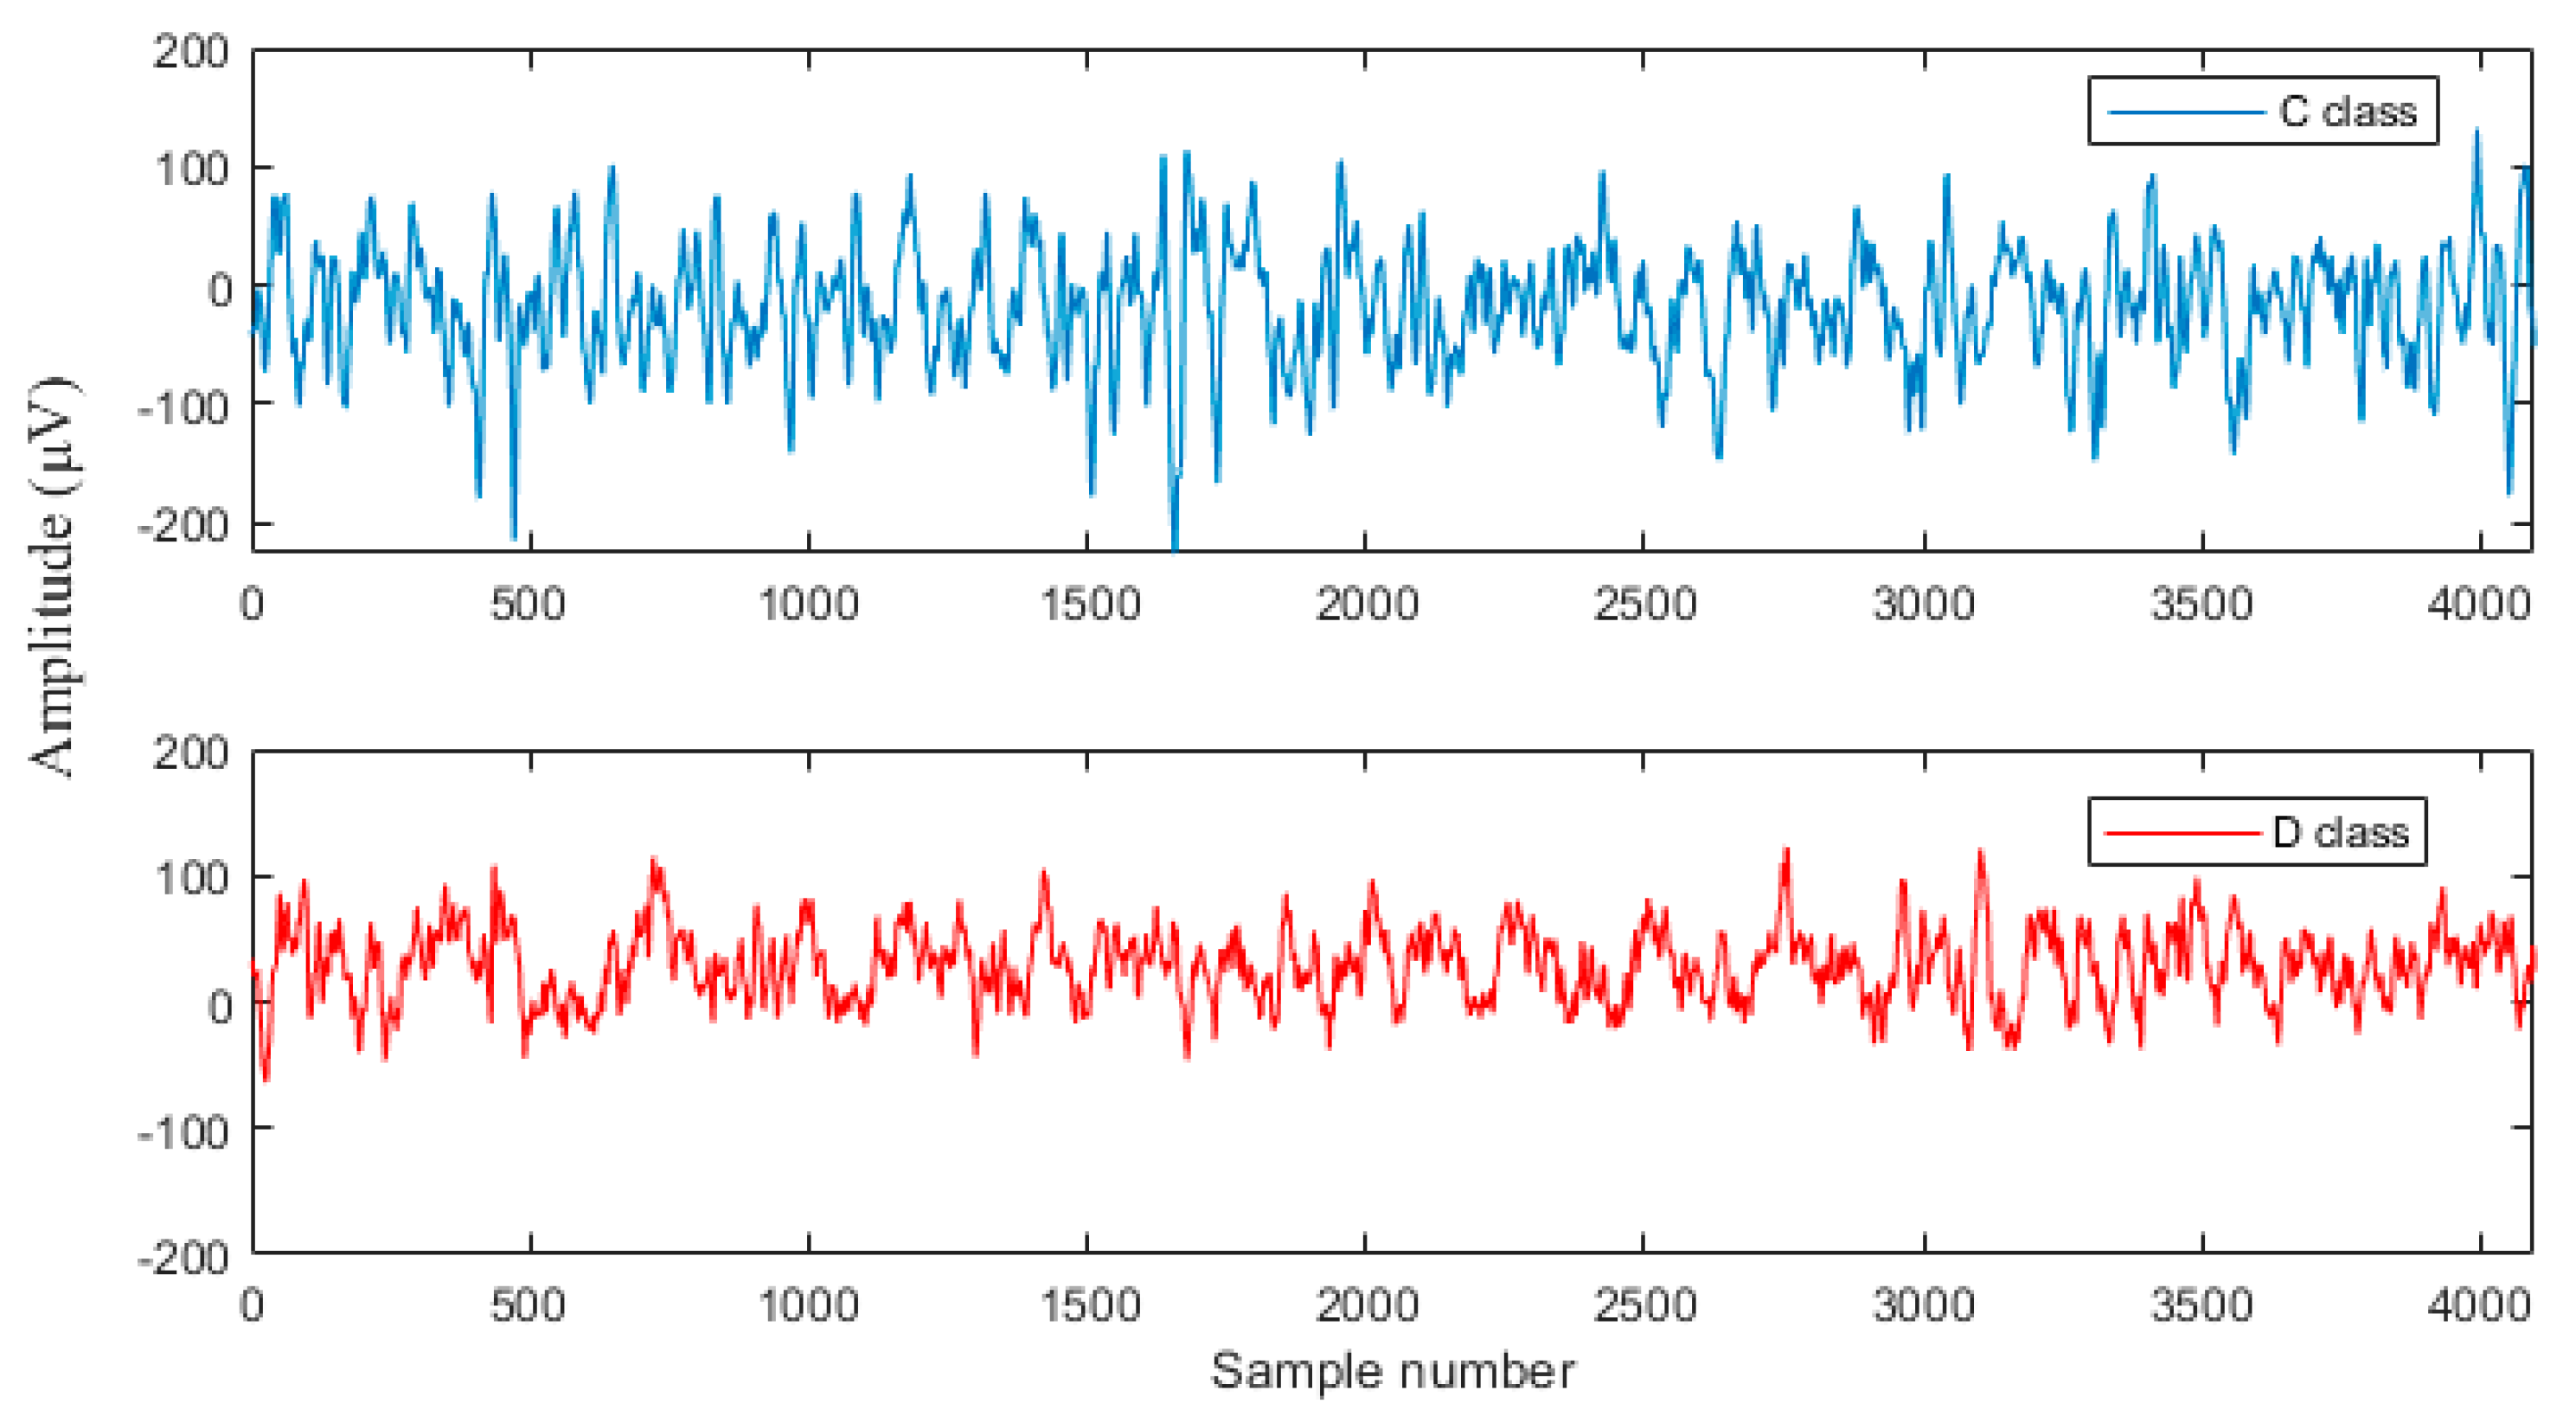
2.1.1. University of Bonn Dataset
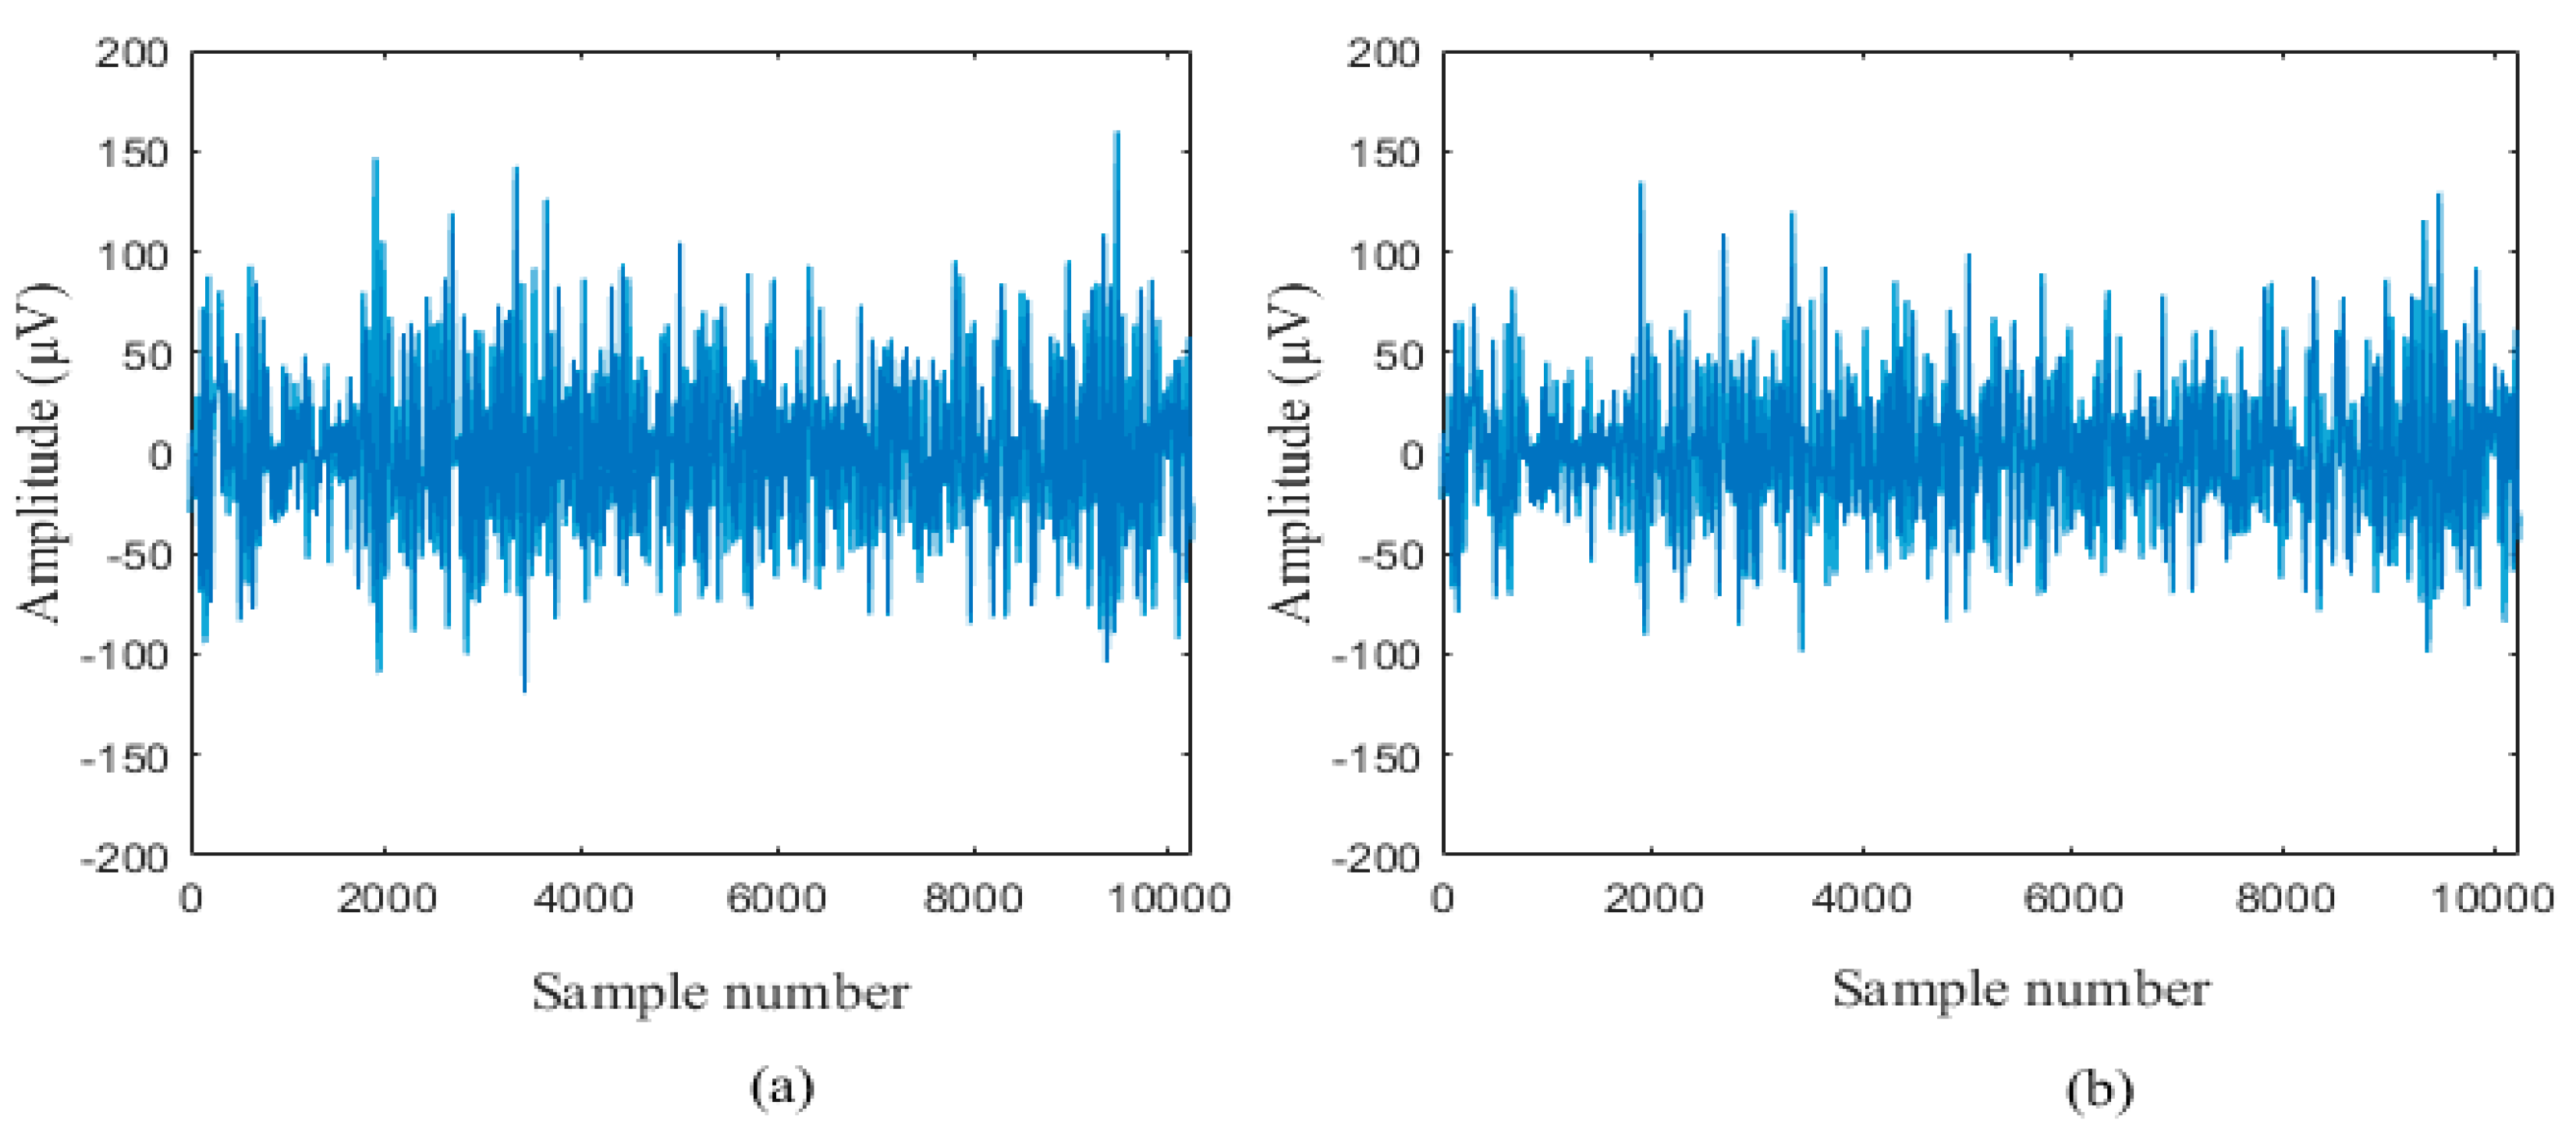
2.1.2. Bern-Barcelona Dataset
2.2. Fast Walsh Hadamard Transform
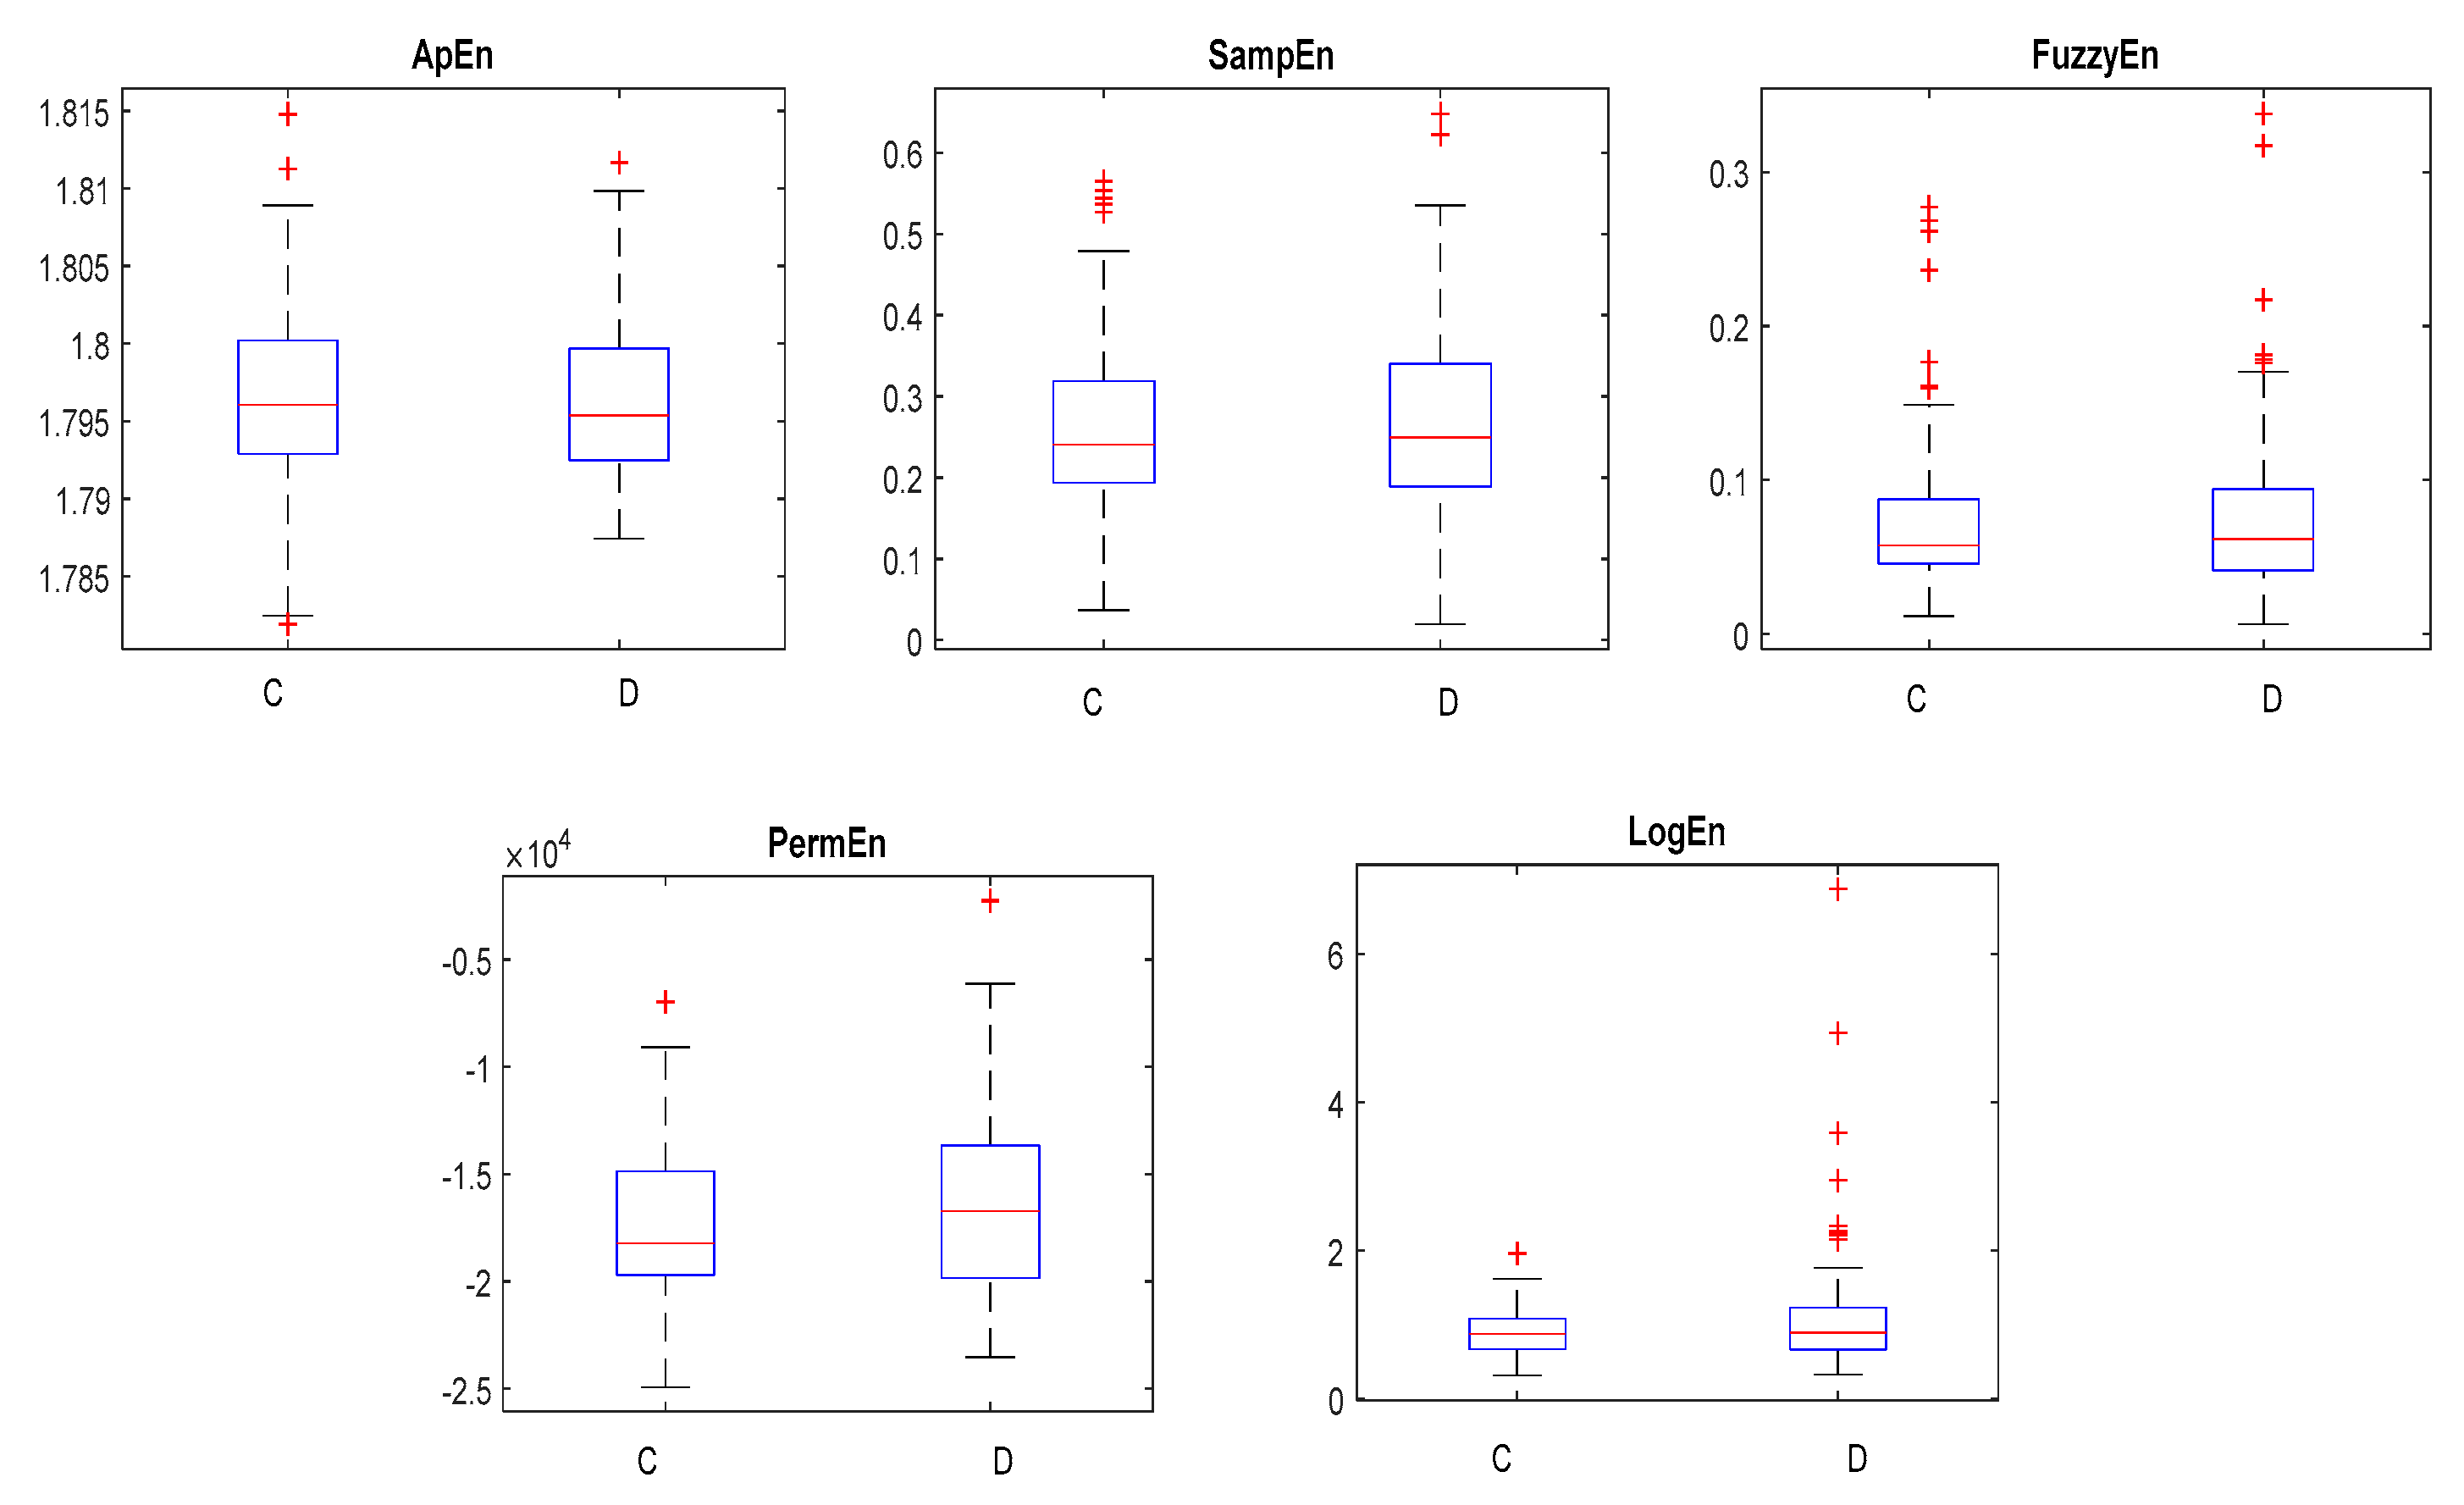
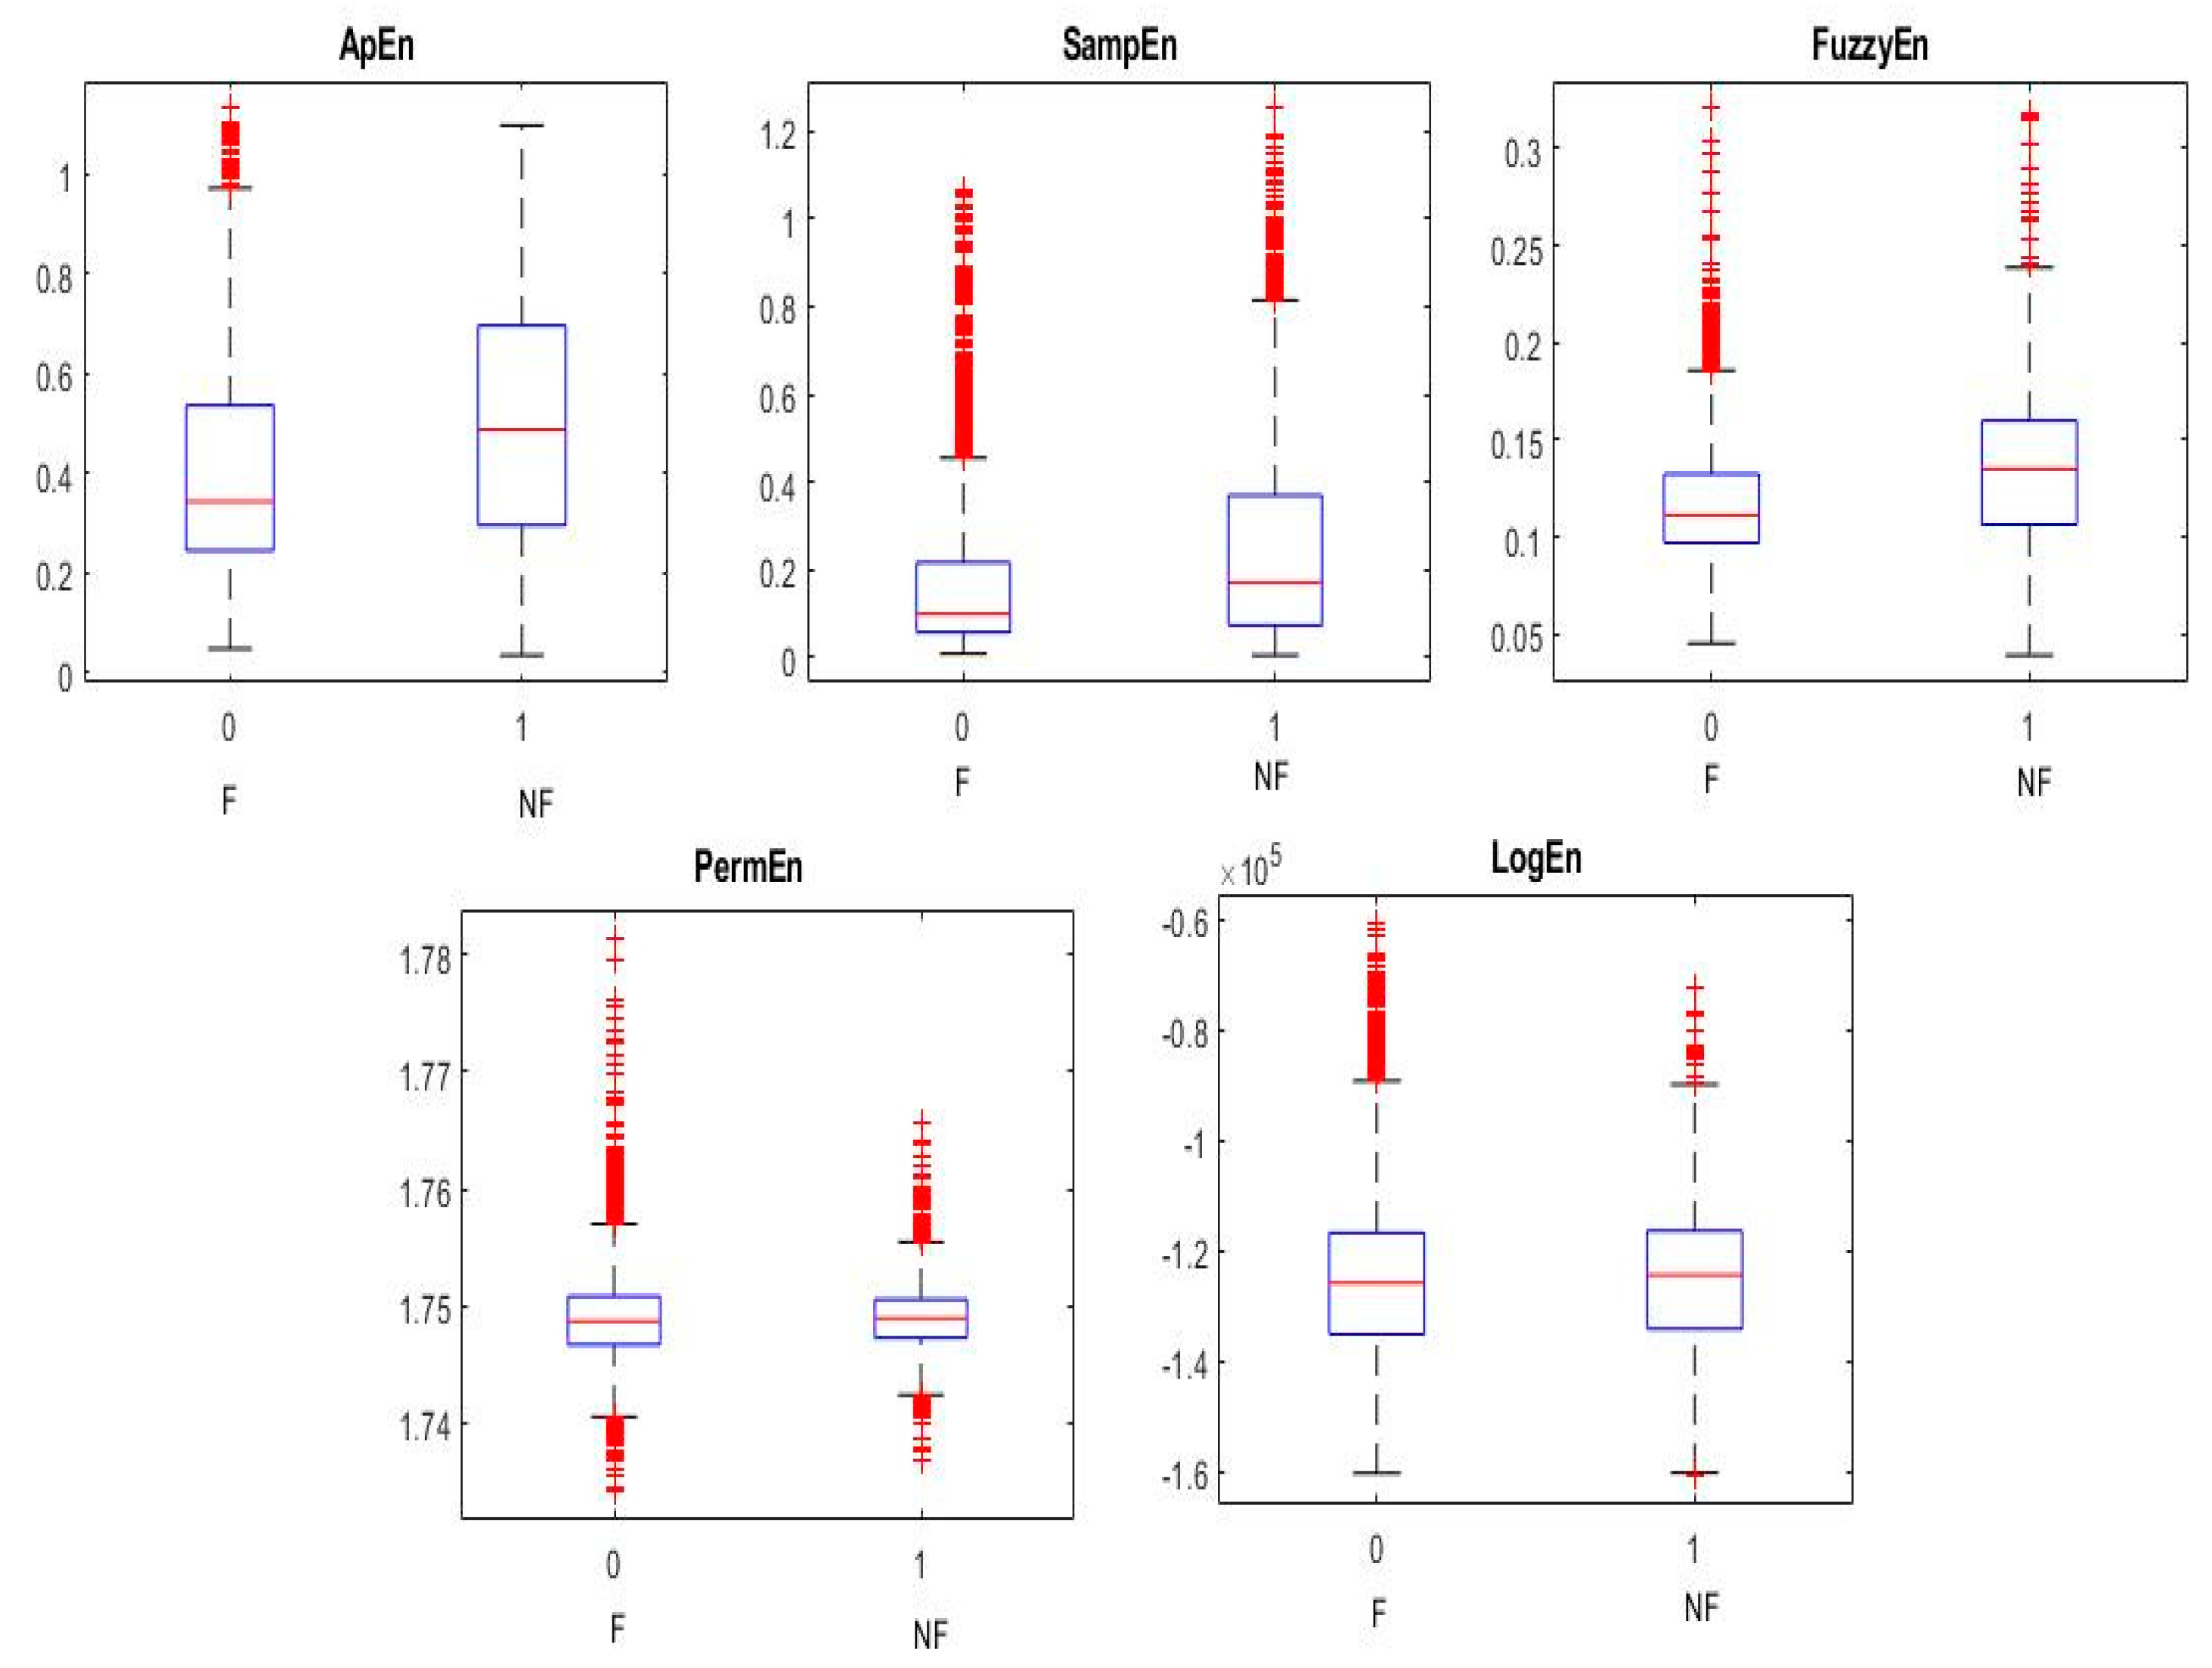
2.3. Feature Extraction
2.3.1. Approximate Entropy (ApEn)
2.3.2. Sample Entropy (SampEn)
2.3.3. Permutation Entropy (PermEn)
2.3.4. Fuzzy Entropy (FuzzyEn)
2.3.5. Log-Energy Entropy (LogEn)
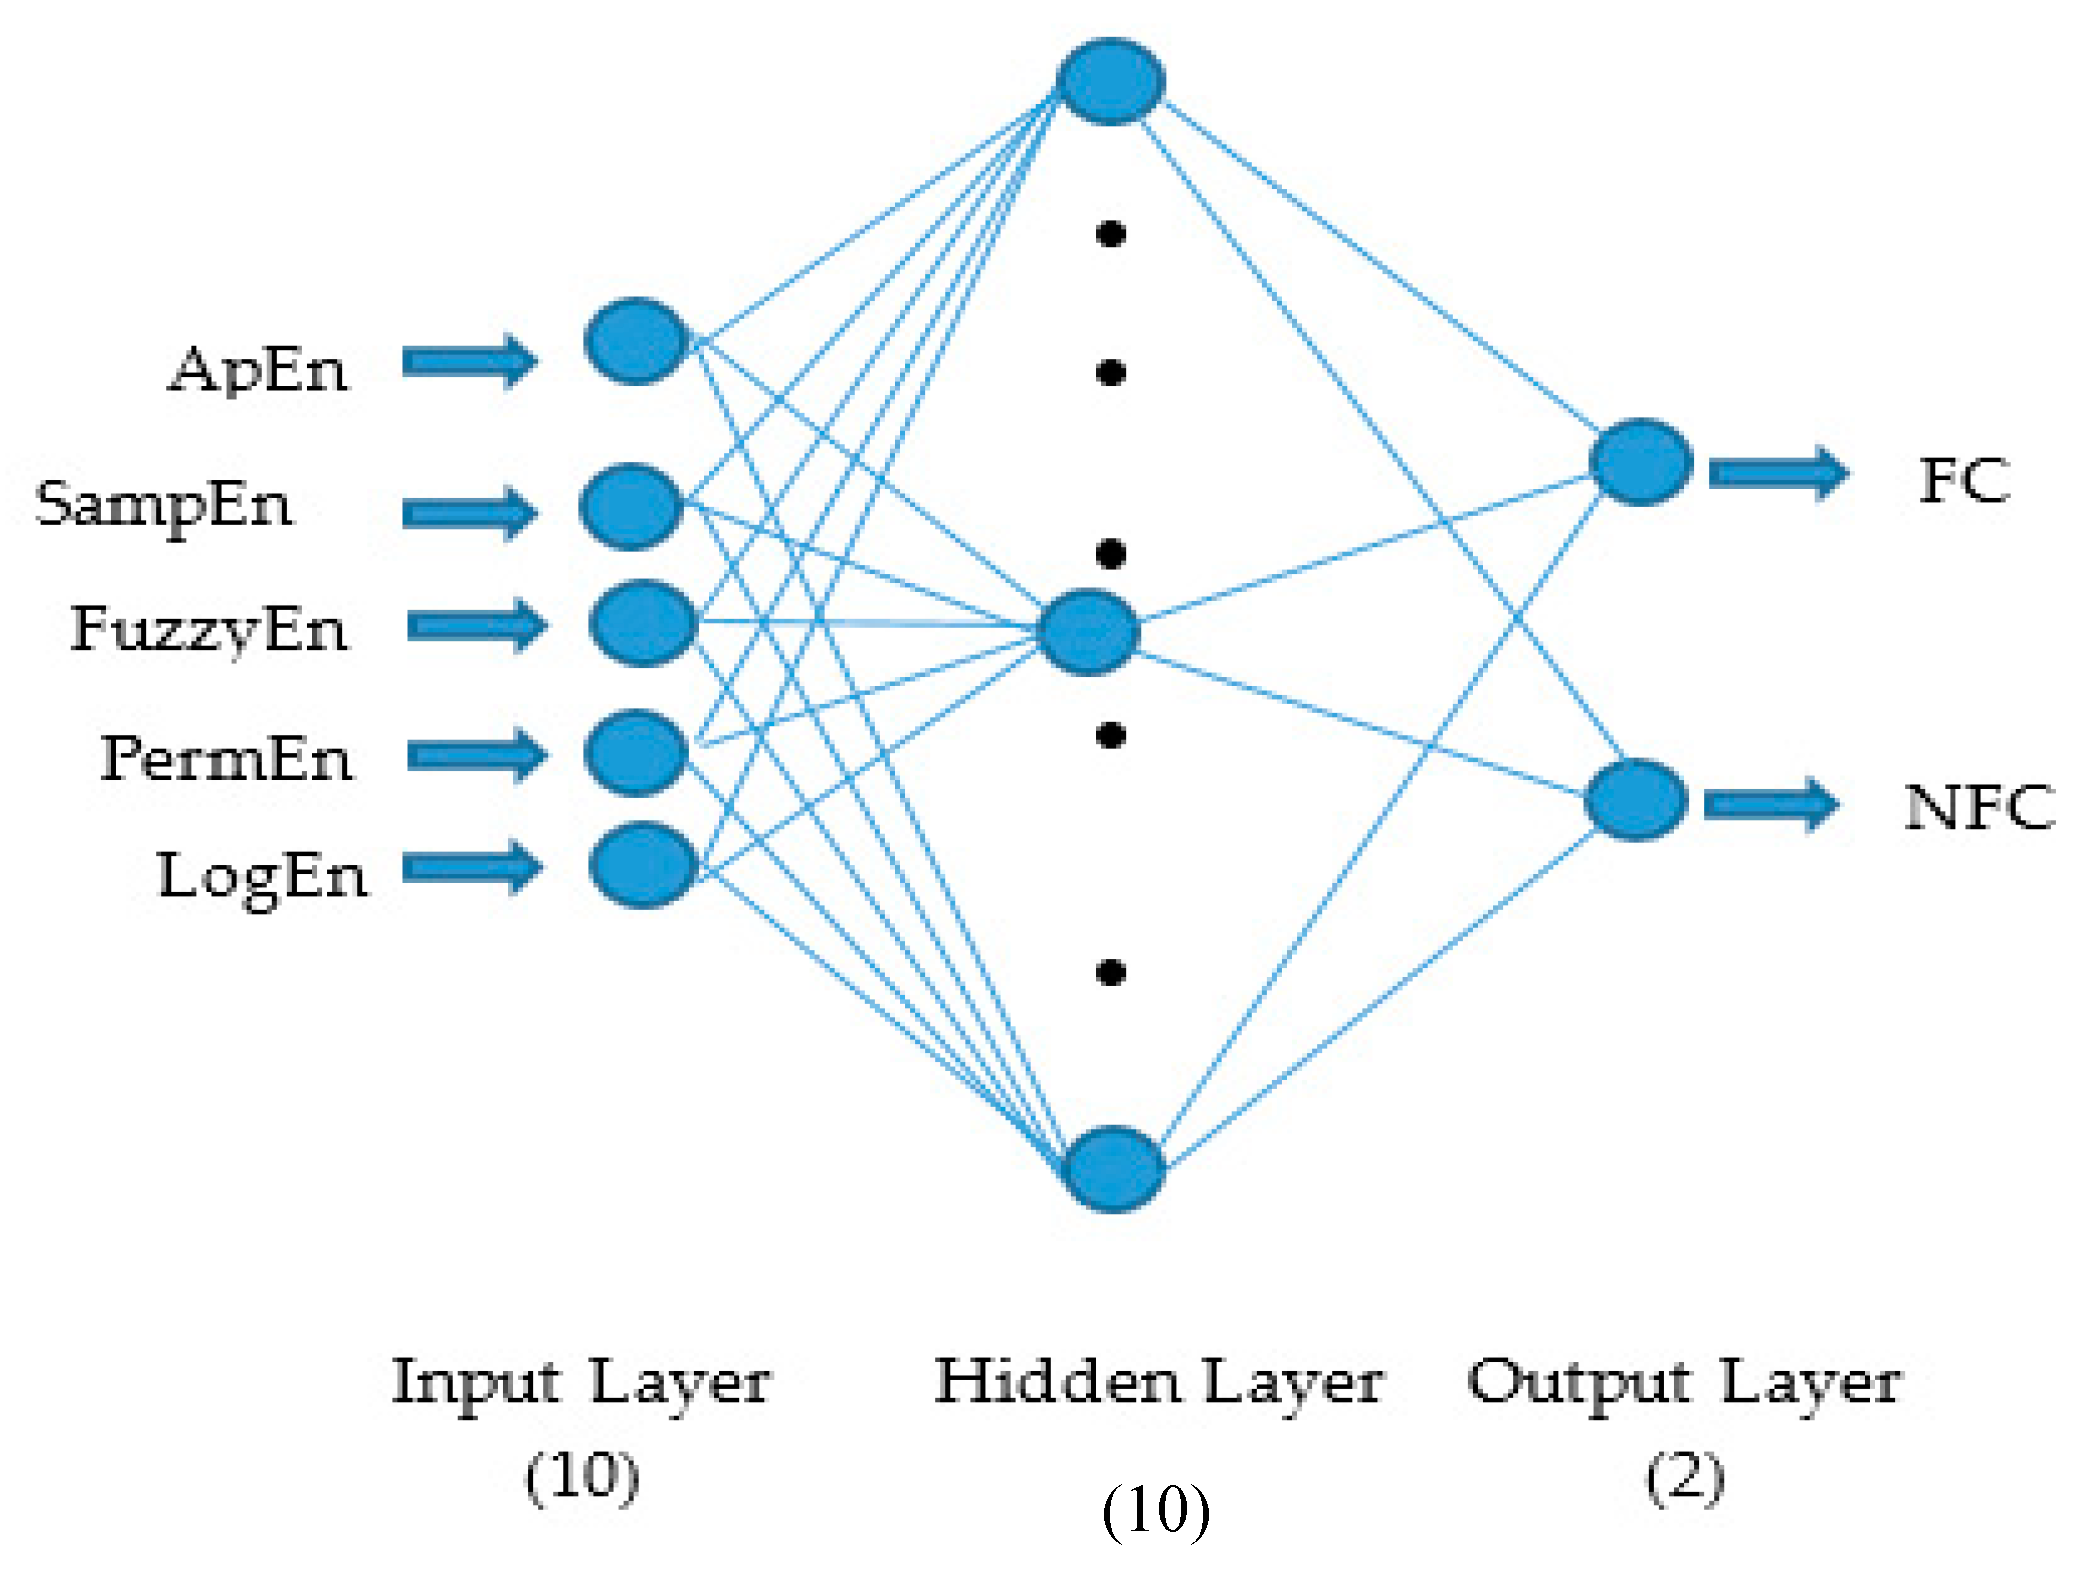
2.4. Artificial Neural Network (ANN) Classifier
3. Results and Discussion
4. Conclusions
Author Contributions
Funding
Acknowledgments
Conflicts of Interest
References
- Chiang, C.; Chang, N.; Chen, T.; Chen, H.; Chen, L. Seizure Prediction Based on Classiffication of EEG Synchronization Patterns with On-line Retraining and Post-Processing Scheme. In Proceedings of the 33rd Annual International Conference of the IEEE EMBS, Boston, MA, USA, 30 August–3 September 2011; pp. 7564–7569. [Google Scholar]
- Chu, H.; Chung, C.K.; Jeong, W.; Cho, K.H. Predicting epileptic seizures from scalp EEG based on attractor state analysis. Comput. Methods Programs Biomed. 2017, 143, 75–87. [Google Scholar] [CrossRef] [PubMed]
- Park, C.; Choi, G.; Kim, J.; Kim, S.; Kim, T.; Min, K.; Jung, K.; Chong, J. Epileptic Seizure Detection for Multi-channel EEG with Deep Convolutional Neural Network. In Proceedings of the 2018 International Conference on Electronics, Information, and Communication (ICEIC), Honolulu, HI, USA, 24–27 January 2018; pp. 1–5. [Google Scholar]
- Shahid, A.; Kamel, N.; Malik, A.S.; Jatoi, M.A. Epileptic seizure detection using the singular values of EEG signals. In Proceedings of the 2013 International Conference on Complex Medical Engineering (ICME), Beijing, China, 25–28 May 2013; pp. 652–655. [Google Scholar]
- Chen, L.L.; Zhang, J.; Zou, J.Z.; Zhao, C.J.; Wang, G.S. A framework on wavelet-based non-linear features and extreme learning machine for epileptic seizure detection. Biomed. Signal Process. Control 2014, 10, 1–10. [Google Scholar] [CrossRef]
- Abd Ghani, M.K.; Mohammed, M.A.; Arunkumar, N.; Mostafa, S.A.; Ibrahim, D.A.; Abdullah, M.K.; Jaber, M.M.; Abdulhay, E.; Ramirez-Gonzalez, G.; Burhanuddin, M.A. Decision-level fusion scheme for nasopharyngeal carcinoma identification using machine learning techniques. Neural Comput. Appl. 2020, 32, 625–638. [Google Scholar] [CrossRef]
- Obaid, O.I.; Mohammed, M.A.; Ghani, M.K.A.; Mostafa, A.; Taha, F. Evaluating the performance of machine learning techniques in the classification of Wisconsin Breast Cancer. Int. J. Eng. Technol. 2018, 7, 160–166. [Google Scholar]
- Mutlag, A.A.; Khanapi Abd Ghani, M.; Mohammed, M.A.; Maashi, M.S.; Mohd, O.; Mostafa, S.A.; Abdulkareem, K.H.; Marques, G.; de la Torre Díez, I. MAFC: Multi-Agent Fog Computing Model for Healthcare Critical Tasks Management. Sensors 2020, 20, 1853. [Google Scholar] [CrossRef]
- Mohammed, M.A.; Ghani, M.K.A.; Arunkumar, N.A.; Mostafa, S.A.; Abdullah, M.K.; Burhanuddin, M.A. Trainable model for segmenting and identifying Nasopharyngeal carcinoma. Comput. Electr. Eng. 2018, 71, 372–387. [Google Scholar] [CrossRef]
- Mohammed, M.A. Benchmarking Methodology for Selection of Optimal COVID-19 Diagnostic Model Based on Entropy and TOPSIS Methods. IEEE Access 2020, 8, 99115–99131. [Google Scholar] [CrossRef]
- Gupta, V.; Priya, T.; Kumar, A.; Bilas, R.; Rajendra, U. Automated detection of focal EEG signals using features extracted from flexible analytic wavelet transform. Pattern Recognit. Lett. 2017, 94, 180–188. [Google Scholar] [CrossRef]
- Arunkumar, N.; Ramkumar, K.; Venkatraman, V.; Abdulhay, E.; Lawrence, S.; Kadry, S.; Segal, S. Classification of focal and non focal EEG using entropies. Pattern Recognit. Lett. 2017, 94, 112–117. [Google Scholar]
- Sharma, M.; Dhere, A.; Bilas, R.; Acharya, U.R. Systems An automatic detection of focal EEG signals using new class of time-frequency localized orthogonal wavelet filter bank. Knowl. Based Syst. 2017, 118, 217–227. [Google Scholar] [CrossRef]
- Raghu, S.; Sriraam, N. Classification of focal and Non-focal EEG signals using neighborhood component analysis and machine learning algorithms. Expert Syst. Appl. 2018, 113, 18–32. [Google Scholar] [CrossRef]
- Das, A.B.; Imamul, M.; Bhuiyan, H. Discrimination and classification of NFC and FC EEG signals using entropy-based features in the EMD-DWT domain. Biomed. Signal Process. Control 2016, 29, 11–21. [Google Scholar] [CrossRef]
- Sharma, R.; Kumar, M.; Bilas, R.; Acharya, U.R. Decision support system for focal EEG signals using tunable-Q wavelet transform. J. Comput. Sci. 2017, 20, 52–60. [Google Scholar] [CrossRef]
- Kumar, M.R.; Rao, Y.S. Epileptic seizures classification in EEG signal based on semantic features and variational mode decomposition. Clust. Comput. 2019, 22, 13521–13531. [Google Scholar] [CrossRef]
- Sharma, R.; Pachori, R.B.; Acharya, U.R. An Integrated Index for the Identification of Focal Electroencephalogram Signals Using Discrete Wavelet Transform and Entropy Measures. Entropy 2015, 17, 5218–5240. [Google Scholar] [CrossRef]
- Bhattacharyya, A.; Pachori, R.B.; Acharya, U.R. Tunable-Q Wavelet Transform Based Multivariate Sub-Band Fuzzy Entropy with Application to Focal EEG Signal Analysis. Entropy 2017, 19, 99. [Google Scholar] [CrossRef]
- Arunkumar, N.; Kumar, K.R.; Venkataraman, V. Entropy features for focal EEG and non focal EEG. J. Comput. Sci. 2018, 27, 440–444. [Google Scholar] [CrossRef]
- Bhattacharyya, A.; Sharma, M.; Bilas, R. A novel approach for automated detection of focal EEG signals using empirical wavelet transform. Neural Comput. Appl. 2018, 29, 47–57. [Google Scholar] [CrossRef]
- Sharma, R.; Pachori, R.B.; Acharya, U.R. Application of Entropy Measures on Intrinsic Mode Functions for the Automated Identification of Focal Electroencephalogram Signals. Entropy 2015, 17, 669–691. [Google Scholar] [CrossRef]
- Chen, D.; Wan, S.; Bao, F.S. Epileptic Focus Localization Using Discrete Wavelet Transform Based on Interictal Intracranial EEG. Trans. Neural Syst. Rehabil. Eng. 2016, 25, 413–425. [Google Scholar] [CrossRef]
- Sriraam, N.; Raghu, S. Classification of Focal and Non Focal Epileptic Seizures Using Multi-Features and SVM Classifier. Image Signal Process. 2017, 41, 160. [Google Scholar] [CrossRef] [PubMed]
- Zhu, G.; Li, Y.; Paul, P.; Wang, S. Epileptogenic Focus Detection in Intracranial EEG based on Delay Permutation Entropy. Int. Symp. Comput. Models Life Sci. 2013, 1559, 31–36. [Google Scholar]
- Deivasigamani, S.; Senthilpari, C.; Yong, W.H. Classification of Focal and Nonfocal EEG Signals Using ANFIS Classifier for Epilepsy Detection. Int. J. Imaging Syst. Technol. 2016, 26, 277–283. [Google Scholar] [CrossRef]
- Singh, P.; Pachori, R.B. Classification of focal and non-focal EEG signals using features derived from fourier based rhythms. J. Mech. Med. Biol. 2017, 17, 1740002. [Google Scholar] [CrossRef]
- Abhinaya, B.; Charanya, D.; Thanaraj, K.P. Feature Extraction and Selection of a Combination of Entropy Features for Real-time Epilepsy Detection. Int. J. Eng. Comput. Sci. 2016, 5, 16073–16078. [Google Scholar] [CrossRef]
- Dalal, M.; Tanveer, M.; Pachori, R.B. Automated Identification system for Focal EEG Signals Using Fractal Dimension of FAWT-Based Sub-bands Signals. In Machine Intelligence and Signal Analysis; Springer: Singapore, 2019; Volume 748, pp. 583–596. [Google Scholar]
- Deivasigamani, S.; Senthilpari, C.; Wong, H.Y. Computer Aided Automatic Detection and Classification of EEG Signals for Screening Epilepsy Disorder. J. Inf. Sci. Eng. 2018, 34, 687–700. [Google Scholar]
- Sathish, E.; Sivakumaran, N.; Simon, S.P.; Raghavan, S. Genetic Algorithm based Feature Selection for Classification of NFC and FC Intracranial Electroencephalographic Signals. J. Sci. Ind. Res. 2017, 76, 614–619. [Google Scholar]
- Gao, Z.; Lu, G.; Yan, P.; Lyu, C.; Li, X.; Shang, W. Automatic Change Detection for Real-Time Monitoring of EEG Signals. Front. Physiol. 2018, 9, 325. [Google Scholar] [CrossRef]
- Fasil, O.K.; Rajesh, R.; Thasleema, T.M. Influence of differential features in non-focal and focal EEG signal classification. In Proceedings of the 2017 IEEE Region 10 Humanitarian Technology Conference (R10-HTC), Dhaka, Bangladesh, 21–23 December 2017; pp. 646–649. [Google Scholar]
- Itakura, T.; Tanaka, T. Epileptic Focus Localization Based on Bivariate Empirical Mode Decomposition and Entropy. In Proceedings of the 2017 Asia-Pacific Signal and Information Processing Association Annual Summit and Conference (APSIPA ASC), Kuala Lumpur, Malaysia, 12–15 December 2017; pp. 1426–1429. [Google Scholar]
- Bashar, M.K.; Reza, F.; Idris, Z.; Yoshida, H. Epileptic seizure classification from intracranical EEG signals: A comparative study EEG-based seizure classification. In Proceedings of the 2016 IEEE EMBS Conference on Biomedical Engineering and Sciences (IECBES), Kuala Lumpur, Malaysia, 4–8 December 2016; pp. 96–101. [Google Scholar]
- Fraiwan, L.; Alkhodari, M. Classification of non-focal and focal Epileptic patients using single channel EEG and Long short-term memory learning system. IEEE Access 2020, 8, 77255–77262. [Google Scholar] [CrossRef]
- Srirangan, M.; Tripathy, R.K.; Pachori, R.B. Time-frequency domain deep convolutional neural network and non-focal EEG signals. IEEE Sensors 2020, 20, 3078–3086. [Google Scholar]
- Poomipat, B.; Apiwat, L.; Jitkomut, S. Automatic epileptic seizure onset-offset detection based on CNN in scalp EEG. In Proceedings of the 2020 IEEE International Conference on Acoustics, Speech and Signal Processing (ICASSP), Barcelona, Spain, 4–8 May 2020; pp. 1225–1229. [Google Scholar]
- Raheel, A.; Sajid, S.; Syed, A.H.; Soltan, A.; Awais, M.K. Epileptic seizure detection with a reduced montage: A way forward for Ambulatory EEG devices. IEEE Access 2020, 8, 65880–65890. [Google Scholar]
- Jose, A.; Mario, R.A.; Alejandro, Z.; Tripathy, R.K.; Pachori, R.B. EEG-Rhythm specific Taylor-Fourier bank implemented with O-splines for the detection of epilepsy using EEG signals. IEEE Sensors 2020, 20, 6542–6551. [Google Scholar]
- Yang, Y.; Wanzhong, C.; Mingyang, L.; Tao, J.; Yun, J.; Xiao, Z. Automatic focal and non-focal EEG detection using entropy based features from flexible analytic wavelet transform. Biomed. Signal Process. Control 2020, 57, 101761. [Google Scholar]
- Md Mosheyur, R.; Mohammed, I.H.B.; Anindya, B.D. Classification of focal and non-focal EEG signals in VMD-DWT domain using ensemble stacking. Biomed. Signal Process. Control 2019, 50, 72–82. [Google Scholar]
- Wei, Z.; Mengqing, L.; Chenzhi, Y.; Qinghui, W.; Fenglin, L.; Ying, W. Classification of focal and non-focal EEG signals using empirical mode decomposition (EMD), phase space reconstruction and neural networks. Artif. Intell. Rev. 2019, 52, 625–647. [Google Scholar]
- Raghu, S.; Pradip, S.; Pachori, R.B. Automated focal EEG signal detection based on third order cumulant function. Biomed. Signal Process. Control 2020, 58, 101856. [Google Scholar]
- Andrzejak, R.G.; Schindler, K.; Rummel, C. Nonrandomness, nonlinear dependence, and nonstationarity of electroencephalographic recordings from epilepsy patients. Phys. Rev. E 2012, 86. [Google Scholar] [CrossRef]
- Andrzejak, R.G.; Lehnertz, K.; Mormann, F.; Rieke, C.; David, P.; Elger, C.E. Indications of nonlinear deterministic and finite-dimensional structures in time series of brain electrical activity: Dependence on recording region and brain state. Phys. Rev. E 2001, 64. [Google Scholar] [CrossRef]
- Saka, K.; Aydemir, Ö.; Öztürk, M. Classification of EEG Signals Recorded During Right/Left Hand Movement Imagery Using Fast Walsh Hadamard Transform Based Features. In Proceedings of the 2016 39th International Conference on Telecommunications and Signal Processing (TSP), Vienna, Austria, 27–29 June 2016; pp. 413–416. [Google Scholar]
- Sareen, S.; Sood, S.K.; Kumar, S. An Automatic Prediction of Epileptic Seizures Using Cloud Computing and Wireless Sensor Networks. J. Med. Syst. 2016, 40, 226. [Google Scholar] [CrossRef]
- Sareen, S.; Sood, S.K.; Kumar, S. A Cloud-Based Seizure Alert System for Epileptic Patients That Uses Higher-Order Statistics. Cloud Comput. 2016, 18, 56–67. [Google Scholar] [CrossRef]
- Camara, C.; Peris-lopez, P.; Tapiador, J.E. Human Identification Using Compressed ECG Signals. J. Med. Syst. 2015, 39, 148. [Google Scholar] [CrossRef] [PubMed]
- Amira, A.; Bouridance, A.; Milligan, P.; Roula, M. Novel FPGA implementations of Walsh-Hadamard transforms for signal processing. IEEE Proc. Image Signal Process. 2001, 148, 377–383. [Google Scholar] [CrossRef]
- Deveci, T.C.; Cakir, S.; Cetin, A.E. Energy Efficient Hadamard Neural Networks. arXiv 2018, arXiv:1805.05421, 1–15. [Google Scholar]
- Jothiraj, S.N.; Selvaraj, T.G.; Ramasamy, B.; Deivendran, N.P.; Subathra, M.S.P. Classification of EEG signals for detection of epileptic seizure activities based on feature extraction from brain maps using image processing algorithms. IET Image Process. 2018, 12, 2153–2162. [Google Scholar] [CrossRef]
- Acharya, U.R.; Fujita, H.; Sudarshan, V.K.; Bhat, S.; Koh, J.E.W. Application of entropies for automated diagnosis of epilepsy using EEG signals: A review. Knowl. Based Syst. 2015, 88, 85–96. [Google Scholar] [CrossRef]
- Jord, J.; Oltra, S. Noisy EEG signals classification based on entropy metrics. Performance assessment using first and second generation statistics. Comput. Biol. Med. 2017, 87, 141–151. [Google Scholar]
- Cao, Y.; Tung, W.; Gao, J.B.; Protopopescu, V.A.; Hively, L.M.; Way, R.; Jose, S. Detecting dynamical changes in time series using the permutation entropy. Phys. Rev. E 2004, 70, 046217. [Google Scholar] [CrossRef]
- Nicolaou, N.; Georgiou, J. Detection of epileptic electroencephalogram based on Permutation Entropy and Support Vector Machines. Expert Syst. Appl. 2012, 39, 202–209. [Google Scholar] [CrossRef]
- Chen, W.; Wang, Z.; Xie, H.; Yu, W. Characterization of Surface EMG Signal Based on Fuzzy Entropy. IEEE Trans. Neural Syst. Rehabil. Eng. 2007, 15, 266–272. [Google Scholar] [CrossRef]
- Xie, H.; Chen, W.; Liu, H. Complexity analysis of the biomedical signal using fuzzy entropy measurement. Appl. Soft Comput. 2011, 11, 2871–2879. [Google Scholar] [CrossRef]
- Xiang, J.; Li, C.; Li, H.; Cao, R.; Wang, B.; Han, X.; Chen, J. The detection of epileptic seizure signals based on fuzzy entropy. J. Neurosci. Methods 2015, 243, 18–25. [Google Scholar] [CrossRef] [PubMed]
- Serap, A.; Hamdi, M.S.; Sadik, K. Log Energy Entropy-Based EEG Classification with Multilayer Neural Networks in Seizure. Ann. Biomed. Eng. 2009, 37, 2626–2630. [Google Scholar]
- Bala, R.; Kumar, D. Classification Using ANN: A Review. Int. J. Comput. Intell. Res. 2017, 13, 1811–1820. [Google Scholar]
- Subasi, A.; Kiymk, M.K.; Alkan, A.; Koklukaya, E. Neural network classification of EEG signals by using AR with MLE processing for epleptic seizure detection. Math. Comput. Appl. 2005, 10, 57–70. [Google Scholar]
- Kumar, N.; Malik, H. Automatic Classification for Neural Signals in Epilepsy Using Artificial Neural Network. EasyChair Prepr. 2018. [Google Scholar] [CrossRef][Green Version]
- Sharma, B.; Venugopalan, P.K. Comparison of Neural Network Training Functions for Hematoma Classification in Brain CT Images. IOSR J. Comput. Eng. 2014, 16, 31–35. [Google Scholar] [CrossRef]
- Lima, C.A.; Coelho, A.L.; Chagas, S. Automatic EEG signal classification for epilepsy diagnosis with Relevance Vector Machines. Expert Syst. Appl. 2009, 36, 10054–10059. [Google Scholar] [CrossRef]
- Acharya, U.R.; Sree, S.V.; Alvin, A.P.C.; Suri, J.S. Use of principal component analysis for automatic classification of epileptic EEG activities in wavelet framework. Expert Syst. Appl. 2012, 39, 9072–9078. [Google Scholar] [CrossRef]
- Übeyli, E.D. Combined neural network model employing wavelet coefficients for EEG signals classification. Digit. Signal Process. 2009, 19, 297–308. [Google Scholar] [CrossRef]
- Chatterjee, S. Detection of focal electroencephalogram signals using higher-order moments in EMD-TKEO domain. Healthc. Technol. Lett. 2019, 6, 64–69. [Google Scholar] [CrossRef]
- Fasil, O.K.; Rajesh, R. Time-domain exponential energy for epileptic EEG signal classification. Neurosci. Lett. 2019, 694, 1–8. [Google Scholar]
- Chen, Z.; Lu, G.; Xie, Z.; Shang, W. A Unified Framework and Method for EEG-Based Early Epileptic Seizure Detection and Epilepsy Diagnosis. IEEE Access 2020, 8, 20080–20092. [Google Scholar] [CrossRef]
- Gupta, V.; Pachori, R.B. Classification of focal EEG signals using FBSE based flexible time-frequency coverage wavelet transform. Biomed. Signal Process. Control 2020, in press. [Google Scholar] [CrossRef]


| Feature | Accuracy (%) | Sensitivity (%) | Specificity (%) |
|---|---|---|---|
| Single feature | |||
| ApEn | 62.89 | 67.22 | 58.56 |
| SampEn | 96.84 | 100 | 93.69 |
| PermEn | 57.05 | 40.90 | 73.20 |
| FuzzyEn | 67.82 | 73.03 | 62.62 |
| LogEn | 59.89 | 61.80 | 57.98 |
| Two features | |||
| SampEn, ApEn | 97.41 | 99.14 | 95.68 |
| SampEn, LogEn | 98.80 | 97.98 | 99.74 |
| SampEn, PermEn | 96.75 | 99.98 | 93.53 |
| SampEn, FuzzyEn | 96.53 | 94.33 | 99 |
| ApEn, LogEn | 66.89 | 68.01 | 65.77 |
| ApEn, PermEn | 63.79 | 63.57 | 64 |
| ApEn, FuzzyEn | 70.89 | 74.27 | 67.46 |
| LogEn, PermEn | 61.21 | 58.82 | 63.60 |
| LogEn, FuzzyEn | 70.83 | 74.05 | 67.61 |
| PermEn, FuzzyEn | 69.44 | 75.00 | 63.88 |
| Three features | |||
| SampEn, ApEn, LogEn | 98.78 | 99.29 | 98.17 |
| SampEn, ApEn, PermEn | 98.30 | 99.47 | 97.13 |
| SampEn, ApEn, FuzzyEn | 98.47 | 99.15 | 97.80 |
| SampEn, PermEn, LogEn | 98.28 | 99.86 | 96.69 |
| SampEn, LogEn, FuzzyEn | 98.89 | 99.76 | 98.02 |
| SampEn, FuzzyEn, PermEn | 98.98 | 99.78 | 98.17 |
| ApEn, LogEn, PermEn | 67.47 | 67.34 | 67.59 |
| ApEn, LogEn, FuzzyEn | 74.25 | 78.10 | 70.41 |
| LogEn, PermEn, FuzzyEn | 71.80 | 74.56 | 69.05 |
| PermEn, FuzzyEn, ApEn | 71.50 | 74.84 | 68.16 |
| Four features | |||
| SampEn, ApEn, FuzzyEn, PermEn | 98.54 | 99.27 | 97.81 |
| SampEn, ApEn, FuzzyEn, LogEn | 98.40 | 99.11 | 97.70 |
| SampEn, FuzzyEn, PermEn, LogEn | 99.43 | 99.89 | 98.96 |
| SampEn, LogEn, ApEn, PermEn | 98.33 | 99.12 | 97.55 |
| ApEn, FuzzyEn, PermEn, LogEn | 74.95 | 78.35 | 71.54 |
| Five features | |||
| SampEn, ApEn, FuzzyEn, LogEn, Perm | 99.50 | 99.70 | 99.30 |
| Feature | Accuracy (%) | Sensitivity (%) | Specificity (%) |
|---|---|---|---|
| Single feature | |||
| ApEn | 62.60 | 42 | 83.20 |
| SampEn | 64.15 | 56.30 | 72 |
| PermEn | 59.80 | 62.20 | 57.40 |
| FuzzyEn | 64.85 | 48.90 | 80.80 |
| LogEn | 66.90 | 64.70 | 69.10 |
| Two features | |||
| SampEn, ApEn | 72.60 | 64.80 | 80.40 |
| SampEn, LogEn | 79.40 | 72.60 | 86.2 |
| SampEn, PermEn | 67.35 | 62.80 | 71.90 |
| SampEn, FuzzyEn | 75.80 | 66.80 | 84.80 |
| ApEn, LogEn | 79.75 | 72 | 87.5 |
| ApEn, PermEn | 68.70 | 56.90 | 80.50 |
| ApEn, FuzzyEn | 78.05 | 70.60 | 85.50 |
| LogEn, PermEn | 76.45 | 77.40 | 75.50 |
| LogEn, FuzzyEn | 79.60 | 71.20 | 88 |
| PermEn, FuzzyEn | 72.85 | 70.40 | 75.30 |
| Three features | |||
| SampEn, ApEn, LogEn | 84.35 | 79.20 | 89.50 |
| SampEn, ApEn, PermEn | 73.50 | 70.40 | 76.60 |
| SampEn, ApEn, FuzzyEn | 82.35 | 77.40 | 87.30 |
| SampEn, PermEn, LogEn | 82.75 | 77.70 | 87.80 |
| SampEn, LogEn, FuzzyEn | 87.35 | 86.10 | 88.60 |
| SampEn, FuzzyEn, PermEn | 84.15 | 78.50 | 89.80 |
| ApEn, LogEn, PermEn | 86.70 | 81.70 | 91.70 |
| ApEn, LogEn, FuzzyEn | 84.30 | 80 | 88.60 |
| LogEn, PermEn, FuzzyEn | 84 | 78.40 | 89.60 |
| PermEn, FuzzyEn, ApEn | 84.25 | 80.40 | 88.10 |
| Four features | |||
| SampEn, ApEn, FuzzyEn, PermEn | 90.25 | 88 | 92.50 |
| SampEn, ApEn, FuzzyEn, LogEn | 89.55 | 87.70 | 91.40 |
| SampEn, FuzzyEn, PermEn, LogEn | 88 | 86.50 | 89.50 |
| SampEn, LogEn, ApEn, PermEn | 89.85 | 88.70 | 91 |
| ApEn, FuzzyEn, PermEn, LogEn | 90.75 | 87.70 | 93.80 |
| Five features | |||
| SampEn, ApEn, FuzzyEn, LogEn, Perm | 92.80 | 91 | 94.60 |
| Author Name | Number of Signal Pairs | Methodology | Classifiers | Accuracy | Sensitivity | Specificity |
|---|---|---|---|---|---|---|
| BB dataset | ||||||
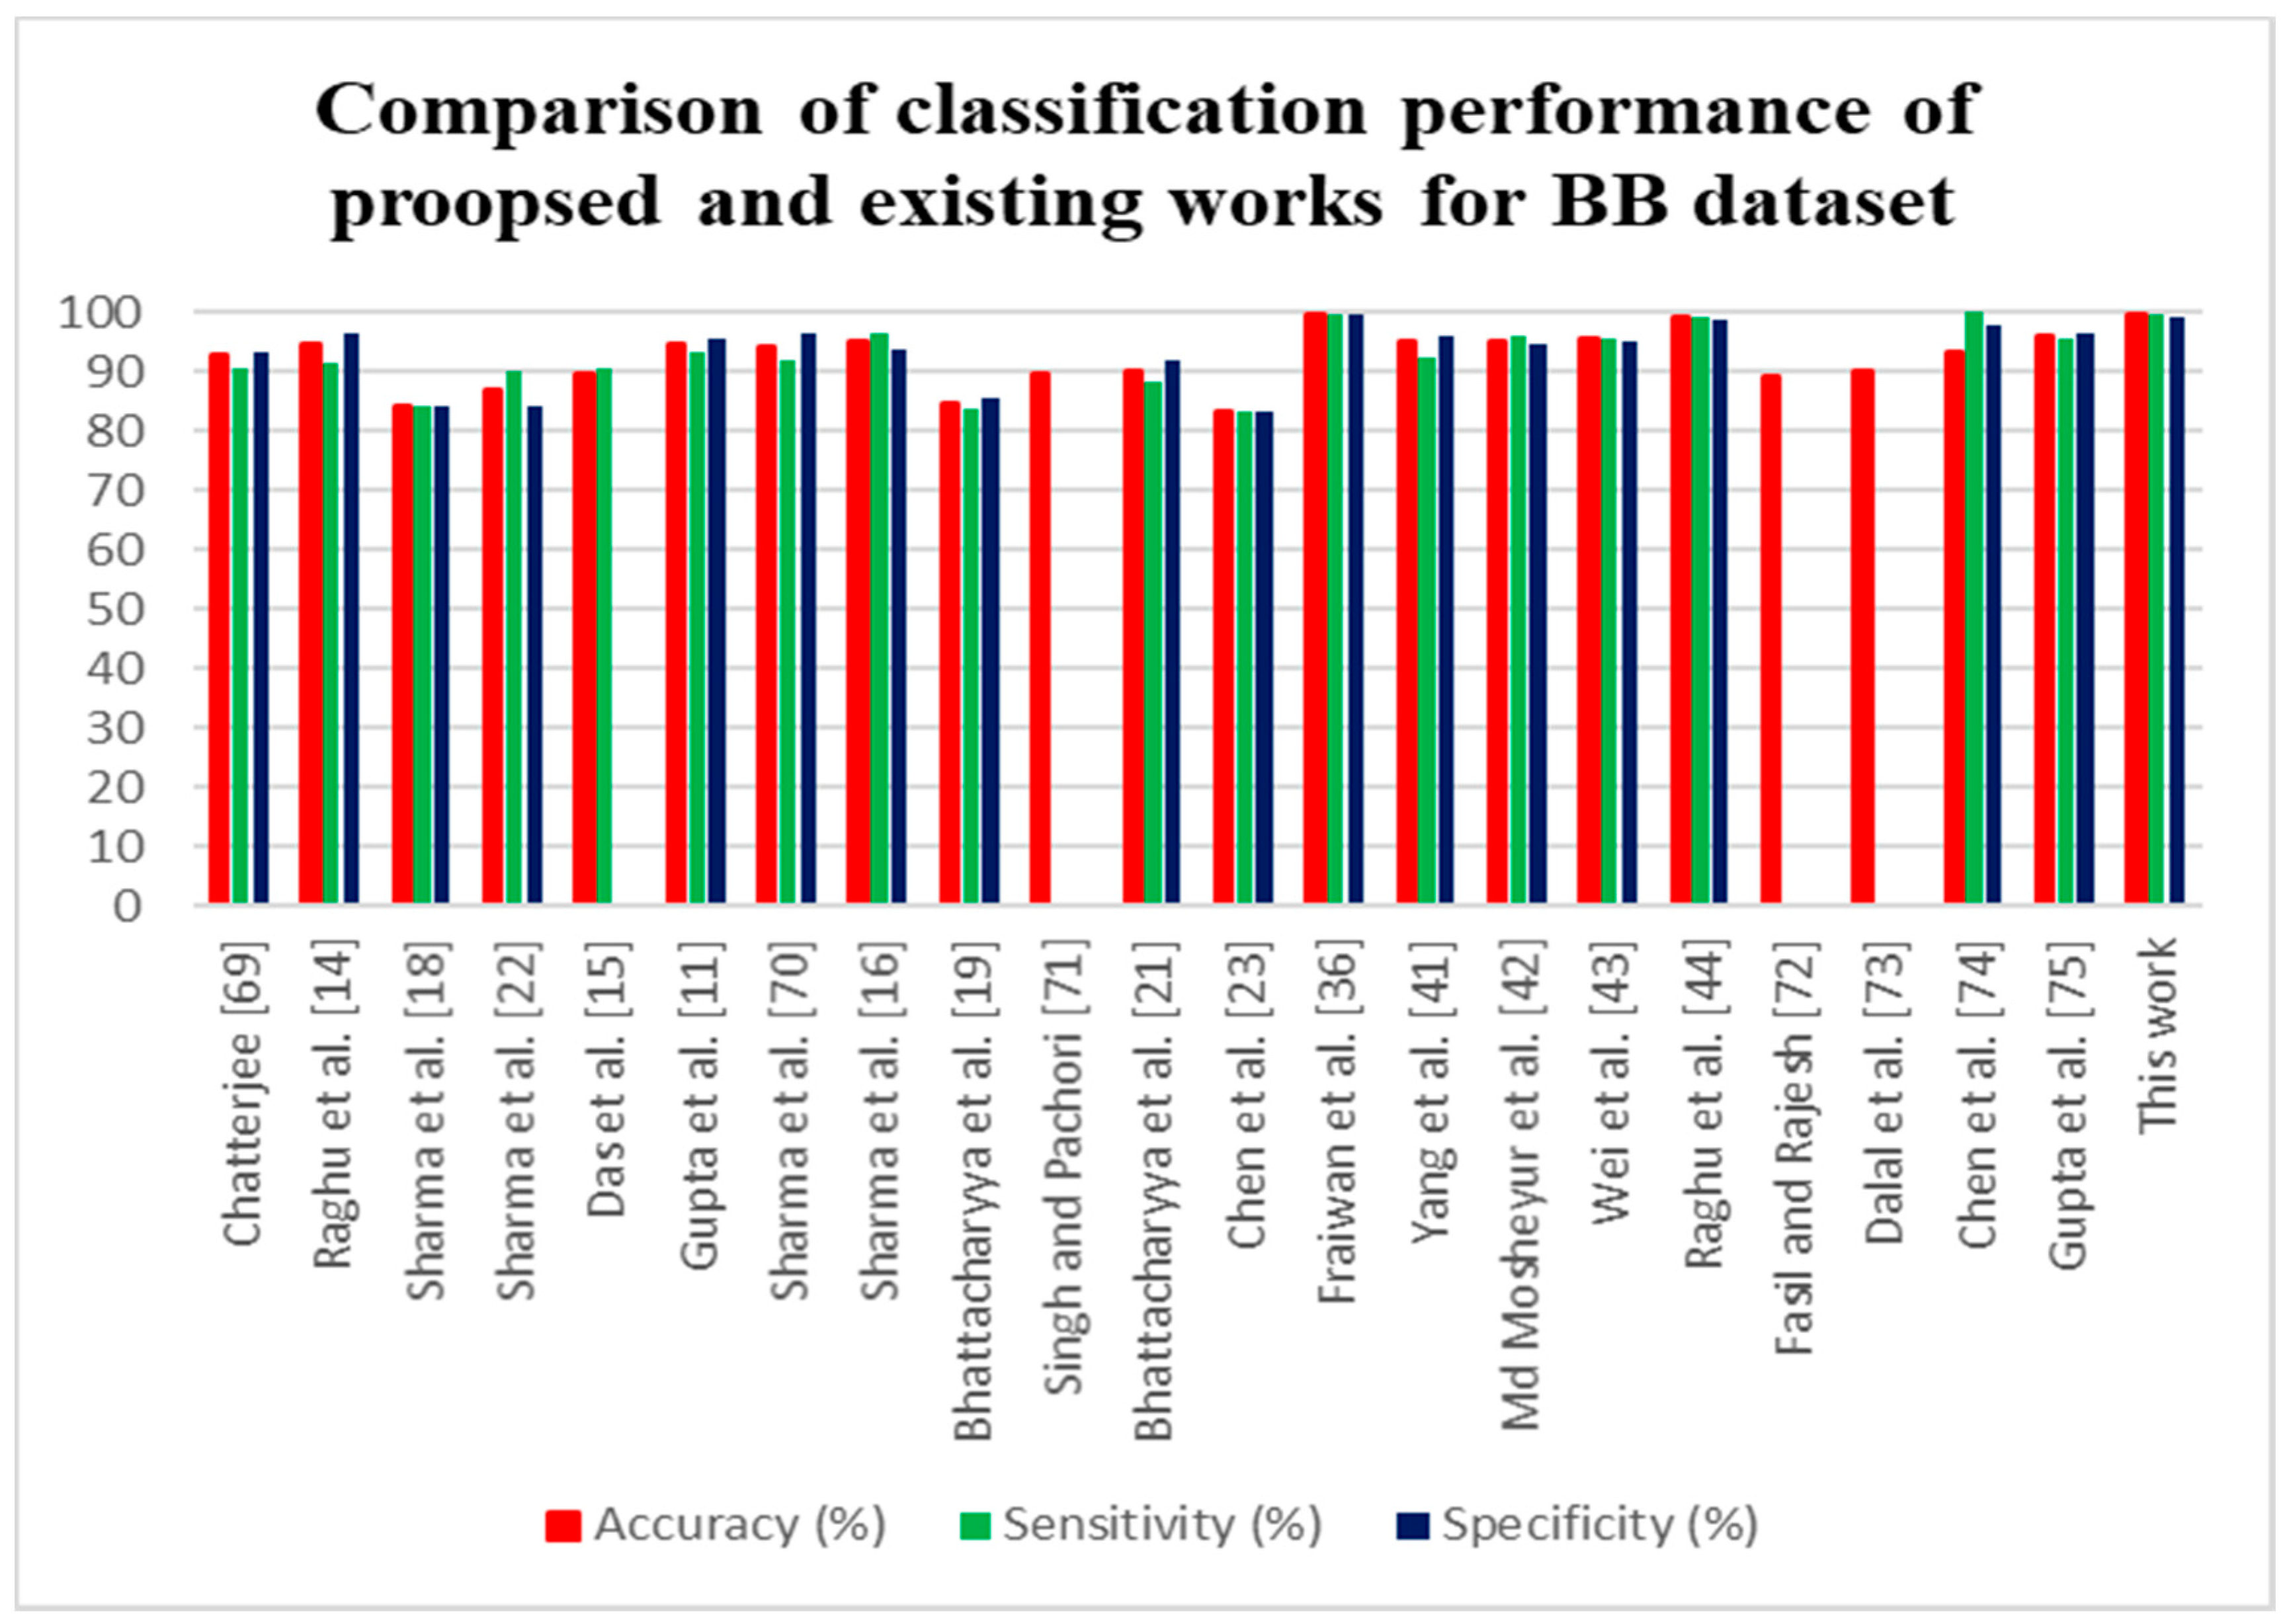
| Chatterjee [69] | 3750 pairs | Higher order moments in EMD-TKEO domain | SVM | 92.65 | 90.70 | 93.15 |
| Raghu et al. [14] | 3750 pairs | NCA and entropies | LS-SVM | 94.5 | 91.5 | 96.56 |
| Sharma et al. [18] | 50 pairs | DWT and seven different entropies | LS-SVM | 84 | 84 | 84 |
| Sharma et al. [22] | 50 pairs | EM, and six different entropies | LS-SVM | 87 | 90 | 84 |
| Das et al. [15] | 50 pairs | EMD, DWT, and three nonlinear features | k-NN | 89.4 | 90.7 | - |
| Gupta et al. [11] | 3750 pairs | FAWT and three different entropies | LS-SVM | 94.41 | 93.25 | 95.57 |
| Sharma et al. [13] | 3750 pairs | Orthogonal wavelet filter banks, entropy measures | LS-SVM | 94.25 | 91.95 | 96.56 |
| Sharma et al. [16] | 3750 pairs | TQWT and three different entropies | LS-SVM | 95 | 96.37 | 93.47 |
| Bhattacharyya et al. [19] | 3750 pairs | TQWT based multivariate sub-band fuzzy entropy | LS-SVM | 84.67 | 83.86 | 85.46 |
| Singh and Pachori [29] | 50 pairs | Fourier rhythms, bandwidth features | LS-SVM | 89.7 | - | - |
| Bhattacharyya et al. [21] | 50 pairs | EWT, area computed from RPS rhythms | LS-SVM | 90 | 88 | 92 |
| Chen et al. [23] | 3750 pairs | DWT and statistical features | SVM | 83.07 | 83.05 | 83.09 |
| Fraiwan et al. [36] | 3750 pairs | - | LSTM | 99.60 | 99.65 | 99.55 |
| Yang et al. [41] | 3750 pairs | FAWT and entropies | LS-SVM | 94.80 | 92.27 | 96.10 |
| Md Mosheyur et al. [42] | 3750 pairs | VMD-DWT and entropies | Ensemble stacking | 95.2 | 96.1 | 94.4 |
| Wei et al. [43] | 3750 pairs | EMD, IMF based | Neural network | 95.37 | 95.52 | 95.23 |
| Raghu et al. [44] | 3750 pairs | Third order cumulant function | SVM | 99 | 99.33 | 98.66 |
| Fasil and Rajesh [70] | 3750 pairs | Time domain exponential energy | SVM | 89 | - | - |
| Dalal et al. [29] | 50 pairs | Flexible time-frequency coverage analytic wavelet transform and Fractal dimension | Robust energy-based least square twin support vector machine | 90.2 | - | - |
| Chen et al. [71] | 50 Pairs | ARMA, EMD, singular values | SVM | 93 | 100 | 97.9 |
| Gupta et al. [72] | 3750 pairs | Fourier–Bessel series expansion based flexible time-frequency coverage wavelet transform, mixture correntropy, exponential energy | LS-SVM | 95.85 | 95.47 | 96.24 |
| This work | 3750 pairs | FWHT + Entropies | ANN | 99.50 | 99.70 | 99.30 |
| University of Bonn dataset | ||||||
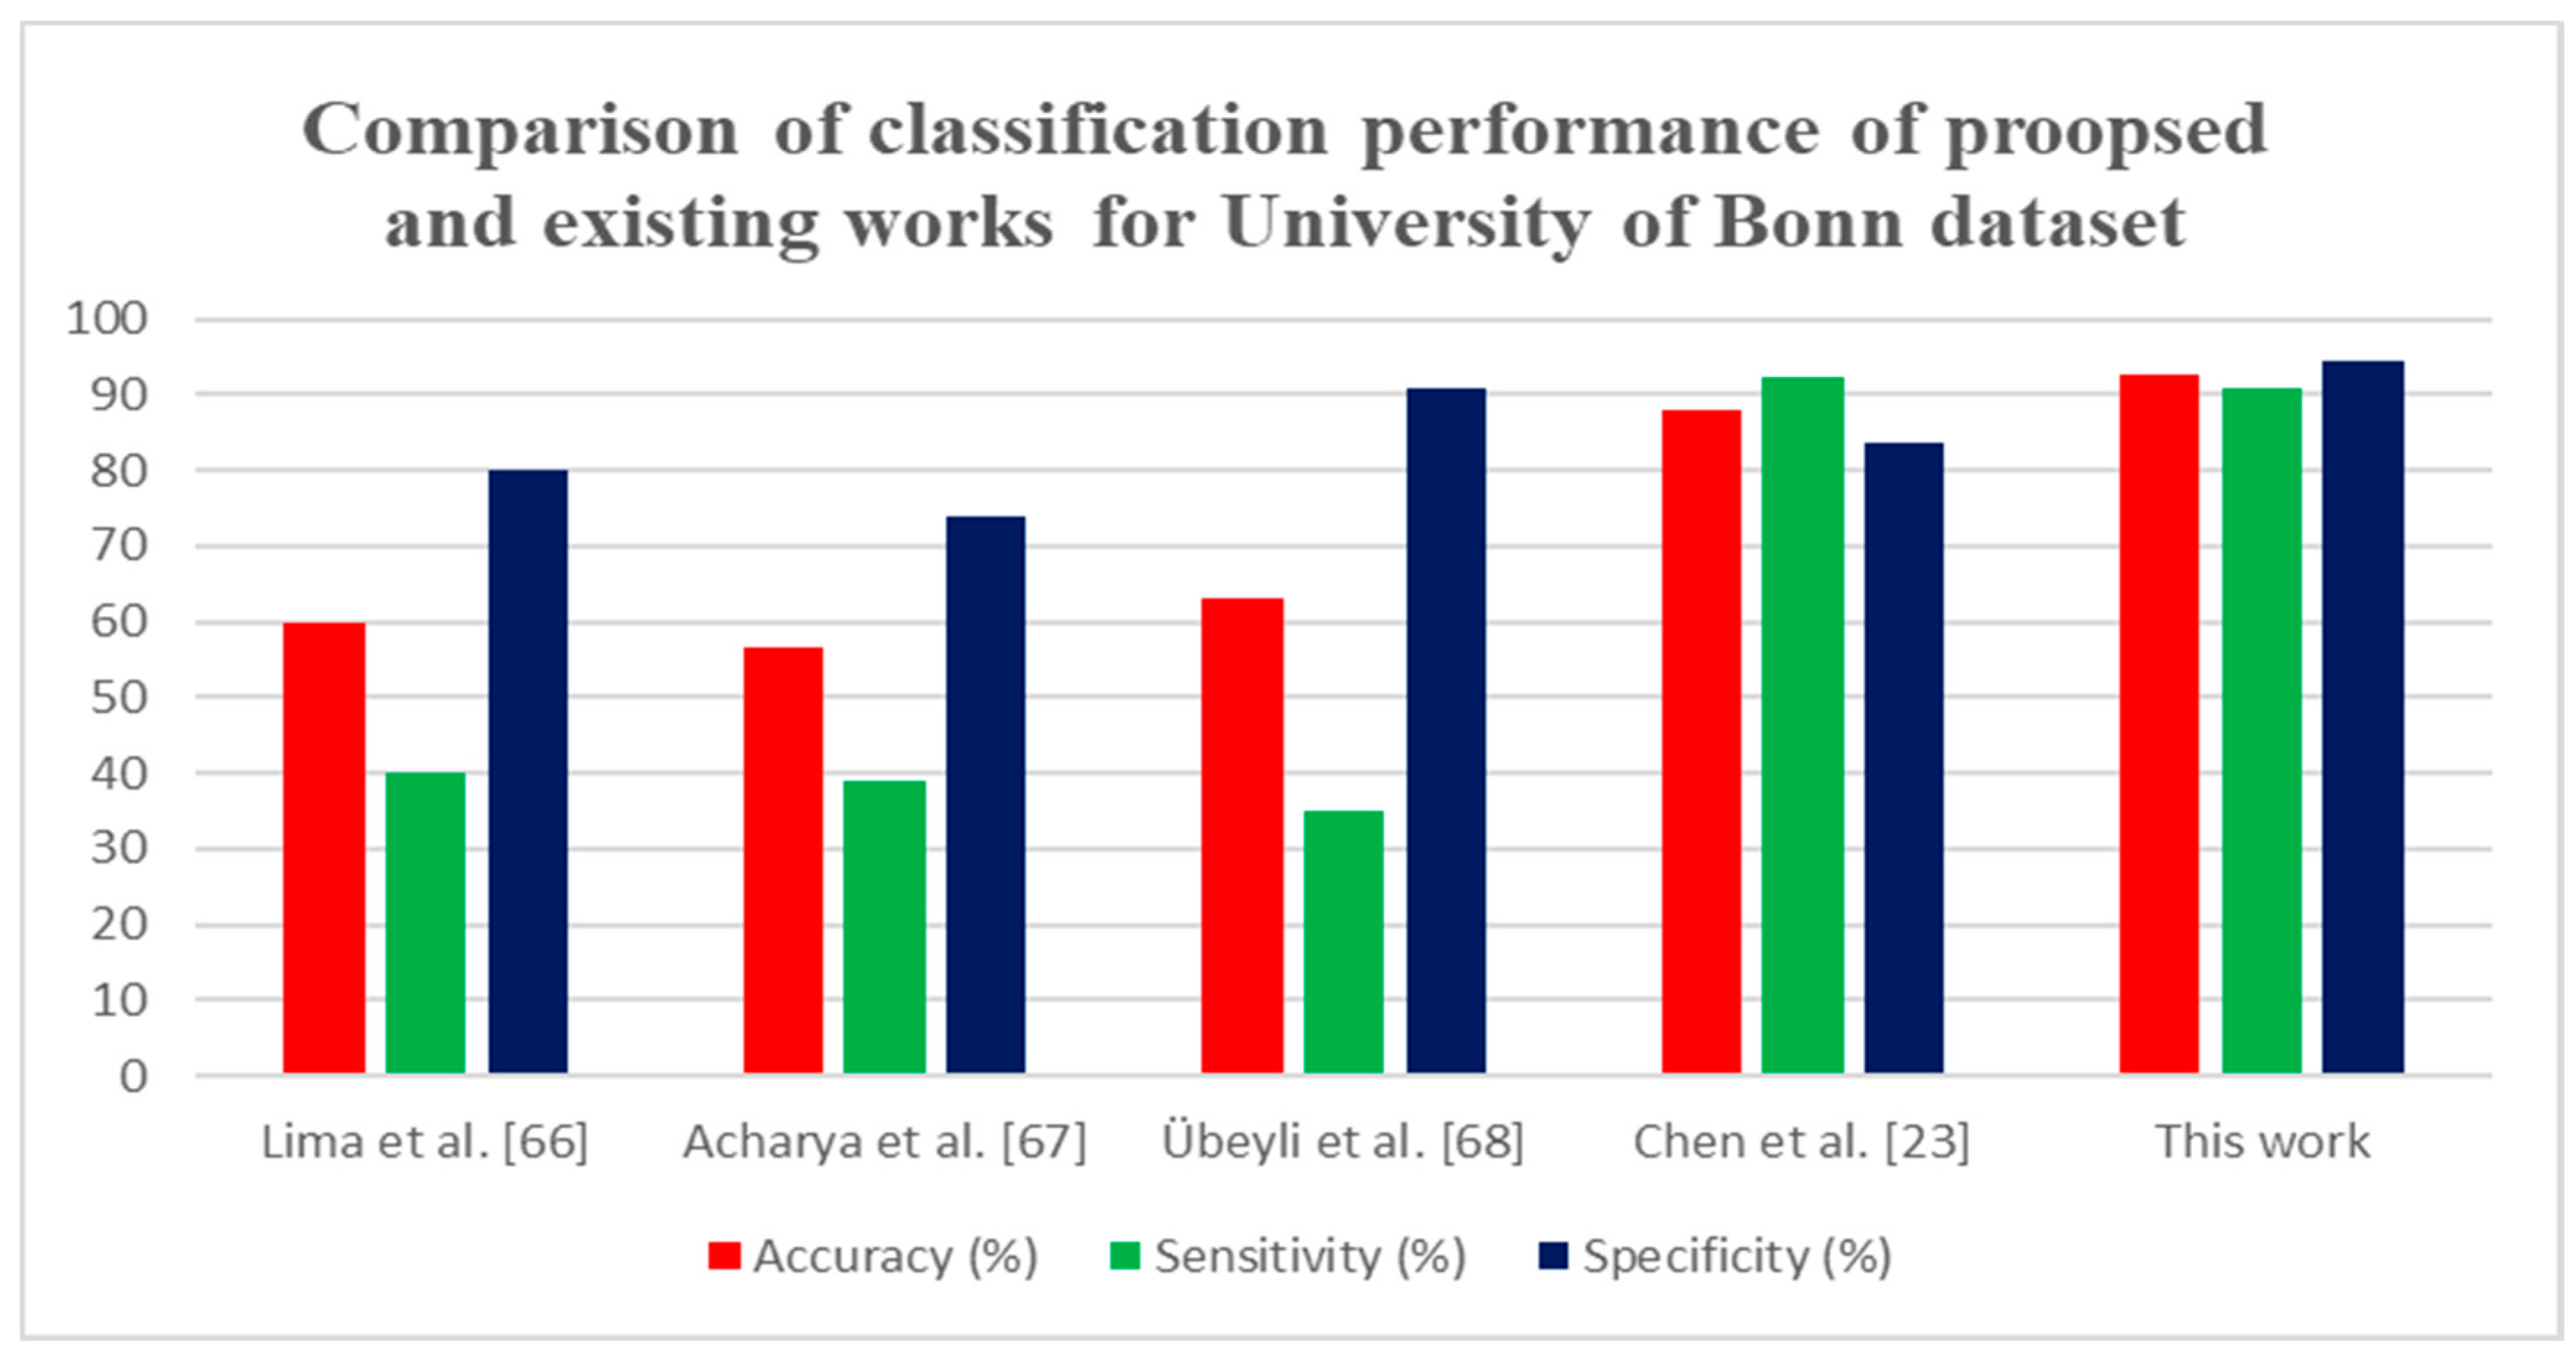
| Lima et al. [66] | 200 signals | DWT and statistical features | RVM | 60 | 40 | 80 |
| Acharya et al. [67] | 200 signals | WPD and PCA | GMM | 56.50 | 39 | 74 |
| Übeyli et al. [68] | 200 signals | DWT and statistical features | ANN | 63 | 35 | 91 |
| Chen et al. [23] | 200 signals | DWT and statistical features | SVM | 88 | 92.24 | 83.76 |
| This work | 200 signals | FWHT + Entropies | ANN | 92.80 | 91 | 94.60 |
© 2020 by the authors. Licensee MDPI, Basel, Switzerland. This article is an open access article distributed under the terms and conditions of the Creative Commons Attribution (CC BY) license (http://creativecommons.org/licenses/by/4.0/).
Share and Cite
J., P.; Subathra, M.S.P.; Mohammed, M.A.; Maashi, M.S.; Garcia-Zapirain, B.; Sairamya, N.J.; George, S.T. Detection of Focal and Non-Focal Electroencephalogram Signals Using Fast Walsh-Hadamard Transform and Artificial Neural Network. Sensors 2020, 20, 4952. https://doi.org/10.3390/s20174952
J. P, Subathra MSP, Mohammed MA, Maashi MS, Garcia-Zapirain B, Sairamya NJ, George ST. Detection of Focal and Non-Focal Electroencephalogram Signals Using Fast Walsh-Hadamard Transform and Artificial Neural Network. Sensors. 2020; 20(17):4952. https://doi.org/10.3390/s20174952
Chicago/Turabian StyleJ., Prasanna, M. S. P. Subathra, Mazin Abed Mohammed, Mashael S. Maashi, Begonya Garcia-Zapirain, N. J. Sairamya, and S. Thomas George. 2020. "Detection of Focal and Non-Focal Electroencephalogram Signals Using Fast Walsh-Hadamard Transform and Artificial Neural Network" Sensors 20, no. 17: 4952. https://doi.org/10.3390/s20174952
APA StyleJ., P., Subathra, M. S. P., Mohammed, M. A., Maashi, M. S., Garcia-Zapirain, B., Sairamya, N. J., & George, S. T. (2020). Detection of Focal and Non-Focal Electroencephalogram Signals Using Fast Walsh-Hadamard Transform and Artificial Neural Network. Sensors, 20(17), 4952. https://doi.org/10.3390/s20174952