Customized 2D Barcode Sensing for Anti-Counterfeiting Application in Smart IoT with Fast Encoding and Information Hiding

 , and
, and
Abstract
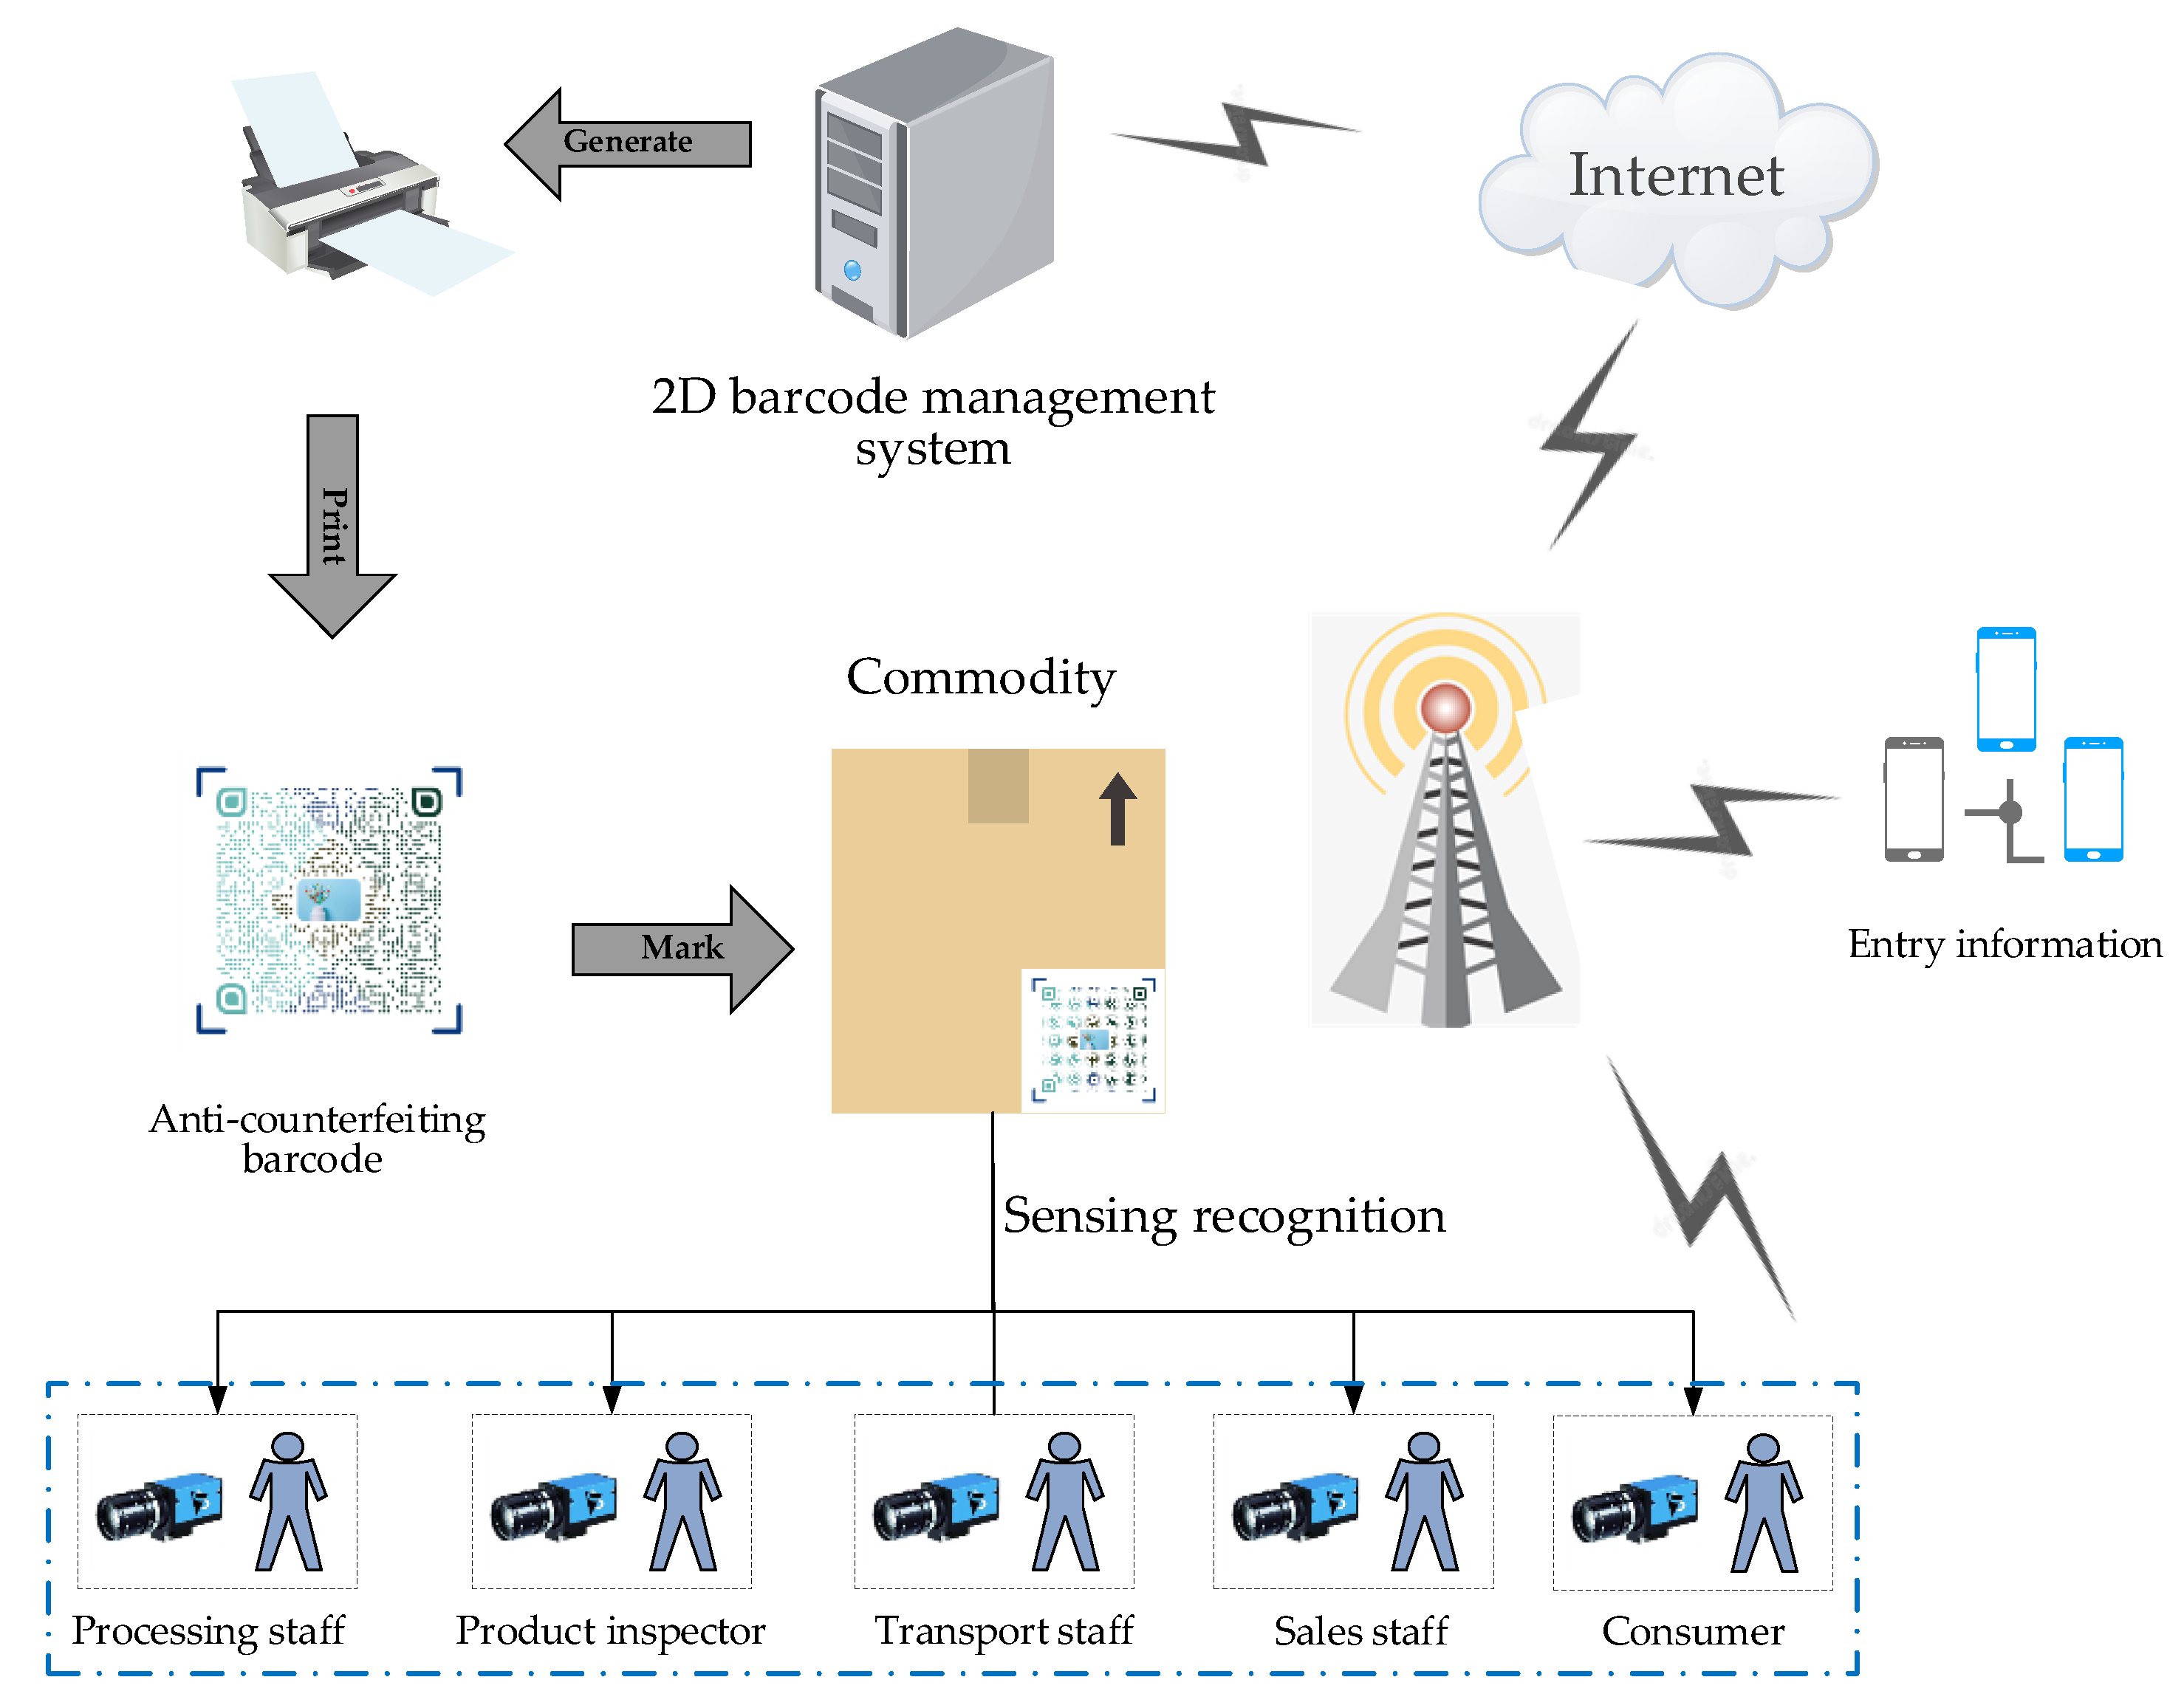
1. Introduction
2. The Encoding Algorithm of Customized 2D Barcodes
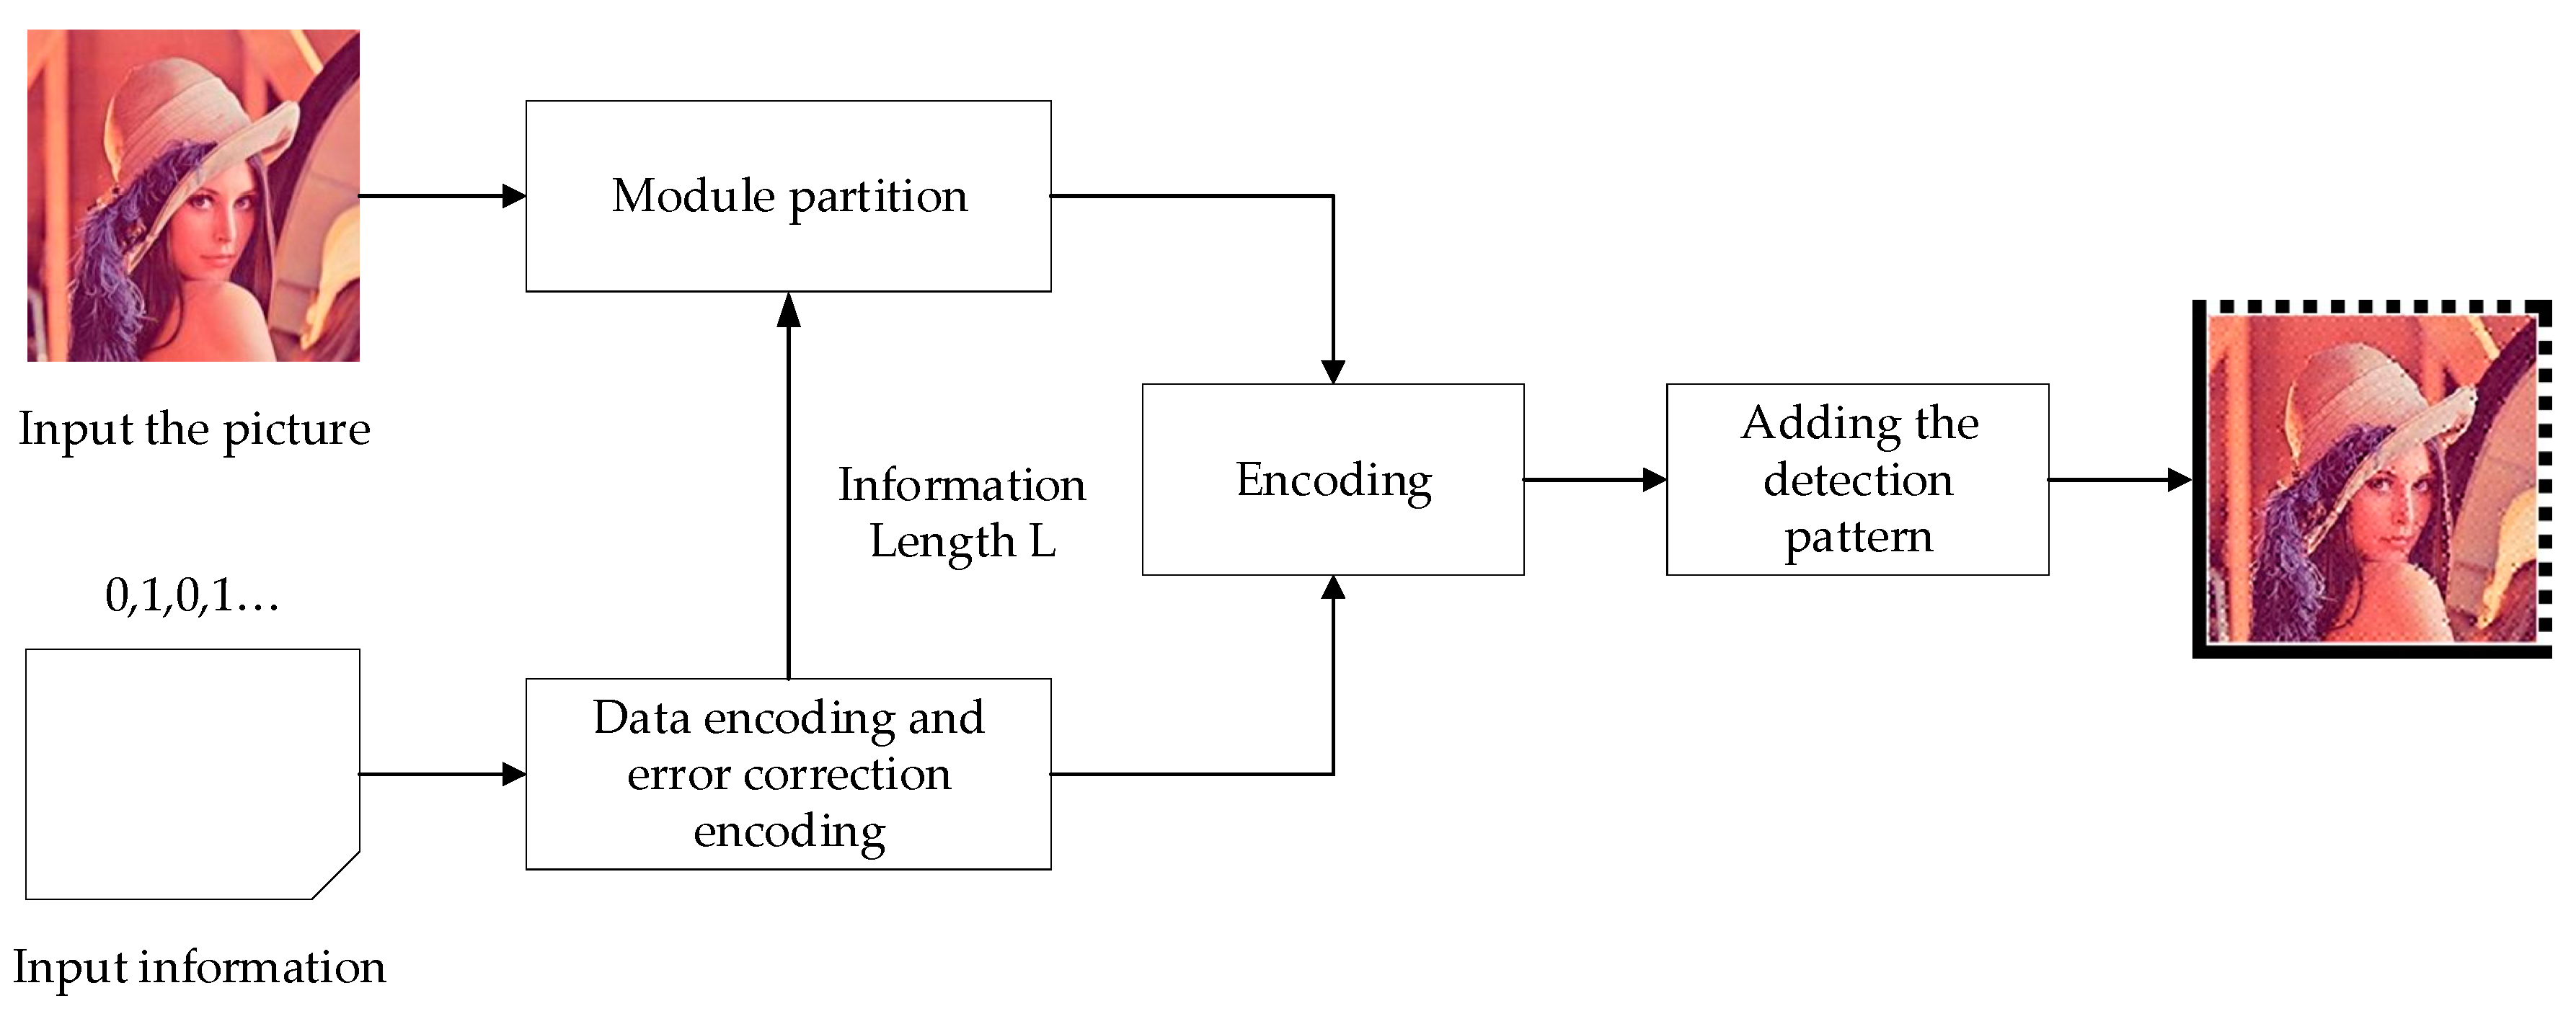
- Perform data and error correction encoding, based on the RS error correction coding mechanism to form a bitstream B, and obtain the information length L;
- Input the picture and divide it into modules according to the information length L;
- Encode the image based on encoding rules to obtain a picture-embedding 2D barcode;
- Add the detection pattern according to the size of the formed code map, then form a complete customized 2D barcode.
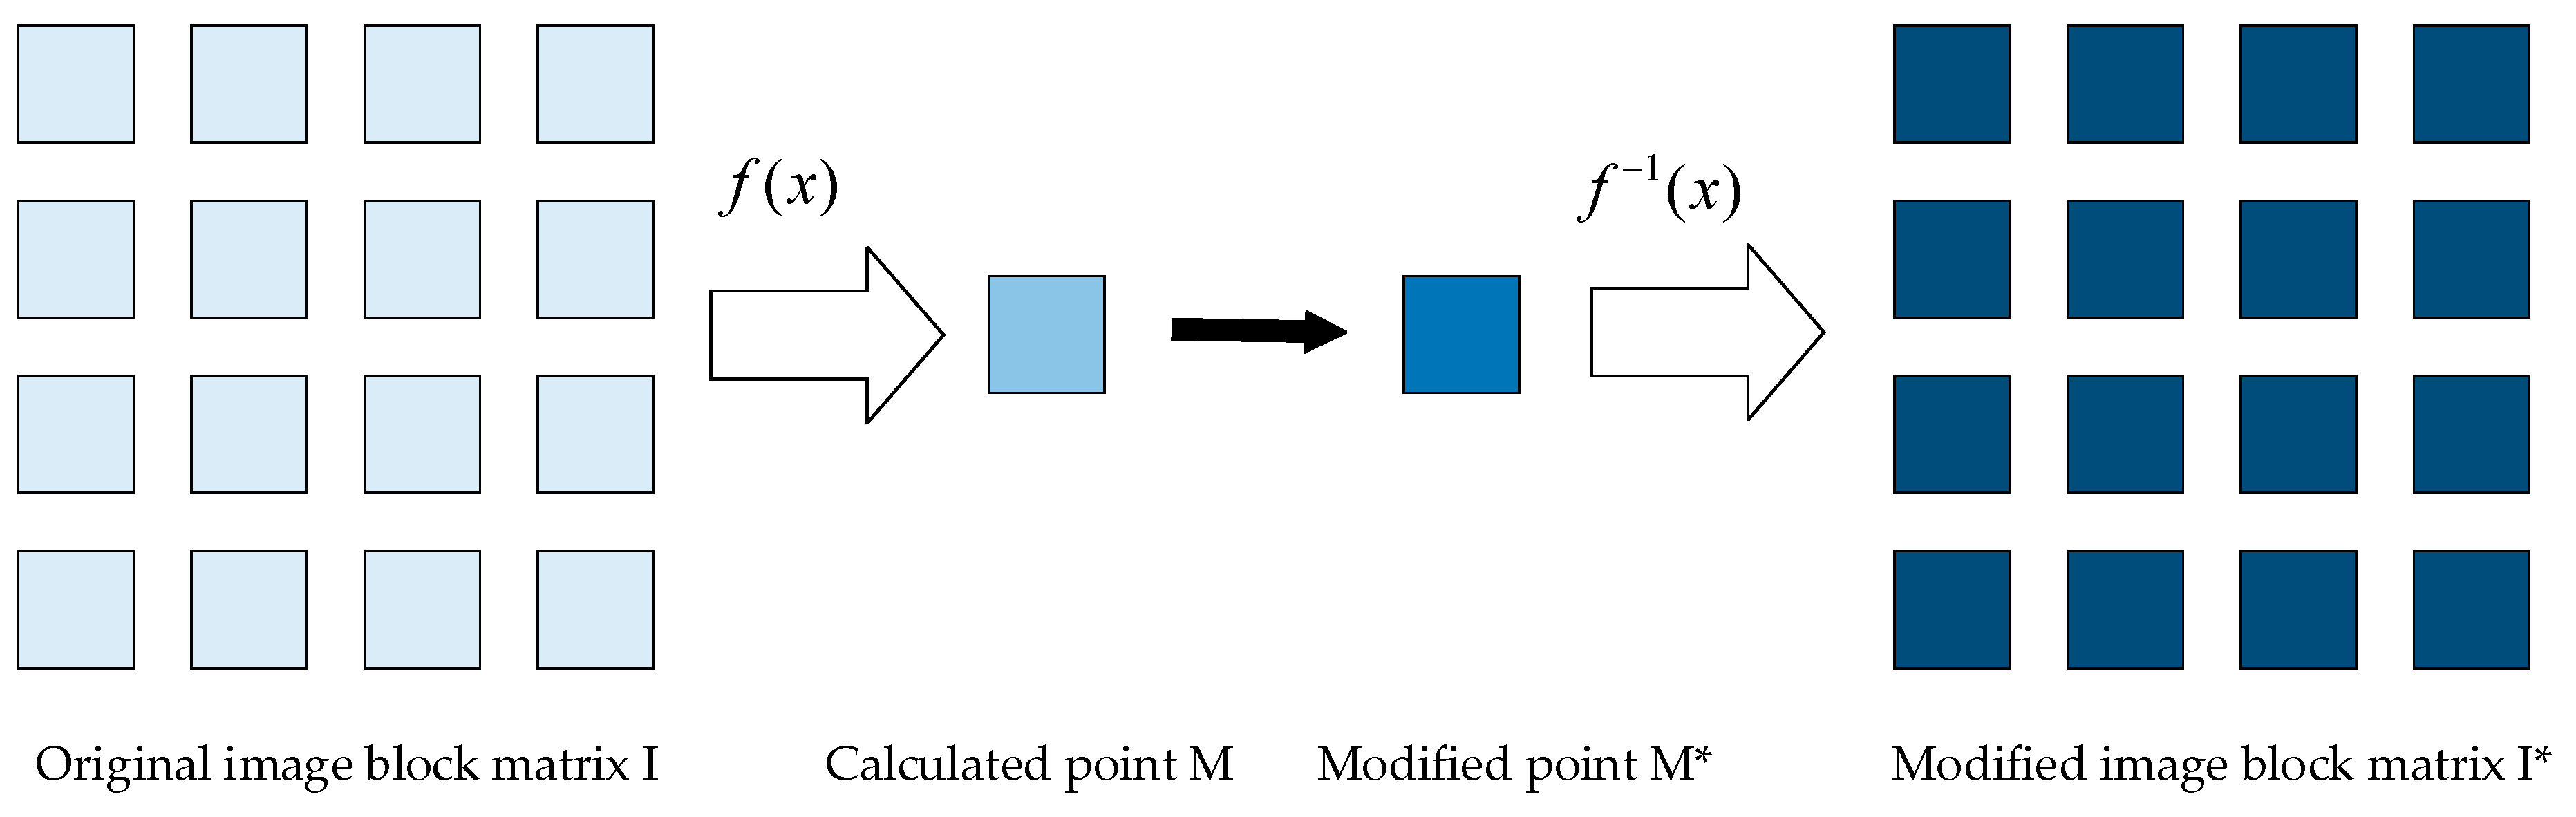
- , is in the second position. Suppose and are in the first and third place, respectively, and the value of remains unchanged. If the differences between each pair of , , and are no less than the threshold , the value remains unchanged. Otherwise, the former is added by , whilst the latter is reduced by to enlarge the differences to be no less than . This process could be expressed as:
- , is in the remaining position. Suppose , , and are in the first, second, and third places, respectively. Similar to the first case, the value of remains unchanged, and we need to ensure that the differences between and , and and are no less than the threshold . If the differences between them meet the requirements, the original value remains unchanged. Otherwise, the first position subtracts the corresponding second and third position to get a new value, respectively, ensuring that the differences are no less than the threshold . This process could be expressed as:
- , is in the first or the third position. Suppose , , and are in the first, second, and third places, respectively. The correct order of adjustment is that is ranked first, is second, and is third. In addition, we utilize the median exchange method to calculate the amount of value change to reduce the impact on the aesthetics of pictures due to value change. Namely, is equivalent to the average of and , and is changed plus the threshold . If the difference between the values of and is no less than the threshold , the original value remains unchanged. Conversely, subtracts the threshold to get a new value. This process could be expressed as:
- , is in the second position. Suppose is in the first place, and is in the third. To reduce the impact on the aesthetics of pictures due to value change, exchanges the position with the closer distance. Assuming that is close to , which means that . Then is equal to the average of and , and is after changes, plus the threshold . If the difference between the values of and after being changed is no less than the threshold , the original value remains unchanged. Conversely, subtracts the threshold to get a new value. This process could be expressed as:
3. The Recognition Algorithm of Customized 2D Barcodes Sensing
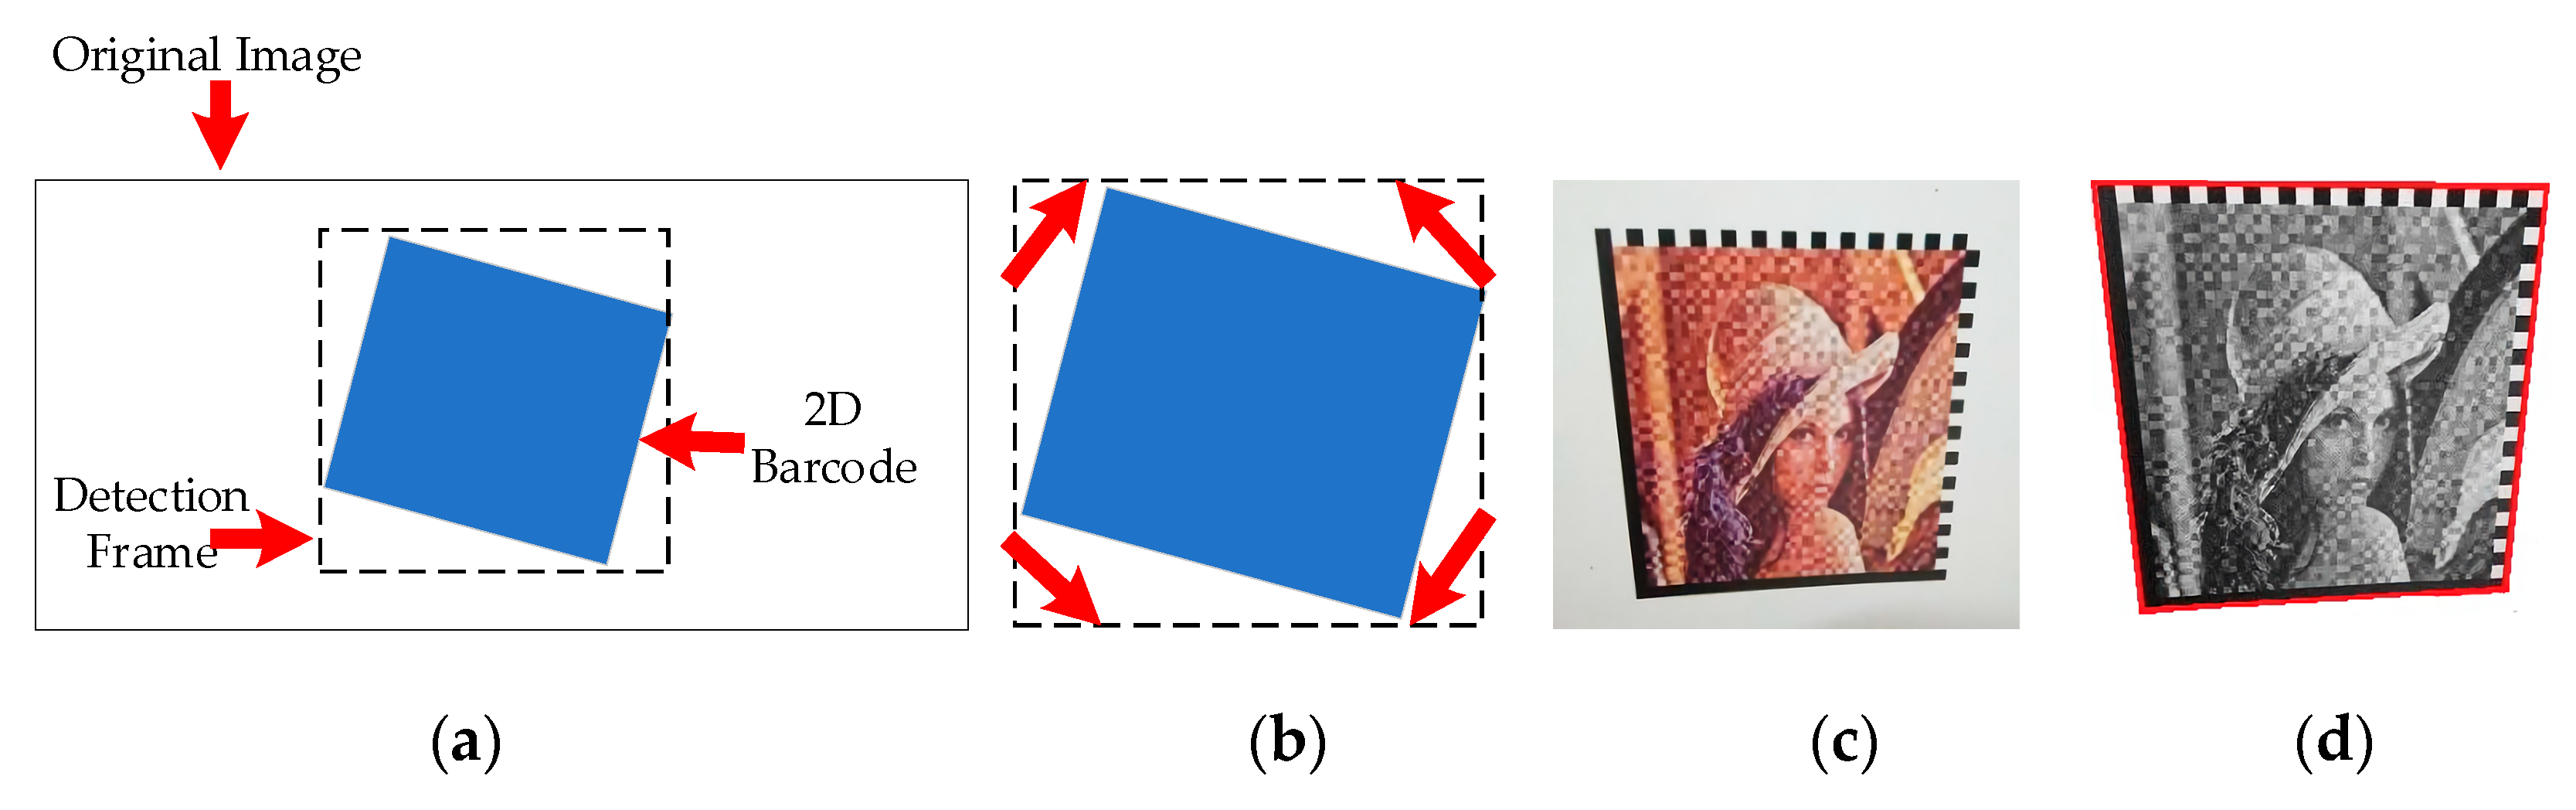
3.1. Corner Detection
3.2. Deformation Correction of the Customized 2D Barcode
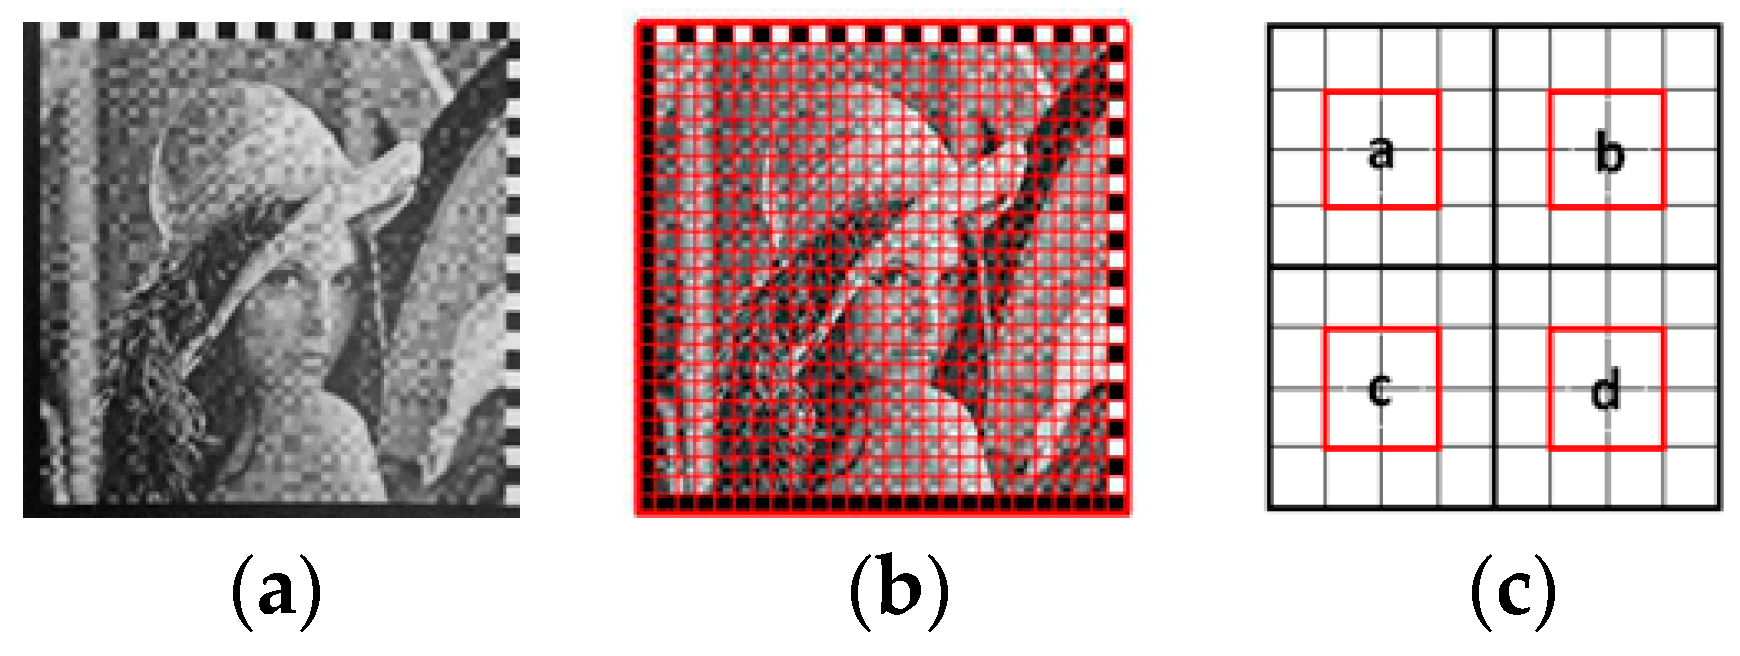
3.3. Customized 2D Barcode Decoding
4. Experimental Results and Analysis
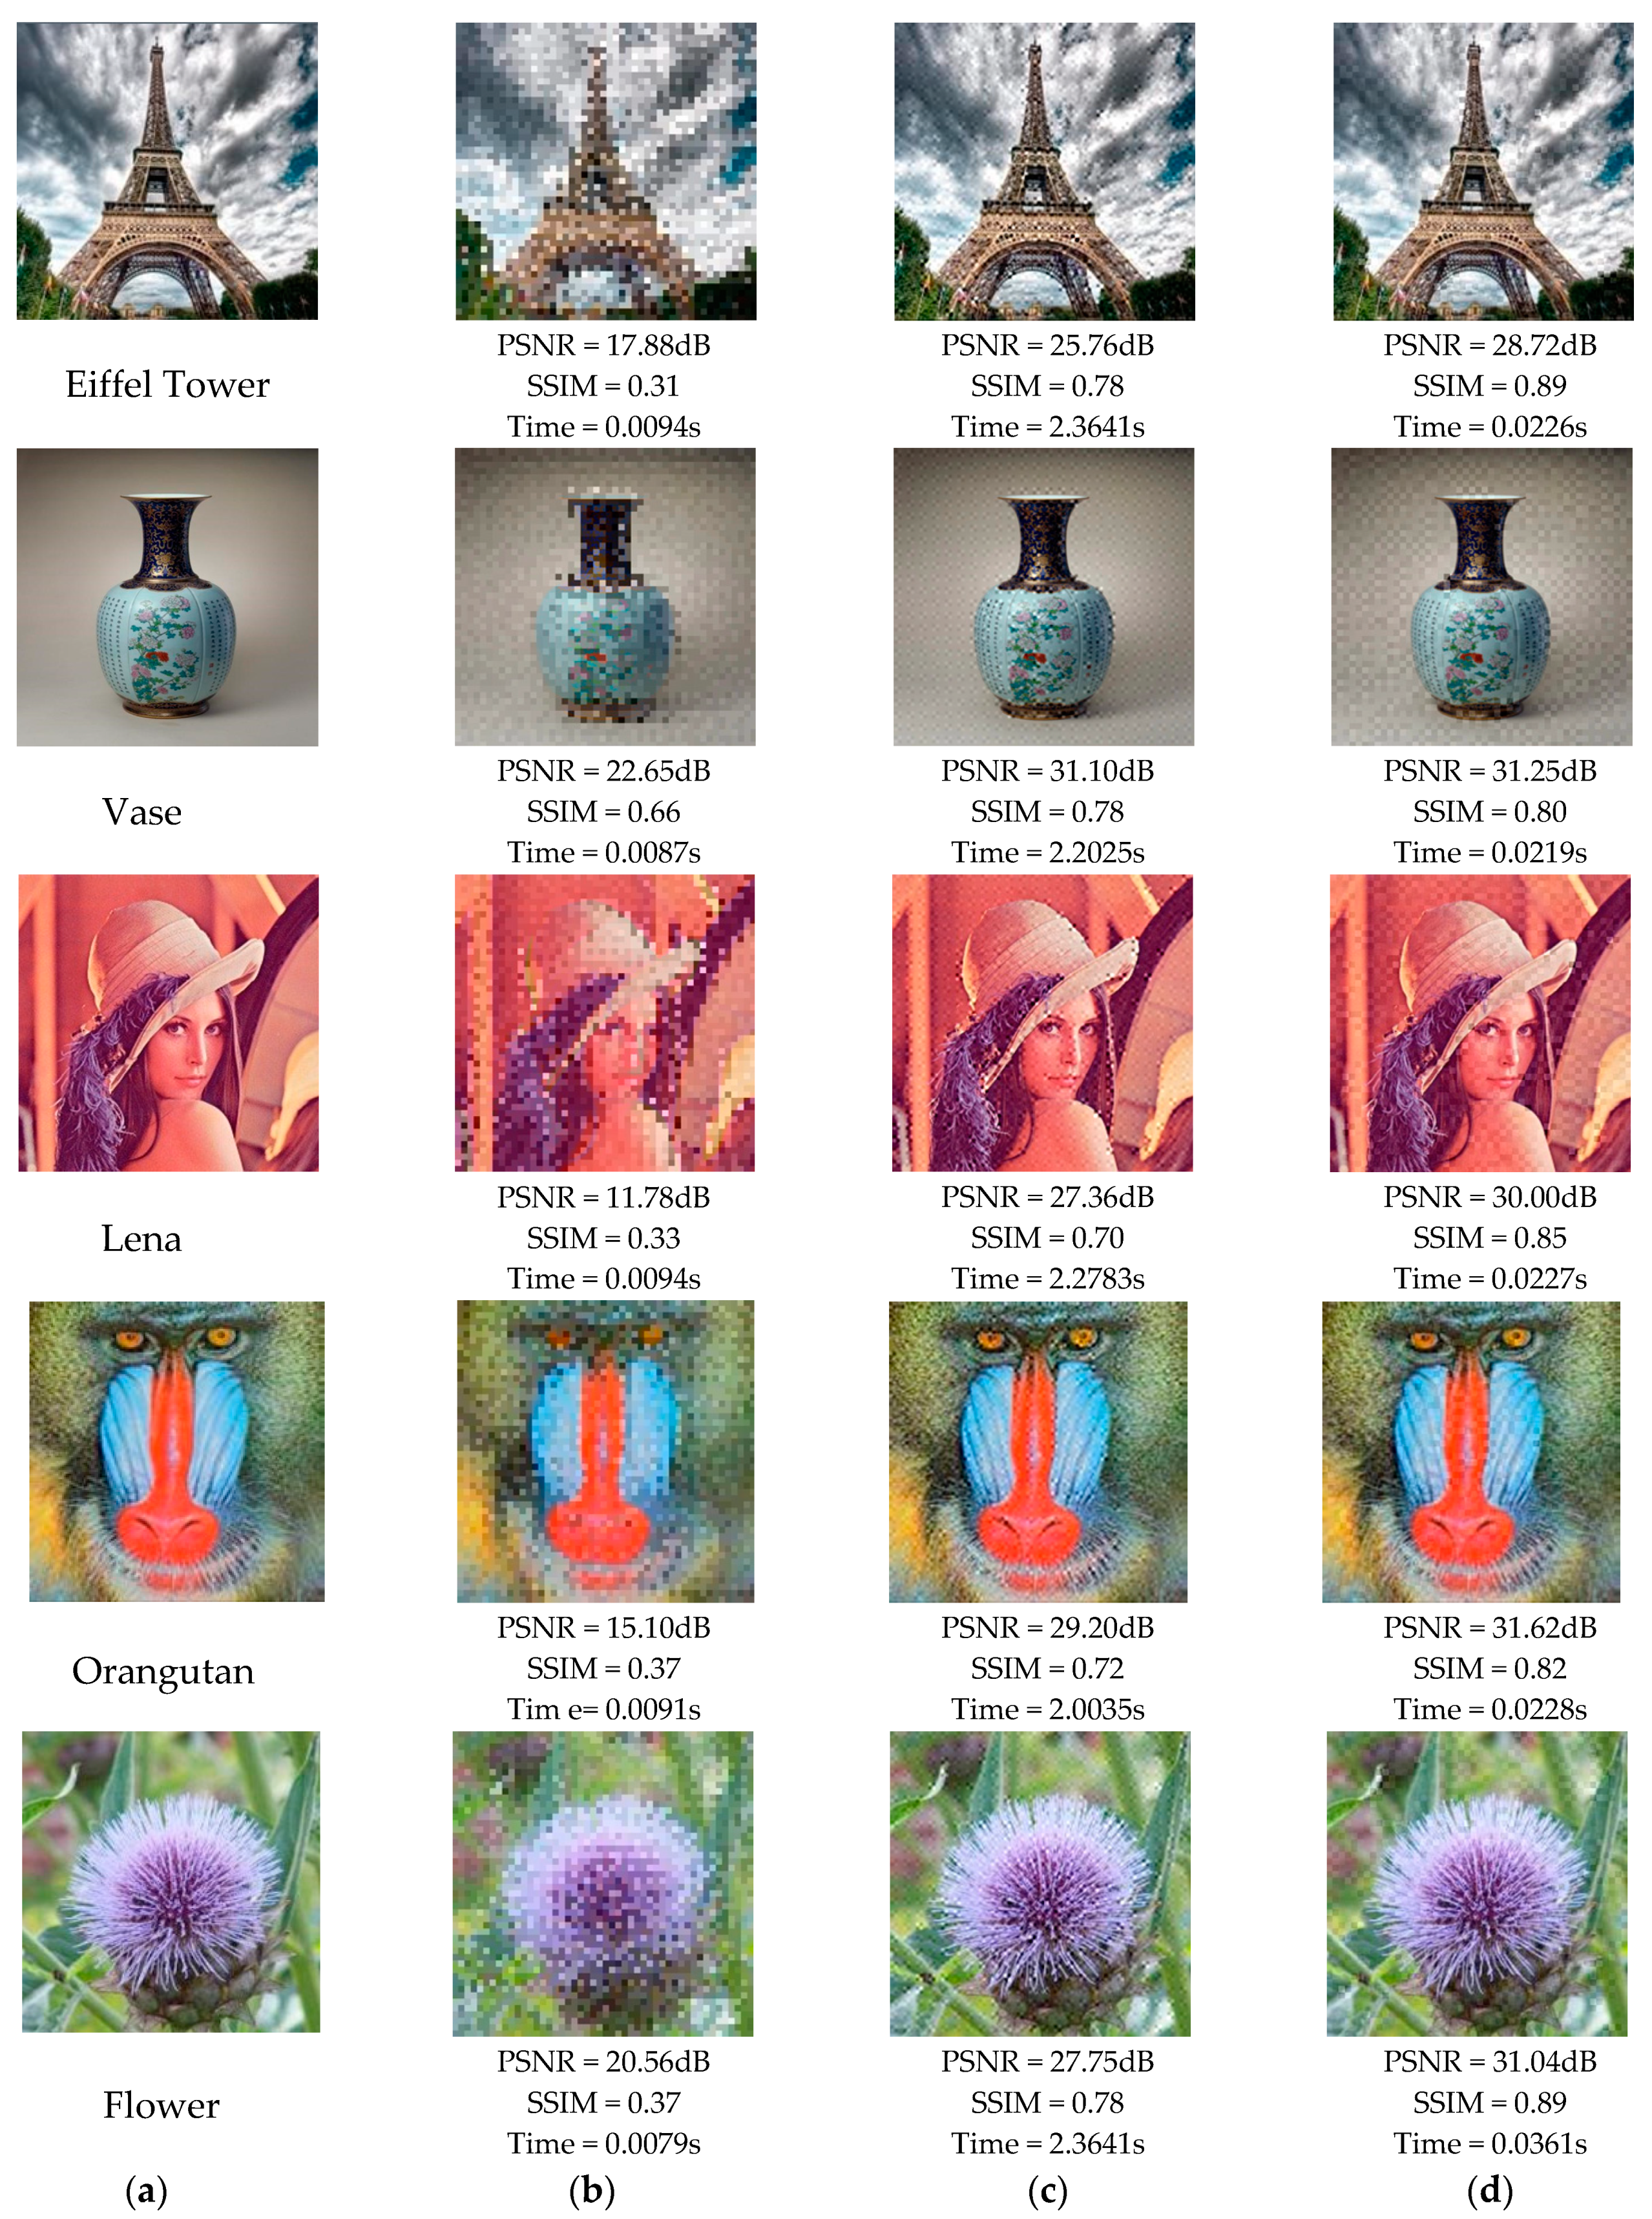
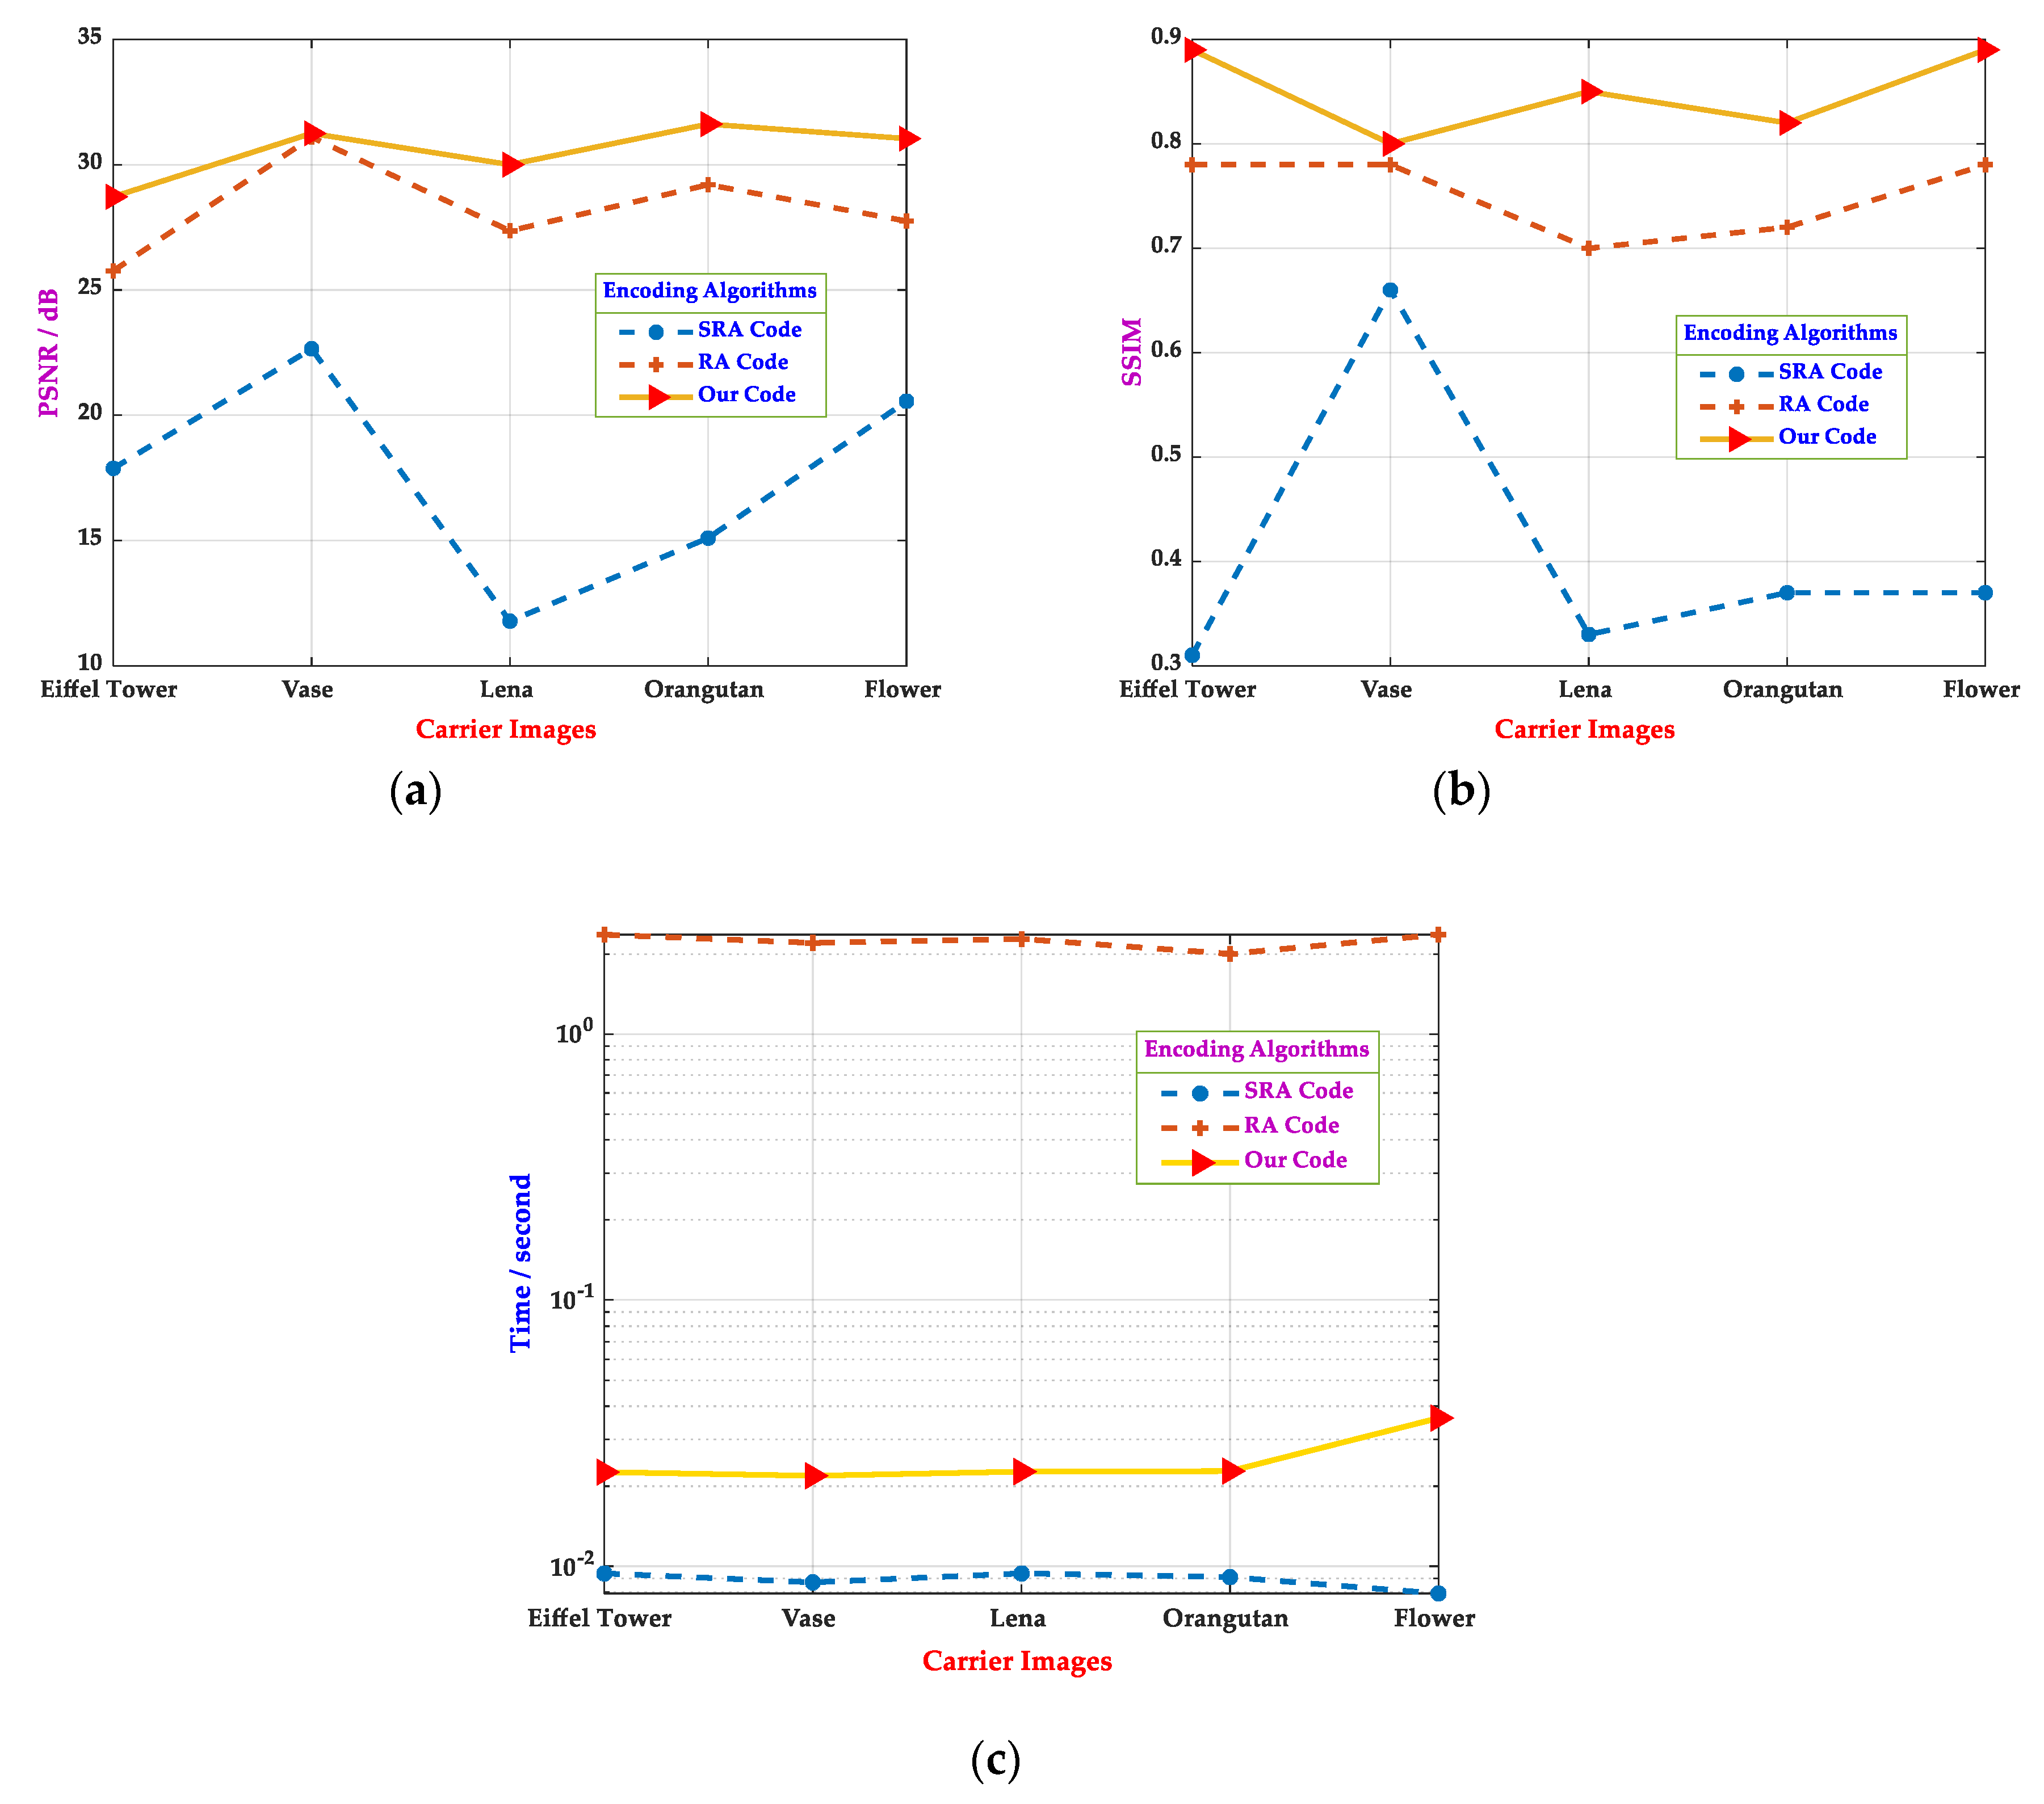
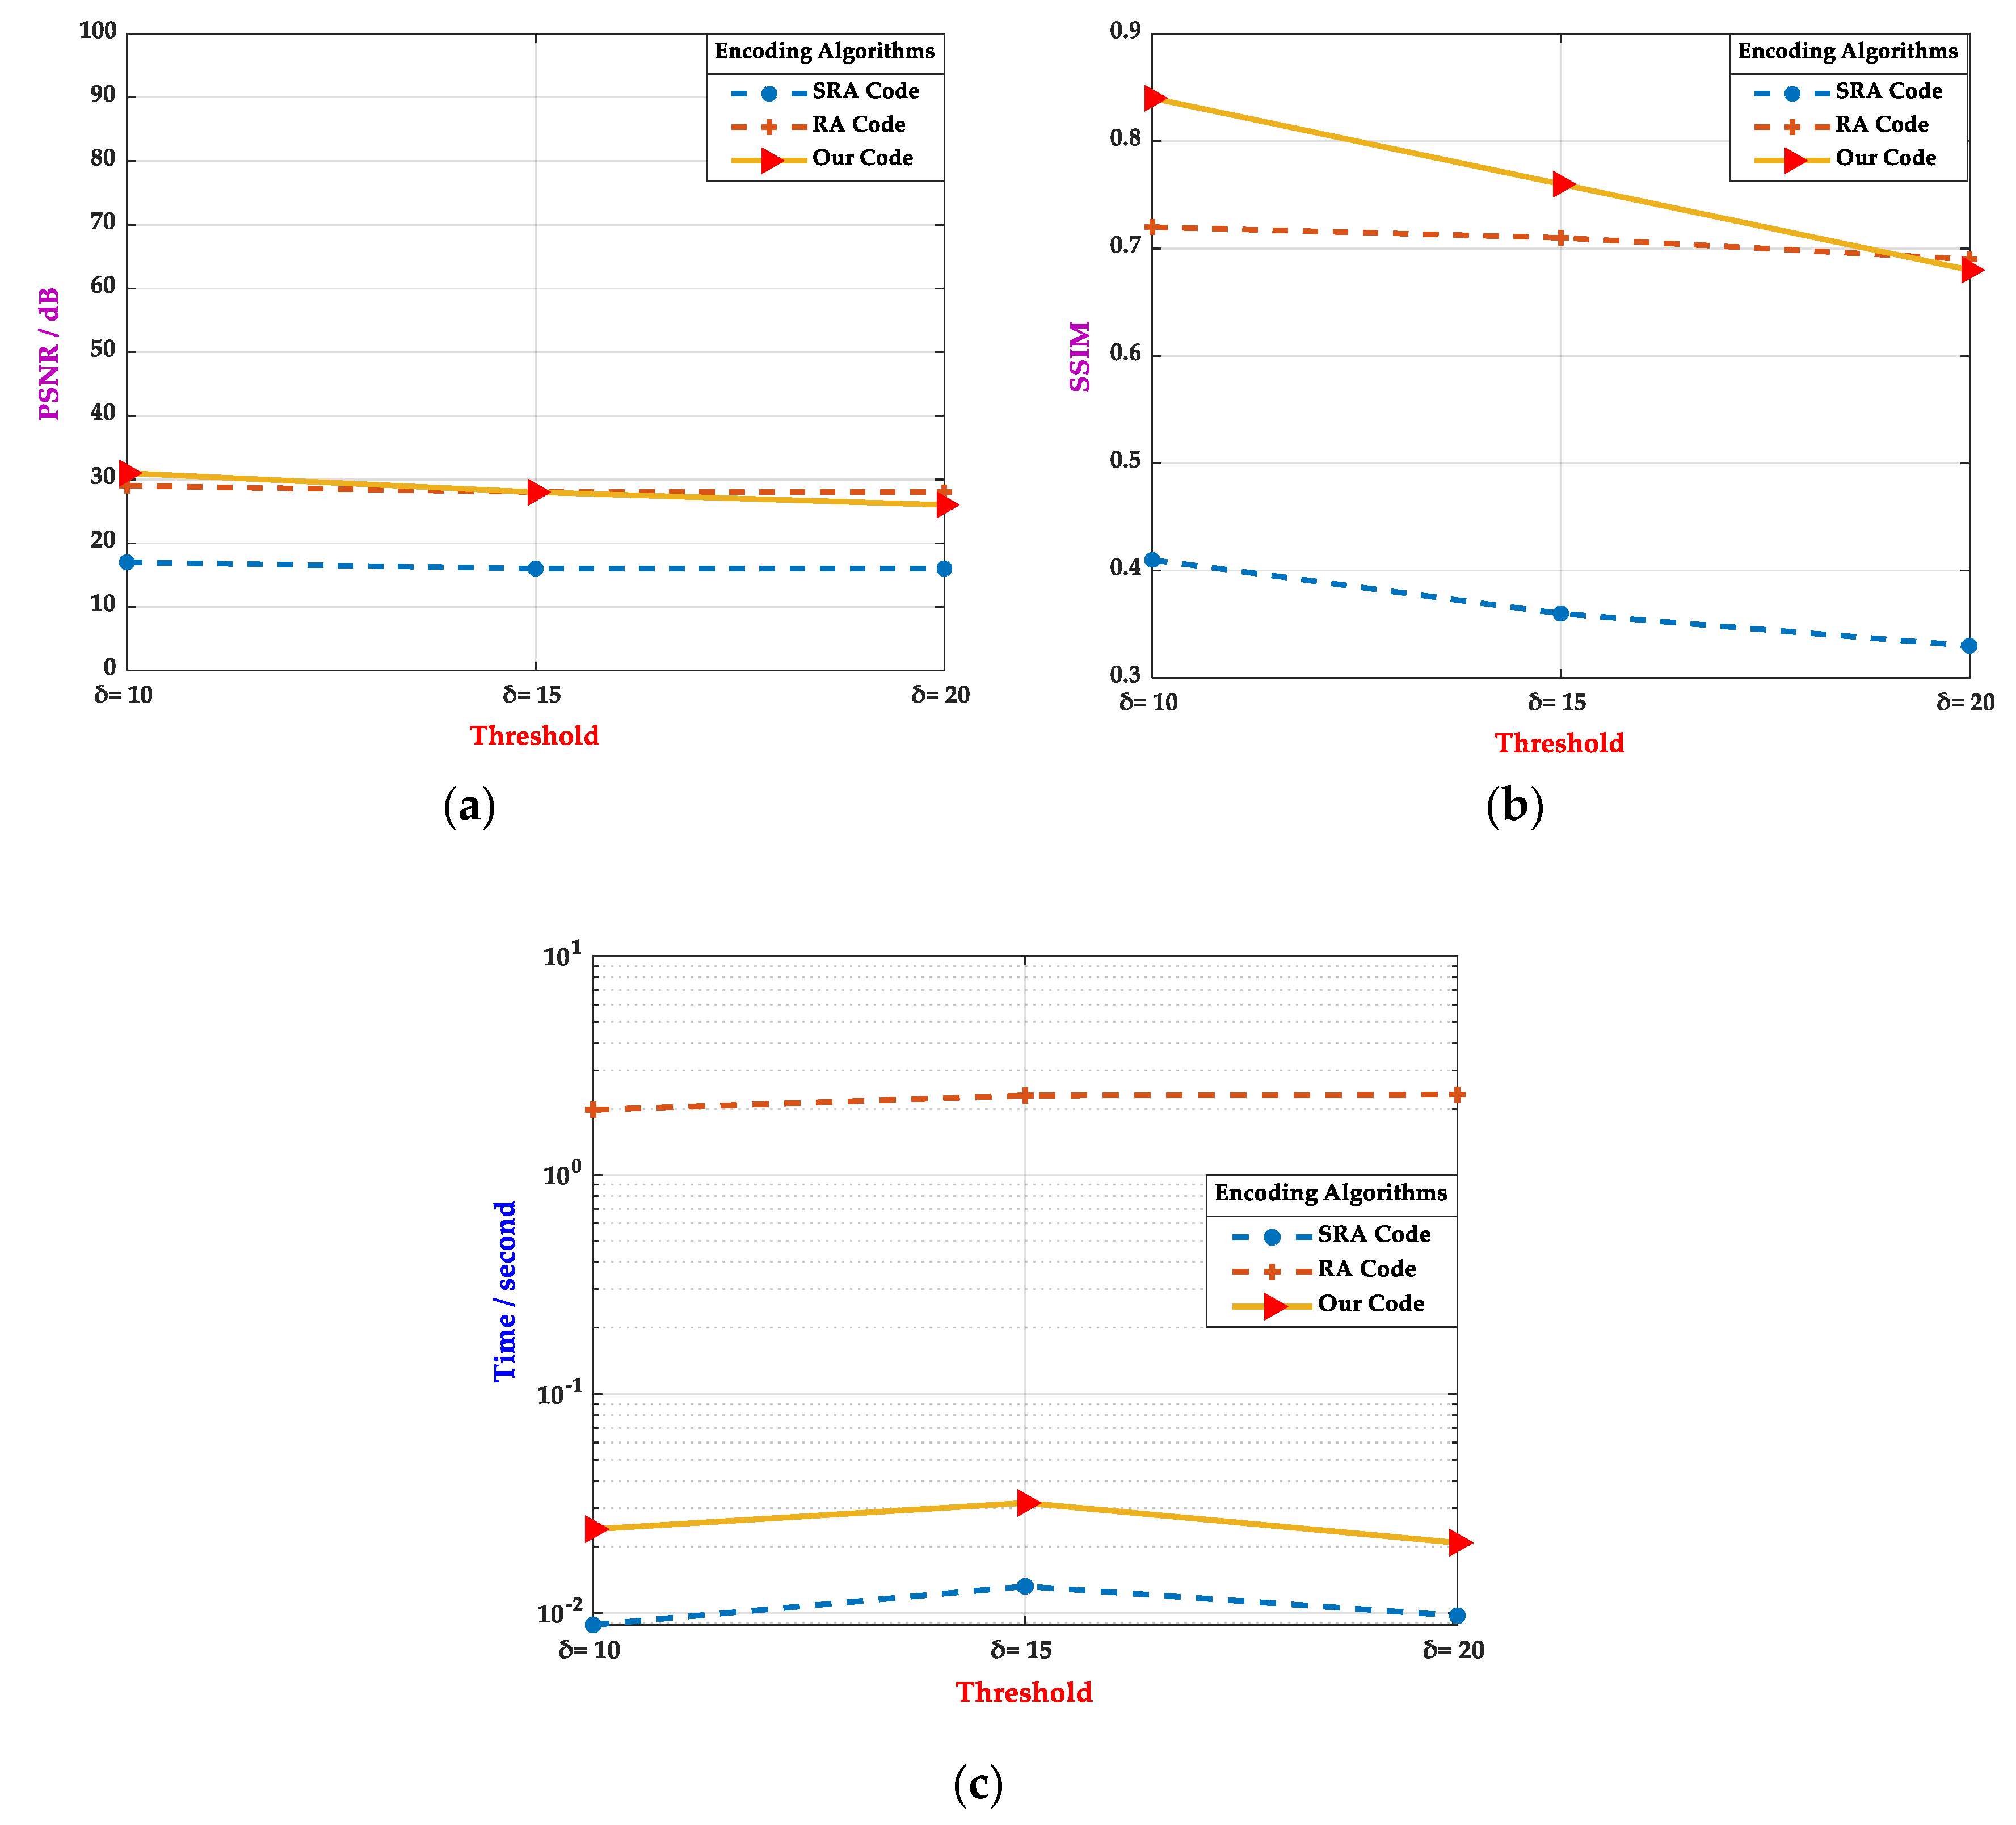
4.1. Perceptual Quality and Encoding Time
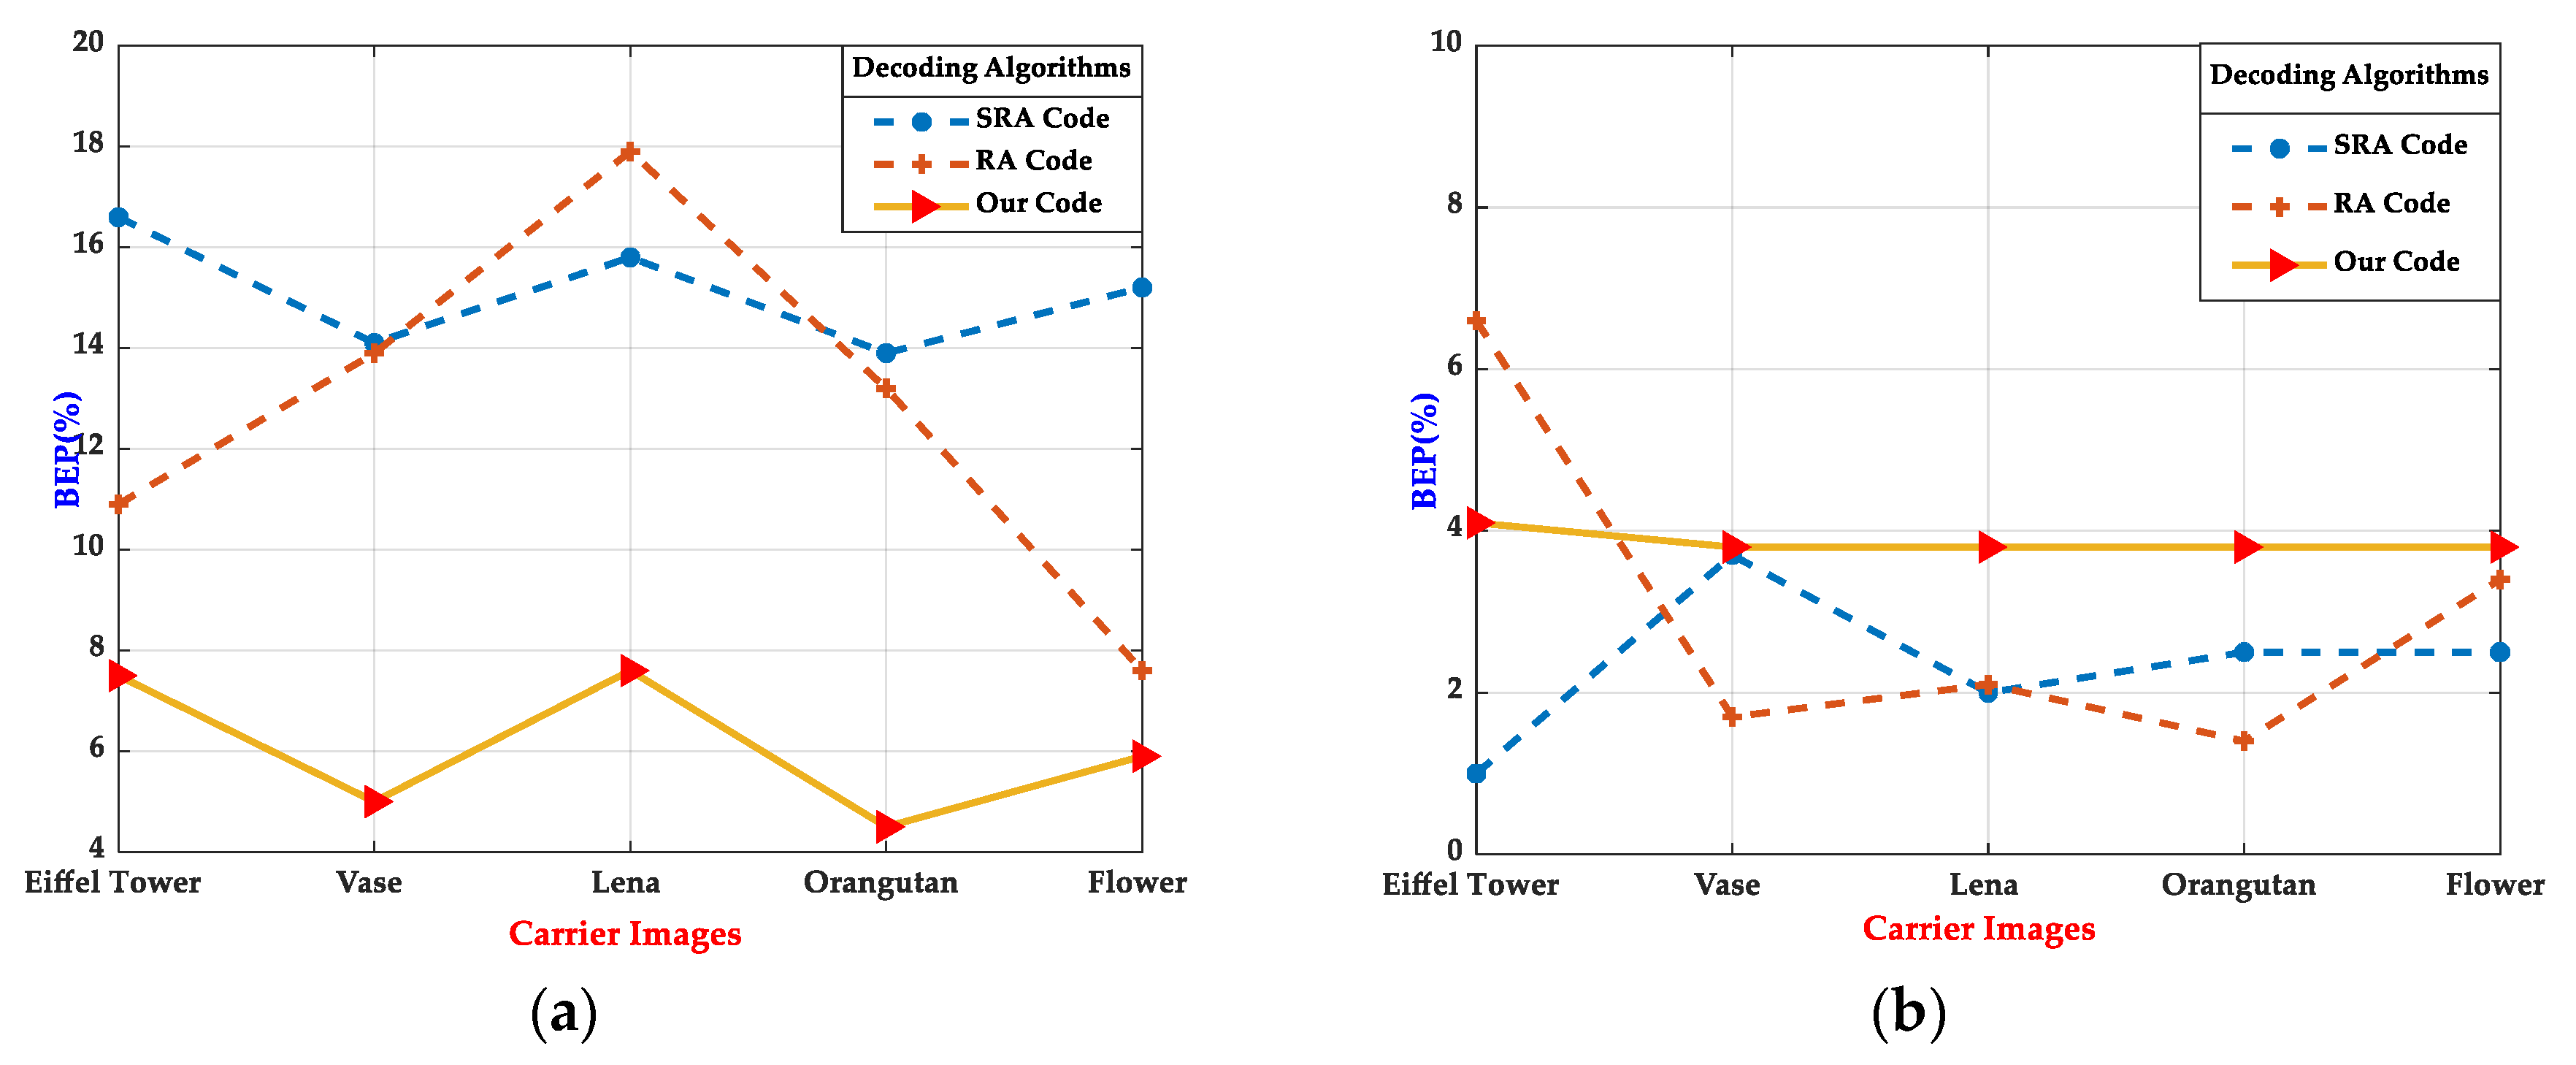
4.2. Decoding Robustness in Sensing Recognition
- Rendering
- -
- Printing: HP Color LaserJet CP5225dn in dpi on paper with 160 g/m2;
- -
- Displaying: The HP Zhan X with retina display at 200 ppi;
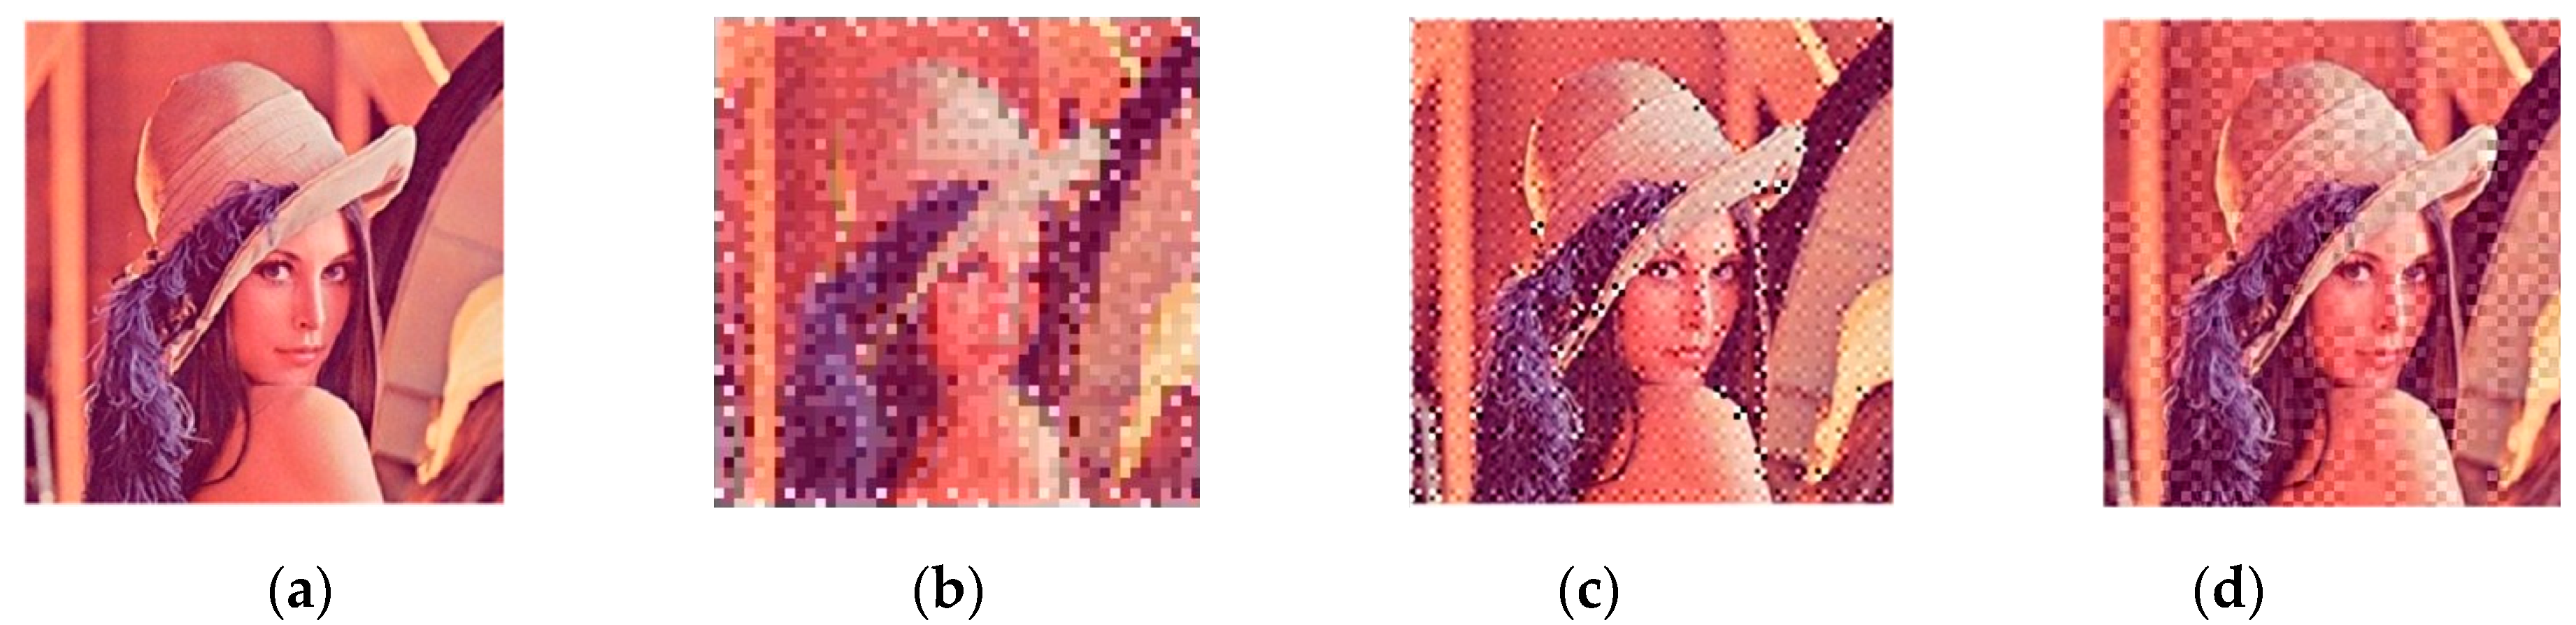
- Carrier images: Five images in Figure 8;
- Barcode design: SRA Code, RA Code and customized 2D barcode;
- Module design: modules;
- Angle: Perspective angle at ±20°;
- Capture angle: Rotate in 0–180°;
- Capture distance: Around 7 cm;
- Decontamination: Blackening random areas of images;
- Light intensity: Indoor lighting with 300–350 lux.
4.3. Experimental Results of Varying Thresholds
5. Discussion
6. Conclusions
Author Contributions
Funding
Acknowledgments
Conflicts of Interest
References
- Focardi, R.; Luccio, F.L.; Wahsheh, H.A. Usable security for QR code. J. Inf. Secur. Appl. 2019, 48, 102369. [Google Scholar] [CrossRef]
- Xu, J.; Zhang, B.; Jia, L.; Fan, Y.; Chen, R.; Zhu, T.; Liu, B. Dual-Mode, Color-Tunable, Lanthanide-Doped Core–Shell Nanoarchitectures for Anti-Counterfeiting Inks and Latent Fingerprint Recognition. ACS Appl. Mater. Interfaces 2019, 11, 35294–35304. [Google Scholar] [CrossRef] [PubMed]
- Wu, J.; Ge, H. Review of Patented Technology of Magnetic Ink Anti-counterfeiting. In Advanced Graphic Communication, Printing and Packaging Technology. Lecture Notes in Electrical Engineering; Zhao, P., Ye, Z., Xu, M., Yang, L., Eds.; Springer: Singapore, 2020. [Google Scholar]
- Xie, S.; Gong, G.; Song, Y.; Tan, H.; Zhang, C.; Li, N.; Zhang, Y.; Xu, L.; Xu, J.; Zheng, J. Design of novel lanthanide-doped core–shell nanocrystals with dual up-conversion and down-conversion luminescence for anti-counterfeiting printing. Dalton Trans. 2019, 48, 6971–6983. [Google Scholar] [CrossRef] [PubMed]
- Sun, W.; Zhu, X.; Zhou, T.; Su, Y.; Mo, B. Application of Blockchain and RFID in Anti-counterfeiting Traceability of Liquor. Proceedings of 2019 IEEE 5th International Conference on Computer and Communications (ICCC), Chengdu, China, 6–9 December 2019. [Google Scholar]
- Shin, H.J.; Lim, M.-C.; Park, K.; Kim, S.-H.; Choi, S.-W.; Ok, G. Invisible security printing on photoresist polymer readable by terahertz spectroscopy. Sensors 2017, 17, 2825. [Google Scholar] [CrossRef]
- Zhu, F.; Li, P.; Xu, H.; Wang, R. A lightweight RFID mutual authentication protocol with PUF. Sensors 2019, 19, 2957. [Google Scholar] [CrossRef] [PubMed]
- Savaglio, C.; Ganzha, M.; Paprzycki, M.; Bădică, C.; Ivanović, M.; Fortino, G. Agent-based Internet of Things: State-of-the-art and research challenges. Future Gener. Comput. Syst. 2020, 102, 1038–1053. [Google Scholar] [CrossRef]
- Ahuja, R. Mobile payments for conducting M-Commerce. In Mobile Commerce: Concepts, Methodologies, Tools, and Applications; Khosrow-Pour, M., Clarke, S., Jennex, M.E., Becker, A., Anttiroiko, A.-V., Eds.; IGI Global: Hershey, PA, USA, 2018. [Google Scholar]
- Zhang, P. Why QR Code Payment Develop Well in China. Research Topics in HCI Coursework, University of Birmingham. 2018. Available online: https://pdfs.semanticscholar.org/b428/f1068de064958d55470a063c5da3eb90a8d6.pdf (accessed on 27 March 2020).
- Banu, A.; Ganagavalli, K.; Ramsundar, G. QR Code Based Shopping with Secure Checkout for Smartphones. J. Comput. Theor. Nanosci. 2018, 15, 1545–1550. [Google Scholar] [CrossRef]
- Huang, P.-C.; Li, Y.-H.; Chang, C.-C.; Liu, Y. Efficient QR code authentication mechanism based on Sudoku. Multimed. Tools Appl. 2019, 78, 26023–26045. [Google Scholar] [CrossRef]
- Ahmed, B.; Al-Qaraawi, S. Design and Implementation of e-Shopping System Using QR Code and Smart Mobile Phone. IRAQI J. Comput. Commun. Control. Syst. Eng. 2019, 19, 56–64. [Google Scholar]
- Chen, R.; Yu, Y.; Xu, X.; Wang, L.; Zhao, H.; Tan, H.-Z. Adaptive Binarization of QR Code Images for Fast Automatic Sorting in Warehouse Systems. Sensors 2019, 19, 5466. [Google Scholar] [CrossRef]
- Gligoric, N.; Krco, S.; Hakola, L.; Vehmas, K.; De, S.; Moessner, K.; Jansson, K.; Polenz, I.; Van Kranenburg, R. Smarttags: IoT product passport for circular economy based on printed sensors and unique item-level identifiers. Sensors 2019, 19, 586. [Google Scholar] [CrossRef] [PubMed]
- Mahmud, M.; Kaiser, M.S.; Rahman, M.M.; Rahman, M.A.; Shabut, A.; Al-Mamun, S.; Hussain, A. A brain-inspired trust management model to assure security in a cloud based IoT framework for neuroscience applications. Cogn. Comput. 2018, 10, 864–873. [Google Scholar] [CrossRef]
- Ladeira, W.J.; Nardi, V.A.M.; Santini, F.D.O.; Jardim, W.C. Factors influencing visual attention: A meta-analysis. J. Mark. Manag. 2019, 35, 1710–1740. [Google Scholar] [CrossRef]
- Yan, Y.; Ren, J.; Sun, G.; Zhao, H.; Han, J.; Li, X.; Marshall, S.; Zhan, J. Unsupervised image saliency detection with Gestalt-laws guided optimization and visual attention based refinement. Pattern Recognit. 2018, 79, 65–78. [Google Scholar] [CrossRef]
- Zhan, J.; Zhao, H.; Zheng, P.; Wu, H.; Wang, L. Salient Superpixel Visual Tracking with Graph Model and Iterative Segmentation. Cogn. Comput. 2019, 1–12. [Google Scholar] [CrossRef]
- Baharav, Z.; Kakarala, R. Visually significant QR codes: Image blending and statistical analysis. Proceedings of 2013 IEEE International Conference on Multimedia and Expo (ICME), San Jose, CA, USA, 15–19 July 2013. [Google Scholar]
- Chu, H.-K.; Chang, C.-S.; Lee, R.-R.; Mitra, N.J. Halftone QR codes. ACM Trans Graph. (TOG) 2013, 32, 1–8. [Google Scholar] [CrossRef]
- Visual QR Code Generator. Available online: http://www.visualead.com/ (accessed on 1 June 2020).
- Friedman, I.; Alva, N.; Peled, U. Readable Matrix Code. U.S. Patent US8978989B2, 17 March 2015. [Google Scholar]
- Samretwit, D.; Wakahara, T. Measurement of reading characteristics of multiplexed image in QR code. In Proceedings of the 2011 Third International Conference on Intelligent Networking and Collaborative Systems, Fukuoka, Japan, 30 November–2 December 2011. [Google Scholar]
- Garateguy, G.J.; Arce, G.R.; Lau, D.L.; Villarreal, O.P. QR images: Optimized image embedding in QR codes. IEEE Trans. image Process. 2014, 23, 2842–2853. [Google Scholar] [CrossRef]
- Bresenham, J.E. Algorithm for computer control of a digital plotter. IBM Syst. J. 1965, 4, 25–30. [Google Scholar] [CrossRef]
- Otsu, N. A threshold selection method from gray-level histograms. IEEE Trans. Syst. Man Cybern. 1979, 9, 62–66. [Google Scholar] [CrossRef]
- Lee, Y.-L.; Tsai, W.-H. A new data transfer method via signal-rich-art code images captured by mobile devices. IEEE Trans. Circuits Syst. Video Technol. 2014, 25, 688–700. [Google Scholar]
- Lin, S.-S.; Hu, M.-C.; Lee, C.-H.; Lee, T.-Y. Efficient QR code beautification with high quality visual content. IEEE Trans. Multimed. 2015, 17, 1515–1524. [Google Scholar] [CrossRef]
- Chen, C.; Huang, W.; Zhou, B.; Liu, C.; Mow, W.H. PiCode: A new picture-embedding 2D barcode. IEEE Trans. Image Process. 2016, 25, 3444–3458. [Google Scholar] [CrossRef] [PubMed]
- Chen, C.; Zhou, B.; Mow, W.H. RA code: A robust and aesthetic code for resolution-constrained applications. IEEE Trans. Circuits Syst. Video Technol. 2017, 28, 3300–3312. [Google Scholar] [CrossRef]
- ZXing Open-Source Kit. Available online: https://repo1.maven.org/maven2/com/google/zxing/core/3.4.0/ (accessed on 18 May 2020).
- Wang, Z.; Bovik, A.C.; Sheikh, H.R.; Simoncelli, E.P. Image quality assessment: From error visibility to structural similarity. IEEE Trans. Image Process. 2004, 13, 600–612. [Google Scholar] [CrossRef]


| Embedded Image | SRA Code [28] | RA Code [31] | Our Code | |||
|---|---|---|---|---|---|---|
| Print (Time/ms) | Digital (Time/ms) | Print (Time/ms) | Digital (Time/ms) | Print (Time/ms) | Digital (Time/ms) | |
| Eiffel Tower | 95.1 | 81.4 | 4.9 | 4.2 | 3.8 | 3.6 |
| Vase | 90.3 | 81.5 | 4.6 | 4.4 | 3.6 | 3.5 |
| Lena | 89.7 | 83.1 | 4.8 | 4.1 | 3.7 | 3.7 |
| Orangutan | 81.3 | 80.4 | 4.6 | 3.9 | 3.9 | 3.8 |
| Flower | 93.3 | 89.1 | 4.8 | 3.8 | 3.5 | 3.4 |
© 2020 by the authors. Licensee MDPI, Basel, Switzerland. This article is an open access article distributed under the terms and conditions of the Creative Commons Attribution (CC BY) license (http://creativecommons.org/licenses/by/4.0/).
Share and Cite
Chen, R.; Yu, Y.; Chen, J.; Zhong, Y.; Zhao, H.; Hussain, A.; Tan, H.-Z. Customized 2D Barcode Sensing for Anti-Counterfeiting Application in Smart IoT with Fast Encoding and Information Hiding. Sensors 2020, 20, 4926. https://doi.org/10.3390/s20174926
Chen R, Yu Y, Chen J, Zhong Y, Zhao H, Hussain A, Tan H-Z. Customized 2D Barcode Sensing for Anti-Counterfeiting Application in Smart IoT with Fast Encoding and Information Hiding. Sensors. 2020; 20(17):4926. https://doi.org/10.3390/s20174926
Chicago/Turabian StyleChen, Rongjun, Yongxing Yu, Jiangtao Chen, Yongbin Zhong, Huimin Zhao, Amir Hussain, and Hong-Zhou Tan. 2020. "Customized 2D Barcode Sensing for Anti-Counterfeiting Application in Smart IoT with Fast Encoding and Information Hiding" Sensors 20, no. 17: 4926. https://doi.org/10.3390/s20174926
APA StyleChen, R., Yu, Y., Chen, J., Zhong, Y., Zhao, H., Hussain, A., & Tan, H.-Z. (2020). Customized 2D Barcode Sensing for Anti-Counterfeiting Application in Smart IoT with Fast Encoding and Information Hiding. Sensors, 20(17), 4926. https://doi.org/10.3390/s20174926