A Novel Target Detection Method of the Unmanned Surface Vehicle under All-Weather Conditions with an Improved YOLOV3

 ,
, 
 ,
,
Abstract
:1. Introduction
2. Image Data Pre-Processing
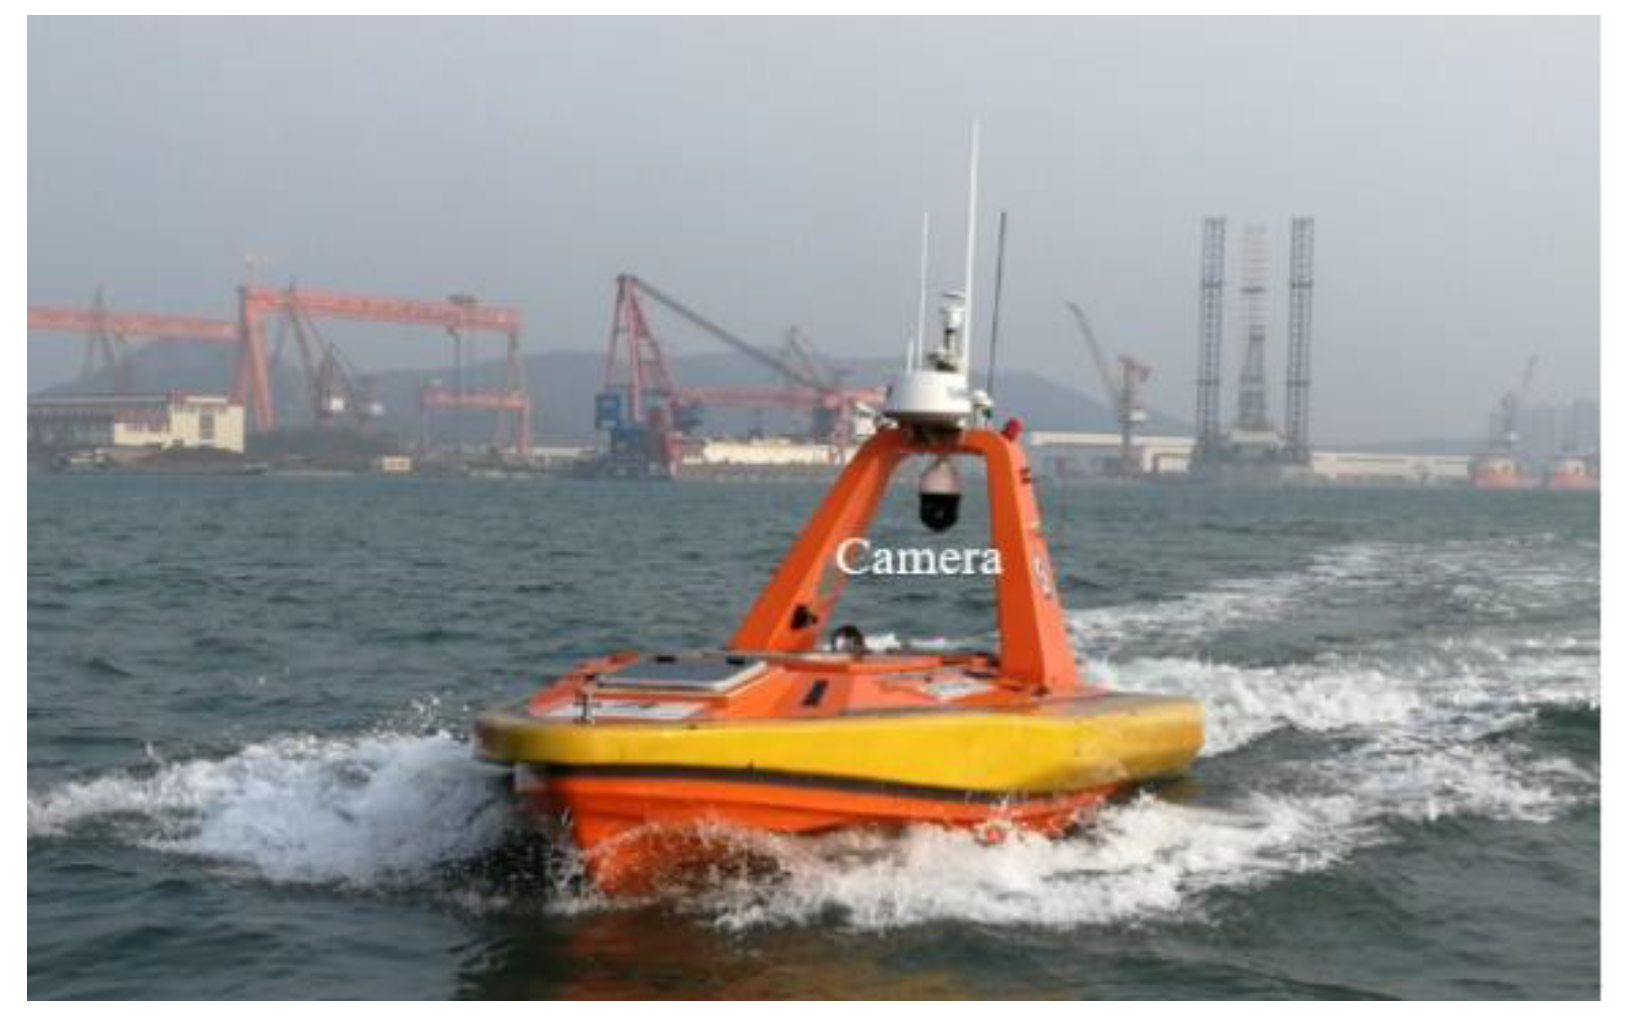
2.1. Image Data Acquistion
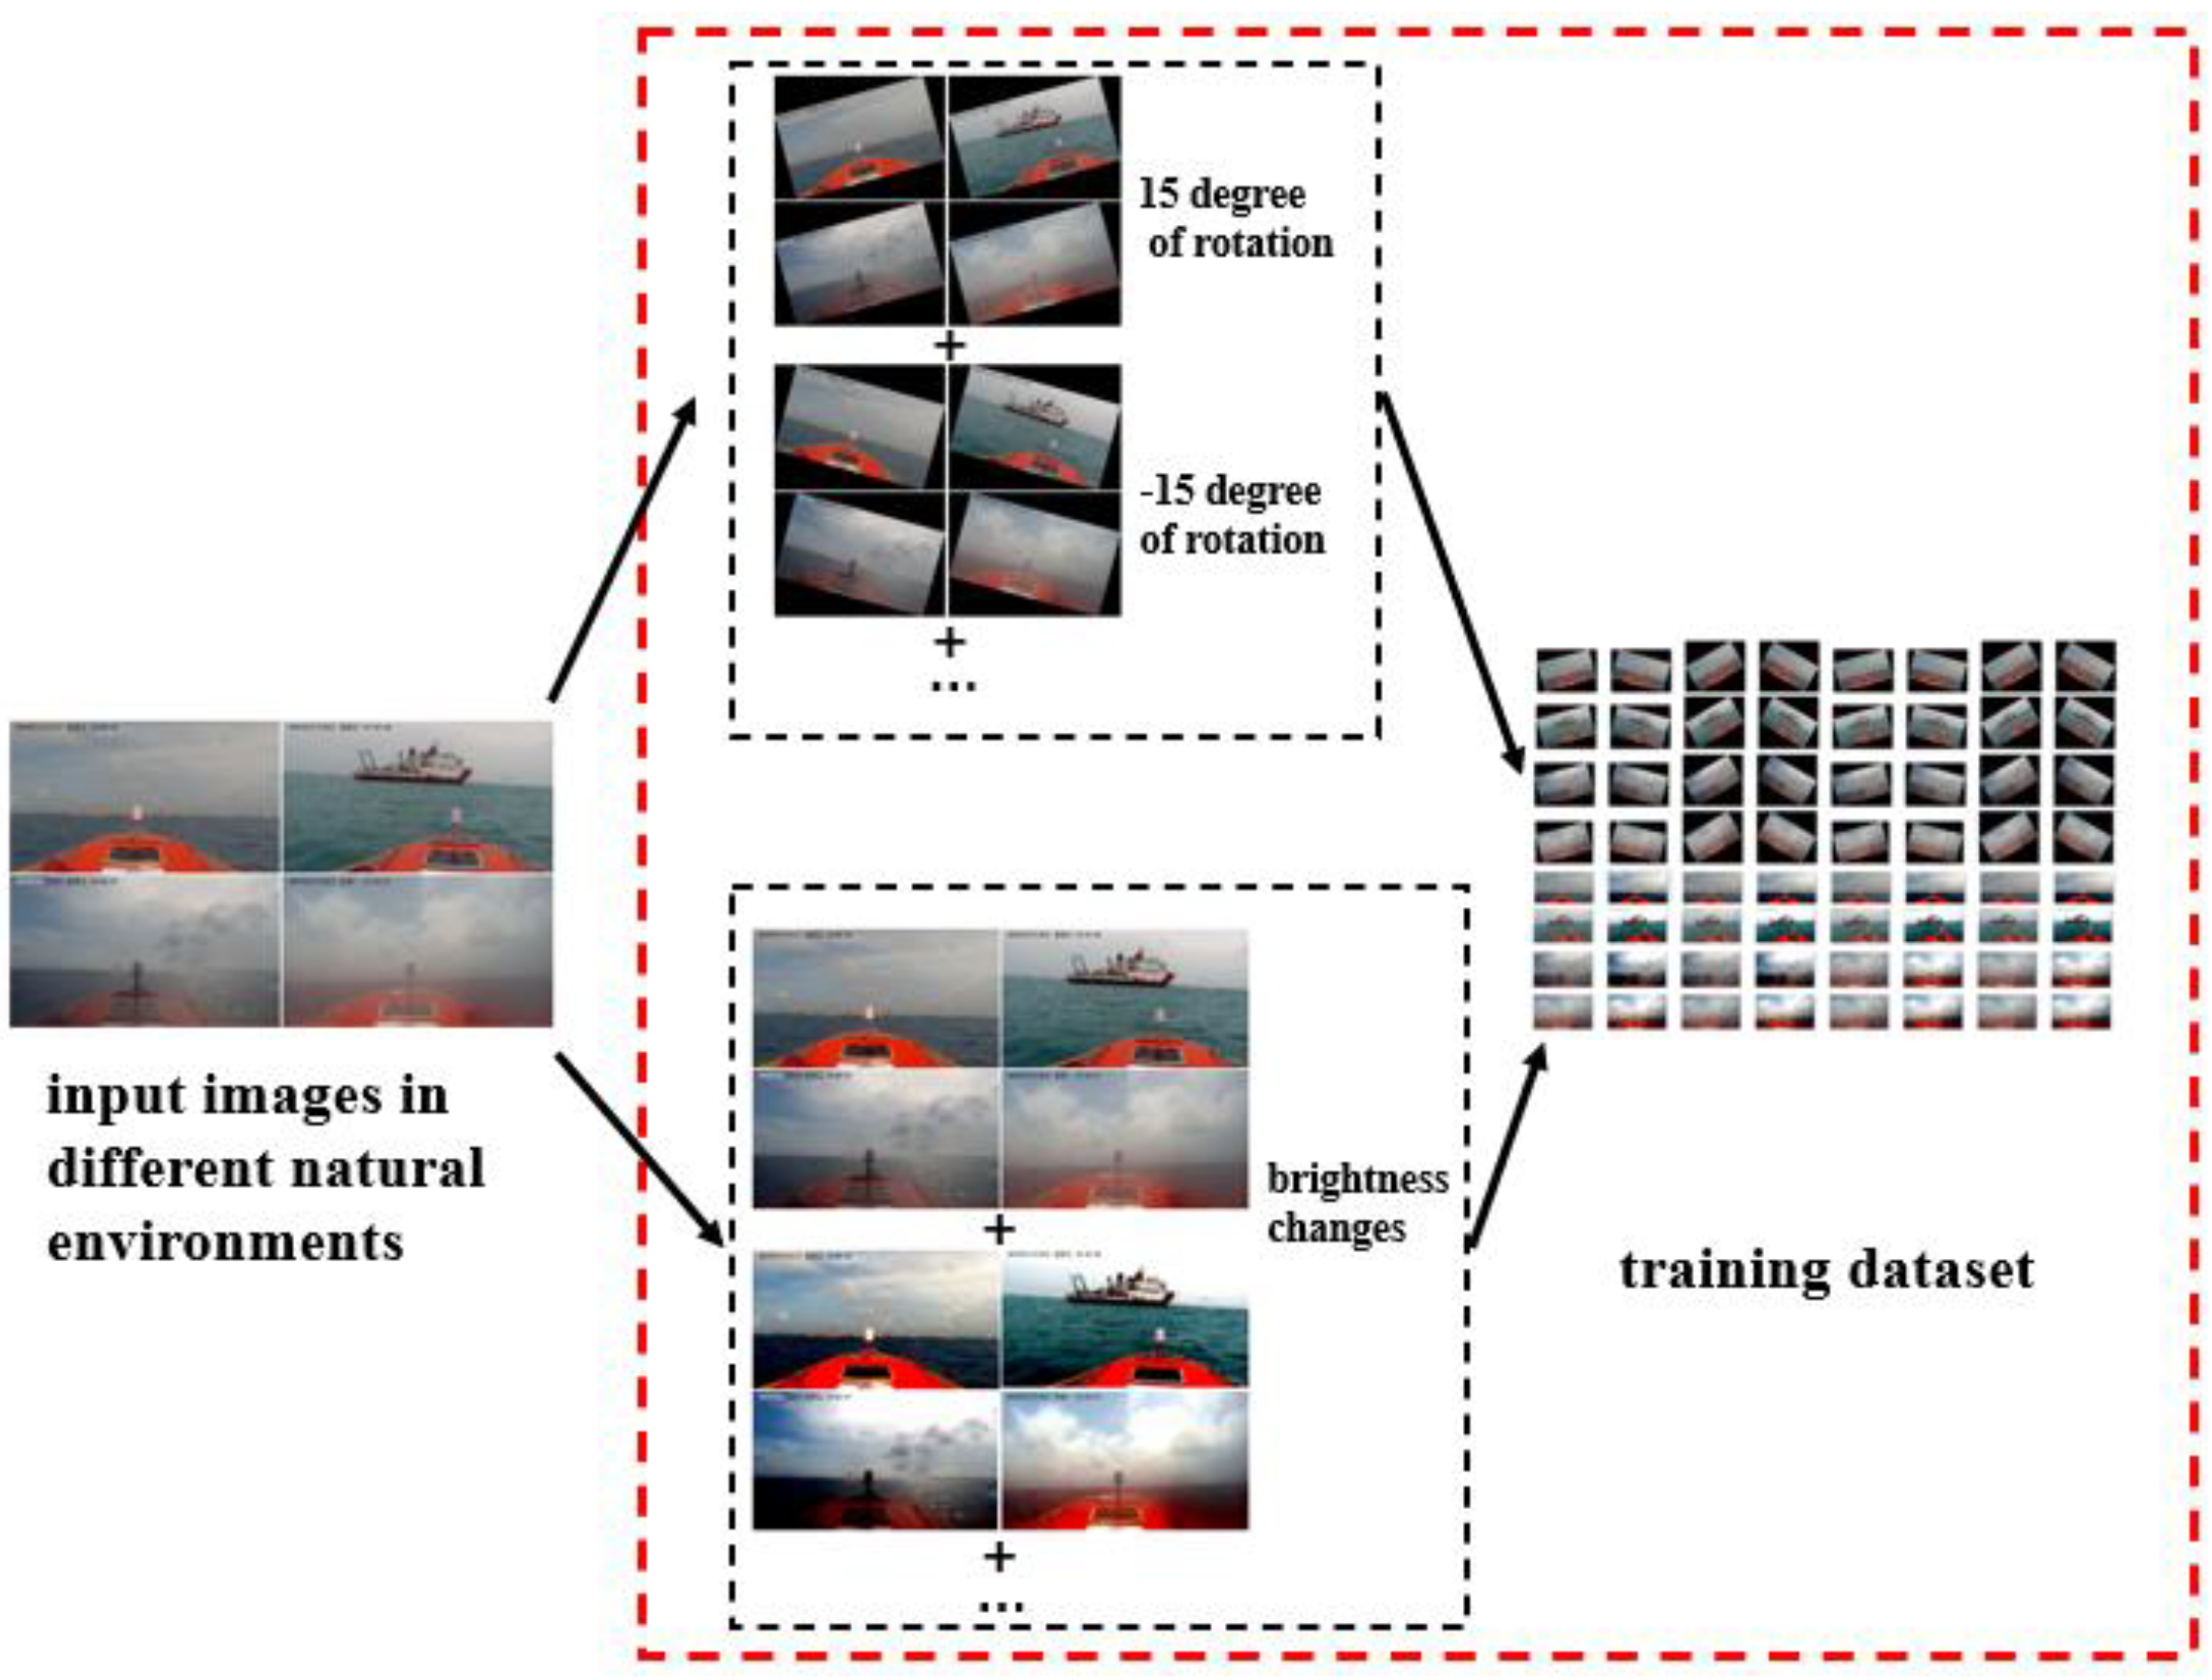
2.2. Image Data Augmentation
2.2.1. Data Augmentation: Brightness
2.2.2. Data Augmentation: Rotation
2.3. Image Annotation
3. Methodologies
3.1. YOLOV3
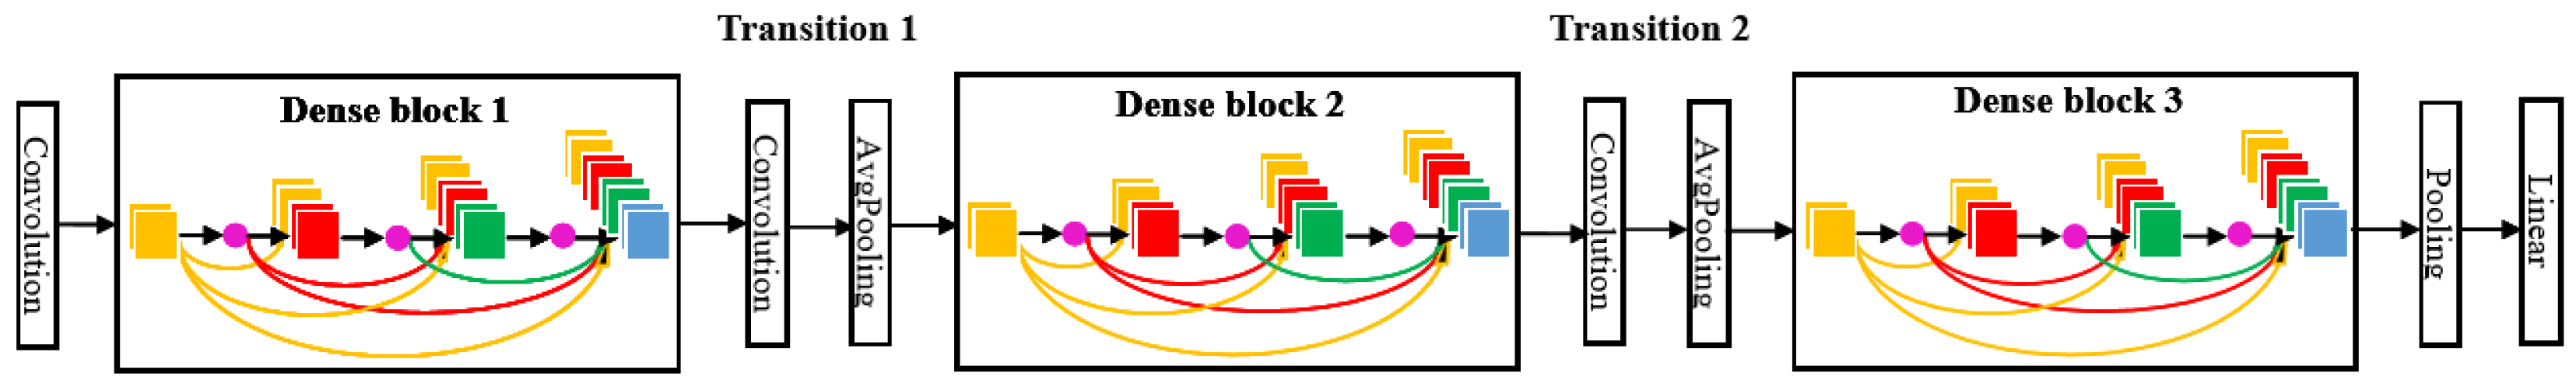
3.2. DenseNet
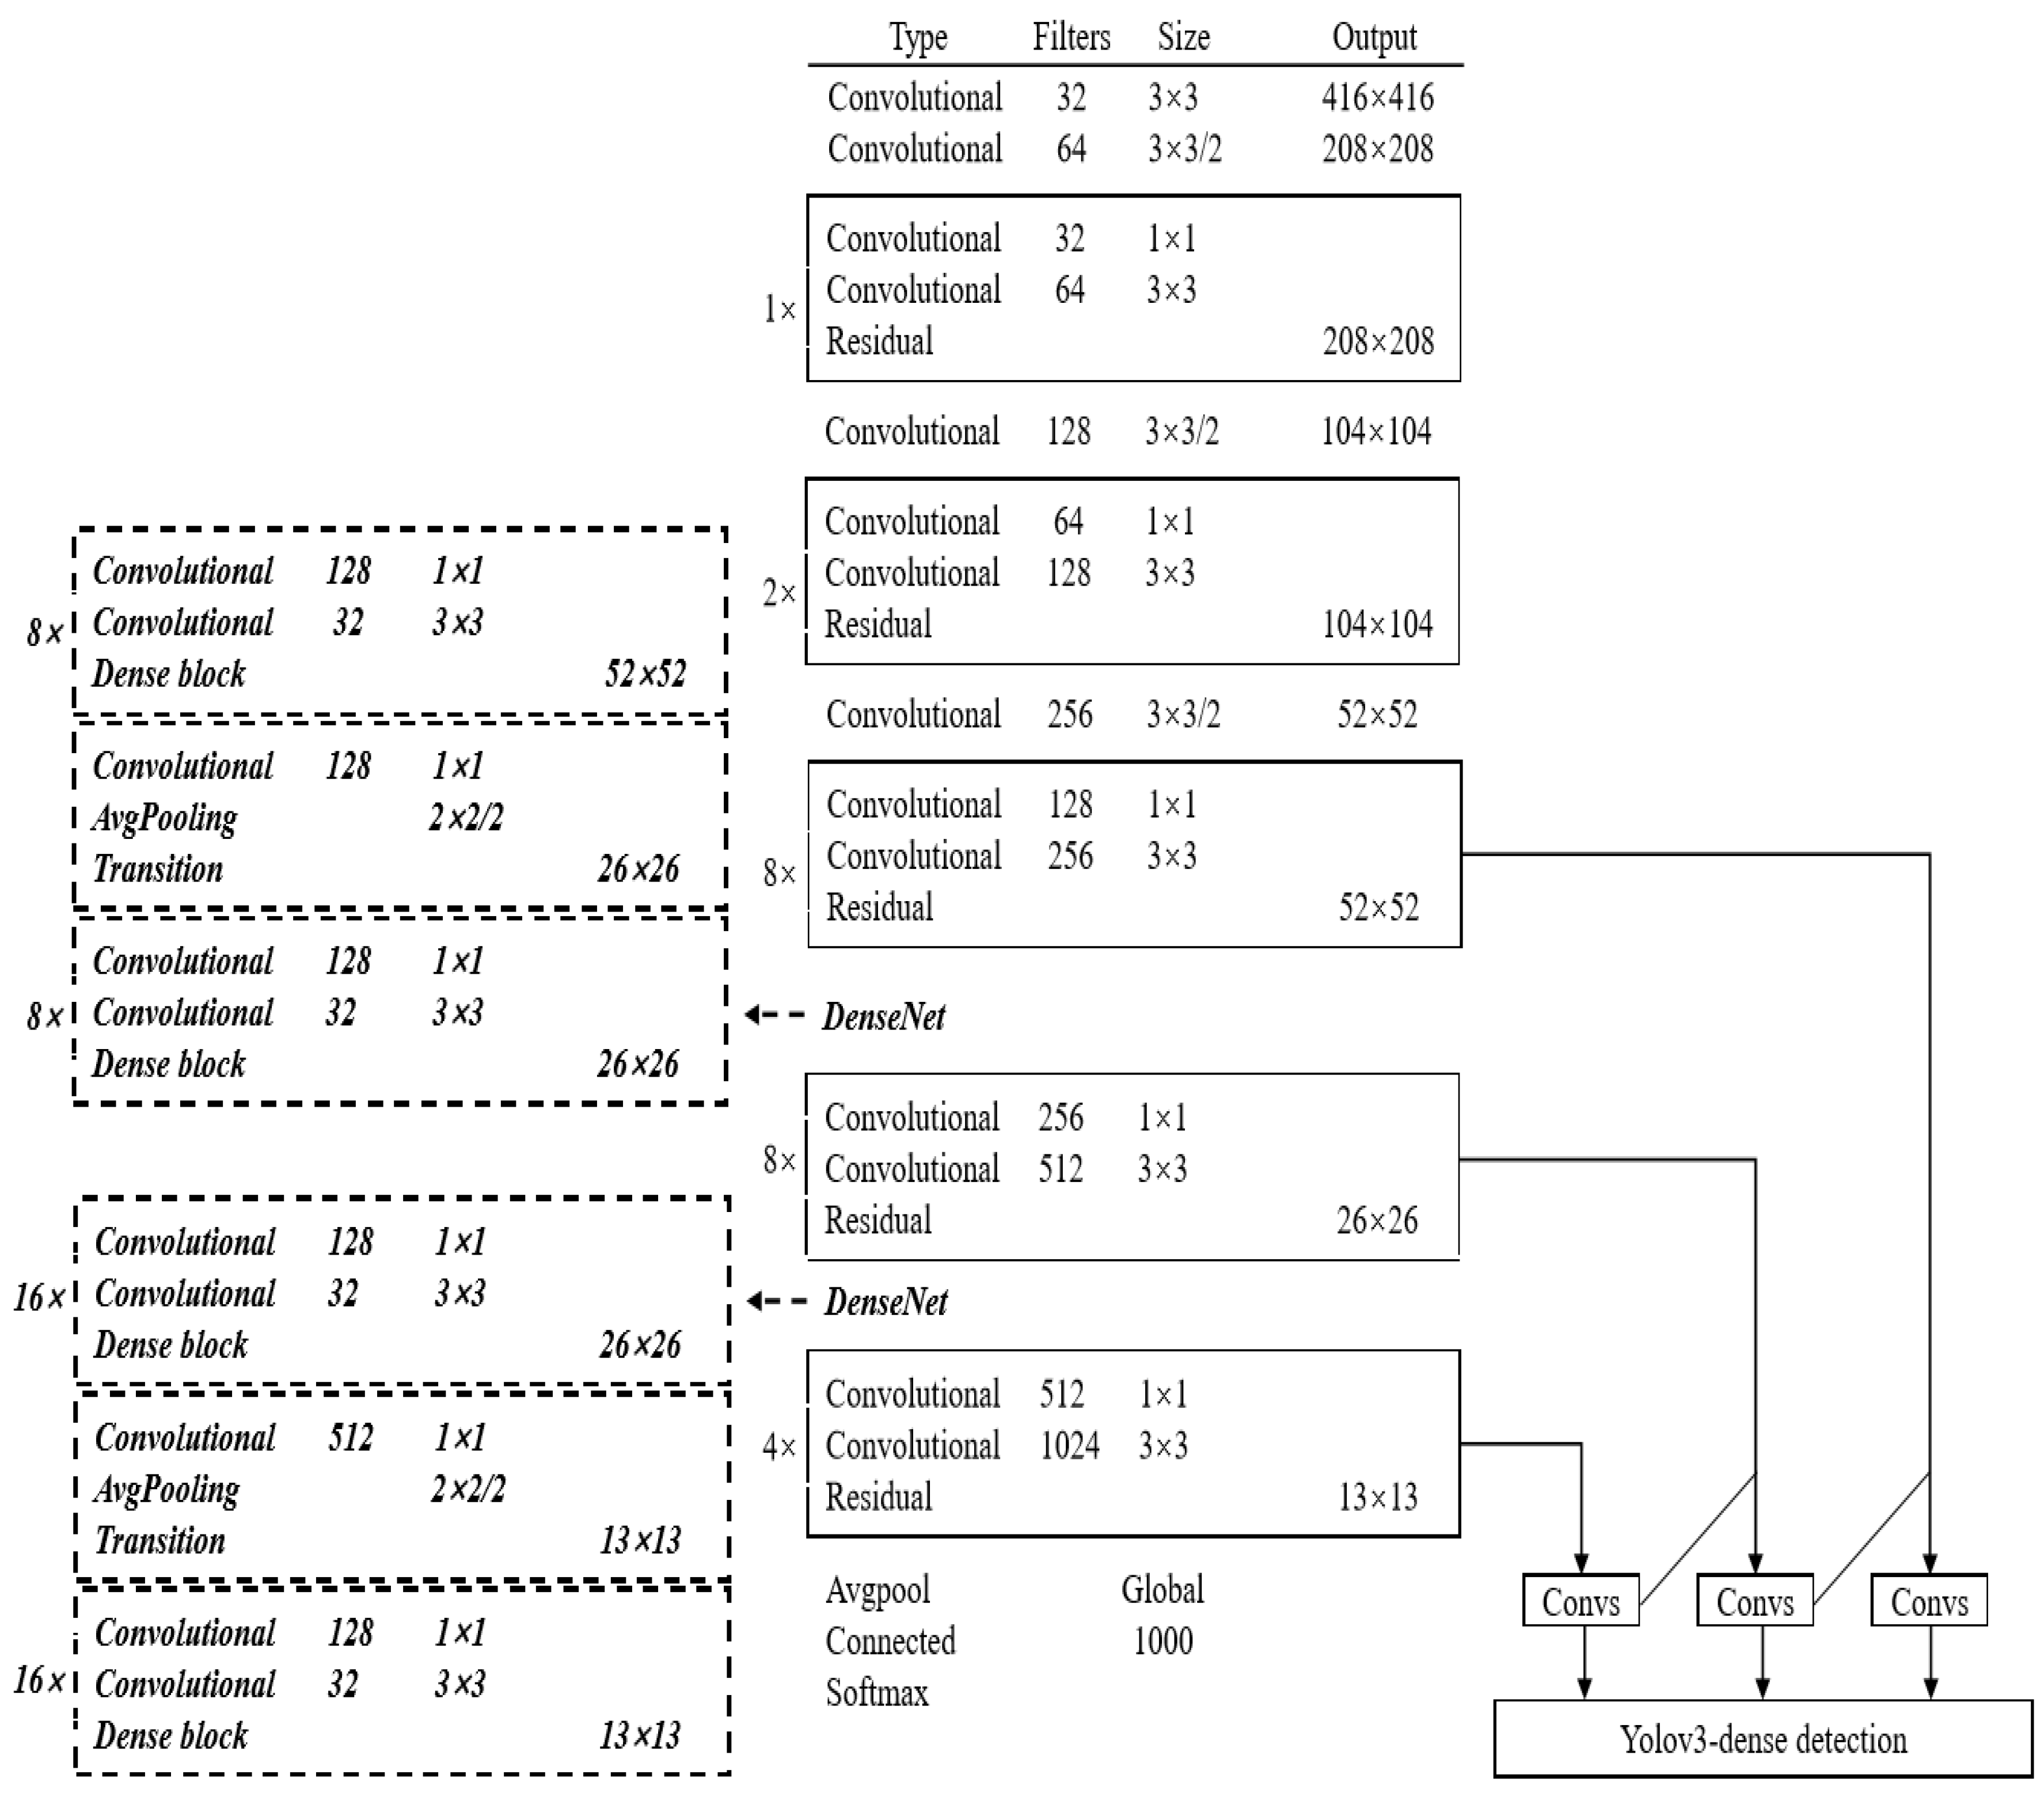
3.3. Proposed Method
4. Performance Metrics
4.1. Precision, Recall, and F-Measure
4.2. Average Detection Time Cost
5. Experimental Results and Discussions
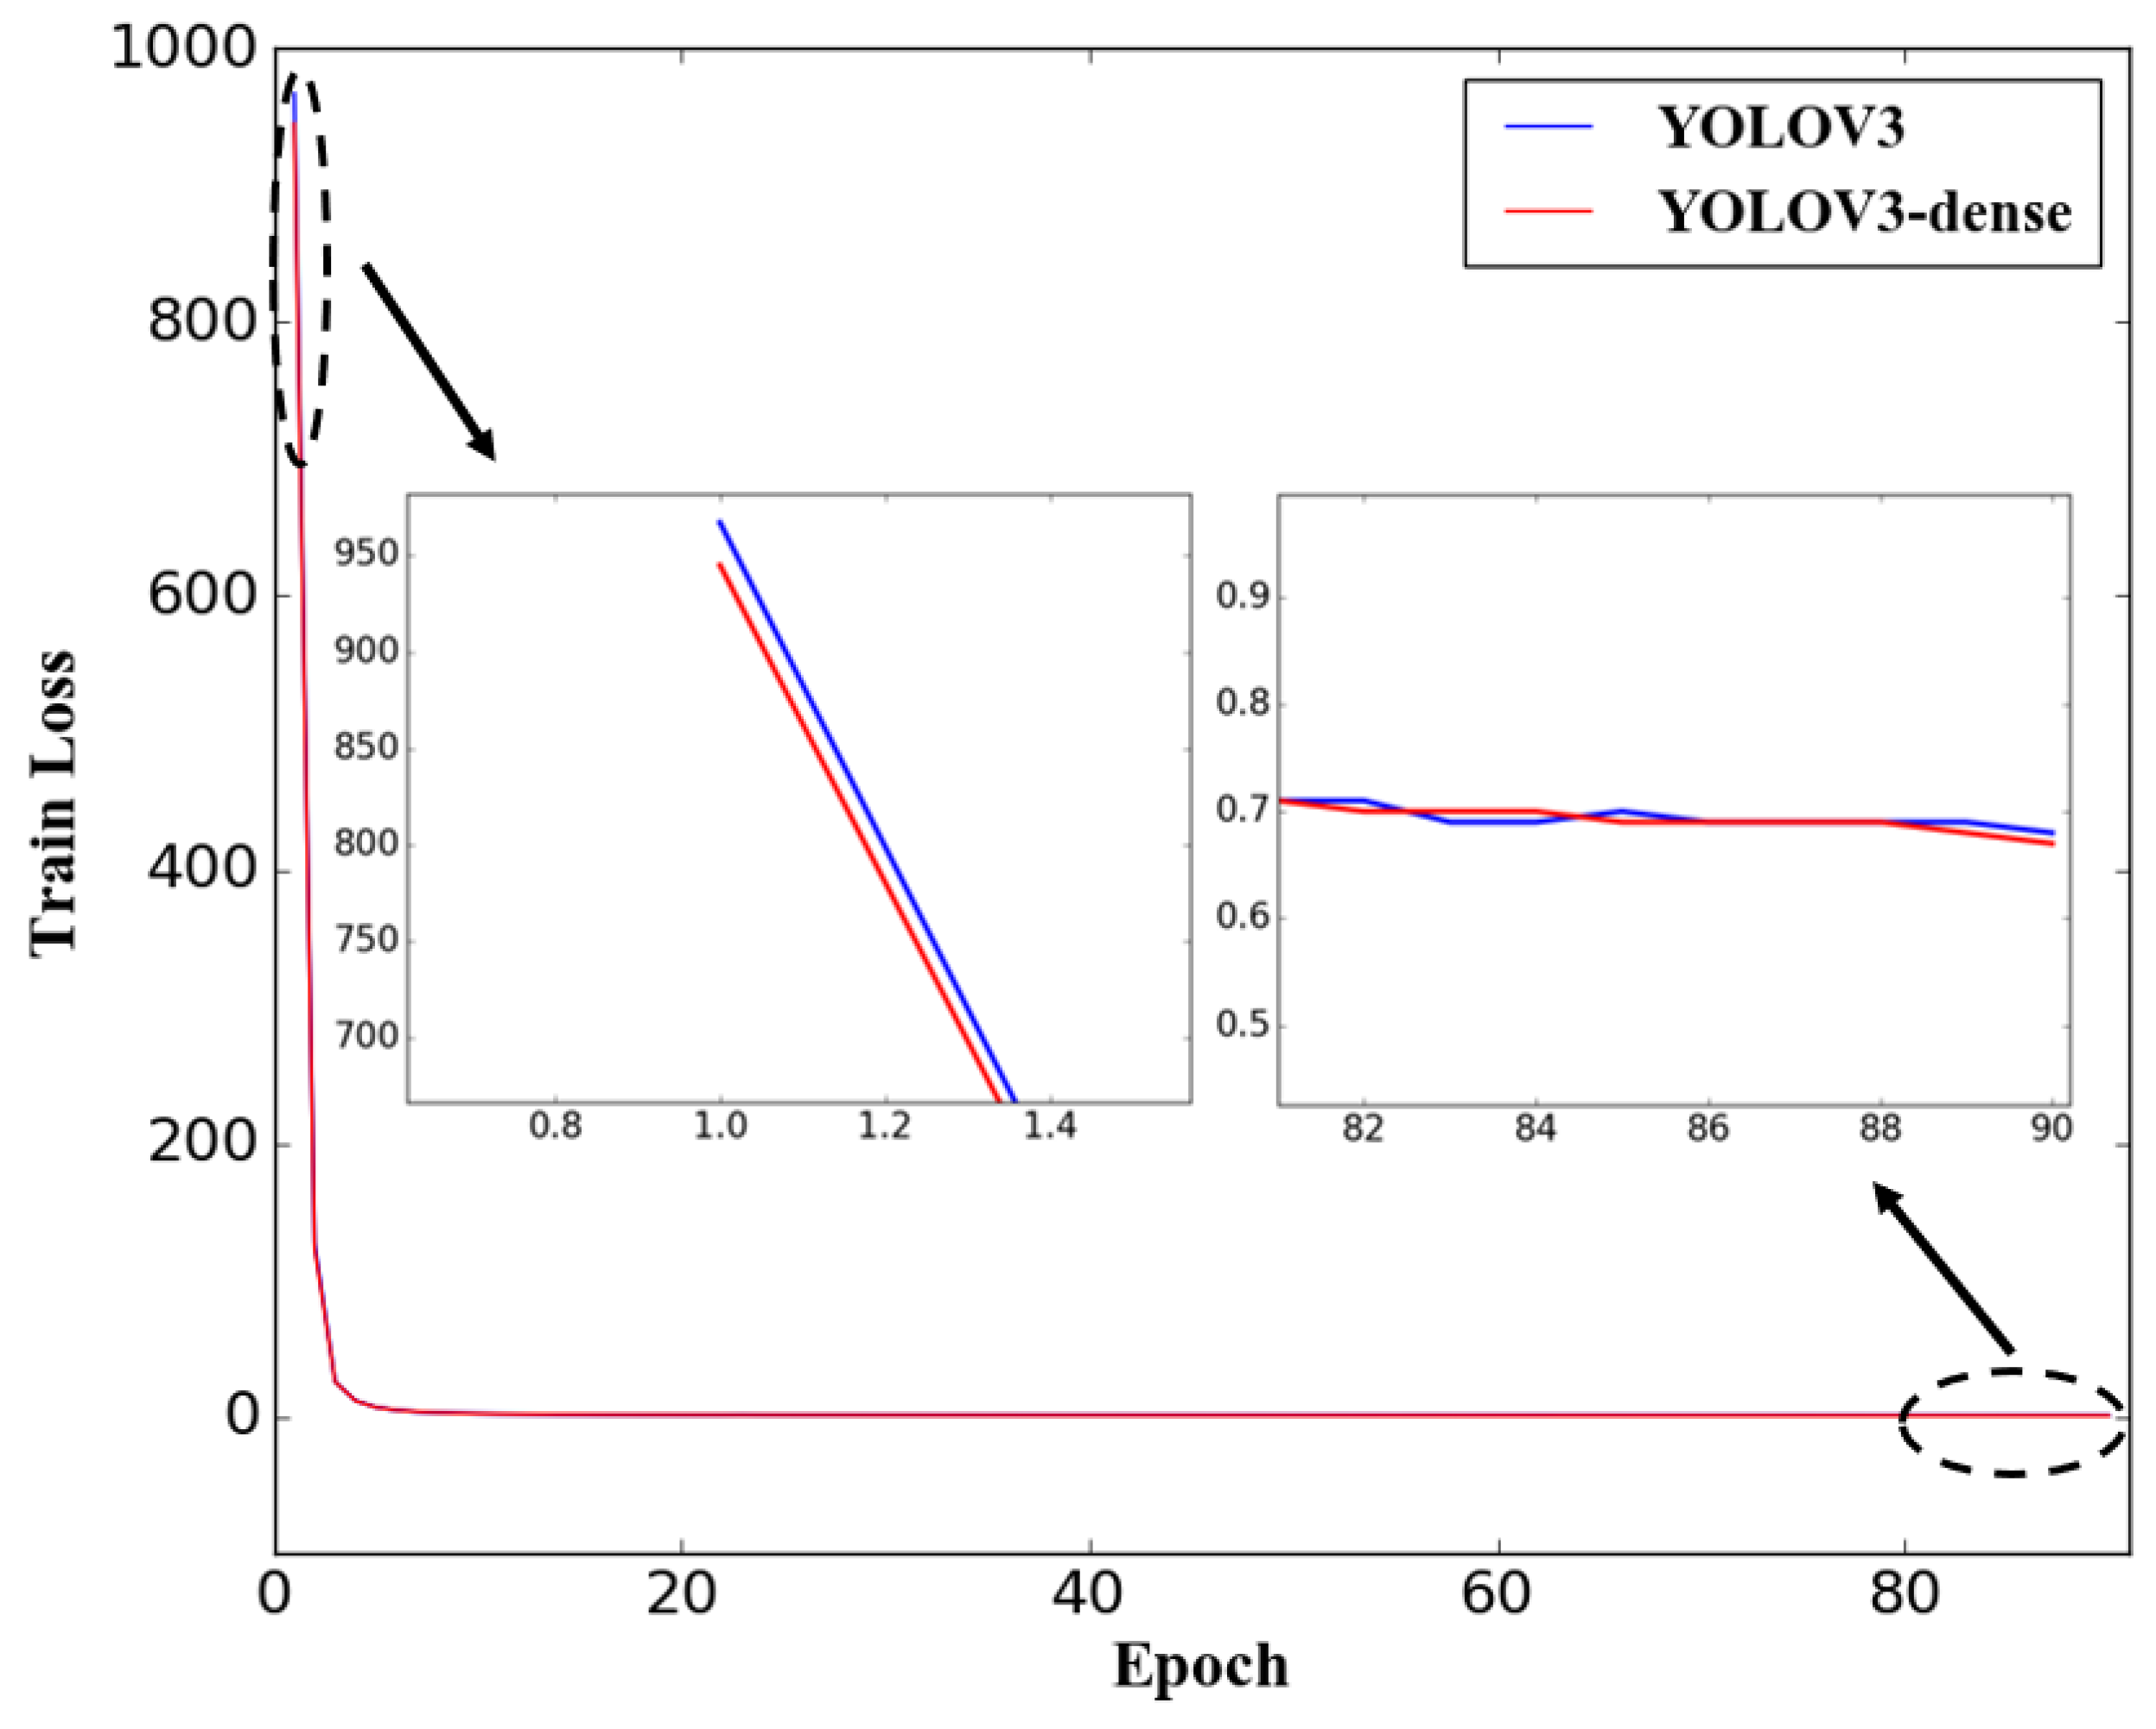
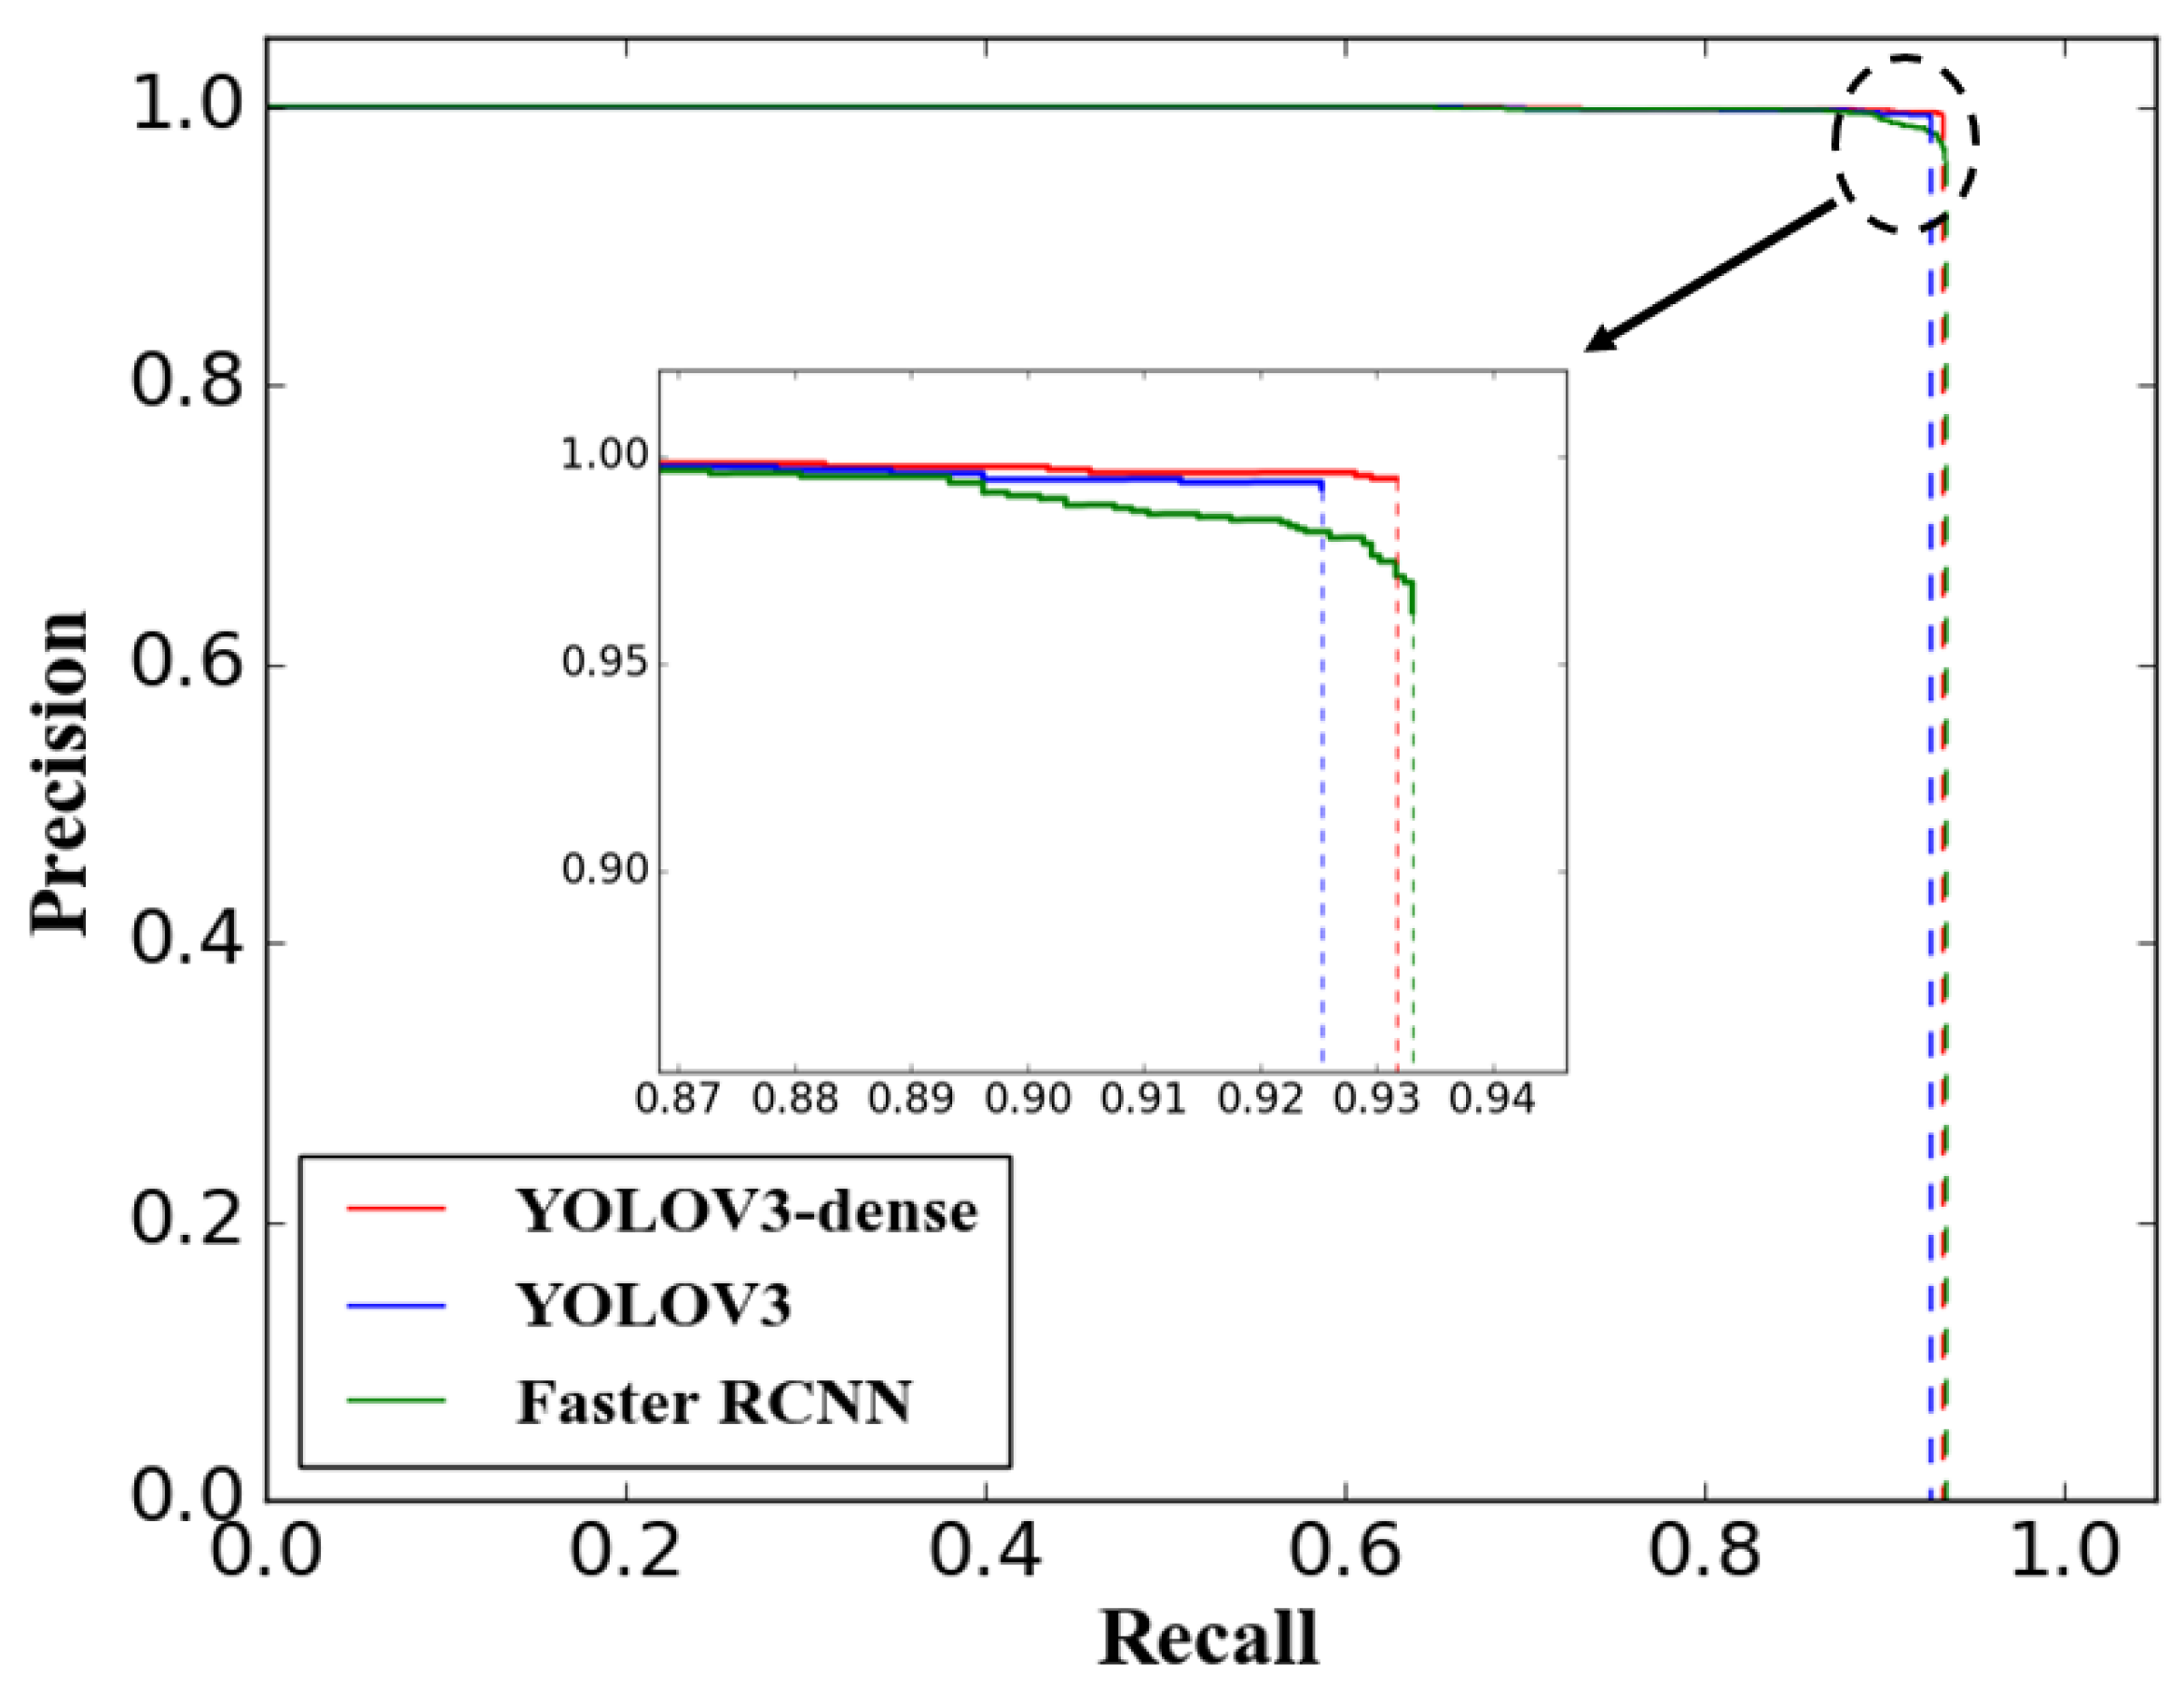
5.1. Detection Performance Evaluation
5.2. Real-Time Performance Evaluation
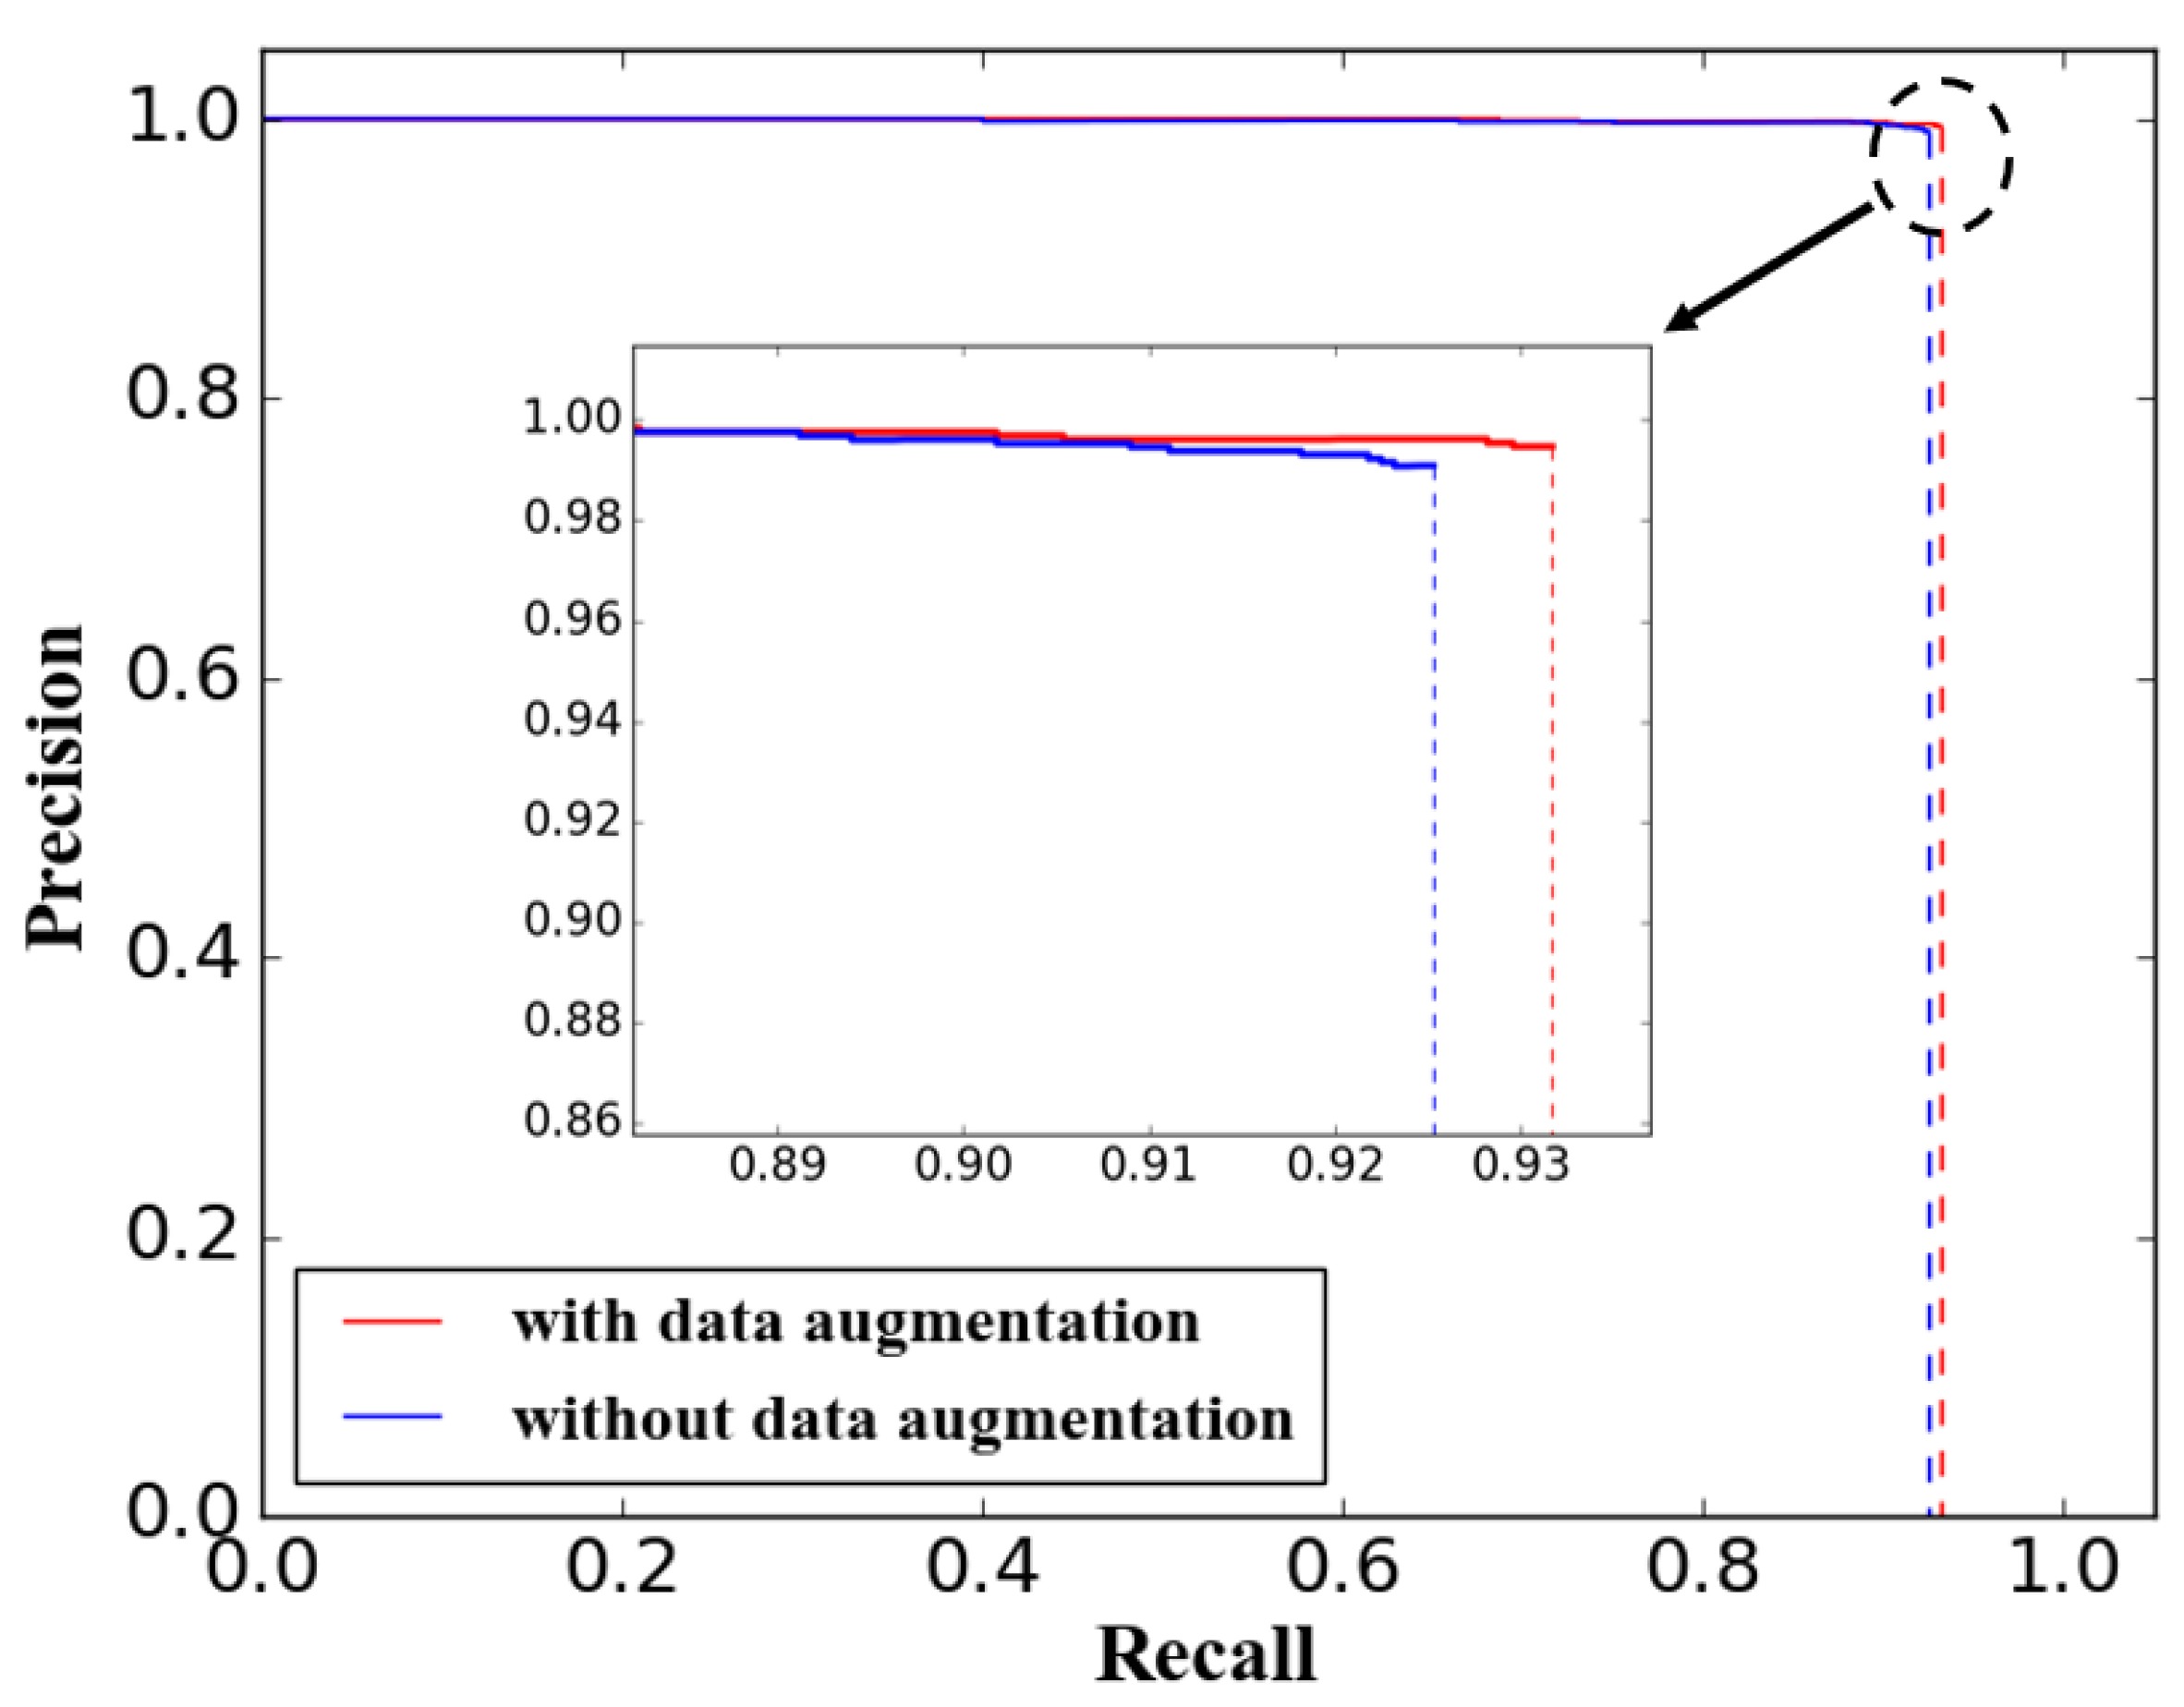
5.3. Performance of Data Augmentation
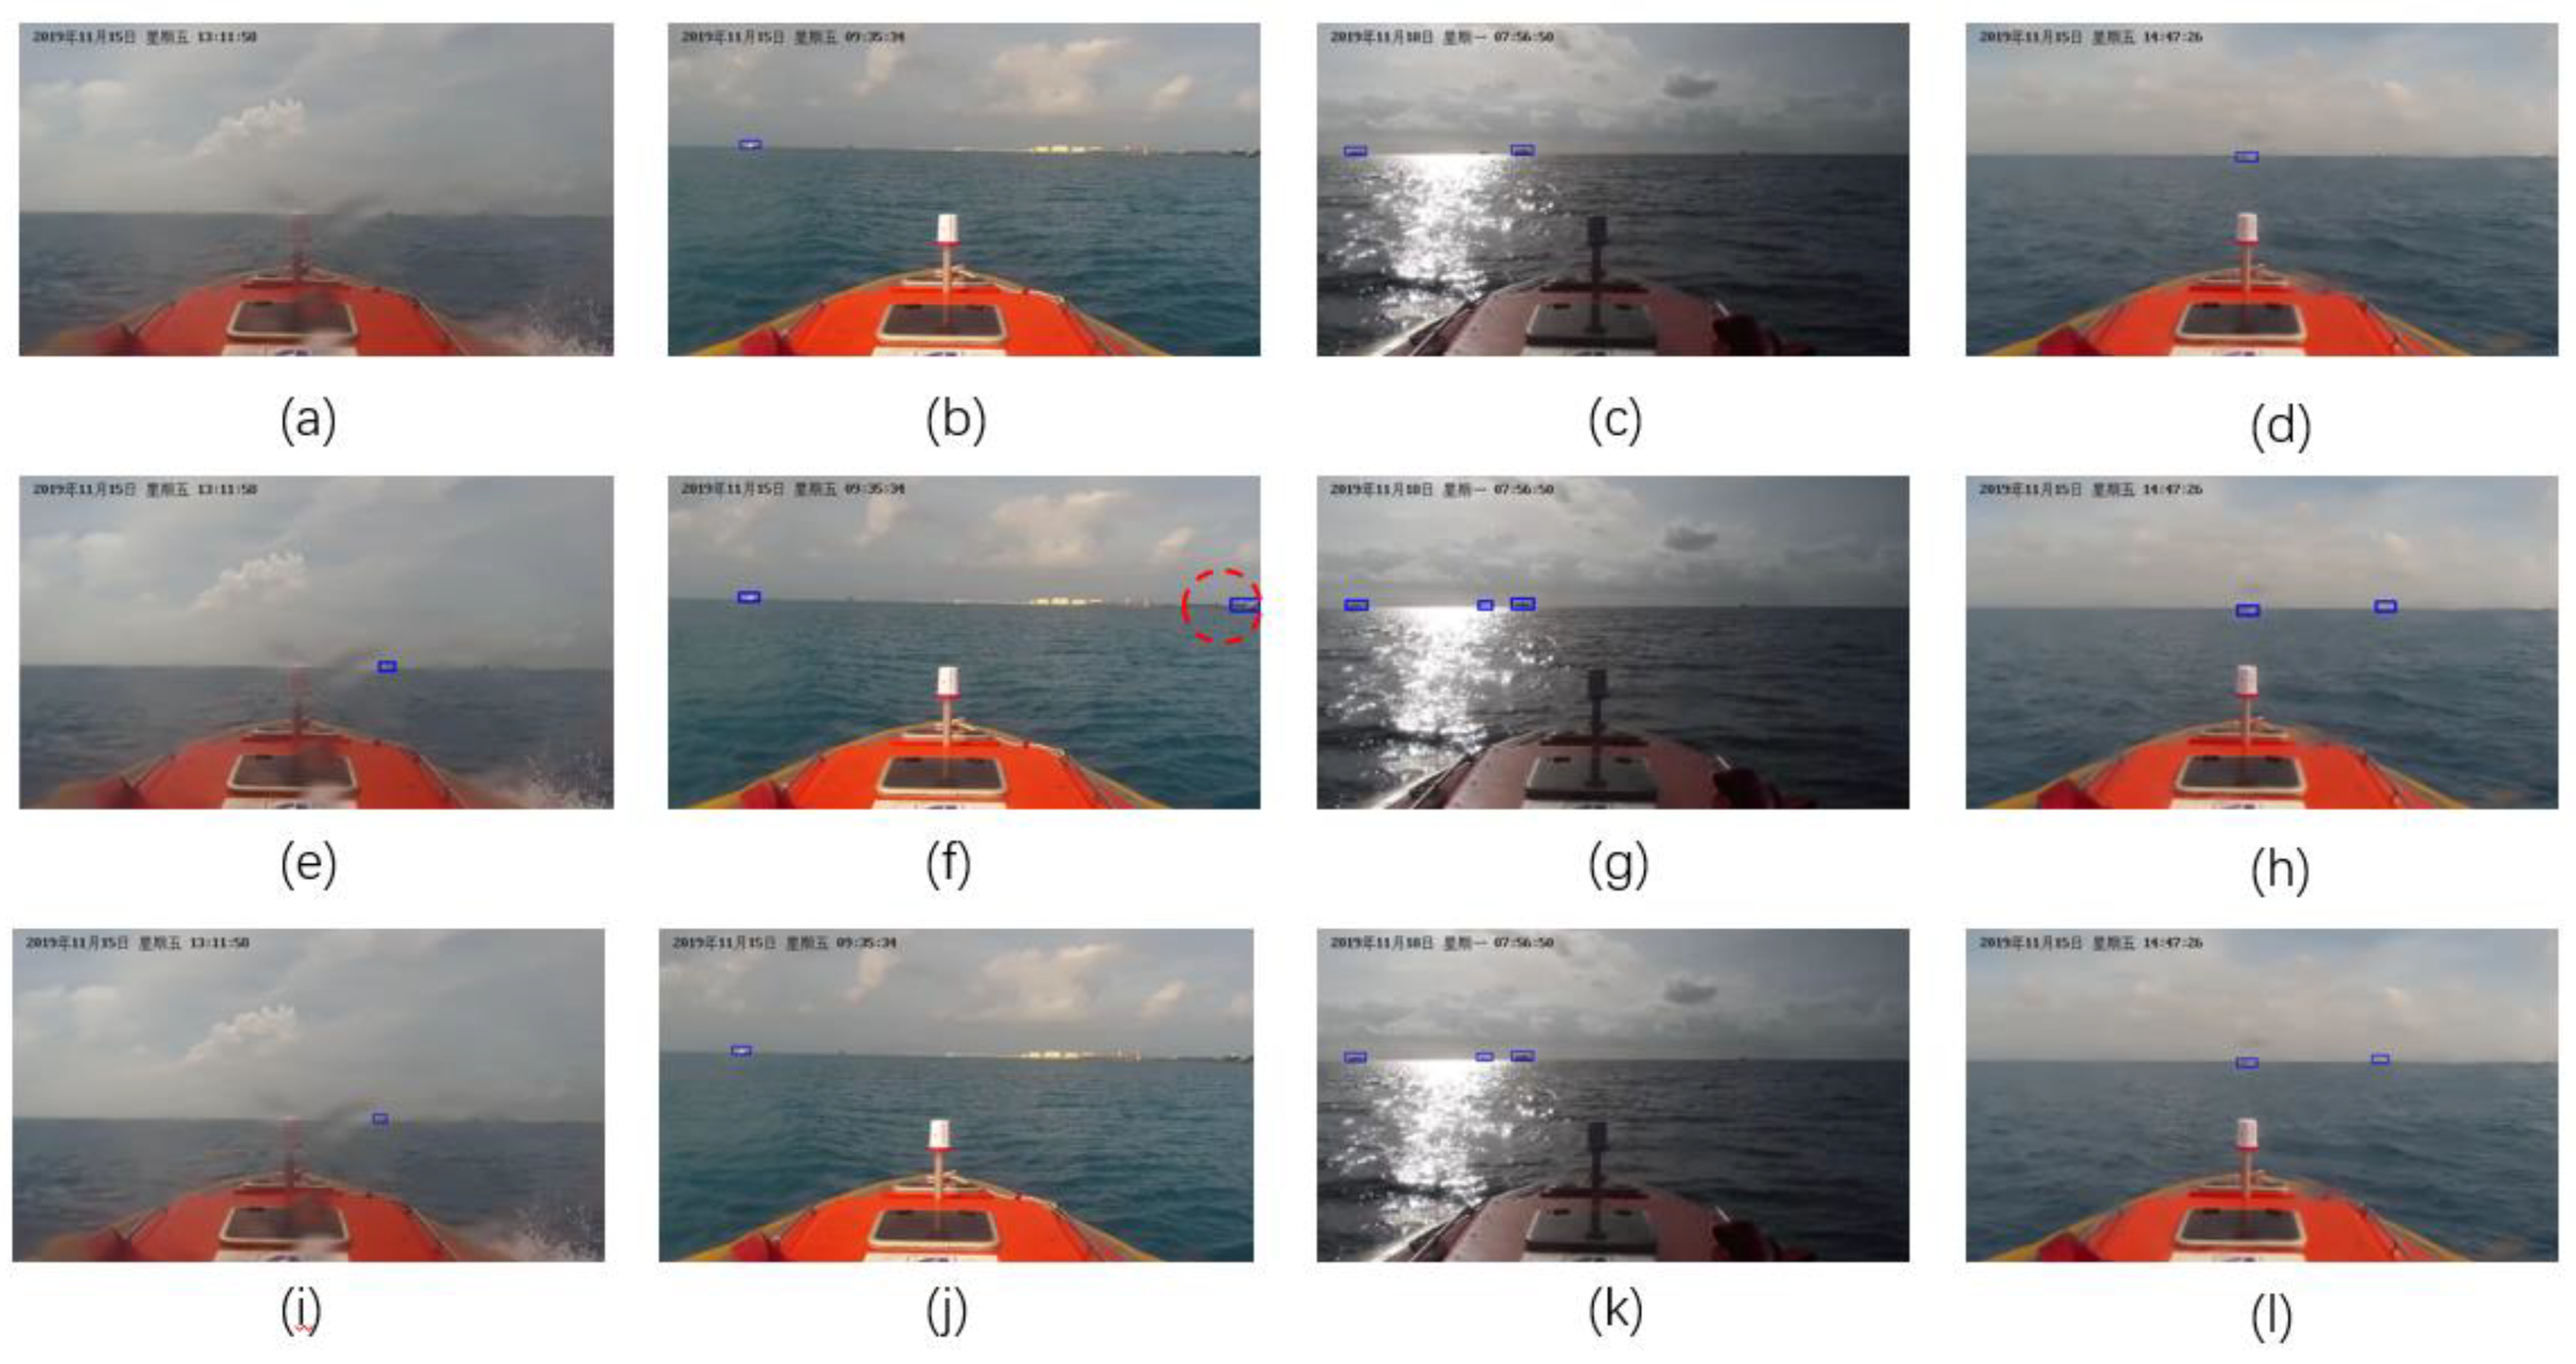
5.4. Performance under Different Environment Conditions
6. Conclusions
Author Contributions
Funding
Acknowledgments
Conflicts of Interest
References
- Liu, Y.; Bucknall, R. Path planning algorithm for unmanned surface vehicle formations in a practical maritime environment. Ocean Eng. 2015, 97, 126–144. [Google Scholar]
- Naus, K.; Marchel, Ł.; Szymak, P.; Nowak, A. Assessment of the Accuracy of Determining the Angular Position of the Unmanned Bathymetric Surveying Vehicle Based on the Sea Horizon Image. Sensors 2019, 19, 4644. [Google Scholar]
- Giordano, F.; Mattei, G.; Parente, C.; Peluso, F.; Santamaria, R. Integrating sensors into a marine drone for bathymetric 3D surveys in shallow waters. Sensors 2016, 16, 41. [Google Scholar]
- Specht, M.; Specht, C.; Lasota, H.; Cywiński, P. Assessment of the steering precision of a hydrographic Unmanned Surface Vessel (USV) along sounding profiles using a low-cost multi-Global Navigation Satellite System (GNSS) receiver supported autopilot. Sensors 2019, 19, 3939. [Google Scholar]
- Stateczny, A.; Burdziakowski, P.; Najdecka, K.; Domagalska-Stateczna, B. Accuracy of trajectory tracking based on nonlinear guidance logic for hydrographic unmanned surface vessels. Sensors 2020, 20, 832. [Google Scholar]
- Liu, Z.; Zhang, Y.; Yu, X.; Yuan, C. Unmanned surface vehicles: An overview of developments and challenges. Annu. Rev. Control 2016, 41, 71–93. [Google Scholar]
- Almeida, C.; Franco, T.; Ferreira, H.; Martins, A.; Santos, R.; Almeida, J.M.; Silva, E. Radar based collision detection developments on USV ROAZ II. In Proceedings of the Oceans 2009-Europe, Bremen, Germany, 11–14 May 2009; pp. 1–6. [Google Scholar]
- Halterman, R.; Bruch, M. Velodyne HDL-64E lidar for unmanned surface vehicle obstacle detection. In Proceedings of the Unmanned Systems Technology XII, Orlando, FL, USA, 6–9 April 2010; Volume 7692, p. 76920D. [Google Scholar]
- Muhovič, J.; Bovcon, B.; Kristan, M.; Perš, J. Obstacle Tracking for Unmanned Surface Vessels Using 3-D Point Cloud. IEEE J. Ocean. Eng. 2019, 45, 786–798. [Google Scholar]
- Kristan, M.; Kenk, V.S.; Kovačič, S.; Perš, J. Fast image-based obstacle detection from unmanned surface vehicles. IEEE T. Cybern. 2015, 46, 641–654. [Google Scholar]
- Rankin, A.; Matthies, L. Daytime water detection based on color variation. In Proceedings of the IEEE/RSJ International Conference on Intelligent Robots and Systems, Taipei, Taiwan, 18–22 October 2010; pp. 215–221. [Google Scholar]
- Scherer, S.; Rehder, J.; Achar, S.; Cover, H.; Chambers, A.; Nuske, S.; Singh, S. River mapping from a flying robot: State estimation, river detection, and obstacle mapping. Auton. Rob. 2012, 33, 189–214. [Google Scholar]
- Fefilatyev, S.; Goldgof, D. Detection and tracking of marine vehicles in video. In Proceedings of the 19th International Conference on Pattern Recognition, Tampa, FL, USA, 8–11 December 2008; pp. 1–4. [Google Scholar]
- Wang, H.; Wei, Z.; Wang, S.; Ow, C.S.; Ho, K.T.; Feng, B. A vision-based obstacle detection system for unmanned surface vehicle. In Proceedings of the IEEE 5th International Conference on Robotics, Automation and Mechatronics (RAM), Qingdao, China, 17–19 September 2011; pp. 364–369. [Google Scholar]
- Wang, H.; Wei, Z. Stereovision based obstacle detection system for unmanned surface vehicle. In Proceedings of the 2013 IEEE International Conference on Robotics and Biomimetics (ROBIO), Shenzhen, China, 12–14 December 2013; pp. 917–921. [Google Scholar]
- Krizhevsky, A.; Sutskever, I.; Hinton, G.E. Imagenet classification with deep convolutional neural networks. In Proceedings of the Advances in Neural Information Processing Systems, Lak Taheo, NV, USA, 3–6 December 2012; pp. 1097–1105. [Google Scholar]
- Szegedy, C.; Liu, W.; Jia, Y.; Sermanet, P.; Reed, S.; Anguelov, D.; Rabinovich, A. Going deeper with convolutions. In Proceedings of the IEEE Conference on Computer Vision and Pattern Recognition, Boston, MA, USA, 7–12 June 2015; pp. 1–9. [Google Scholar]
- He, K.; Zhang, X.; Ren, S.; Sun, J. Deep residual learning for image recognition. In Proceedings of the IEEE Conference on Computer Vision and Pattern Recognition, Las Vegas, NV, USA, 26 June–1 July 2016; pp. 770–778. [Google Scholar]
- Hu, B.; Lu, Z.; Li, H.; Chen, Q. Convolutional neural network architectures for matching natural language sentences. In Proceedings of the Advances in Neural Information Processing Systems, Montreal, QC, Canada, 8–13 December 2014; pp. 2042–2050. [Google Scholar]
- Hinton, G.; Deng, L.; Yu, D.; Dahl, G.E.; Mohamed, A.R.; Jaitly, N.; Kingsbury, B. Deep neural networks for acoustic modeling in speech recognition: The shared views of four research groups. IEEE Signal Proc. Mag. 2012, 29, 82–97. [Google Scholar]
- Ren, S.; He, K.; Girshick, R.; Sun, J. Faster r-cnn: Towards real-time object detection with region proposal networks. In Proceedings of the Advances in Neural Information Processing Systems, Montreal, QC, Canada, 7–12 December 2015; pp. 91–99. [Google Scholar]
- Kim, H.; Boulougouris, E.; Kim, S.H. Object detection algorithm for unmanned surface vehicle using faster R-CNN. In Proceedings of the World Maritime Technology Conference, Shanghai, China, 4–7 December 2018. [Google Scholar]
- Yang, J.; Xiao, Y.; Fang, Z.; Zhang, N.; Wang, L.; Li, T. An object detection and tracking system for unmanned surface vehicles. In Proceedings of the Target and Background Signatures III, Warsaw, Poland, 5 October 2017; Volume 10432, p. 104320R. [Google Scholar]
- Yang, J.; Li, Y.; Zhang, Q.; Ren, Y. Surface vehicle detection and tracking with deep learning and appearance feature. In Proceedings of the 2019 5th International Conference on Control, Automation and Robotics, Beijing, China, 19–22 April 2019; pp. 276–280. [Google Scholar]
- Shi, Q.; Li, W.; Zhang, F.; Hu, W.; Sun, X.; Gao, L. Deep CNN with multi-scale rotation invariance features for ship classification. IEEE Access 2018, 6, 38656–38668. [Google Scholar]
- Redmon, J.; Divvala, S.; Girshick, R.; Farhadi, A. You only look once: Unified, real-time object detection. In Proceedings of the IEEE Conference on Computer Vision and Pattern Recognition, Las Vegas, NV, USA, 26 June–1 July 2016; pp. 779–788. [Google Scholar]
- Redmon, J.; Farhadi, A. Yolov3: An incremental improvement. arXiv 2018, arXiv:1804.02767. [Google Scholar]
- Redmon, J.; Farhadi, A. YOLO9000: Better, faster, stronger. In Proceedings of the IEEE Conference on Computer Vision and Pattern Recognition, Honolulu, HI, USA, 21–26 July 2017; pp. 7263–7271. [Google Scholar]
- Girshick, R.; Donahue, J.; Darrell, T.; Malik, J. Rich feature hierarchies for accurate object detection and semantic segmentation. In Proceedings of the IEEE Conference on Computer Vision and Pattern Recognition, Columbus, OH, USA, 24–27 June 2014; pp. 580–587. [Google Scholar]
- Tian, Y.; Yang, G.; Wang, Z.; Wang, H.; Li, E.; Liang, Z. Apple detection during different growth stages in orchards using the improved YOLO-V3 model. Comput. Electron. Agr. 2019, 157, 417–426. [Google Scholar]
- Huang, G.; Liu, Z.; Van Der Maaten, L.; Weinberger, K.Q. Densely connected convolutional networks. In Proceedings of the IEEE Conference on Computer Vision and Pattern Recognition, Honolulu, HI, USA, 21–26 July 2017; pp. 4700–4708. [Google Scholar]
- Li, Y.; Xia, C.; Lee, J. Detection of small-sized insect pest in greenhouses based on multifractal analysis. Optik 2015, 126, 2138–2143. [Google Scholar]


| Condition | Size | Number | Total Number |
|---|---|---|---|
| Sunny | 1280 × 720 | 1356 | 3000 |
| Cloudy | 696 | ||
| Sea flog | 861 | ||
| Water droplets adhere to lens | 87 |
| Original Data | Brightness | Rotation | Total | |
|---|---|---|---|---|
| Training Dataset | 1000 | 1000 | 2000 | 4000 |
| Original Data | Augmented Data | Total | |
|---|---|---|---|
| Training Dataset | 1000 | 3000 | 4000 |
| Validation Dataset | 1200 | NA | 1200 |
| Testing Dataset | 800 | 800 |
| Model | Ground-Truth | Predicted | TP | FP | AP | F-Measure |
|---|---|---|---|---|---|---|
| YOLOV3 | 1406 | 1311 | 1301 | 10 | 92.47% | 0.958 |
| Faster RCNN | 1363 | 1312 | 51 | 93.21% | 0.954 | |
| YOLOV3-dense | 1317 | 1310 | 7 | 93.13% | 0.962 |
| Model | Iteration | AP | F-Measure |
|---|---|---|---|
| Training data without data augmentation | 45,000 | 92.44% | 0.957 |
| Training data with data augmentation | 93.13% | 0.962 |
© 2020 by the authors. Licensee MDPI, Basel, Switzerland. This article is an open access article distributed under the terms and conditions of the Creative Commons Attribution (CC BY) license (http://creativecommons.org/licenses/by/4.0/).
Share and Cite
Li, Y.; Guo, J.; Guo, X.; Liu, K.; Zhao, W.; Luo, Y.; Wang, Z. A Novel Target Detection Method of the Unmanned Surface Vehicle under All-Weather Conditions with an Improved YOLOV3. Sensors 2020, 20, 4885. https://doi.org/10.3390/s20174885
Li Y, Guo J, Guo X, Liu K, Zhao W, Luo Y, Wang Z. A Novel Target Detection Method of the Unmanned Surface Vehicle under All-Weather Conditions with an Improved YOLOV3. Sensors. 2020; 20(17):4885. https://doi.org/10.3390/s20174885
Chicago/Turabian StyleLi, Yan, Jiahong Guo, Xiaomin Guo, Kaizhou Liu, Wentao Zhao, Yeteng Luo, and Zhenyu Wang. 2020. "A Novel Target Detection Method of the Unmanned Surface Vehicle under All-Weather Conditions with an Improved YOLOV3" Sensors 20, no. 17: 4885. https://doi.org/10.3390/s20174885
APA StyleLi, Y., Guo, J., Guo, X., Liu, K., Zhao, W., Luo, Y., & Wang, Z. (2020). A Novel Target Detection Method of the Unmanned Surface Vehicle under All-Weather Conditions with an Improved YOLOV3. Sensors, 20(17), 4885. https://doi.org/10.3390/s20174885