XFinger-Net: Pixel-Wise Segmentation Method for Partially Defective Fingerprint Based on Attention Gates and U-Net


Abstract
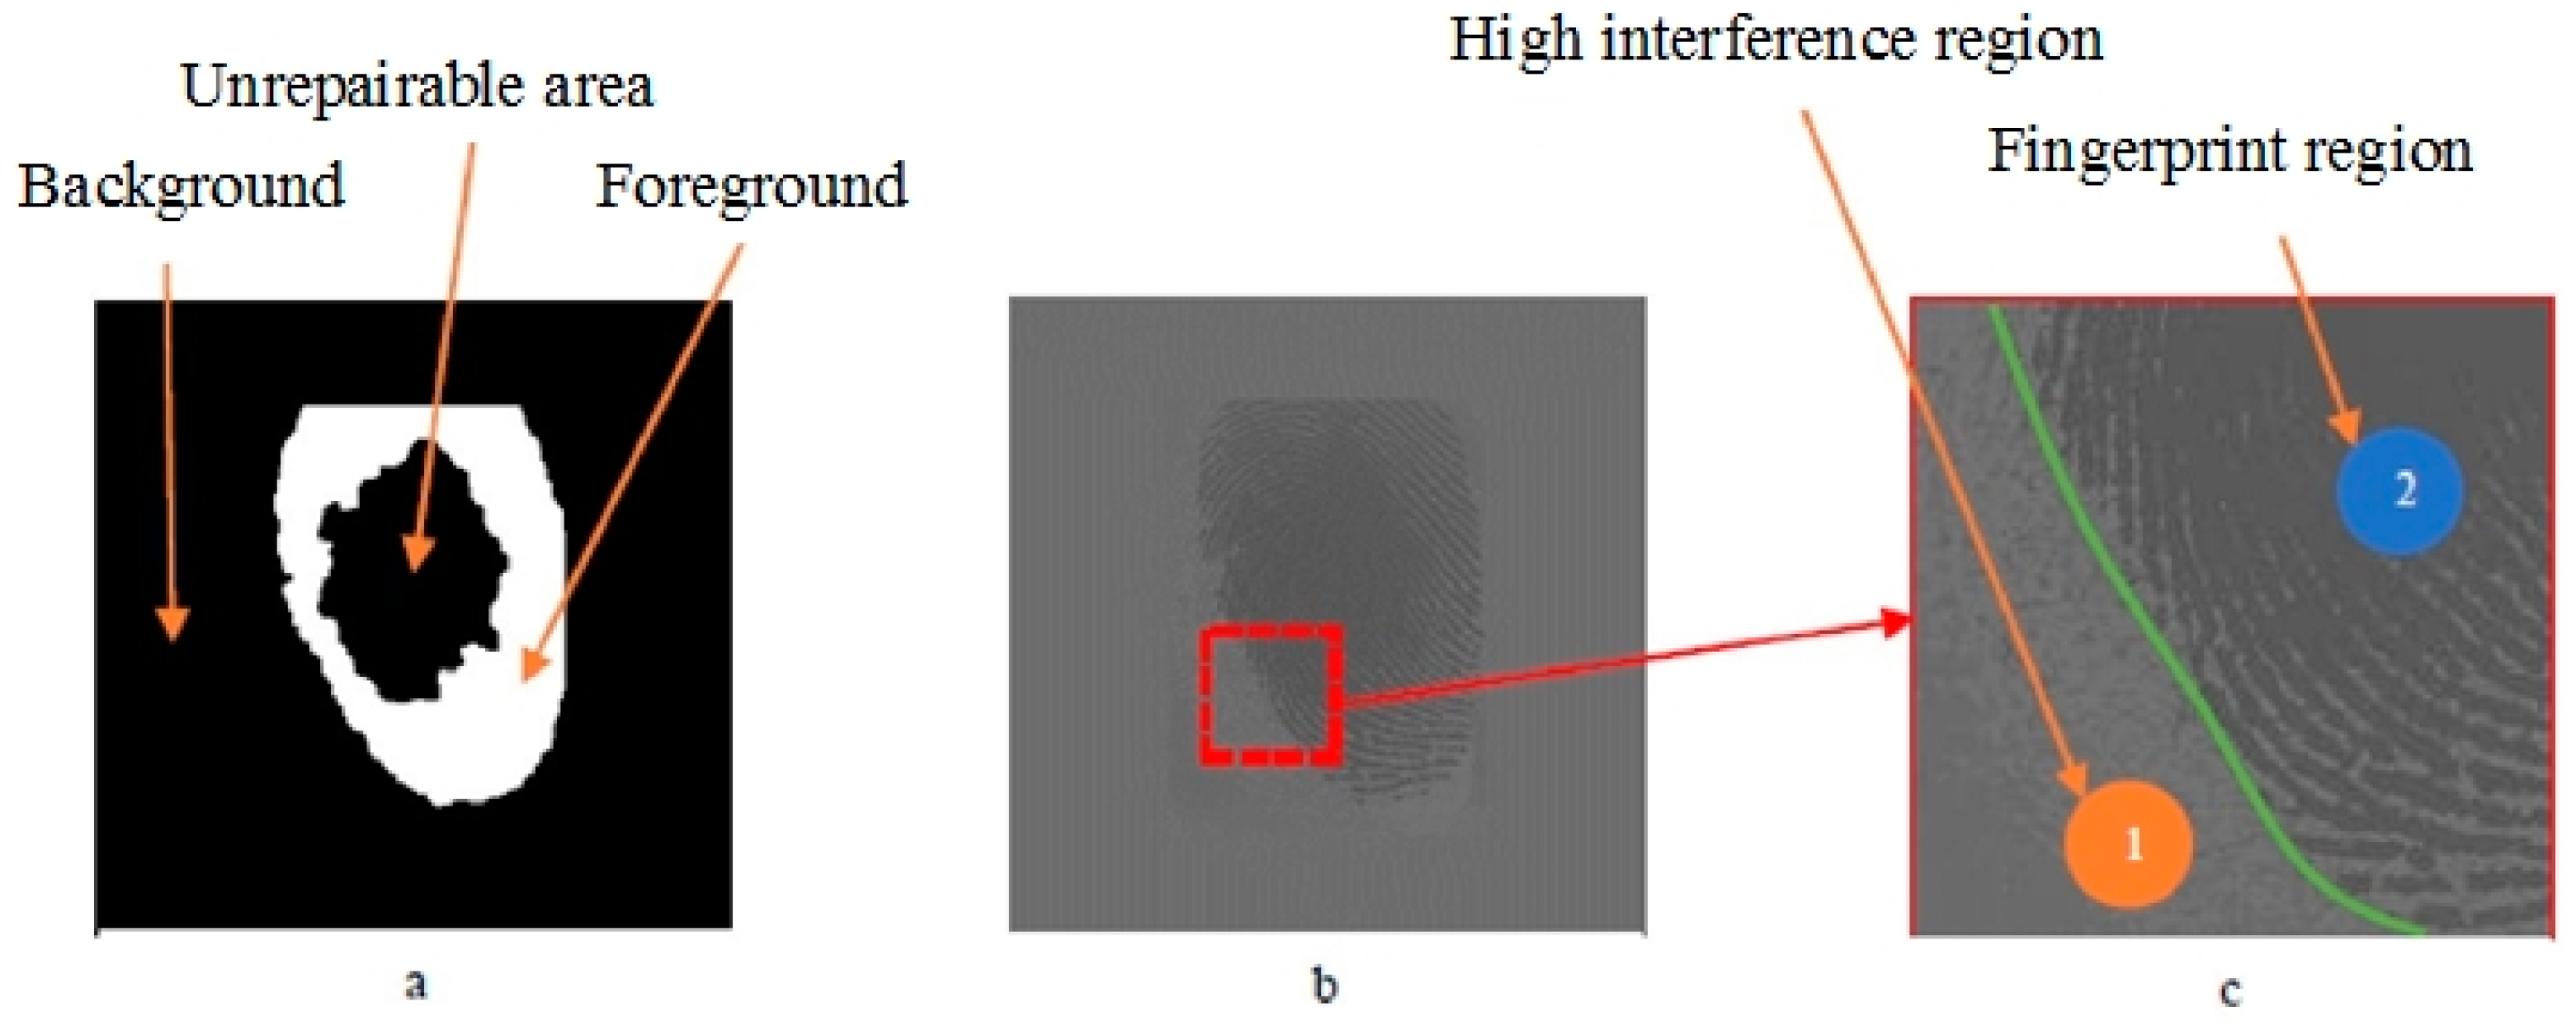
1. Introduction
2. Methodology
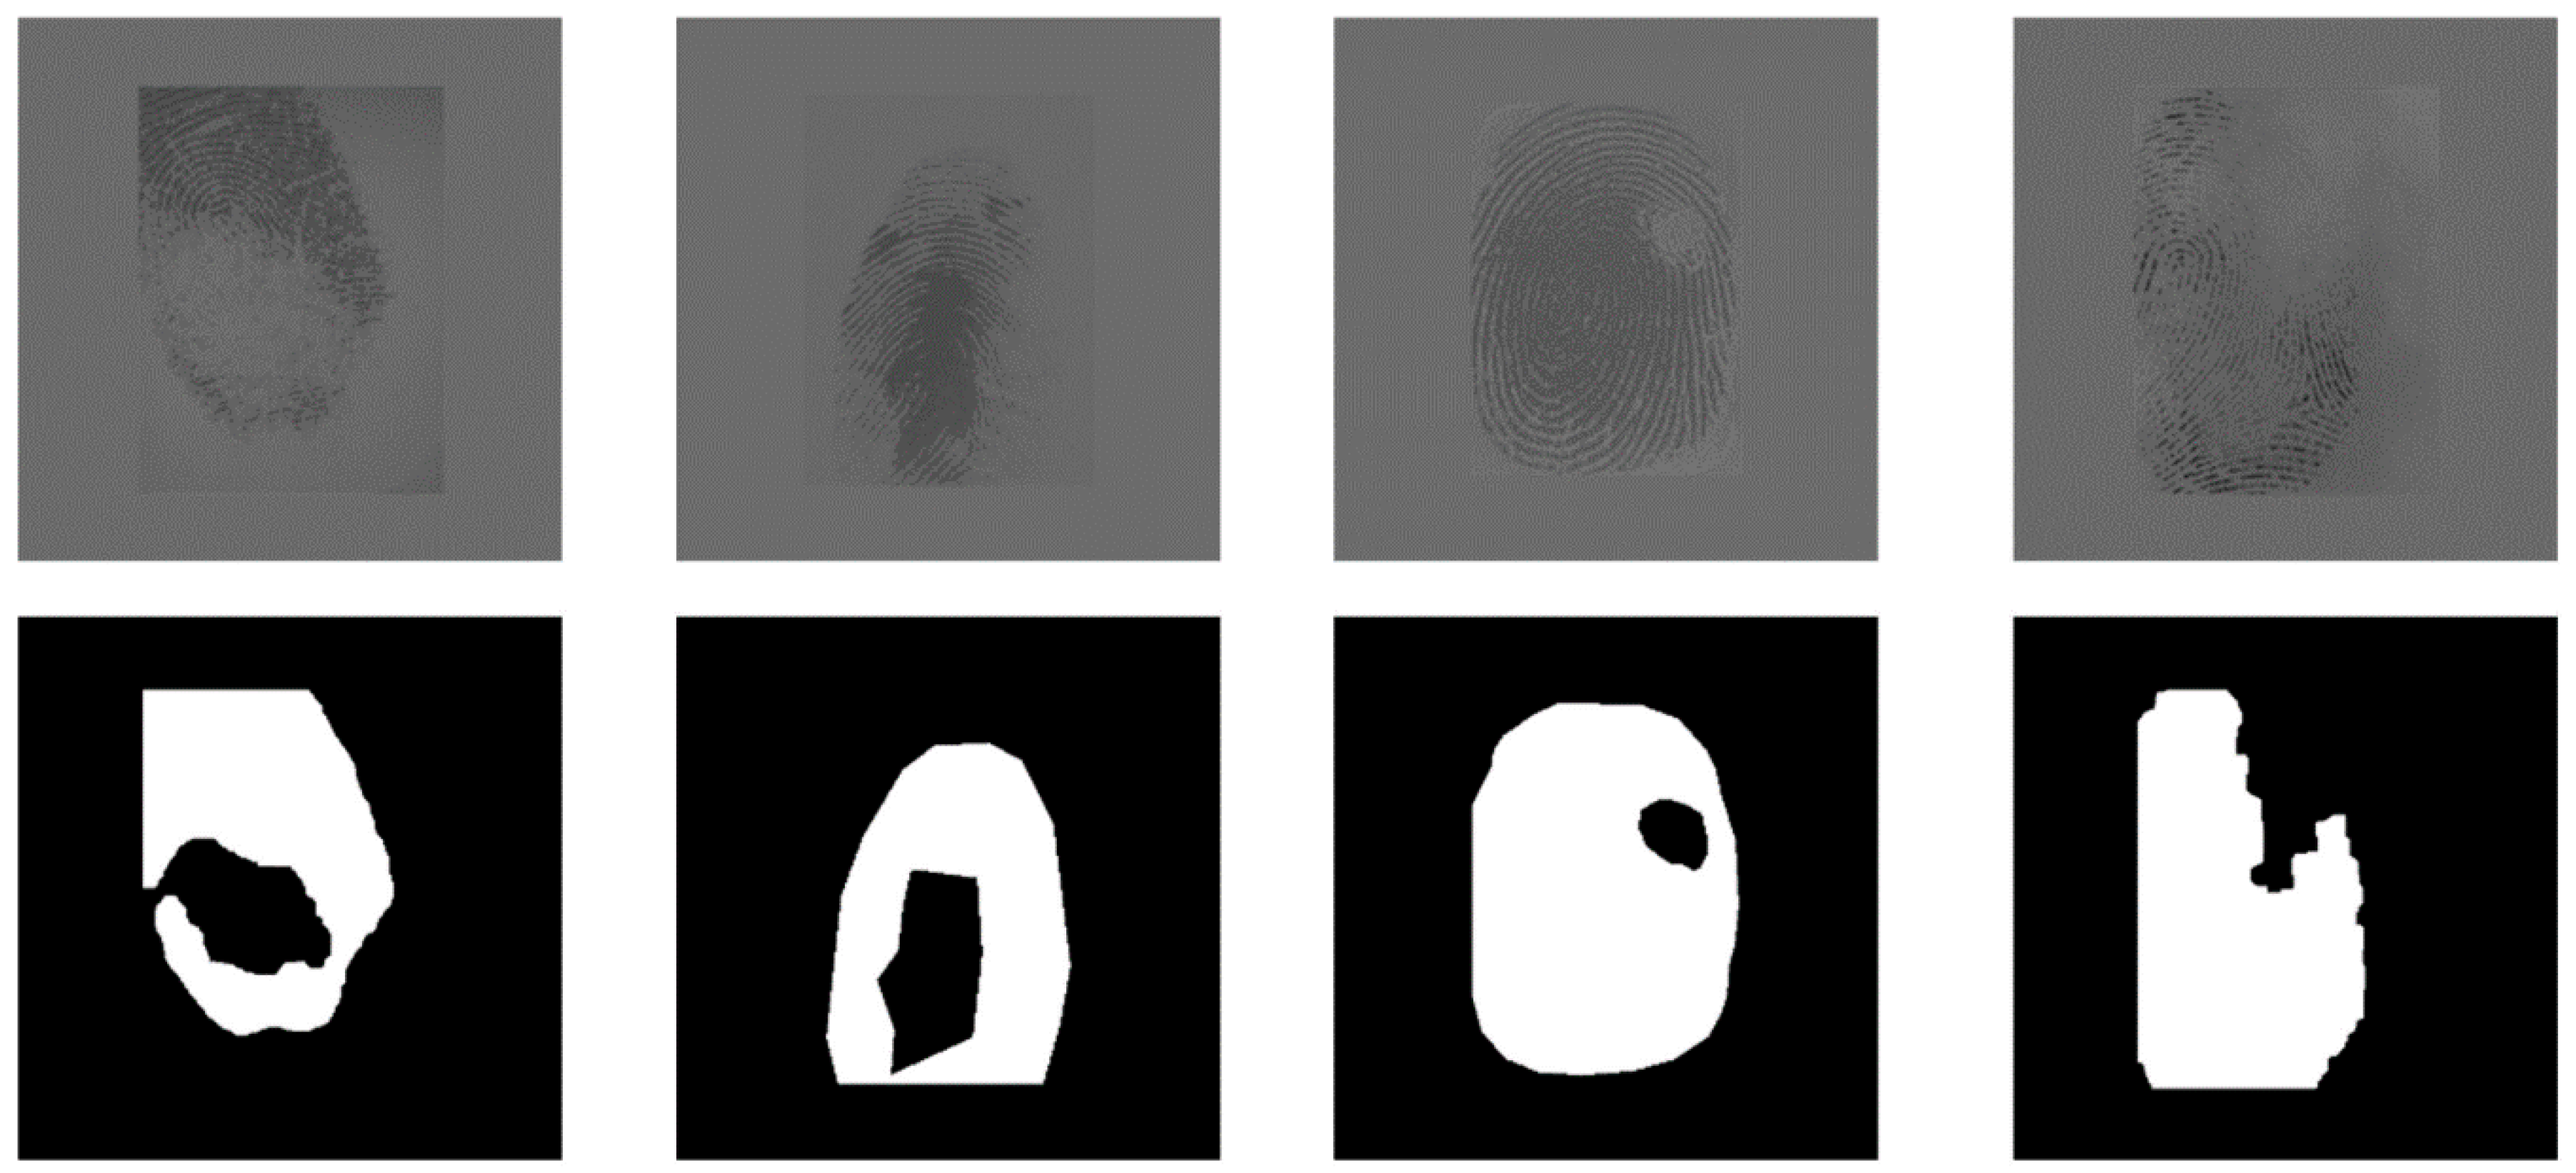
2.1. Data and Raw Materials
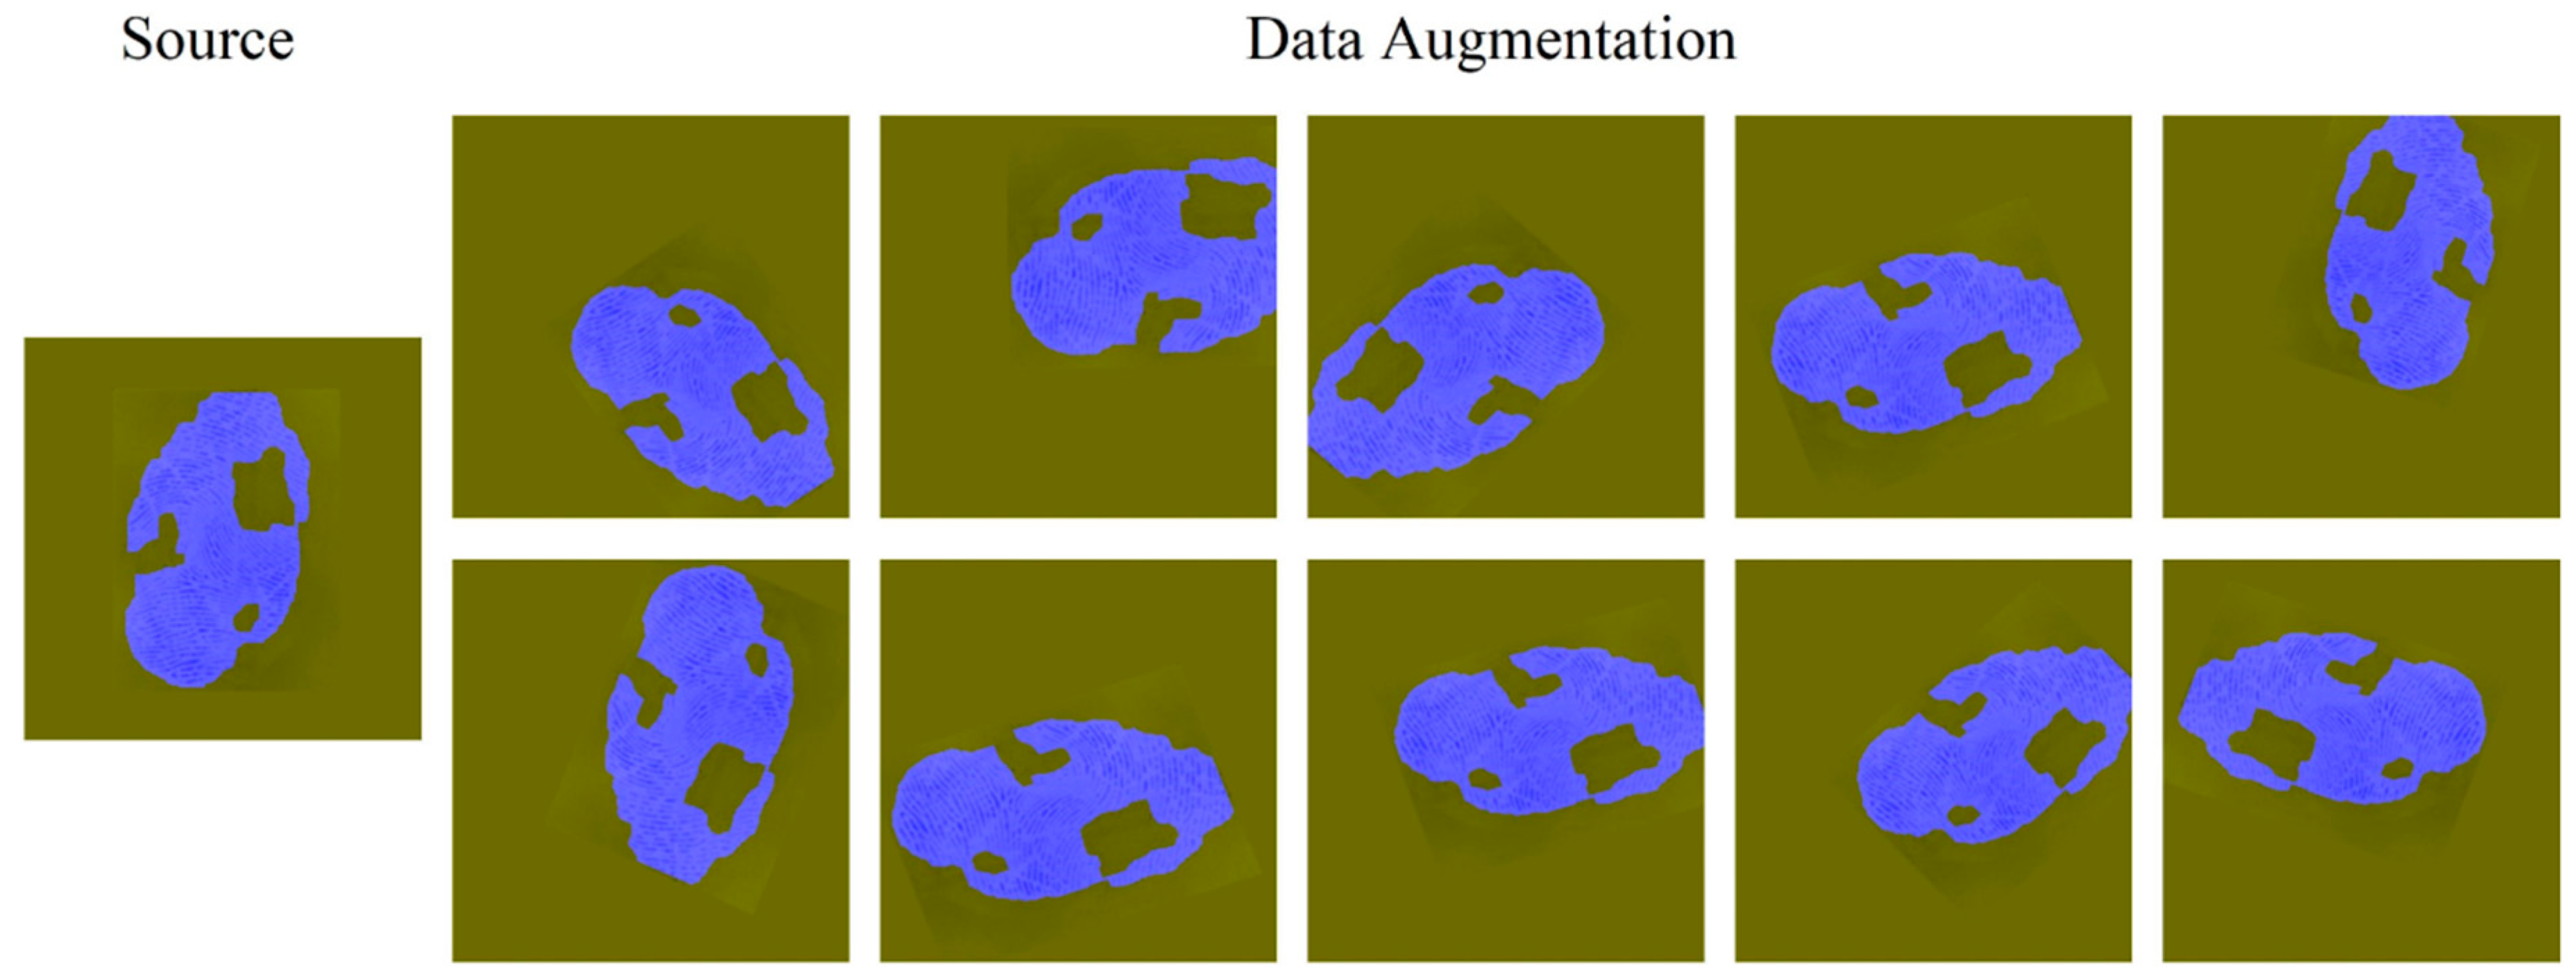
2.2. Data Preprocessing
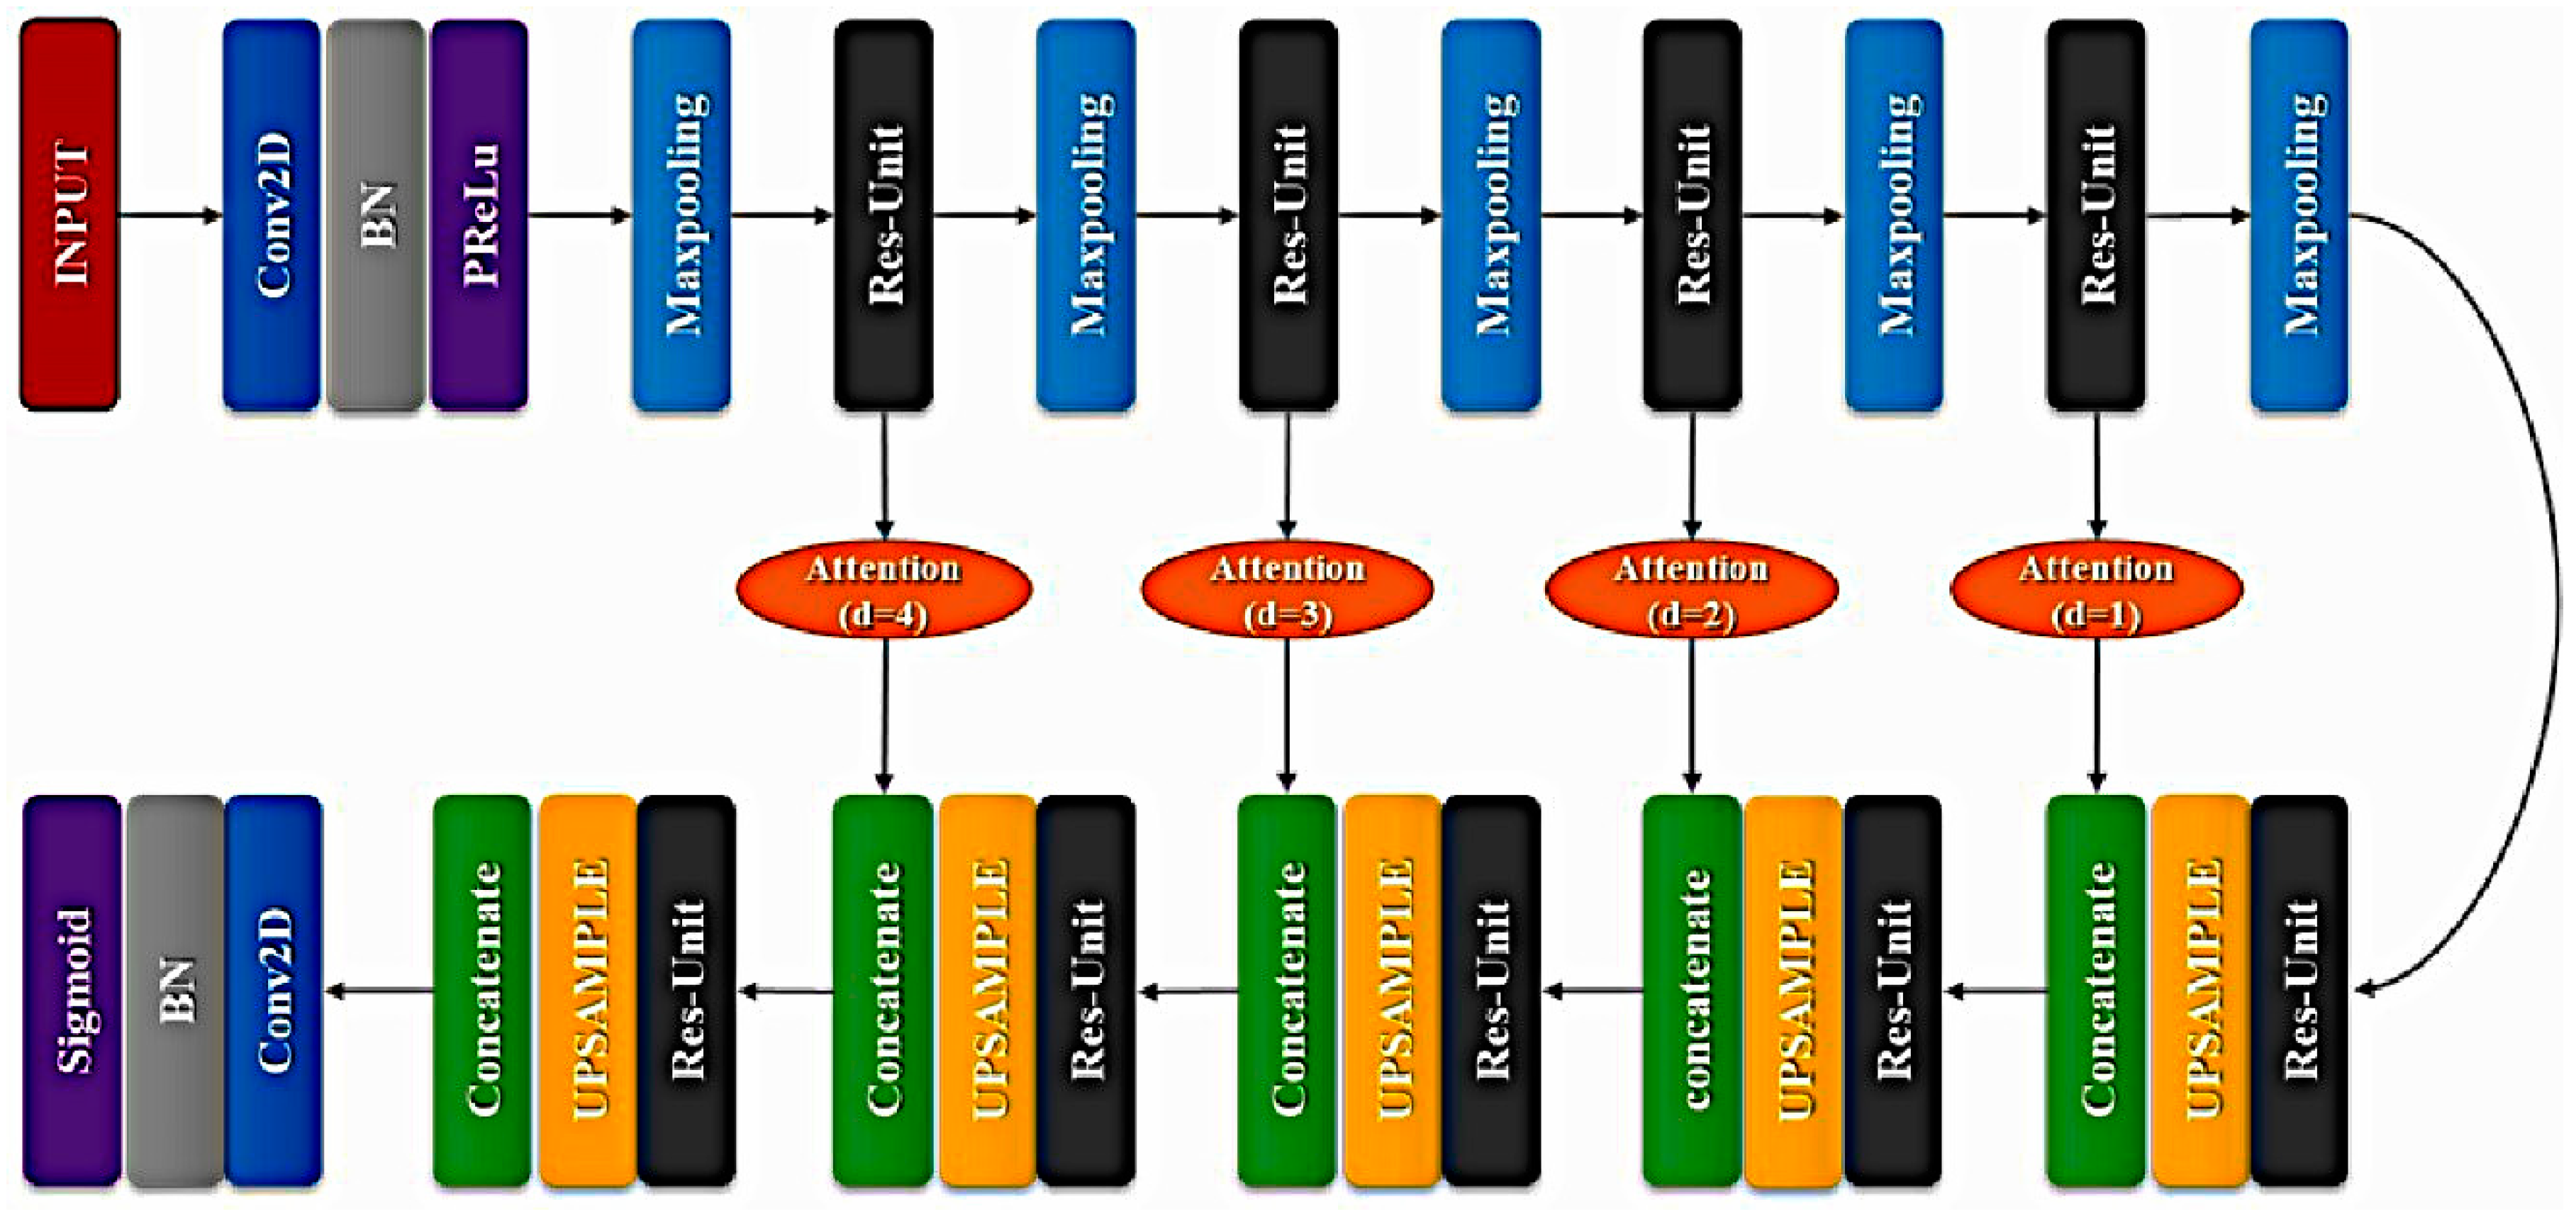
2.3. Overall Model Architecture
2.3.1. U-Net Based
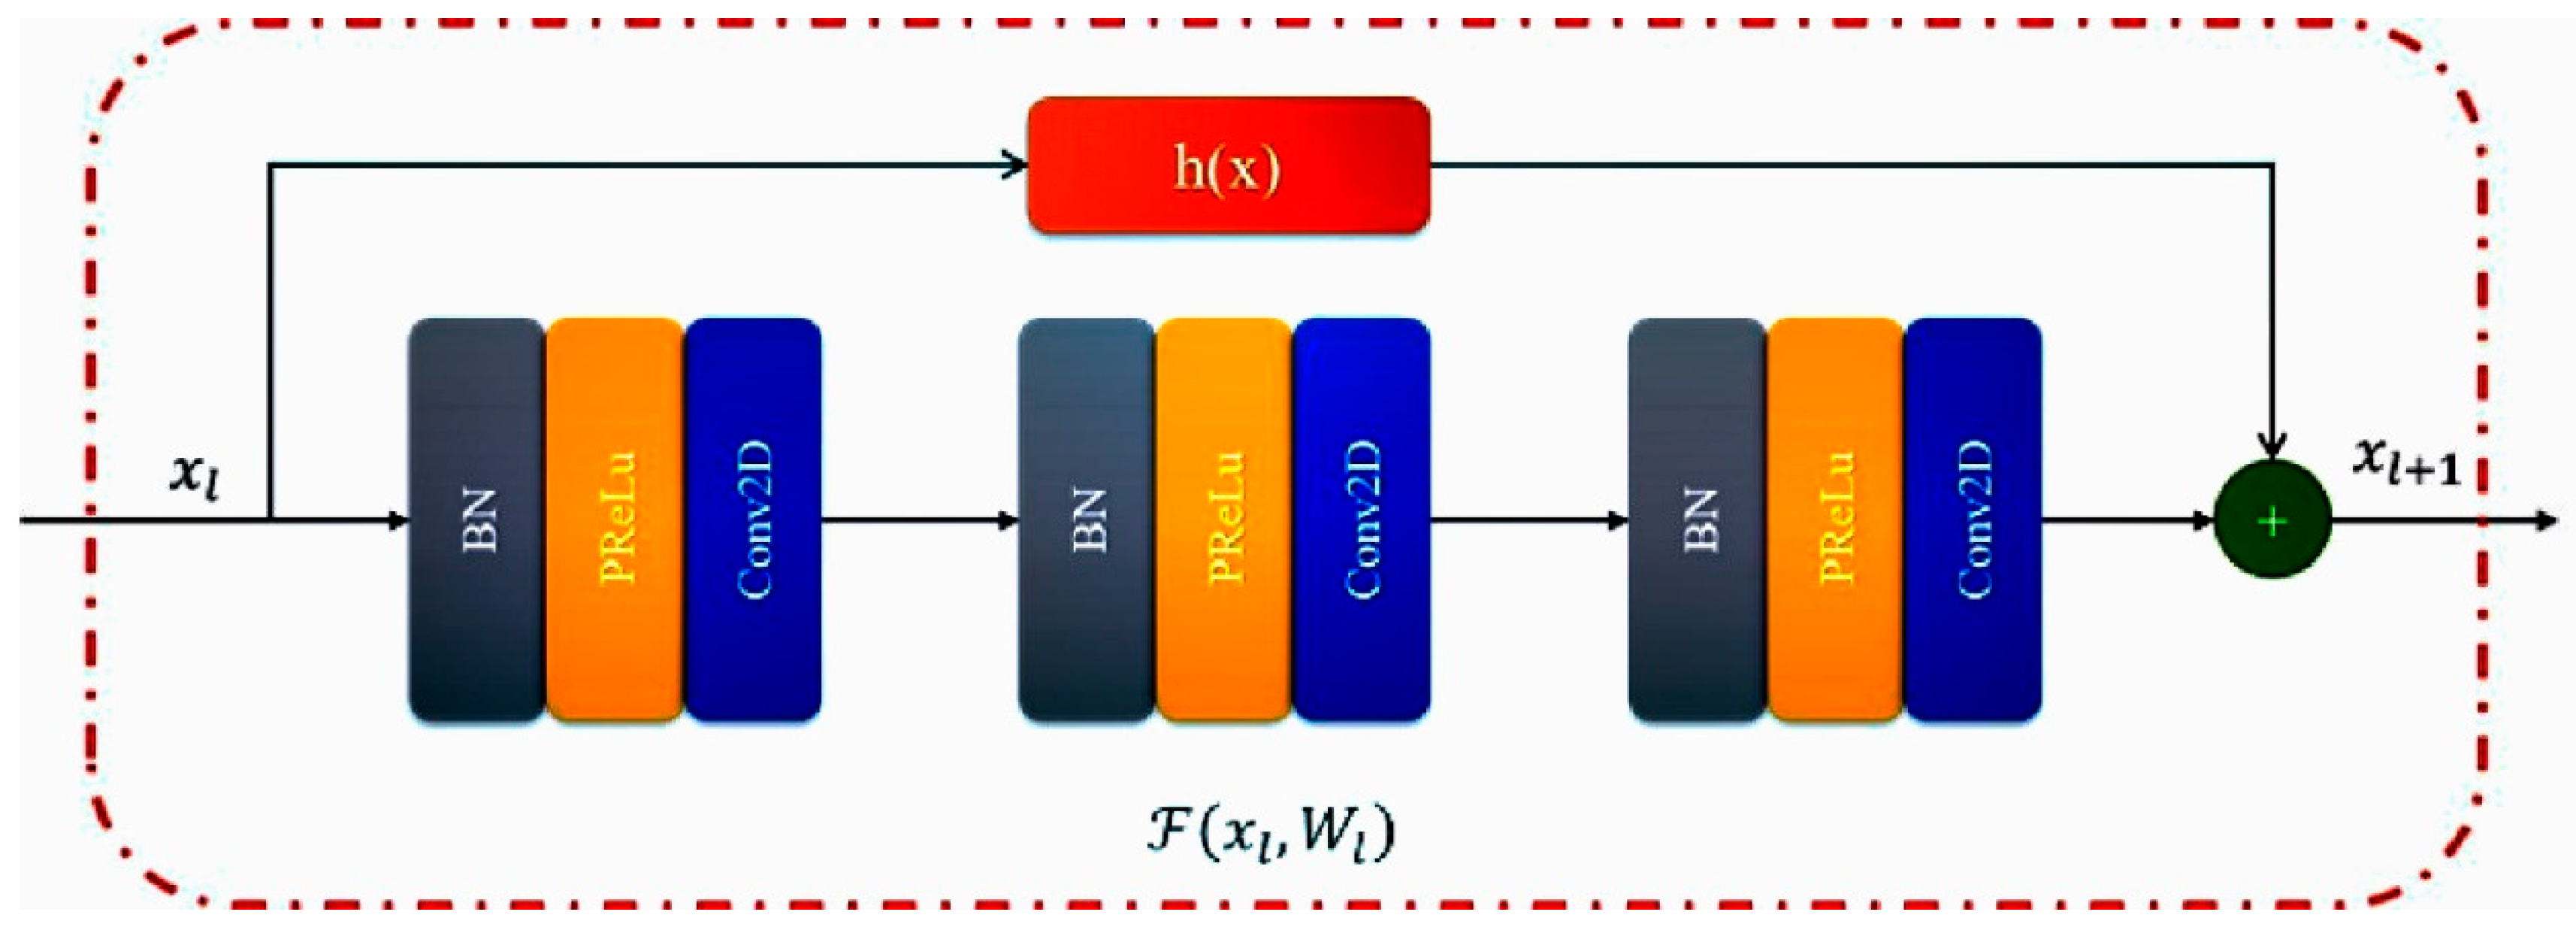
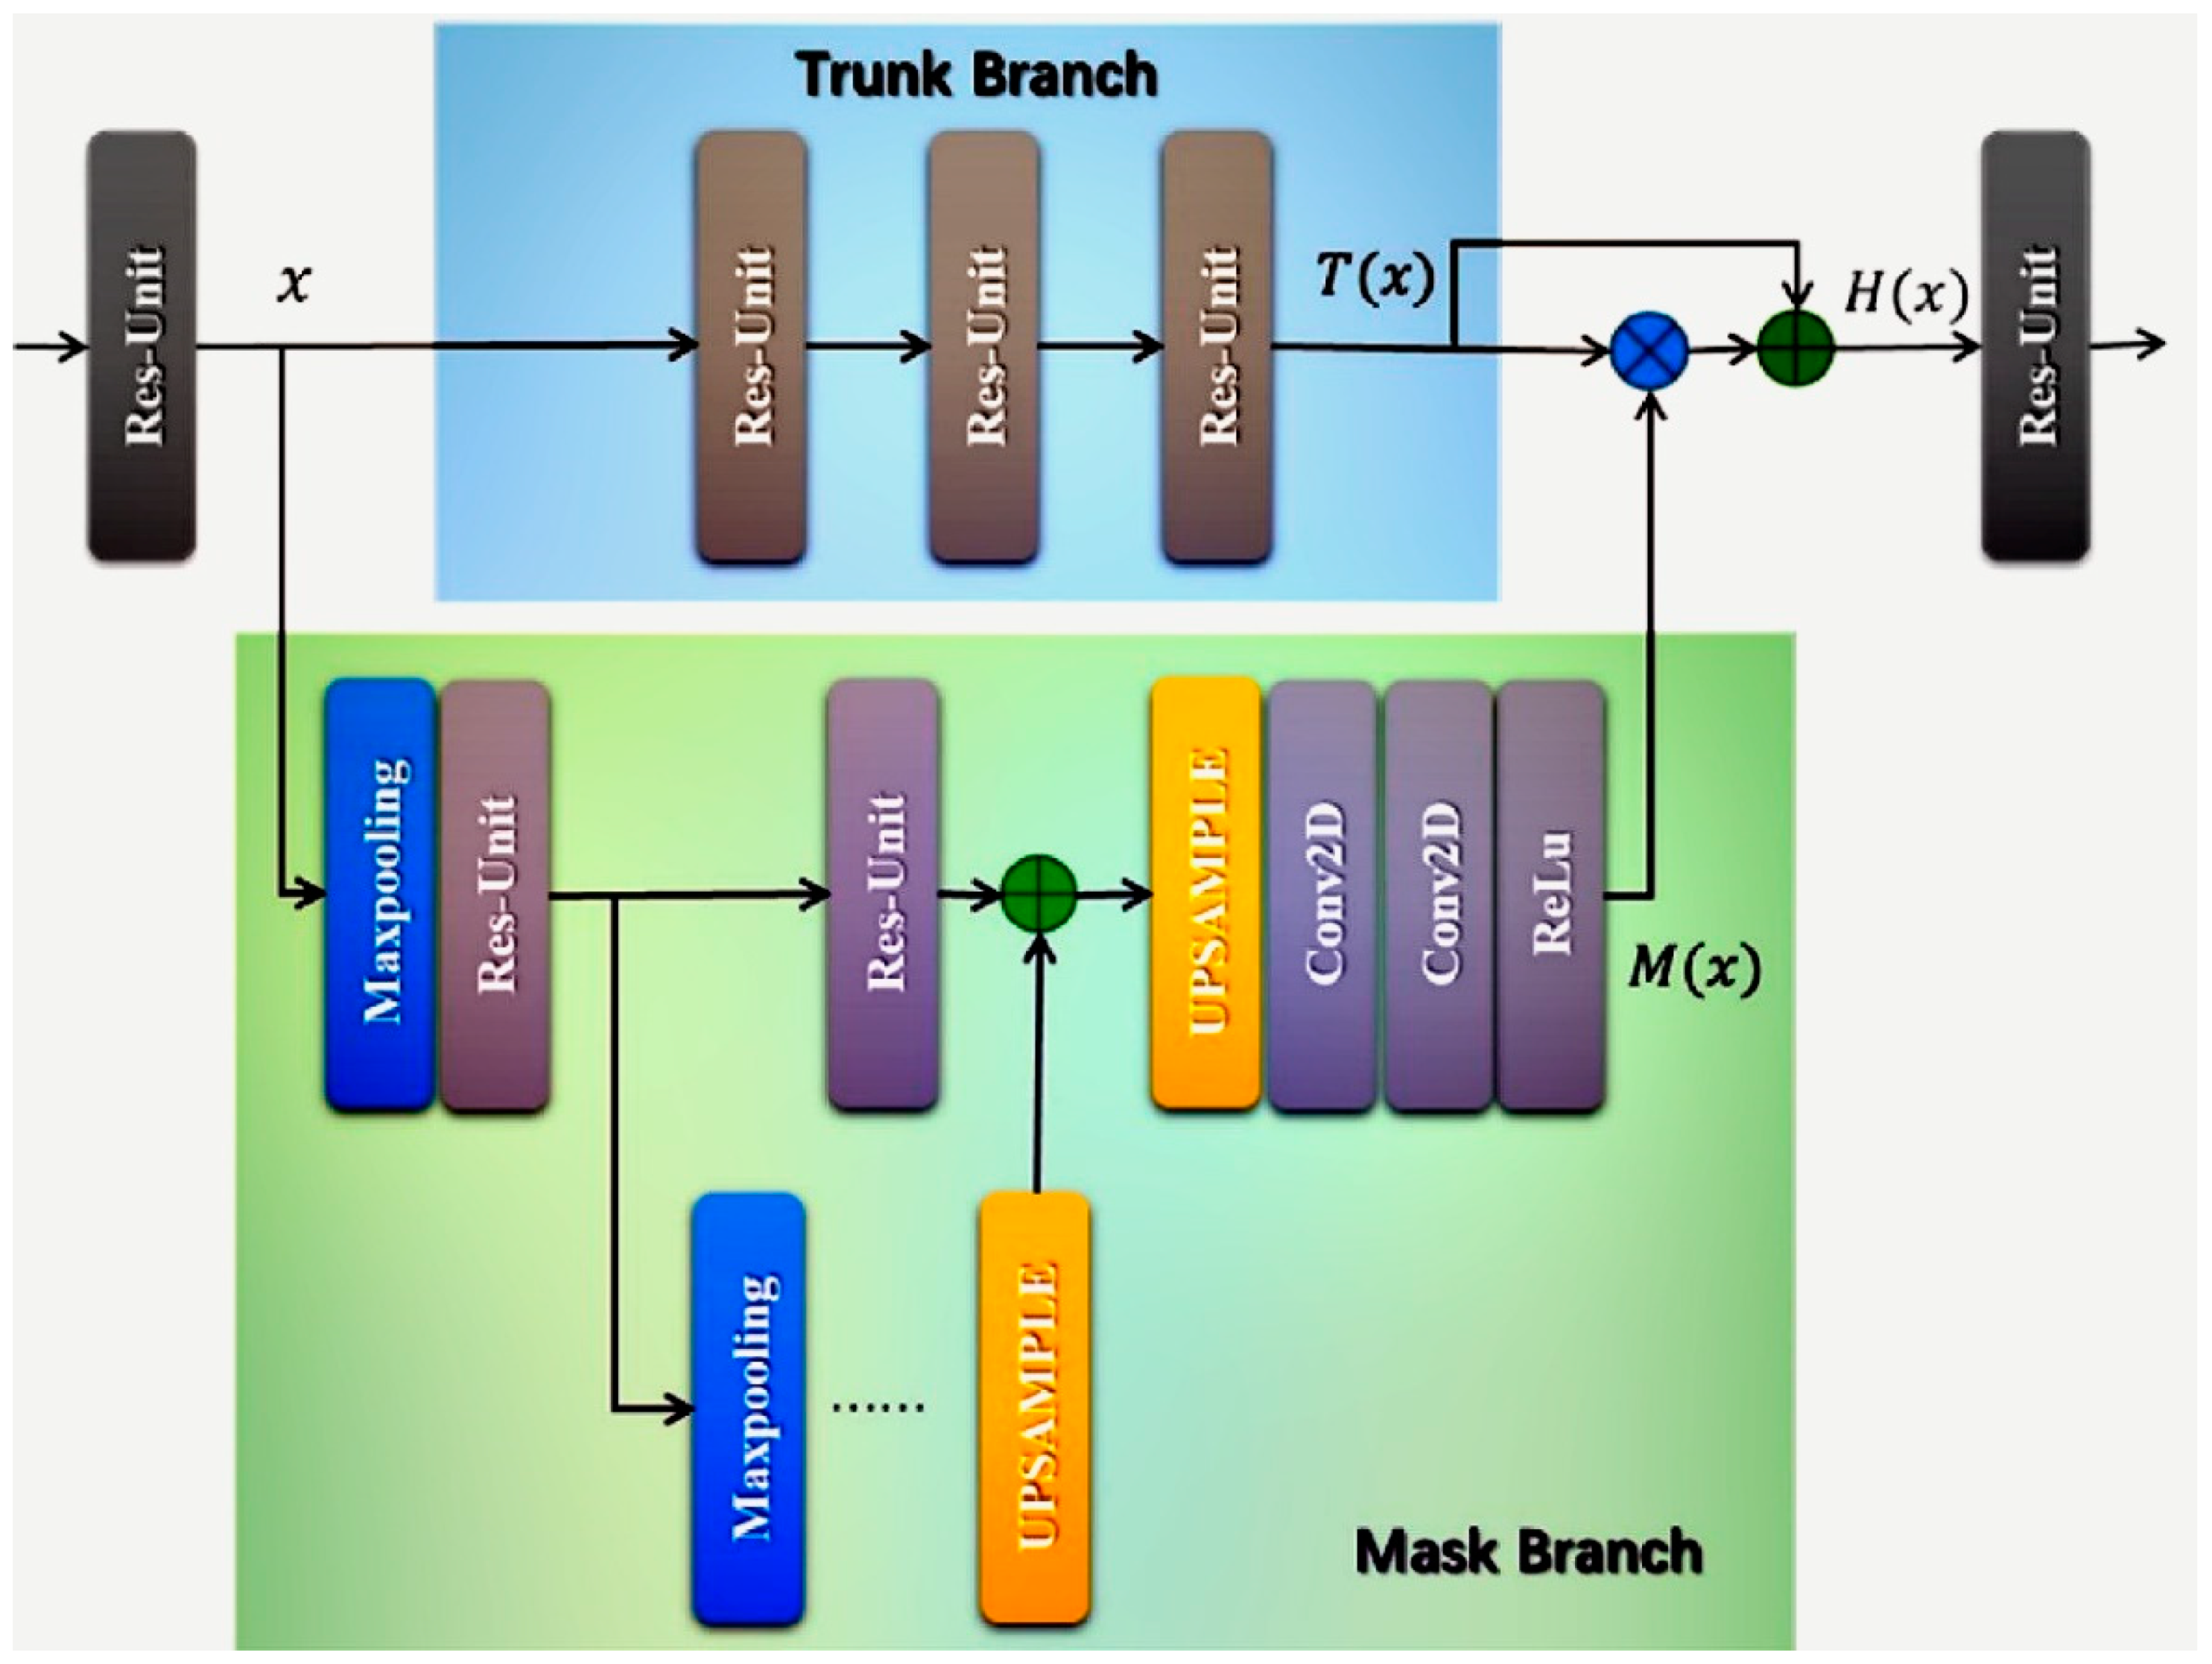
2.3.2. Residual Mechanism
2.3.3. Attention Gates in XFinger-Net
2.3.4. Loss Function
2.3.5. Implementation Details
3. Experiments and Results
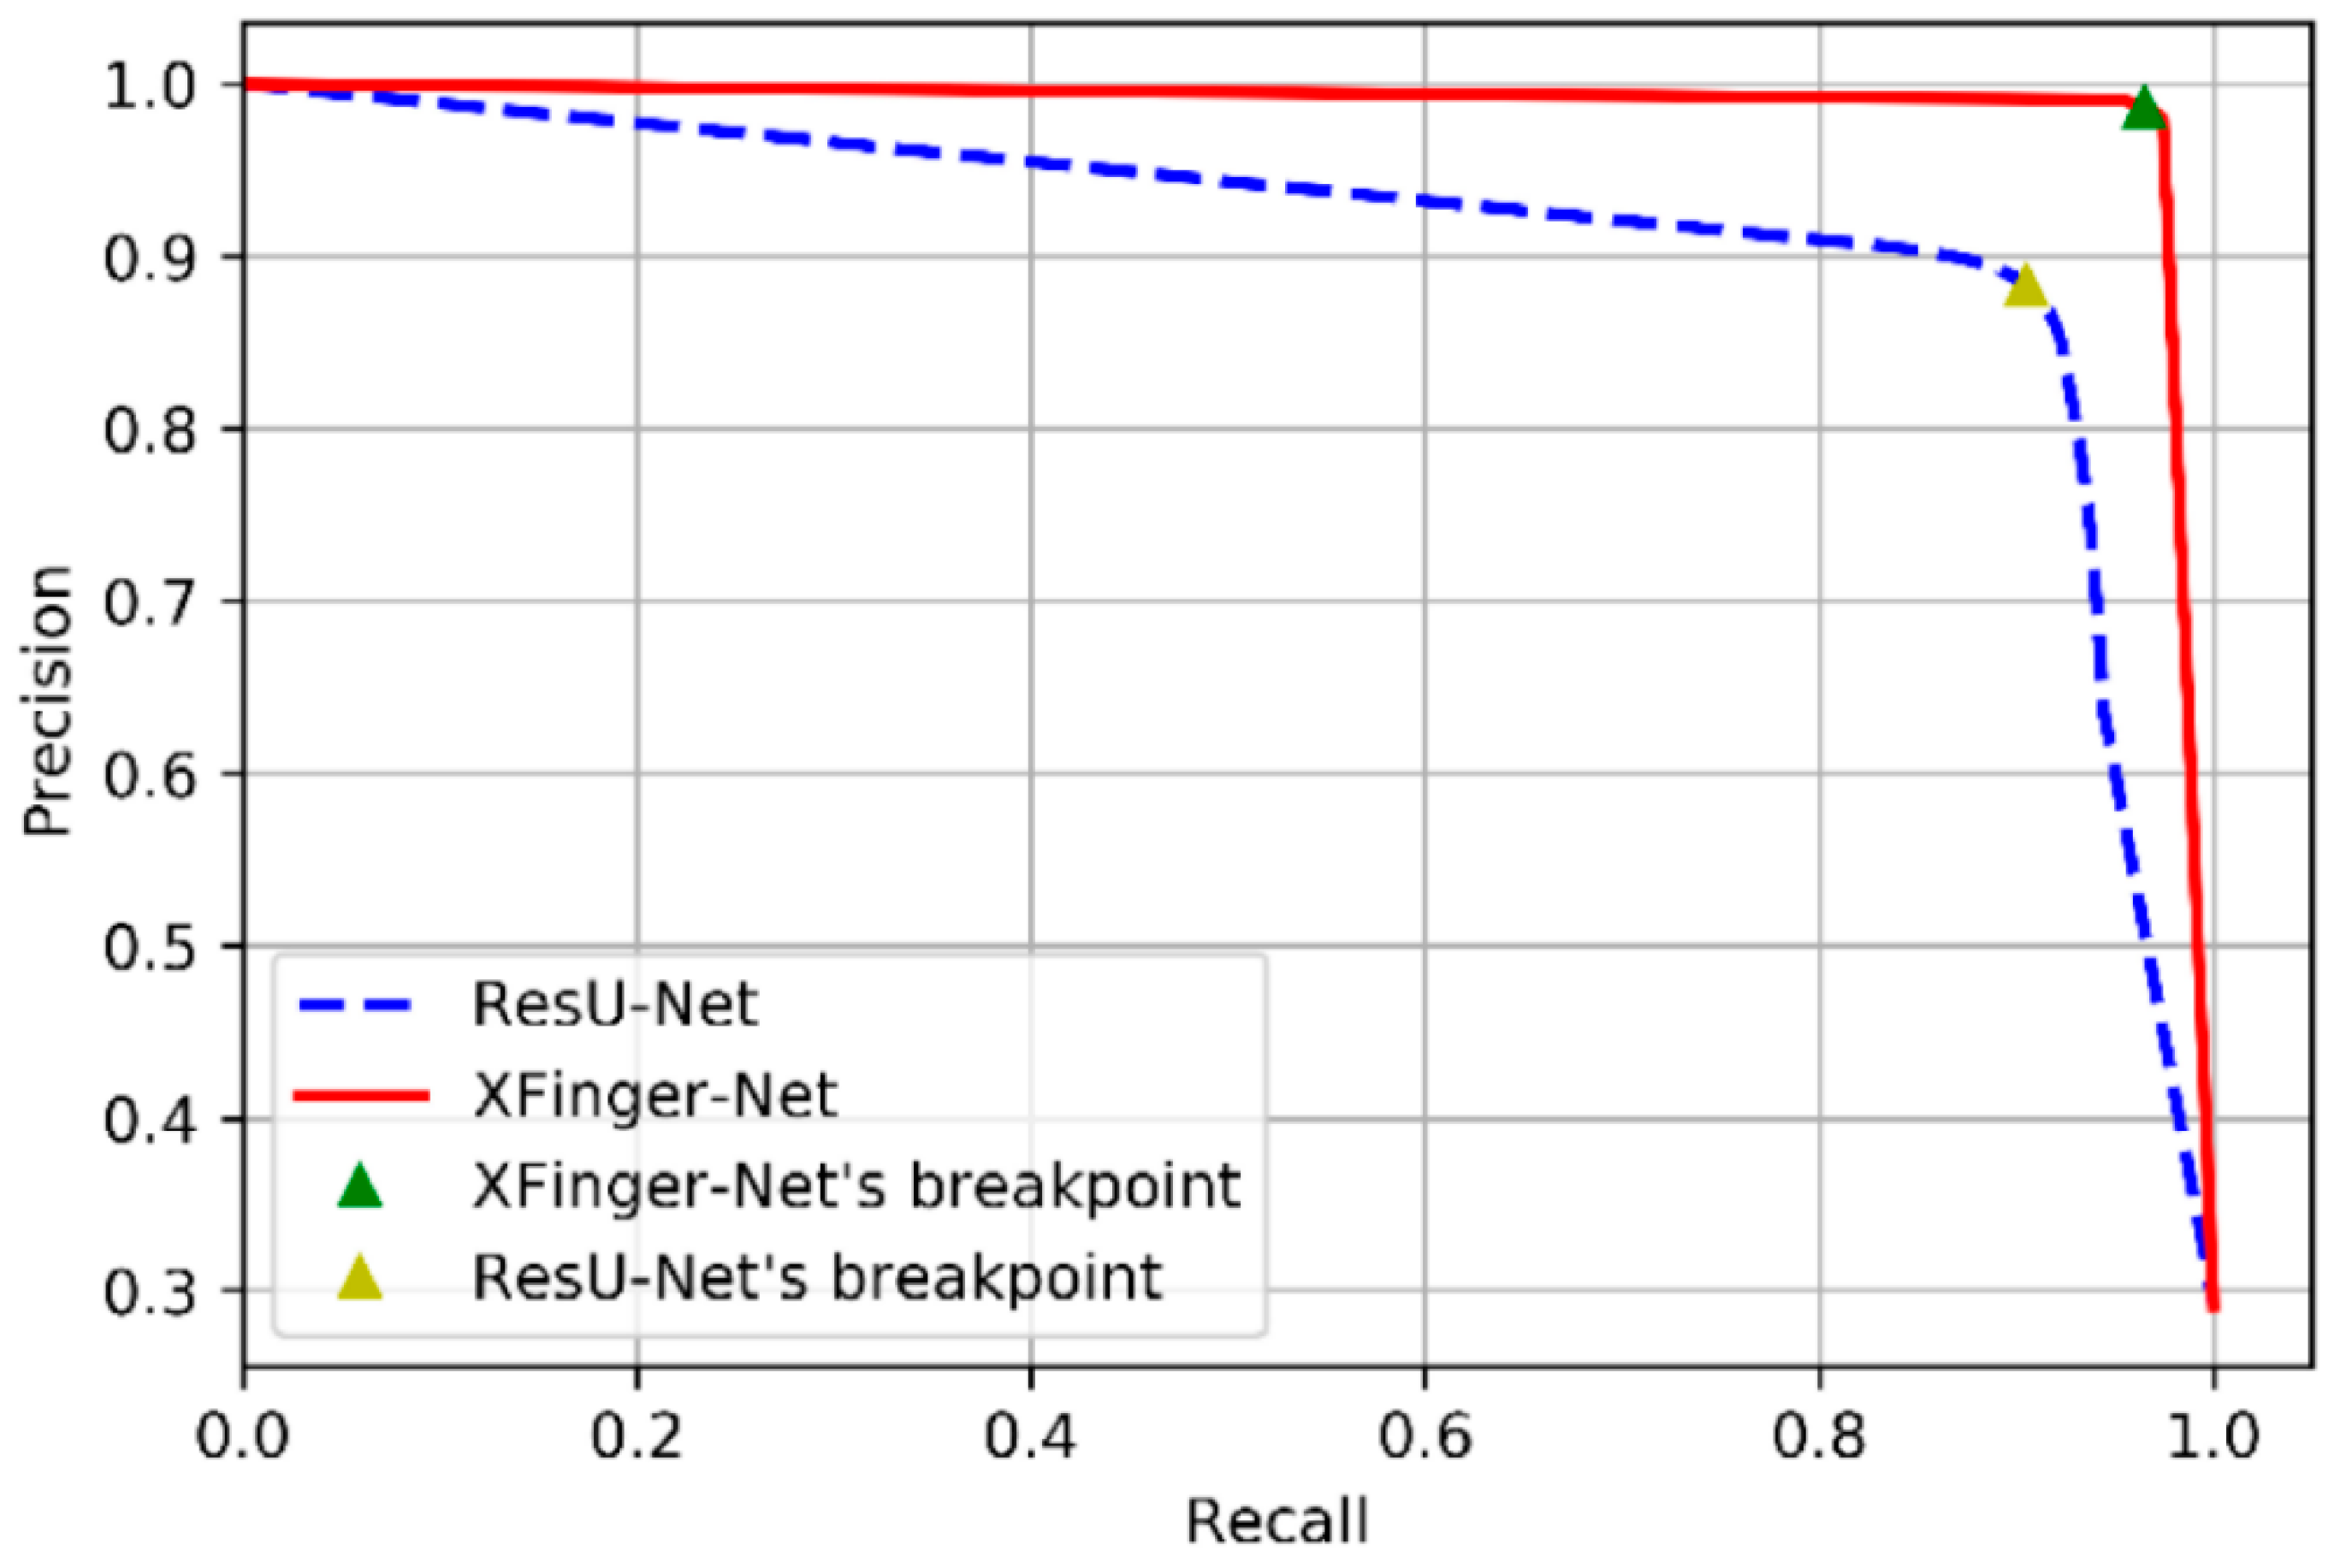
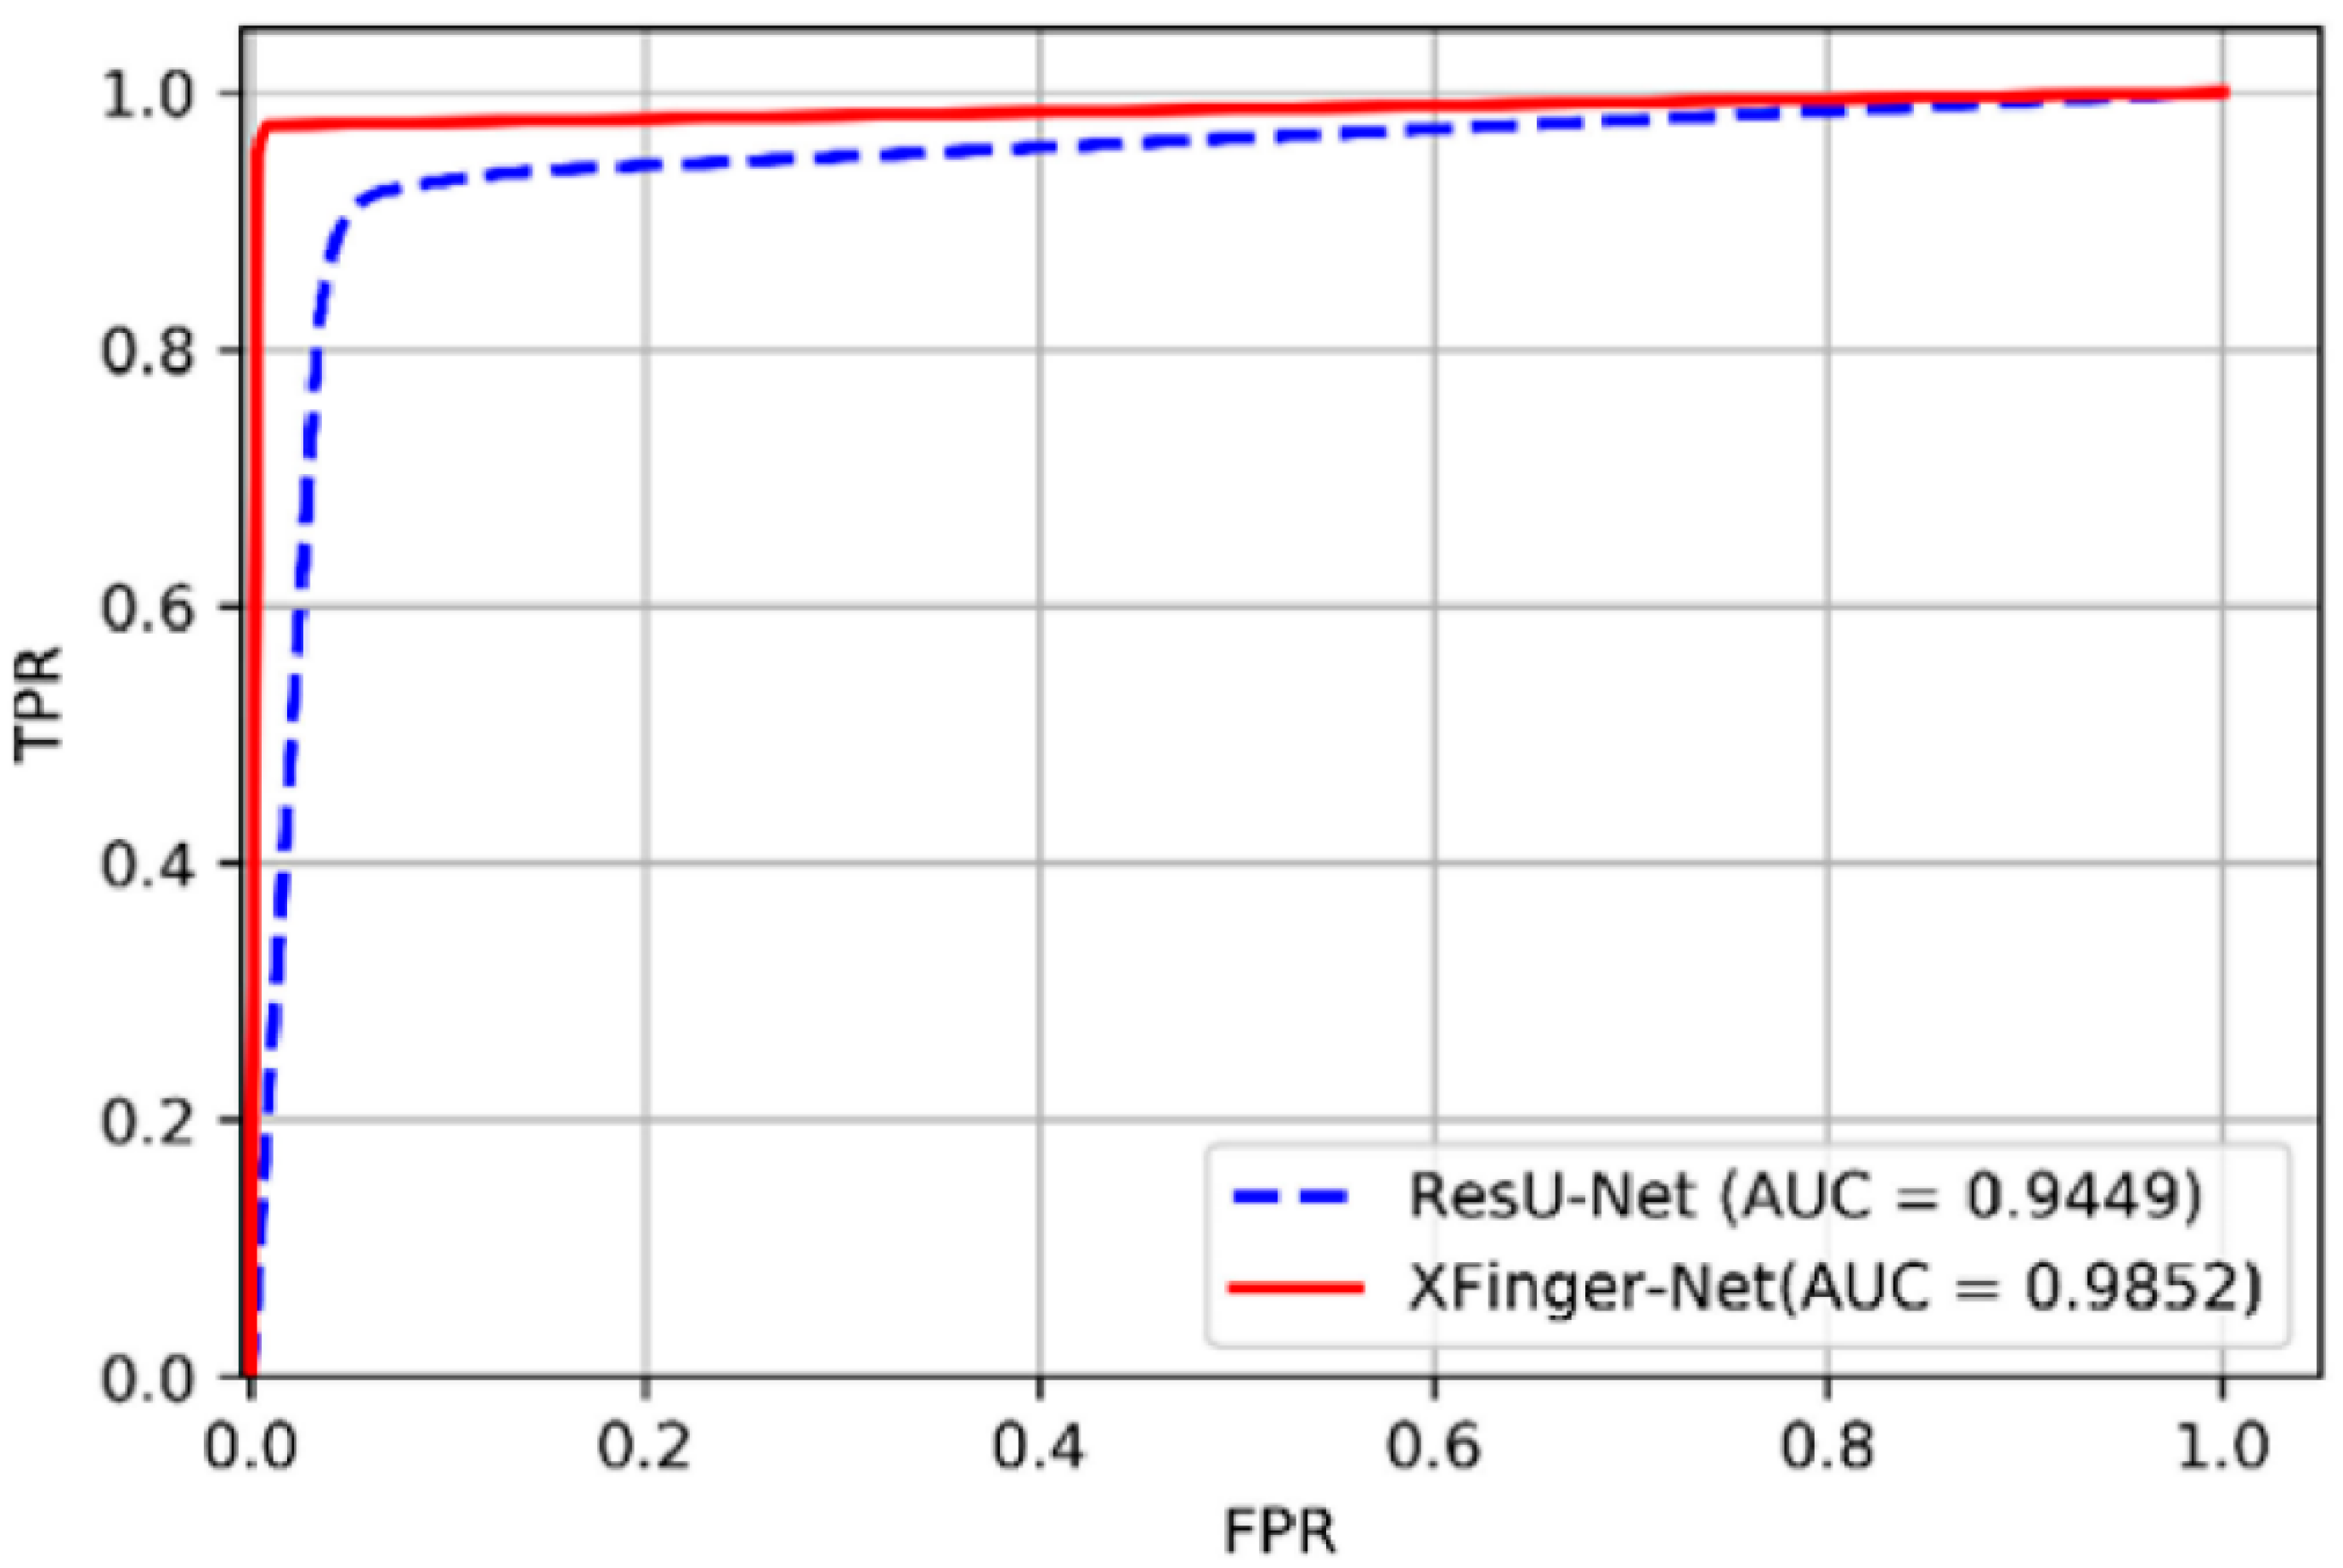
3.1. Performance Metrics
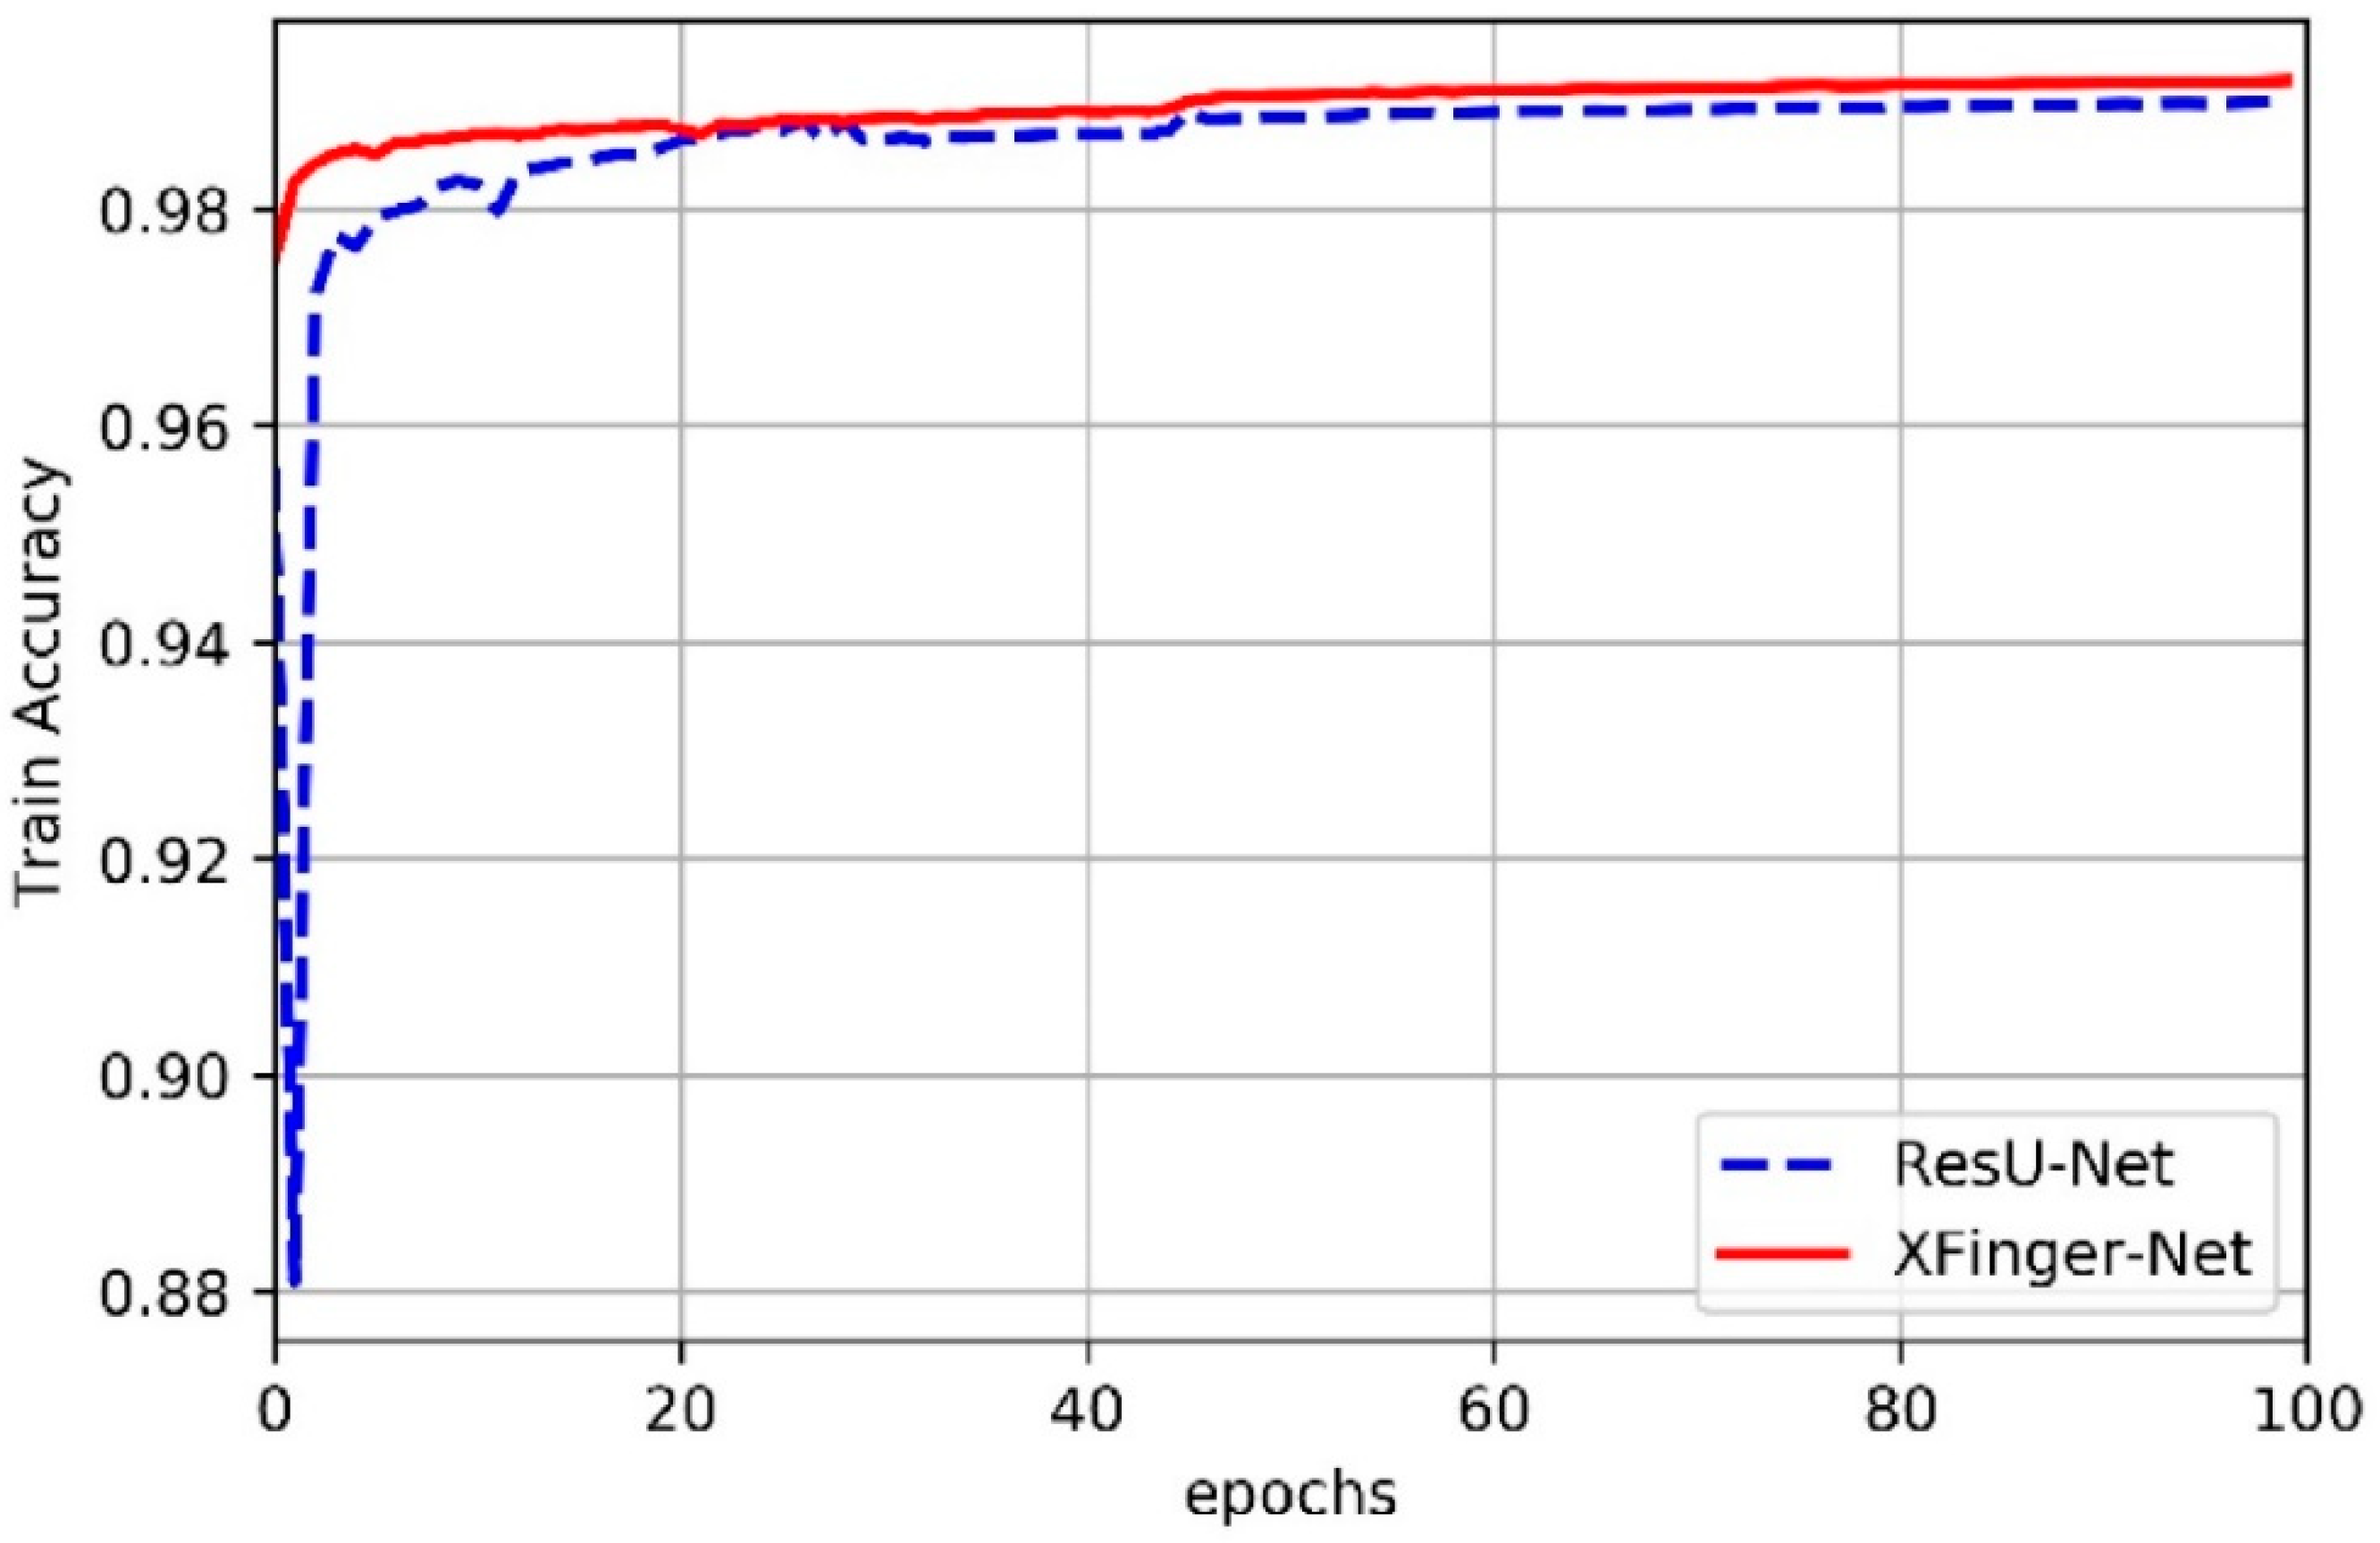
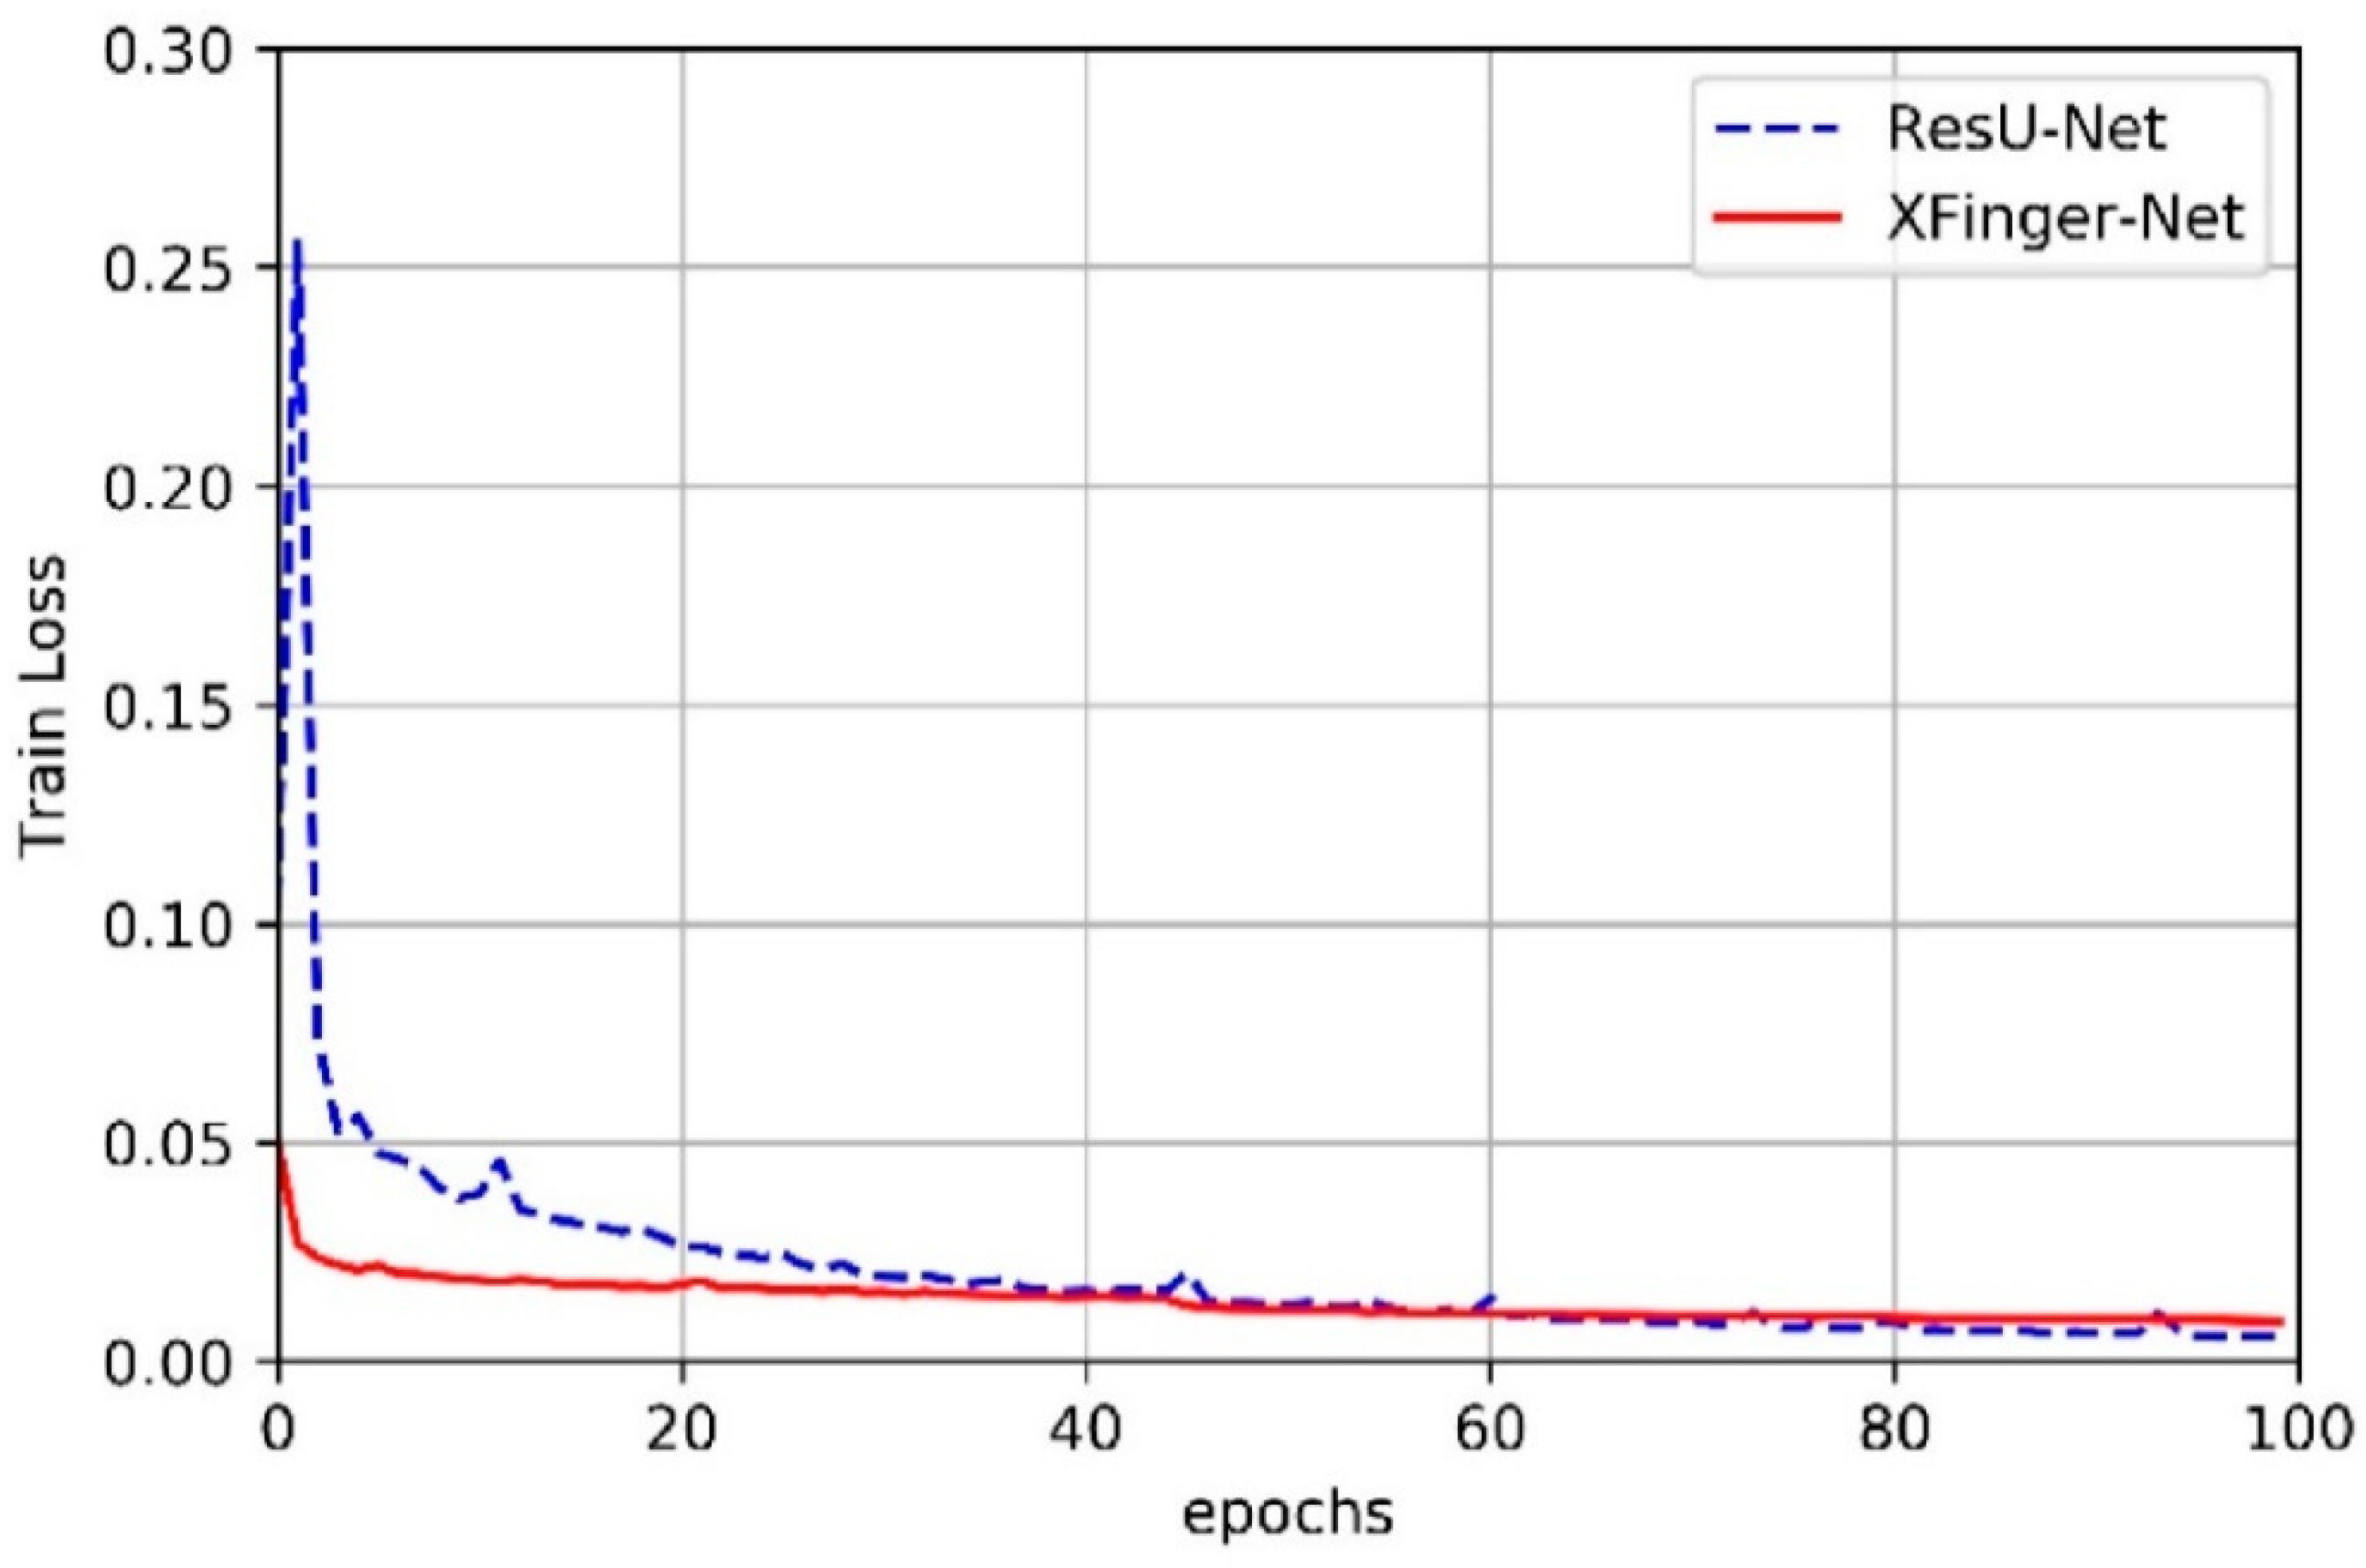
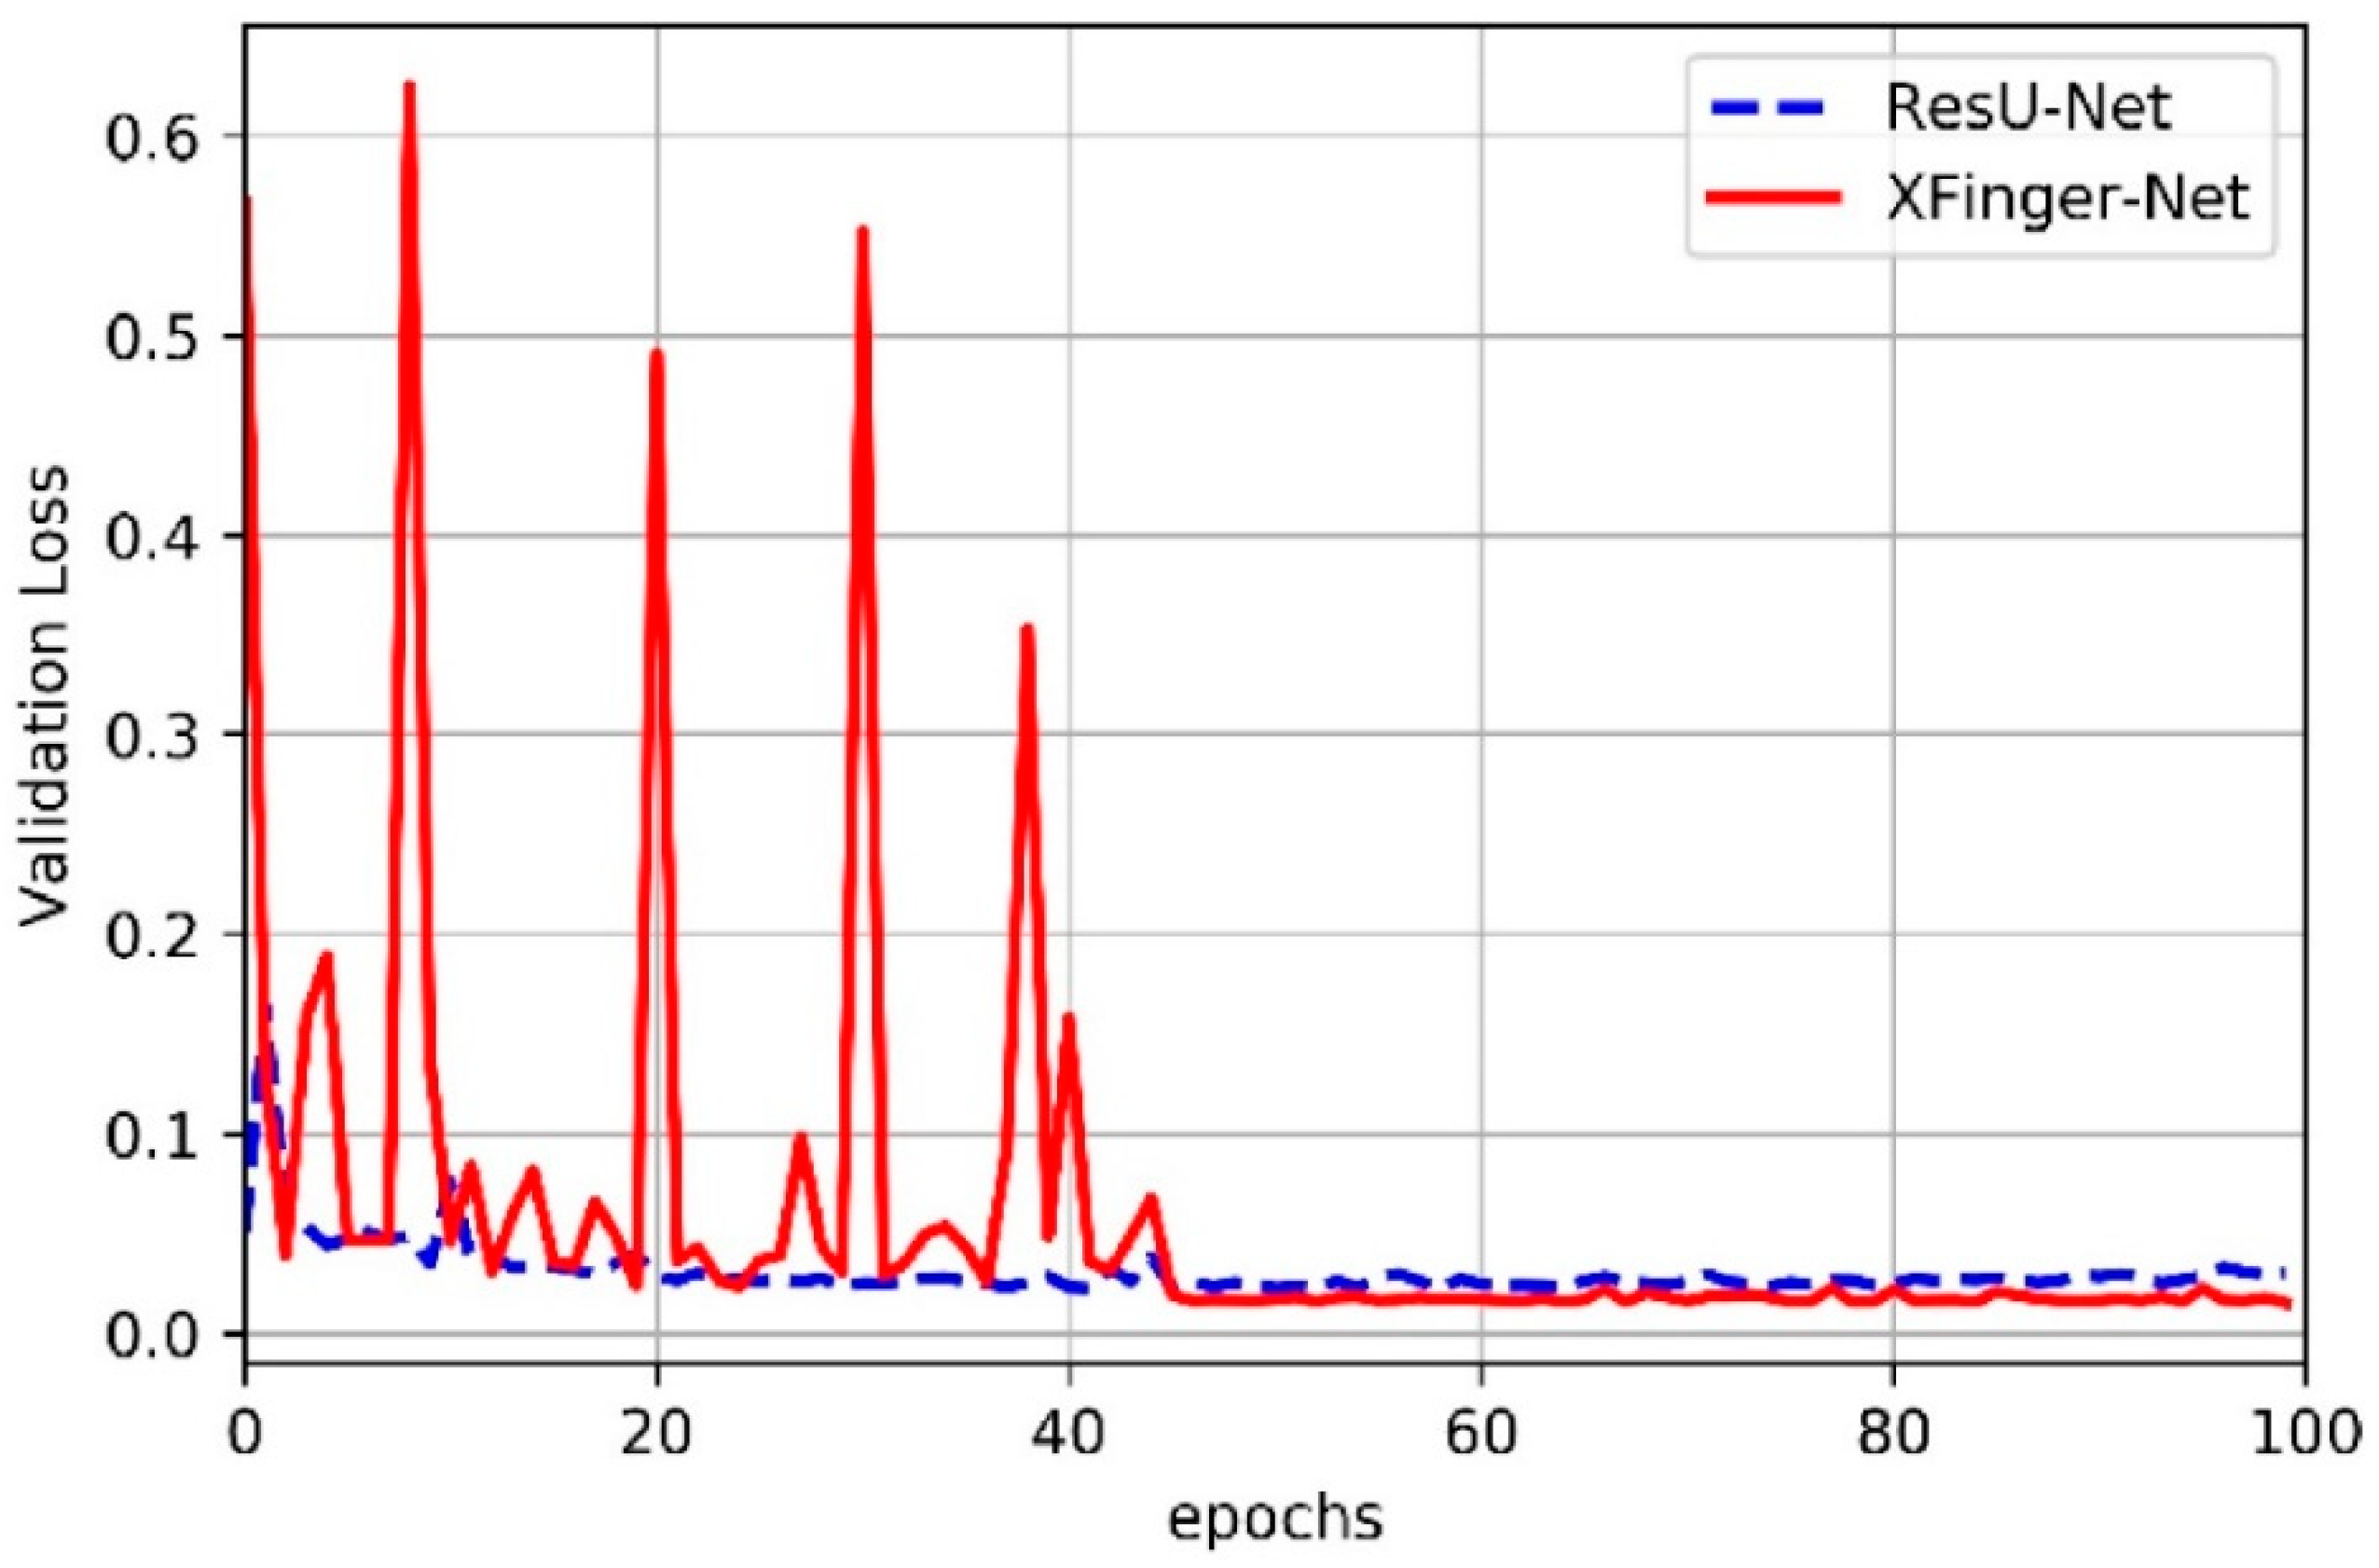
3.2. Train of XFinger-Net and ResU-net
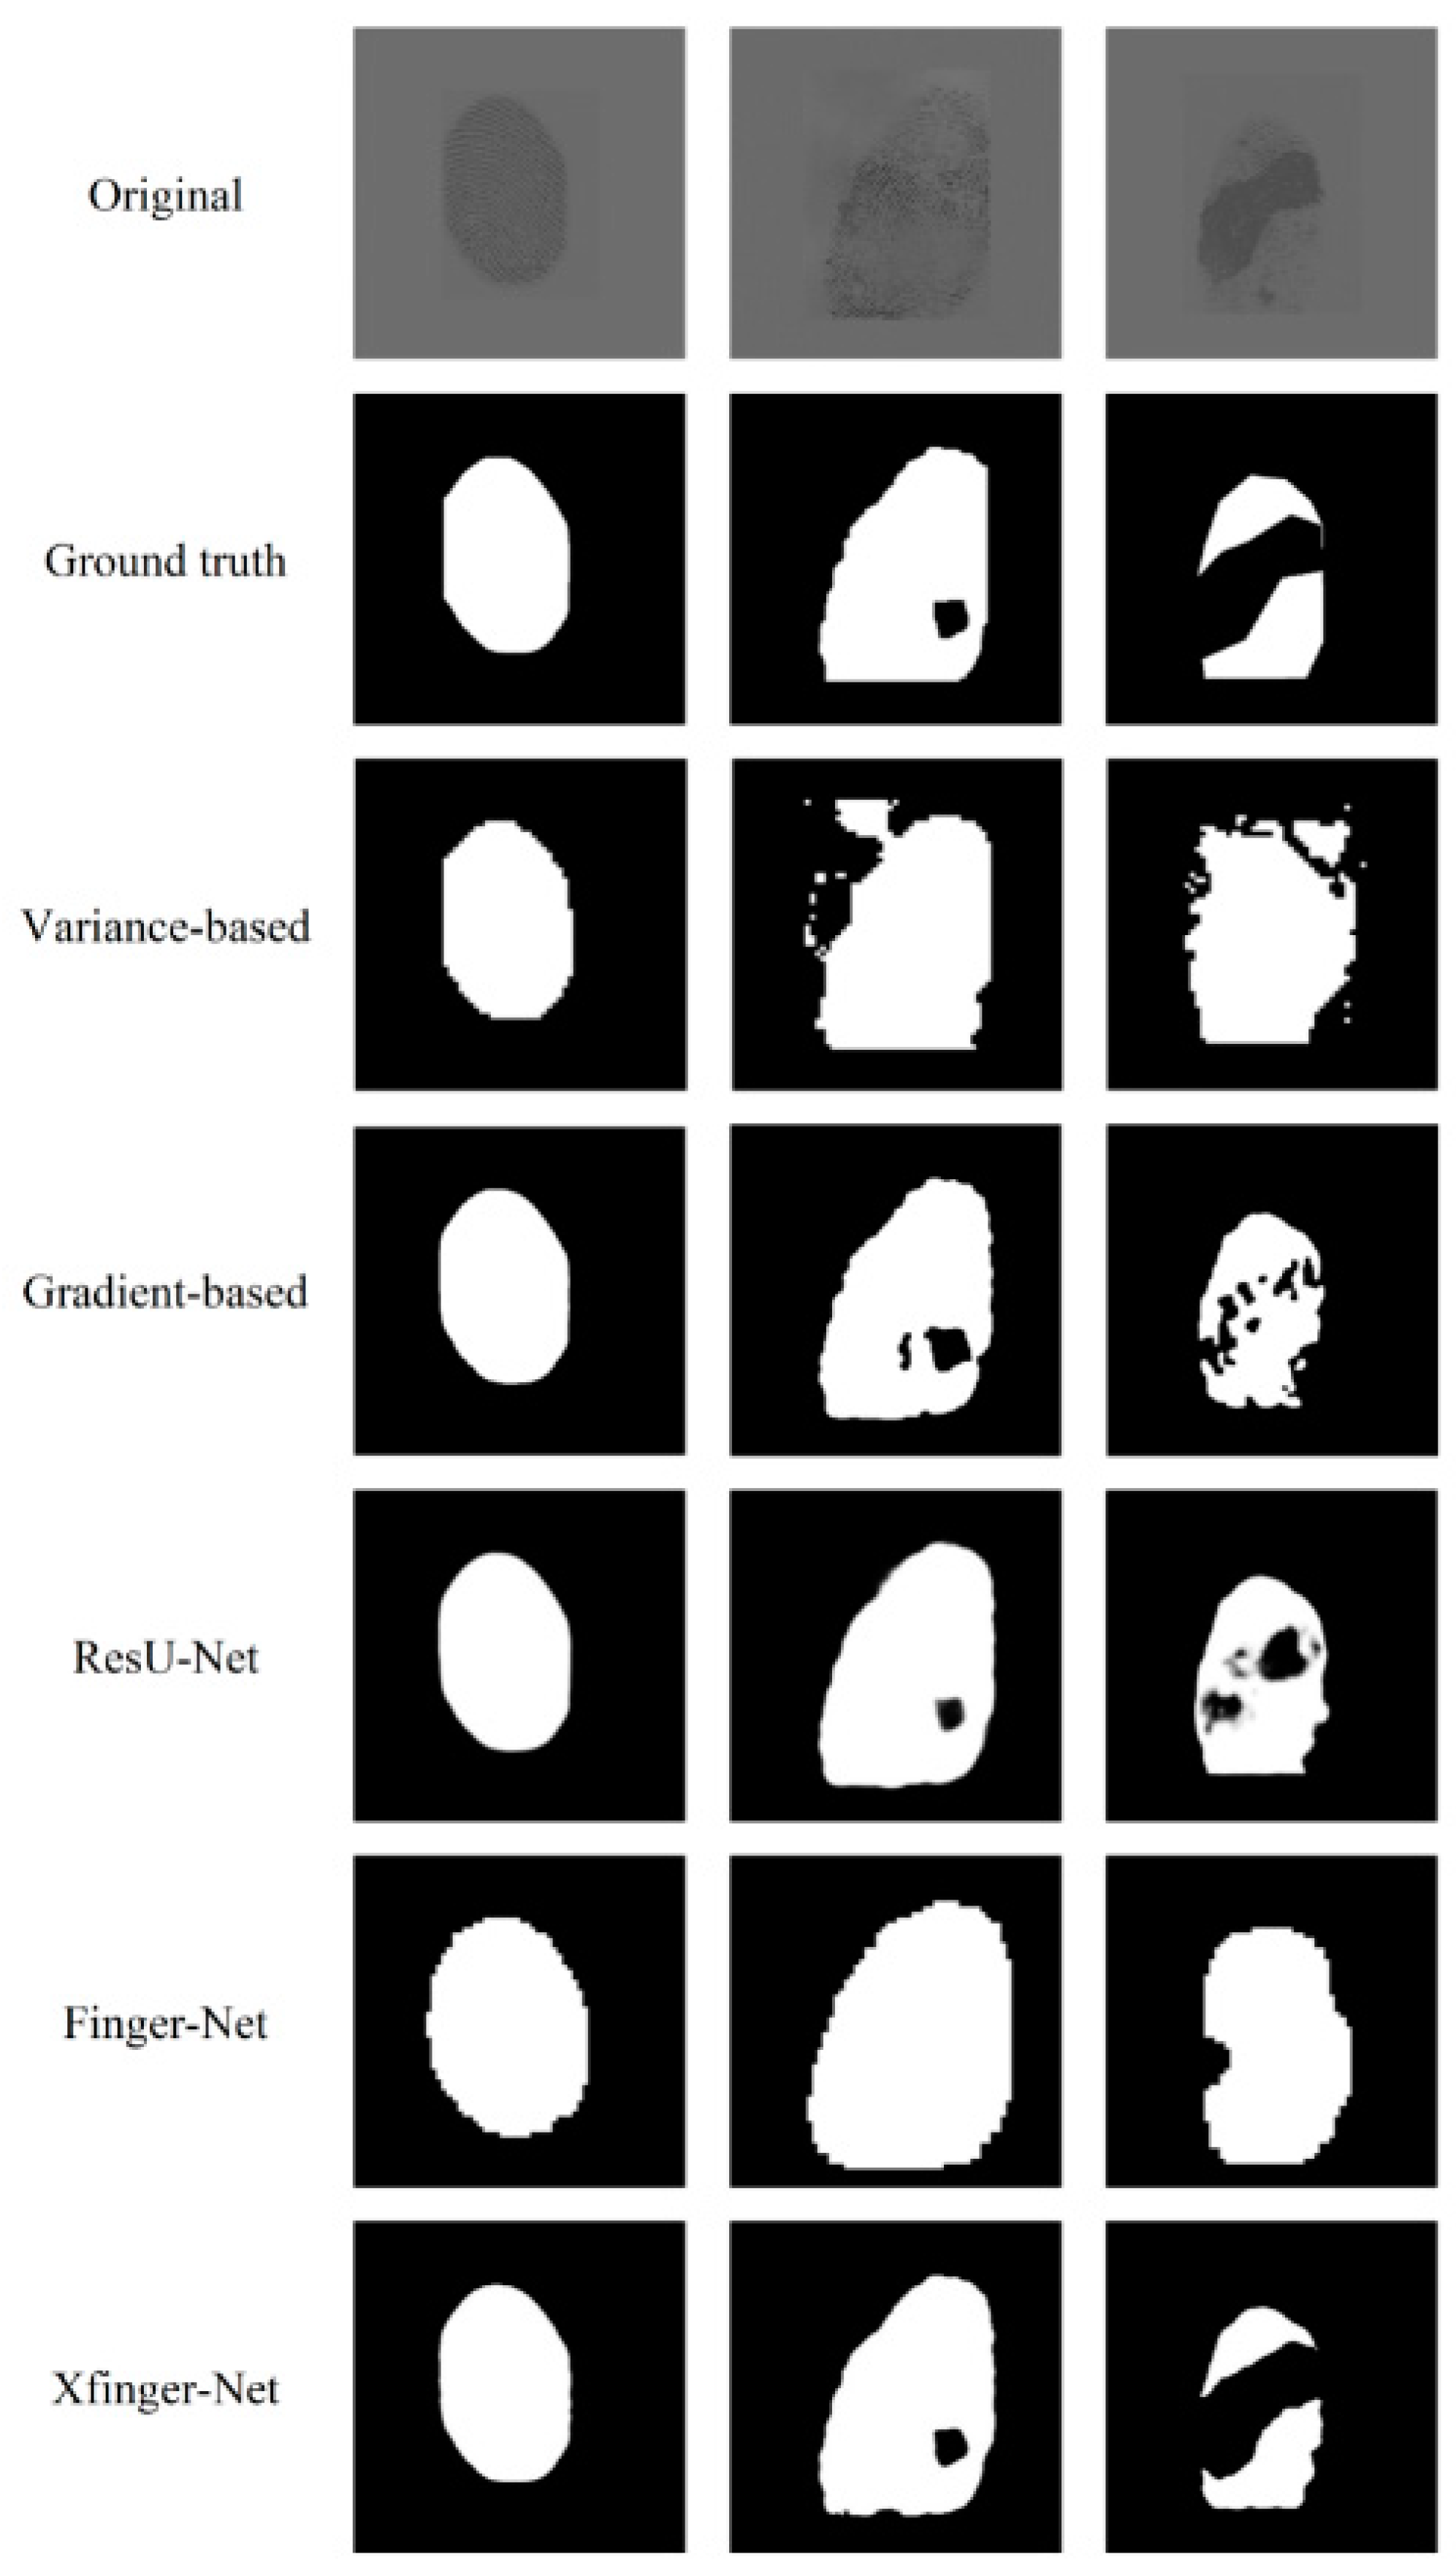
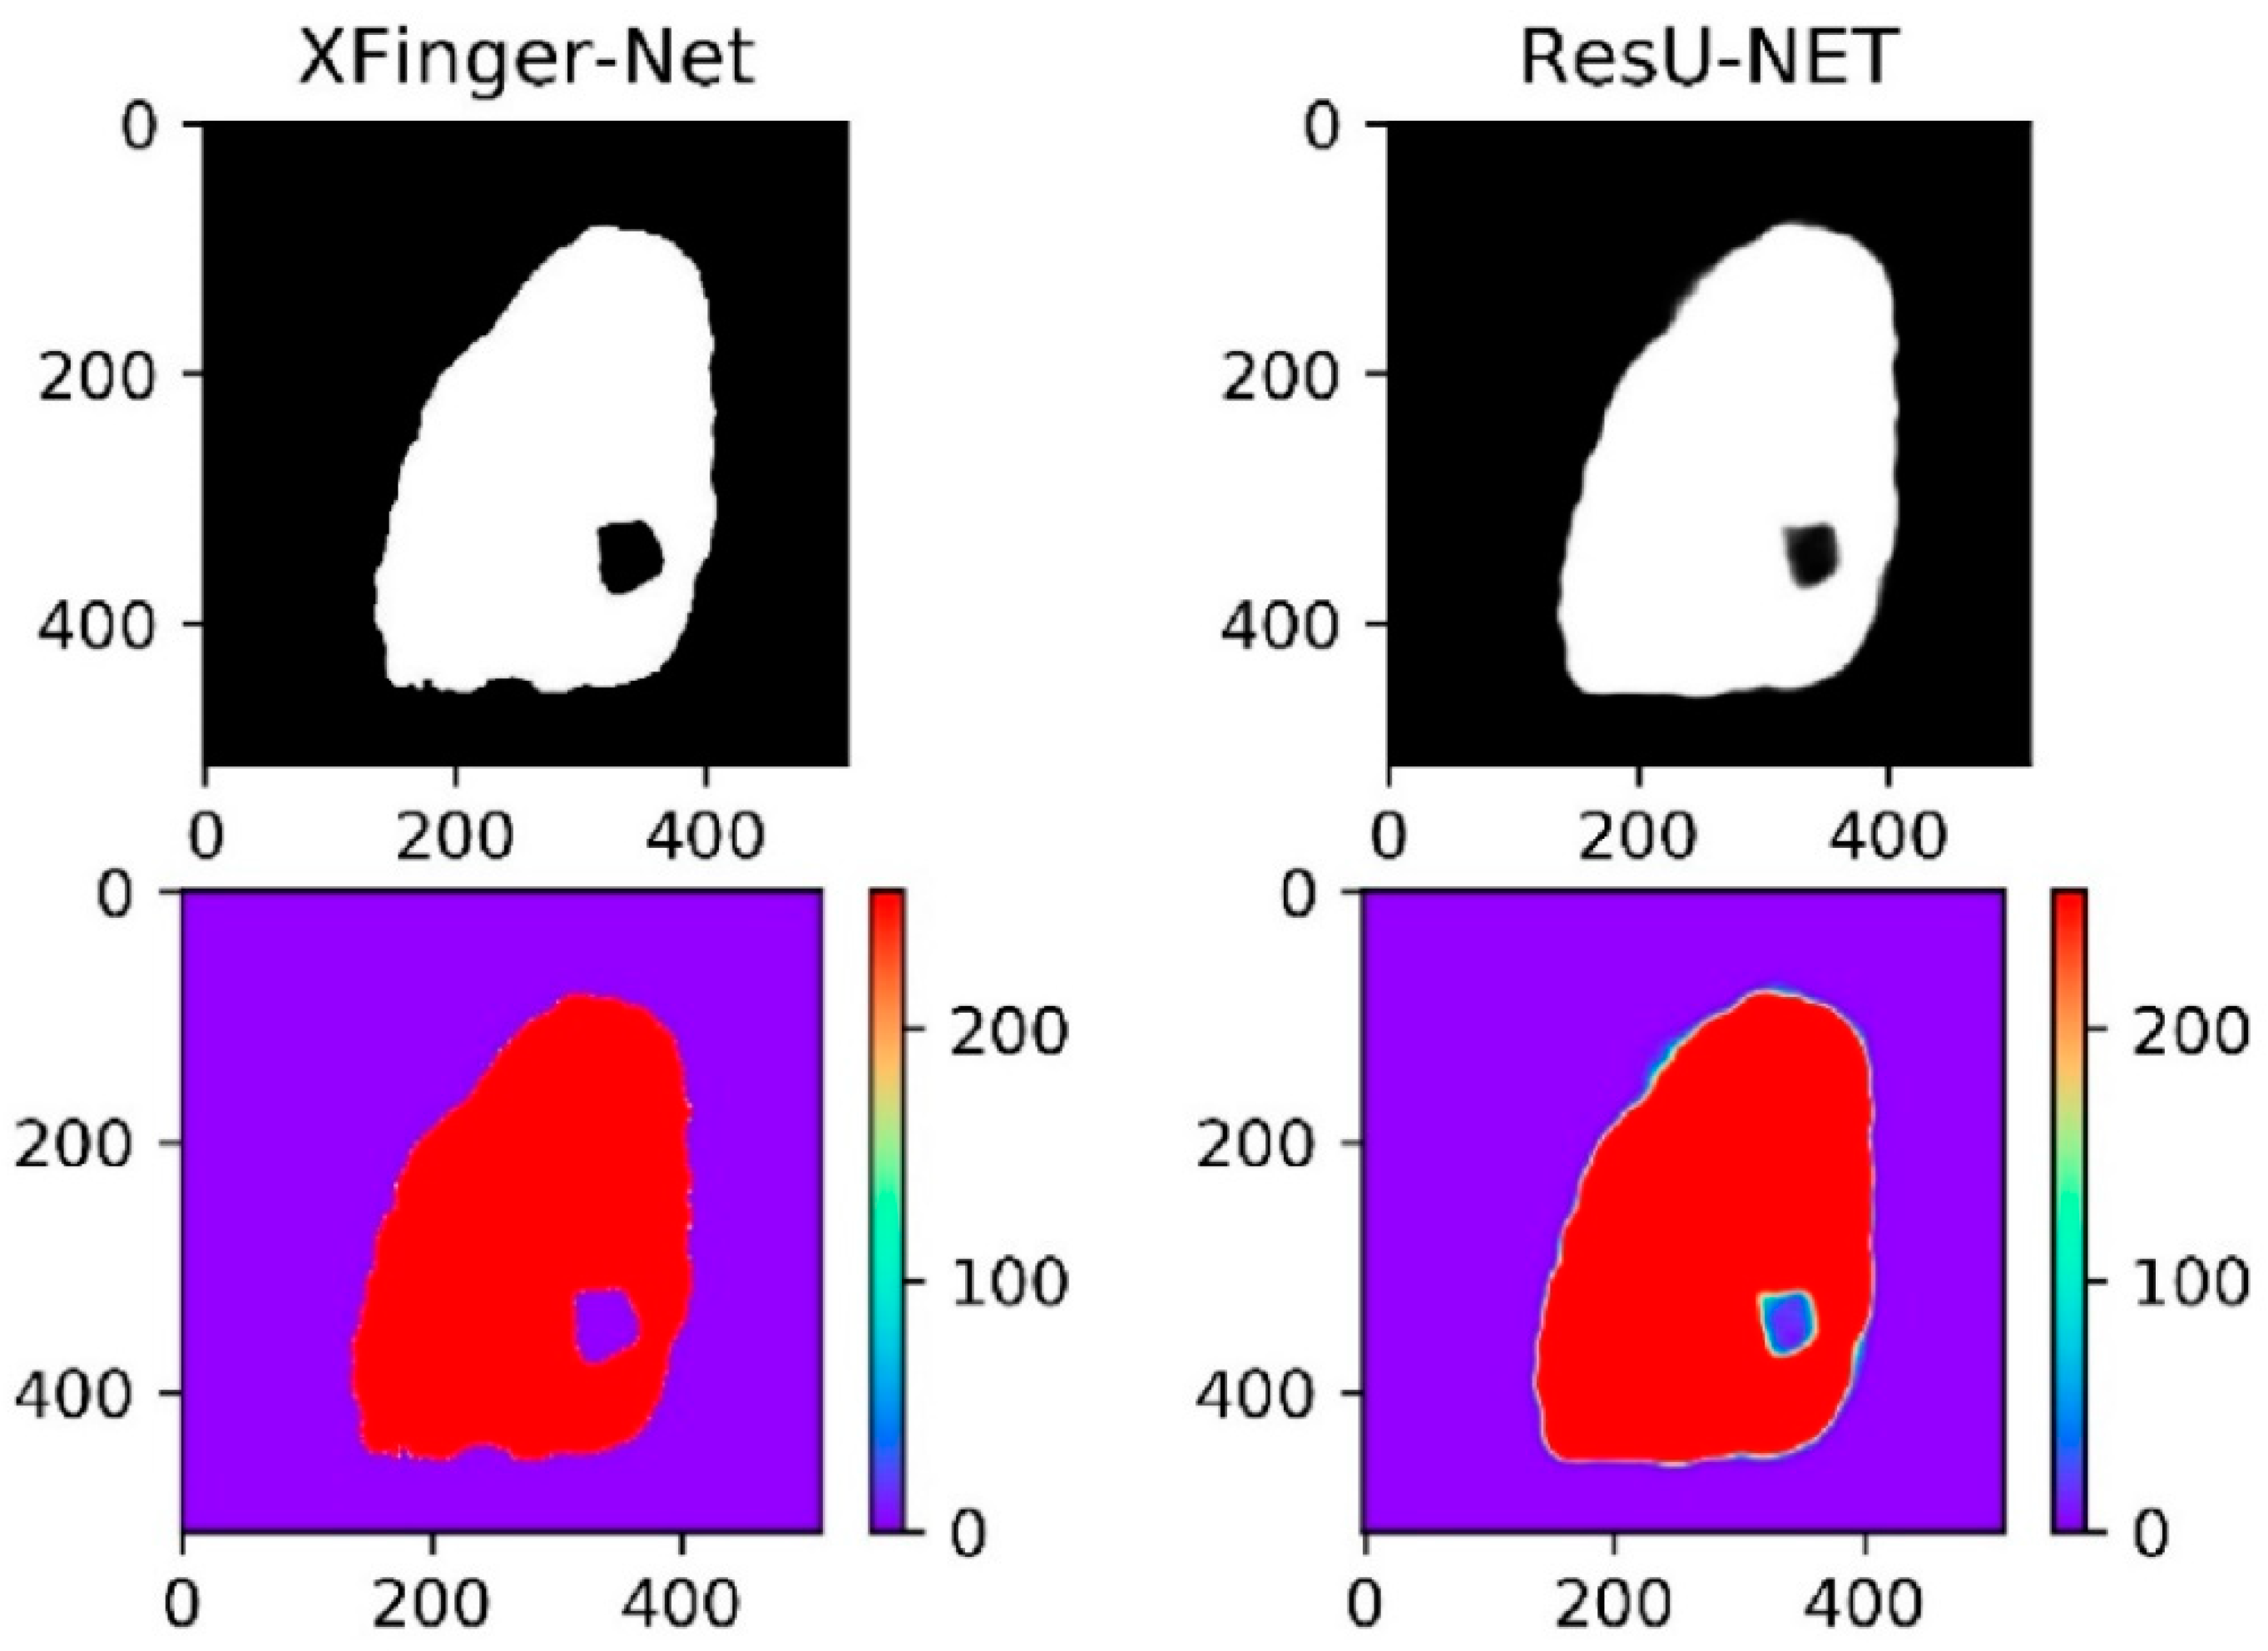
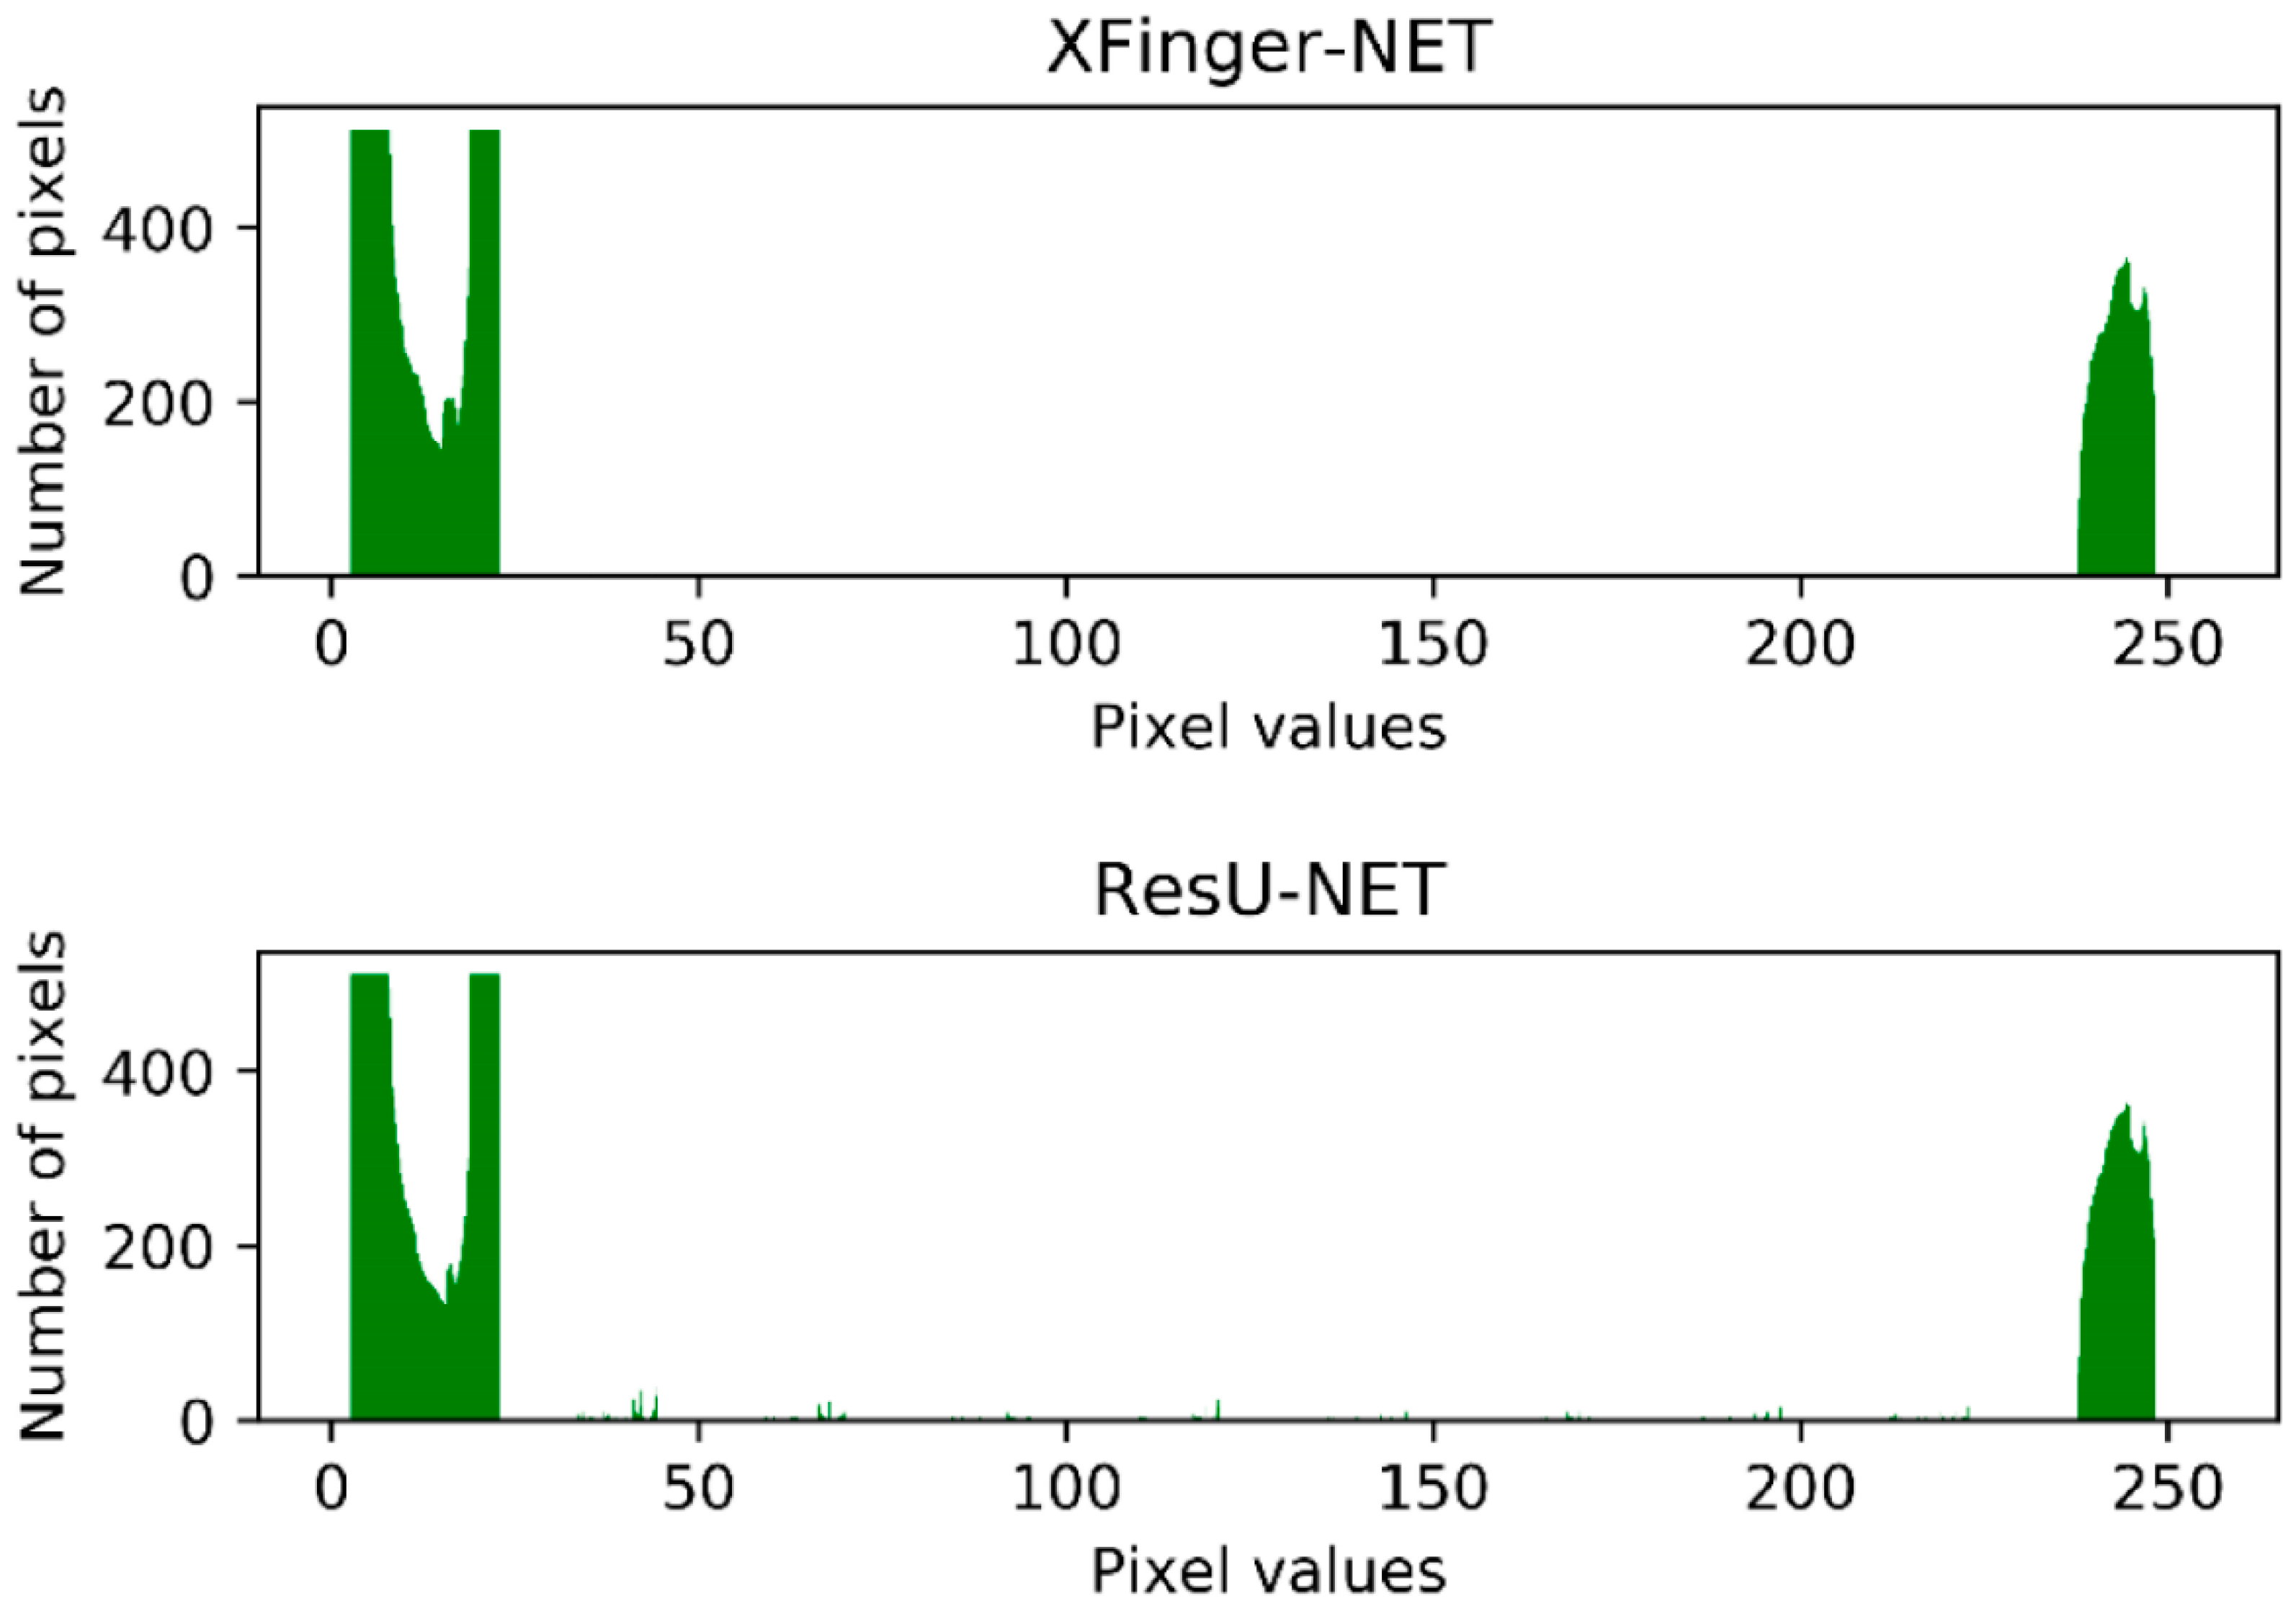
3.3. Test Results and Comparison of XFinger-Net, ResU-Net, Gradient-Based Methods
4. Conclusions
Author Contributions
Funding
Conflicts of Interest
References
- Maltoni, D.; Maio, D.; Jain, A.K.; Prabhakar, S. Handbook of Fingerprint Recognition; Springer Science and Business Media: New York, NY, USA, 2009. [Google Scholar]
- Prasad, K.; Aithal, P.S. fingerprint image segmentation: A review of state of the art techniques. Int. J. Manag. Technol. Soc. Sci. 2017, 2, 28–39. [Google Scholar]
- Ratha, N.K.; Chen, S.; Jain, A.K. Adaptive flow orientation-based feature extraction in fingerprint images. Pattern Recognit. 1995, 28, 1657–1672. [Google Scholar] [CrossRef]
- Bazen, A.M.; Gerez, S.H. Directional field computation for fingerprints based on the principal component analysis of local gradients. In Proceedings of the 11th Annual Workshop on Circuits, Systems and Signal Processing, Veldhoven, The Netherlands, 30 November–1 December 2000. [Google Scholar]
- Naji, A.W.; Ramli, A.R.; Ali, R. A segmentation algorithm based on histogram equalizer for fingerprint classification system. In Proceedings of the 2nd International Conference on Electrical and Computer Engineering, Dhaka, Bangladesh, 26–28 December 2002; pp. 390–393. [Google Scholar]
- Zhu, E.; Yin, J.; Hu, C.; Zhang, G. A systematic method for fingerprint ridge orientation estimation and image segmentation. Pattern Recognit. 2006, 39, 1452–1472. [Google Scholar] [CrossRef]
- Thai, D.H.; Huckermann, S.; Gottschich, C. Filter design and performance evaluation for fingerprint image segmentation. PLoS ONE 2016, 11, e0154160. [Google Scholar] [CrossRef] [PubMed]
- Nguyen, D.; Cao, K.; Jain, A.K. Robust Minutiae Extractor: Integrating Deep Networks and Fingerprint Domain Knowledge. In Proceedings of the 2018 International Conference on Biometrics (ICB), Gold Coast, QLD, Australia, 20–23 February 2018; pp. 9–16. [Google Scholar] [CrossRef]
- Serafim, P.B.S.; Medeiros, A.G.; Rego, P.A.; Maia, J.G.R.; Trinta, F.; Maia, M.E.F.; Fernandes de Macedo, J.A.; Lira Vieira Lira Neto, A. A method based on convolutional neural networks for fingerprint segmentation. In Proceedings of the 2019 International Joint Conference on Neural Networks, Budapest, Hungary, 14–19 July 2019; pp. 1–8. [Google Scholar]
- Wang, F.; Jiang, M.; Qian, C.; Yang, S.; Li, C.; Zhang, H.; Wang, X.; Tang, X. Residual Attention Network for Image Classification. In Proceedings of the IEEE Conference on Computer Vision and Pattern Recognition, Honolulu, HI, USA, 21–26 July 2017; pp. 3156–3164. [Google Scholar]
- Chen, L.C.; Yang, Y.; Wang, J.; Xu, W.; Yuille, A.L. Attention to Scale: Scale-Aware Semantic Image Segmentation. In Proceedings of the IEEE Conference on Computer Vision and Pattern Recognition, Las Vegas, NV, USA, 26 June–1 July 2016; pp. 3640–3649. [Google Scholar]
- Zhou, Z.; Siddiquee, M.M.R.; Tajbakhsh, N.; Liang, J. Unet++: A nested u-net architecture for medical image segmentation. In Deep Learning in Medical Image Analysis and Multimodal Learning for Clinical Decision Support; Springer: Cham, Germany, 2018; pp. 3–11. [Google Scholar]
- Maio, D.; Maltoni, D.; Cappelli, R.; Wayman, J. FVC2000: Fingerprint Verification Competition; Tech. Report; DEIS, University of Bologna: Bologna, Italy, September 2000. [Google Scholar]
- Maio, D.; Maltoni, D.; Cappelli, R.; Wayman, J.; Jain, A.K. FVC2000: Fingerprint verification competition. IEEE Trans. Pattern Anal. Mach. Intell. 2002, 24, 402–412. [Google Scholar] [CrossRef]
- Maio, D.; Maltoni, D.; Cappelli, R.; Wayman, J.L.; Jain, A.K. FVC2002: Second fingerprint verification competition. Proc. Int. Conf. Pattern Recognit. 2002, 14, 4–20. [Google Scholar]
- Maio, D.; Maltoni, D.; Cappelli, R.; Wayman, J.L.; Jain, A.K. FVC2004: Third fingerprint verification competition. Proc. Int. Conf. Biom. Authent. 2004, 3072, 1–7. [Google Scholar]
- Ghiani, L.; Yambay, D.; Mura, V.; Tocco, S.; Marcialis, G.L.; Roli, F.; Schuckers, S. LivDet 2013-Fingerprint Liveness Detection Competition 2013. In Proceedings of the 2013 6th IAPR/IEEE International Conference on Biometrics, Madrid, Spain, 4–7 June 2013. [Google Scholar]
- Yambay, D.; Ghiani, L.; Denti, P.; Marcialis, G.L.; Roli, F.; Schuckers, S. LivDet 2011-Fingerprint Liveness Detection Competition 2011. In Proceedings of the 2012 5th IAPR International Conference on Biometrics, New Delhi, India, 29 March–1 April 2012; pp. 208–215. [Google Scholar]
- Marcialis, G.L.; Lewicke, A.; Tan, B.; Coli, P.; Roli, F.; Grimberg, D.; Congiu, A.; Tidu, A.; Schuckers, S.; The LivDet 2009 Group. First International Fingerprint Liveness Detection Competition LivDet 2009. In Proceedings of the ICIAP, Vietri sul Mare, Italy, 8–11 September 2009. [Google Scholar]
- Hong, L.; Wan, Y.; Jain, A.K. Fingerprint image enhancement: Algorithms and performance evaluation. IEEE Trans. Pattern Anal. Mach. Intell. 1998, 20, 777–789. [Google Scholar] [CrossRef]
- Wei, L. Proficient in Visual C++ Fingerprint Pattern Recognition System Algorithm and Implementation; People’s Posts and Telecommunications Press: Beijing, China, 2008. [Google Scholar]
- Jaderberg, M.; Simonyan, K.; Zisserman, A. Spatial transformer networks. Advances Neural Information Processing Systems; NIPS: Red Hook, NY, USA, 2015; pp. 2017–2025. [Google Scholar]
- Ronneberger, O.; Fischer, P.; Brox, T. U-net: Convolutional networks for biomedical image segmentation. In Proceedings of the International Conference on Medical Image Computing and Computer-Assisted Intervention, Munich, Germany, 5–9 October 2015; pp. 234–241. [Google Scholar]
- He, K.; Zhang, X.; Ren, S.; Sun, J. Deep residual learning for image recognition. In Proceedings of the IEEE Conference on Computer Vision and Pattern Recognition, Las Vegas, NV, USA, 27–30 June 2016; pp. 770–778. [Google Scholar]
- Jetley, S.; Lord, N.A.; Lee, N.; Torr, P.H. Learn to pay attention. arXiv 2018, arXiv:1804.02391. (preprint arXiv:1804.02391). [Google Scholar]
- Milletari, F.; Navab, N.; Ahmadi, S.A. V-net: Fully convolutional neural networks for volumetric medical image segmentation. In Proceedings of the 2016 Fourth International Conference on 3D Vision, Stanford, CA, USA, 25–28 October 2016; pp. 565–571. [Google Scholar]
- Mabadi, A.; Agarwal, A.; Barham, P.; Brevdo, E.; Chen, Z.; Citro, C.; Corrado, G.S.; Davis, A.; Dean, J.; Devin, M.; et al. TensorFlow: Large-scale machine learning on heterogeneous distributed systems. arXiv 2015, arXiv:1603.04467. (preprint at arXiv:1603.04467). [Google Scholar]
- Zhang, Z.; Liu, Q.; Wang, Y. Road extraction by deep residual unet. IEEE Geosci. Remote Sens. Lett. 2018, 15, 749–753. [Google Scholar] [CrossRef]
- Tang, Y.; Gao, F.; Feng, J.; Liu, Y. FingerNet: An unified deep network for fingerprint minutiae extraction. In Proceedings of the 2017 IEEE International Joint Conference on Biometrics, Denver, CO, USA, 1–4 October 2017; pp. 108–116. [Google Scholar]
- Zhou, Z.H. Machine Learning; Tsinghua University Press: Beijing, China, 2016. [Google Scholar]


| FVC | LiveDet | Liver20 |
|---|---|---|
 |  |  |
 |  |  |
| Layer | Outsize | Layer | Outsize | Layer | Outsize |
|---|---|---|---|---|---|
| INPUT | 512 512 1 | SIGMOID | 512 512 1 | ||
| CONV1 | 512 512 32 | CONV2 | 512 512 32 | ||
| MAXPOOL1 | 256 256 32 | UPSAMPLE5 | 512 512 32 | ||
| RES-UNIT1 | 256 256 32 | AG1 | 256 256 32 | RES-UNIT9 | 256 256 32 |
| MAXPOOL2 | 128 128 32 | UPSAMPLE4 | 128 128 64 | ||
| RES-UNIT2 | 128 128 64 | AG2 | 128 128 64 | RES-UNIT8 | 128 128 64 |
| MAXPOOL3 | 64 64 64 | UPSAMPLE3 | 128 128 128 | ||
| RES-UNIT3 | 64 64 128 | AG3 | 64 64 128 | RES-UNIT7 | 64 64 128 |
| MAXPOOL4 | 32 32 128 | UPSAMPLE2 | 64 64 256 | ||
| RES-UNIT4 | 32 32 256 | AG4 | 32 32 256 | RES-UNIT6 | 32 32 256 |
| MAXPOOL5 | 16 16 256 | UPSAMPLE1 | 32 32 512 | ||
| RES-UNIT5 | 16 16 512 |
| Original | Truth | Predict | Original | Truth | Predict |
|---|---|---|---|---|---|
 | |||||
| Original | Truth | Predict | Original | Truth | Predict |
|---|---|---|---|---|---|
 | |||||
| Method | Accuracy | Recall | Specificity | Precision | AUC | F1 Score | Dice Coefficient |
|---|---|---|---|---|---|---|---|
| XFinger-Net | 0.9859 | 0.9649 | 0.9945 | 0.9863 | 0.9852 | 0.9755 | 0.9841 |
| ResU-Net | 0.9371 | 0.9050 | 0.9504 | 0.8831 | 0.9449 | 0.8939 | 0.8921 |
| FingerNet | 0.9287 | / | / | / | / | / | / |
| Gradient-Based | 0.8816 | / | / | / | / | / | / |
| Variance-Based | 0.8351 | / | / | / | / | / | / |
© 2020 by the authors. Licensee MDPI, Basel, Switzerland. This article is an open access article distributed under the terms and conditions of the Creative Commons Attribution (CC BY) license (http://creativecommons.org/licenses/by/4.0/).
Share and Cite
Wan, G.C.; Li, M.M.; Xu, H.; Kang, W.H.; Rui, J.W.; Tong, M.S. XFinger-Net: Pixel-Wise Segmentation Method for Partially Defective Fingerprint Based on Attention Gates and U-Net. Sensors 2020, 20, 4473. https://doi.org/10.3390/s20164473
Wan GC, Li MM, Xu H, Kang WH, Rui JW, Tong MS. XFinger-Net: Pixel-Wise Segmentation Method for Partially Defective Fingerprint Based on Attention Gates and U-Net. Sensors. 2020; 20(16):4473. https://doi.org/10.3390/s20164473
Chicago/Turabian StyleWan, Guo Chun, Meng Meng Li, He Xu, Wen Hao Kang, Jin Wen Rui, and Mei Song Tong. 2020. "XFinger-Net: Pixel-Wise Segmentation Method for Partially Defective Fingerprint Based on Attention Gates and U-Net" Sensors 20, no. 16: 4473. https://doi.org/10.3390/s20164473
APA StyleWan, G. C., Li, M. M., Xu, H., Kang, W. H., Rui, J. W., & Tong, M. S. (2020). XFinger-Net: Pixel-Wise Segmentation Method for Partially Defective Fingerprint Based on Attention Gates and U-Net. Sensors, 20(16), 4473. https://doi.org/10.3390/s20164473