Wearable Biofeedback System to Induce Desired Walking Speed in Overground Gait Training

 , , , and
Abstract
1. Introduction
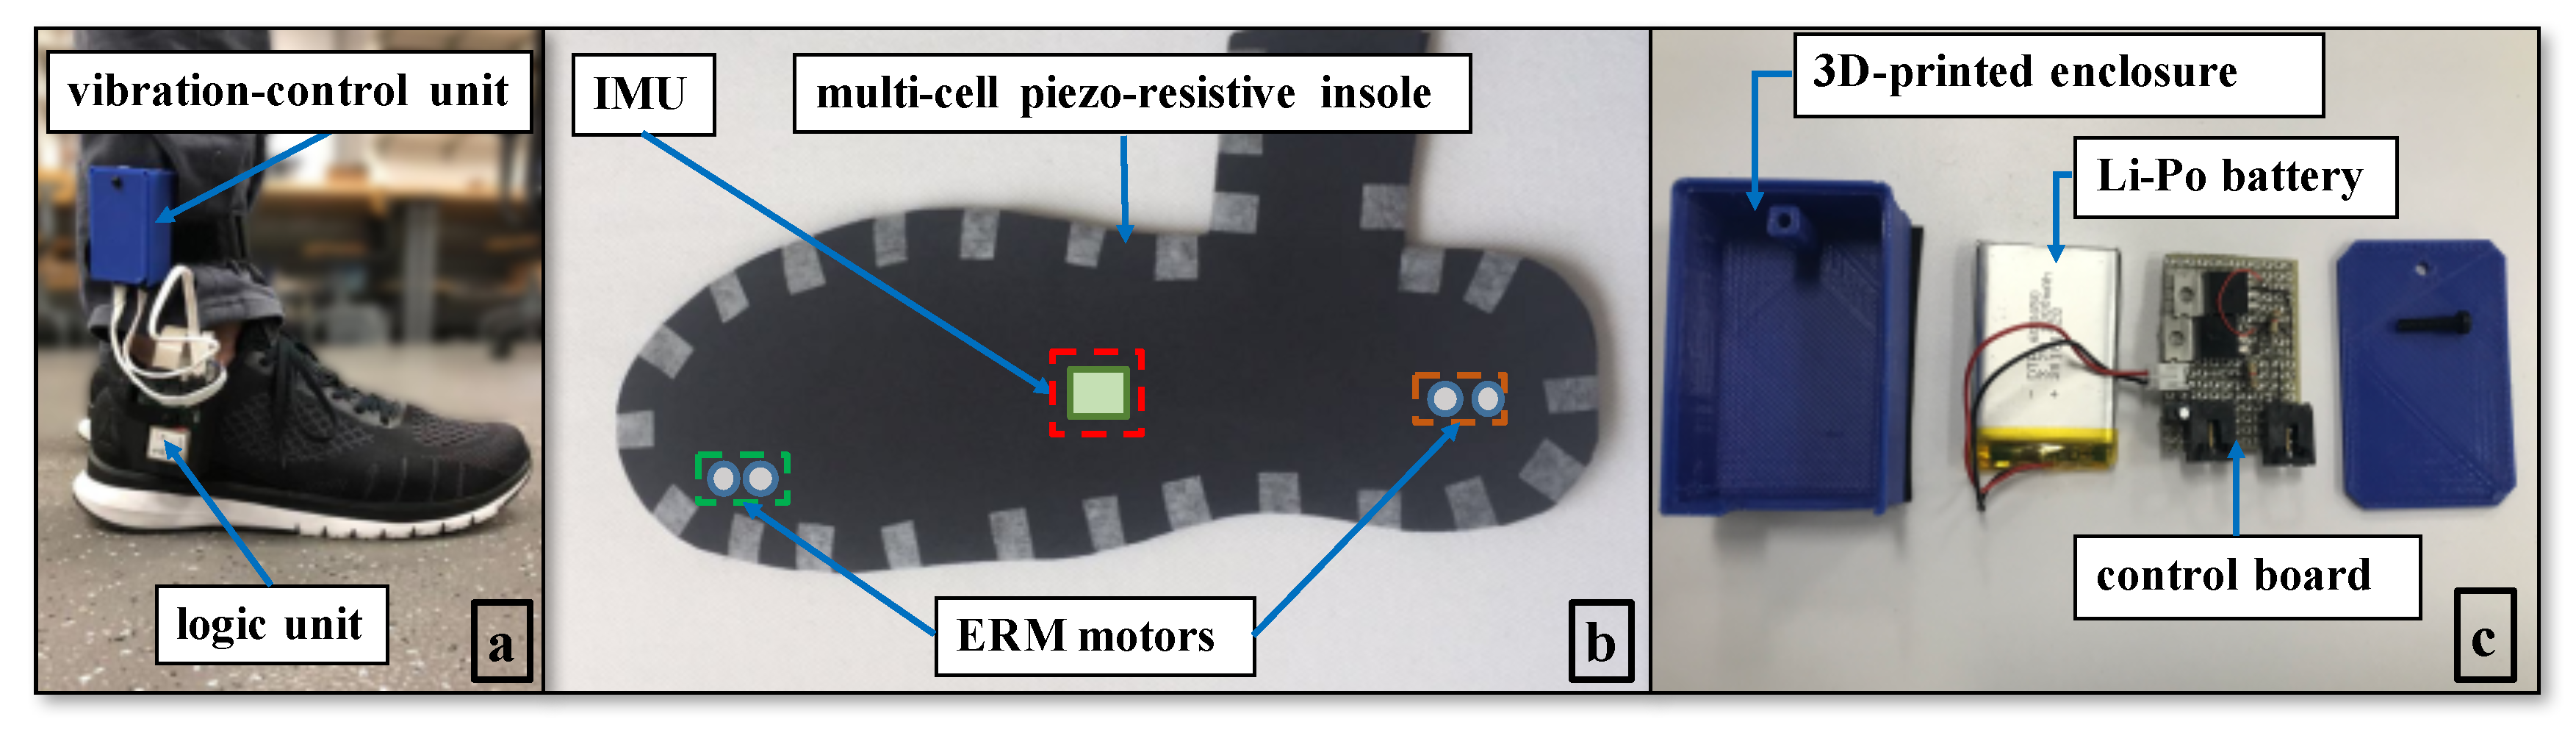
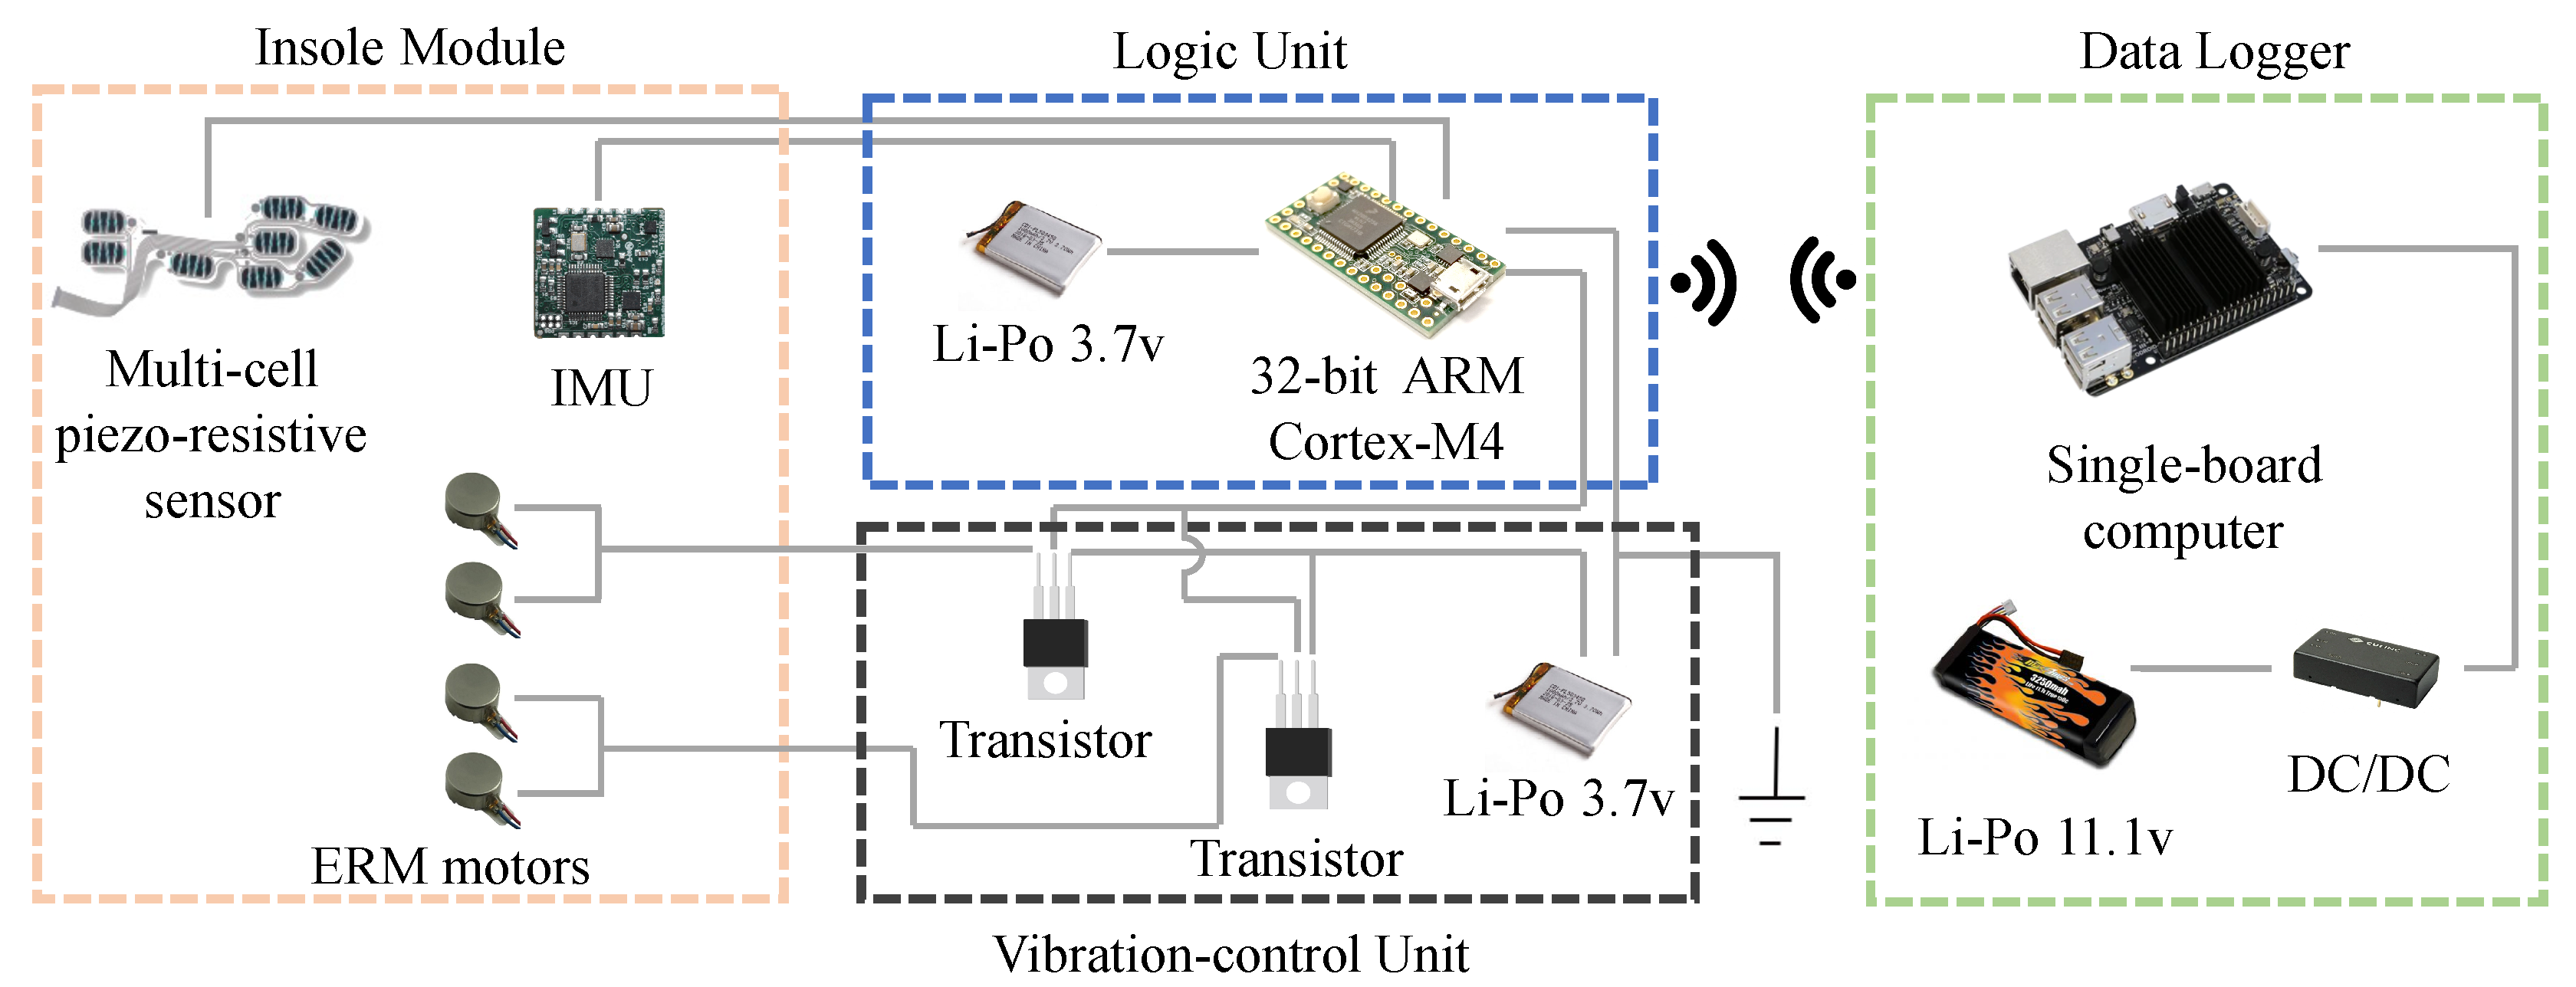
2. Mechatronic Design
3. Biofeedback Control
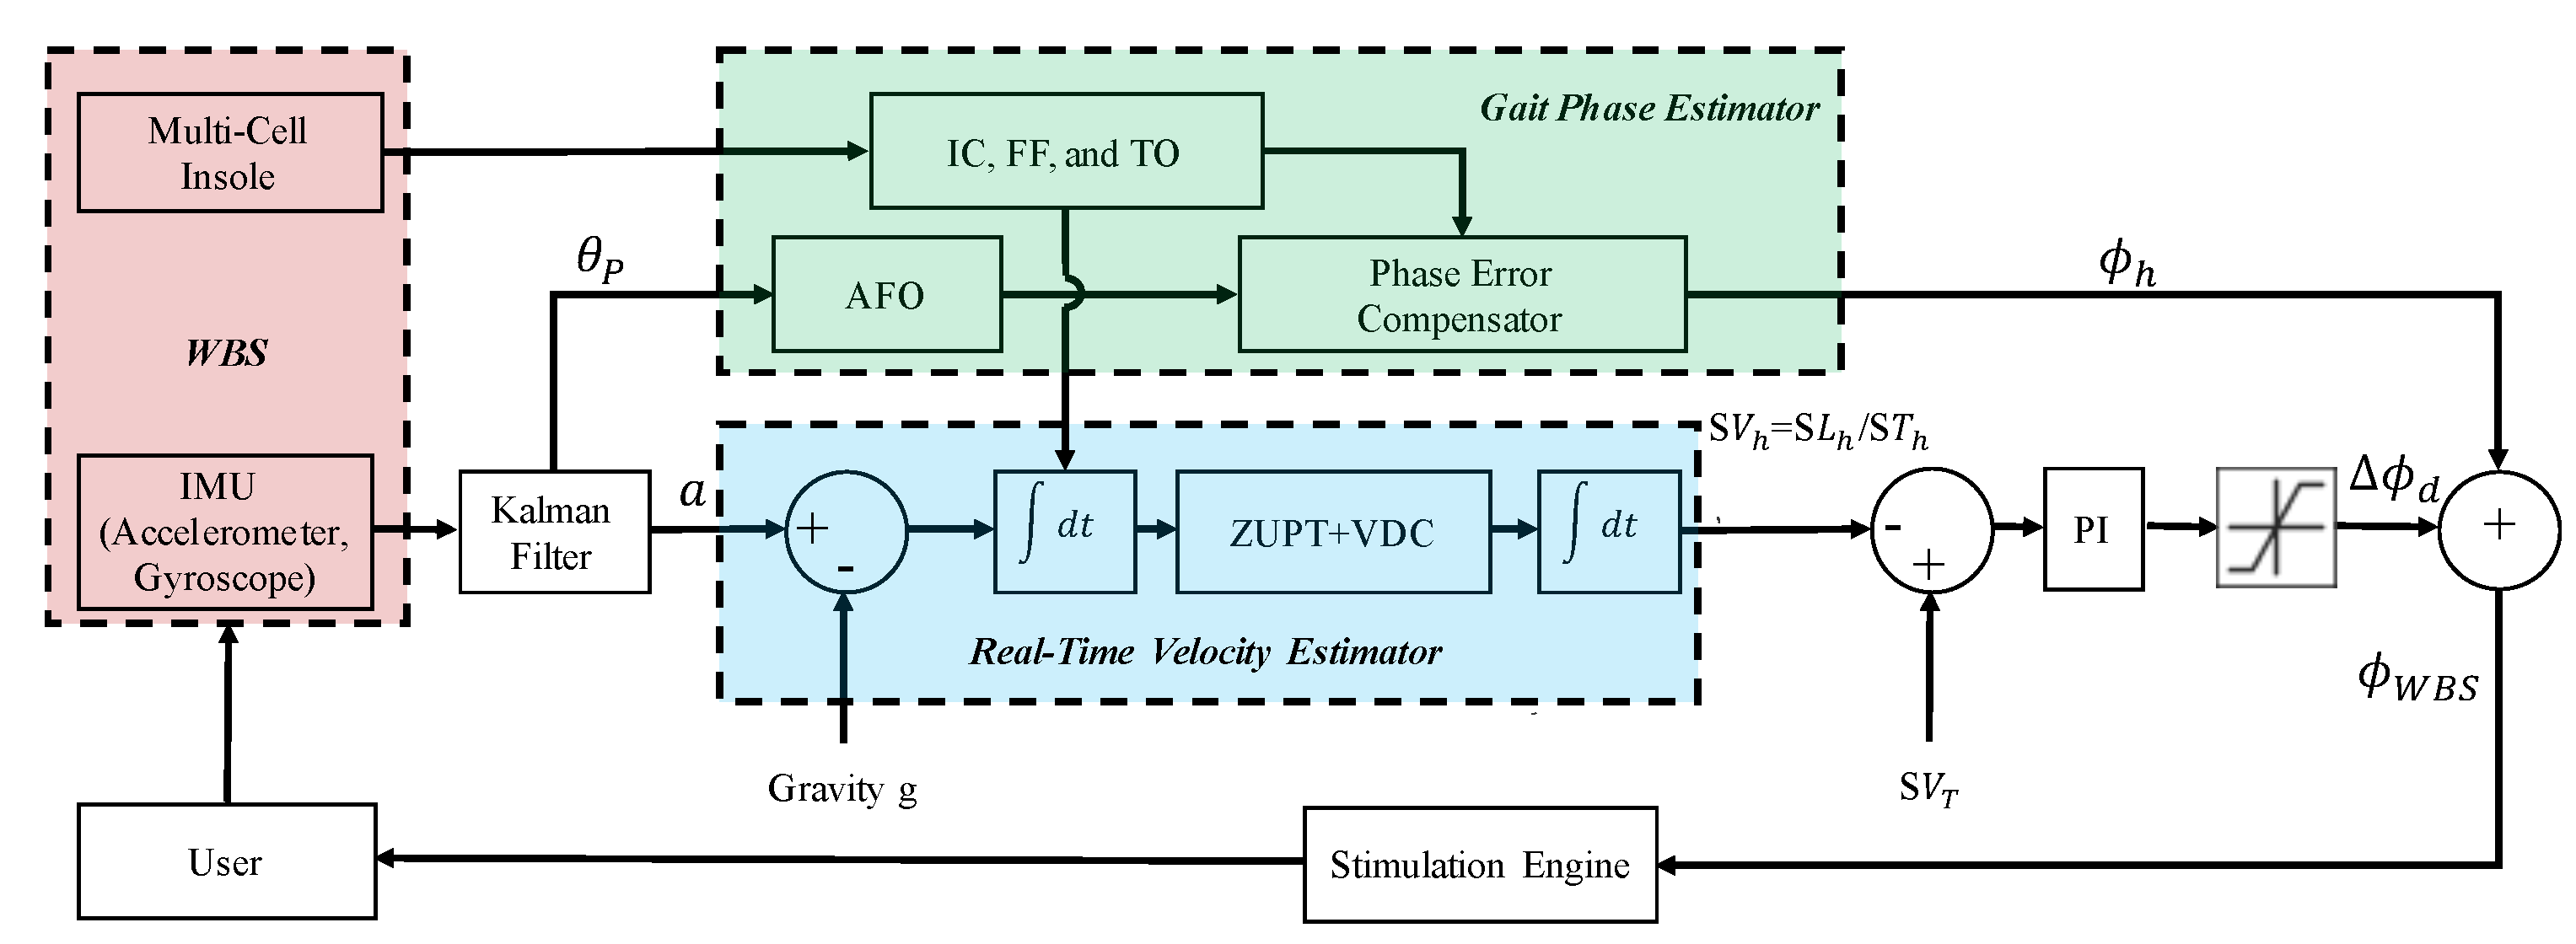
3.1. Control Architecture
3.2. Real-Time Velocity Estimator
3.3. Gait Phase Estimator
3.4. PI Controller and Stimulation Engine
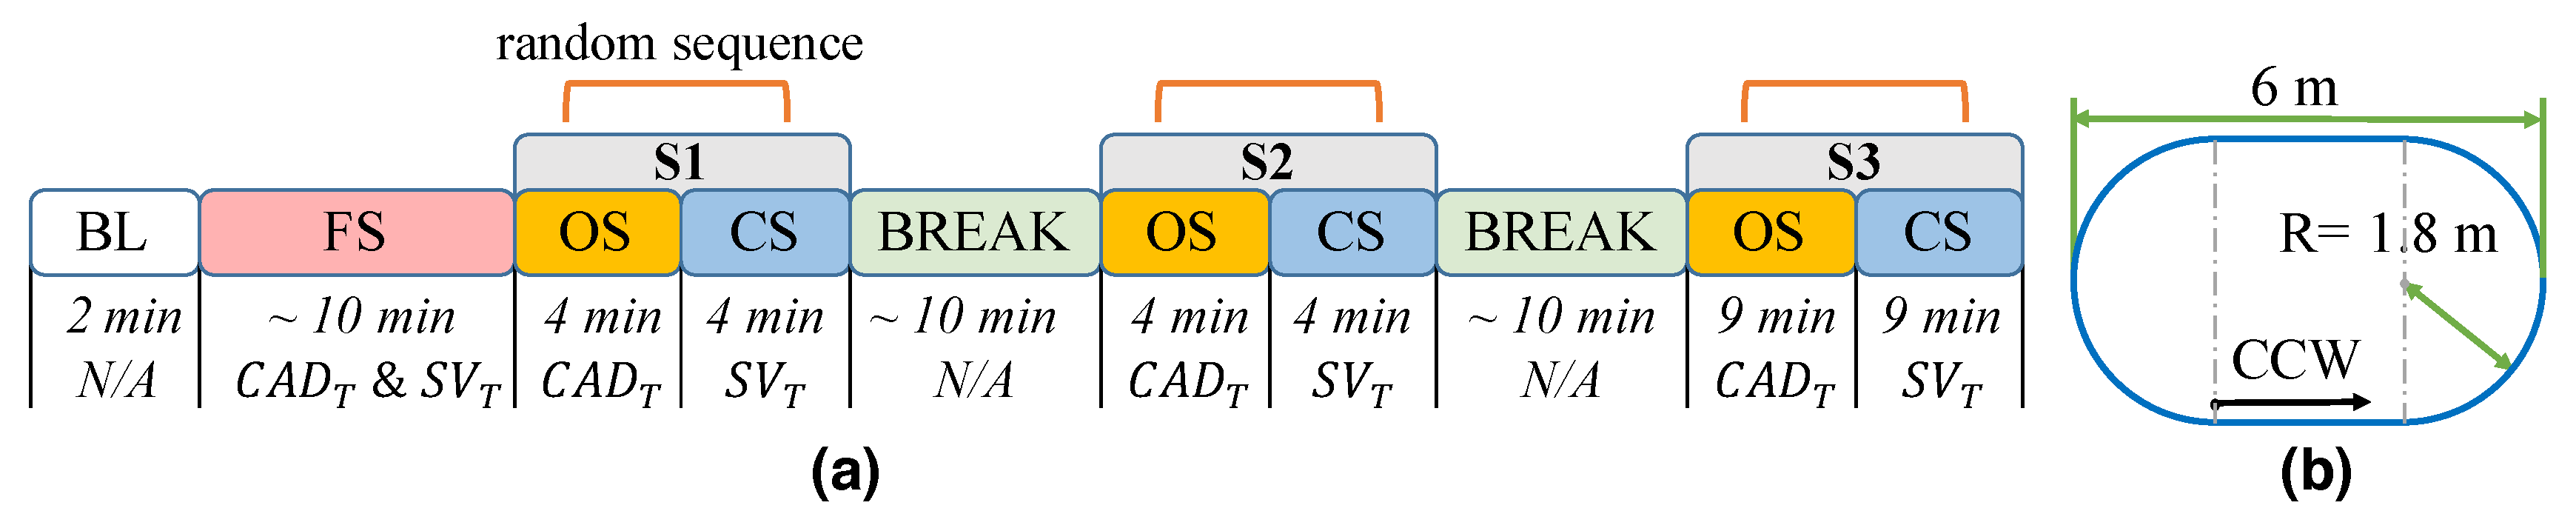
4. Experimental Protocol
5. Data Analysis
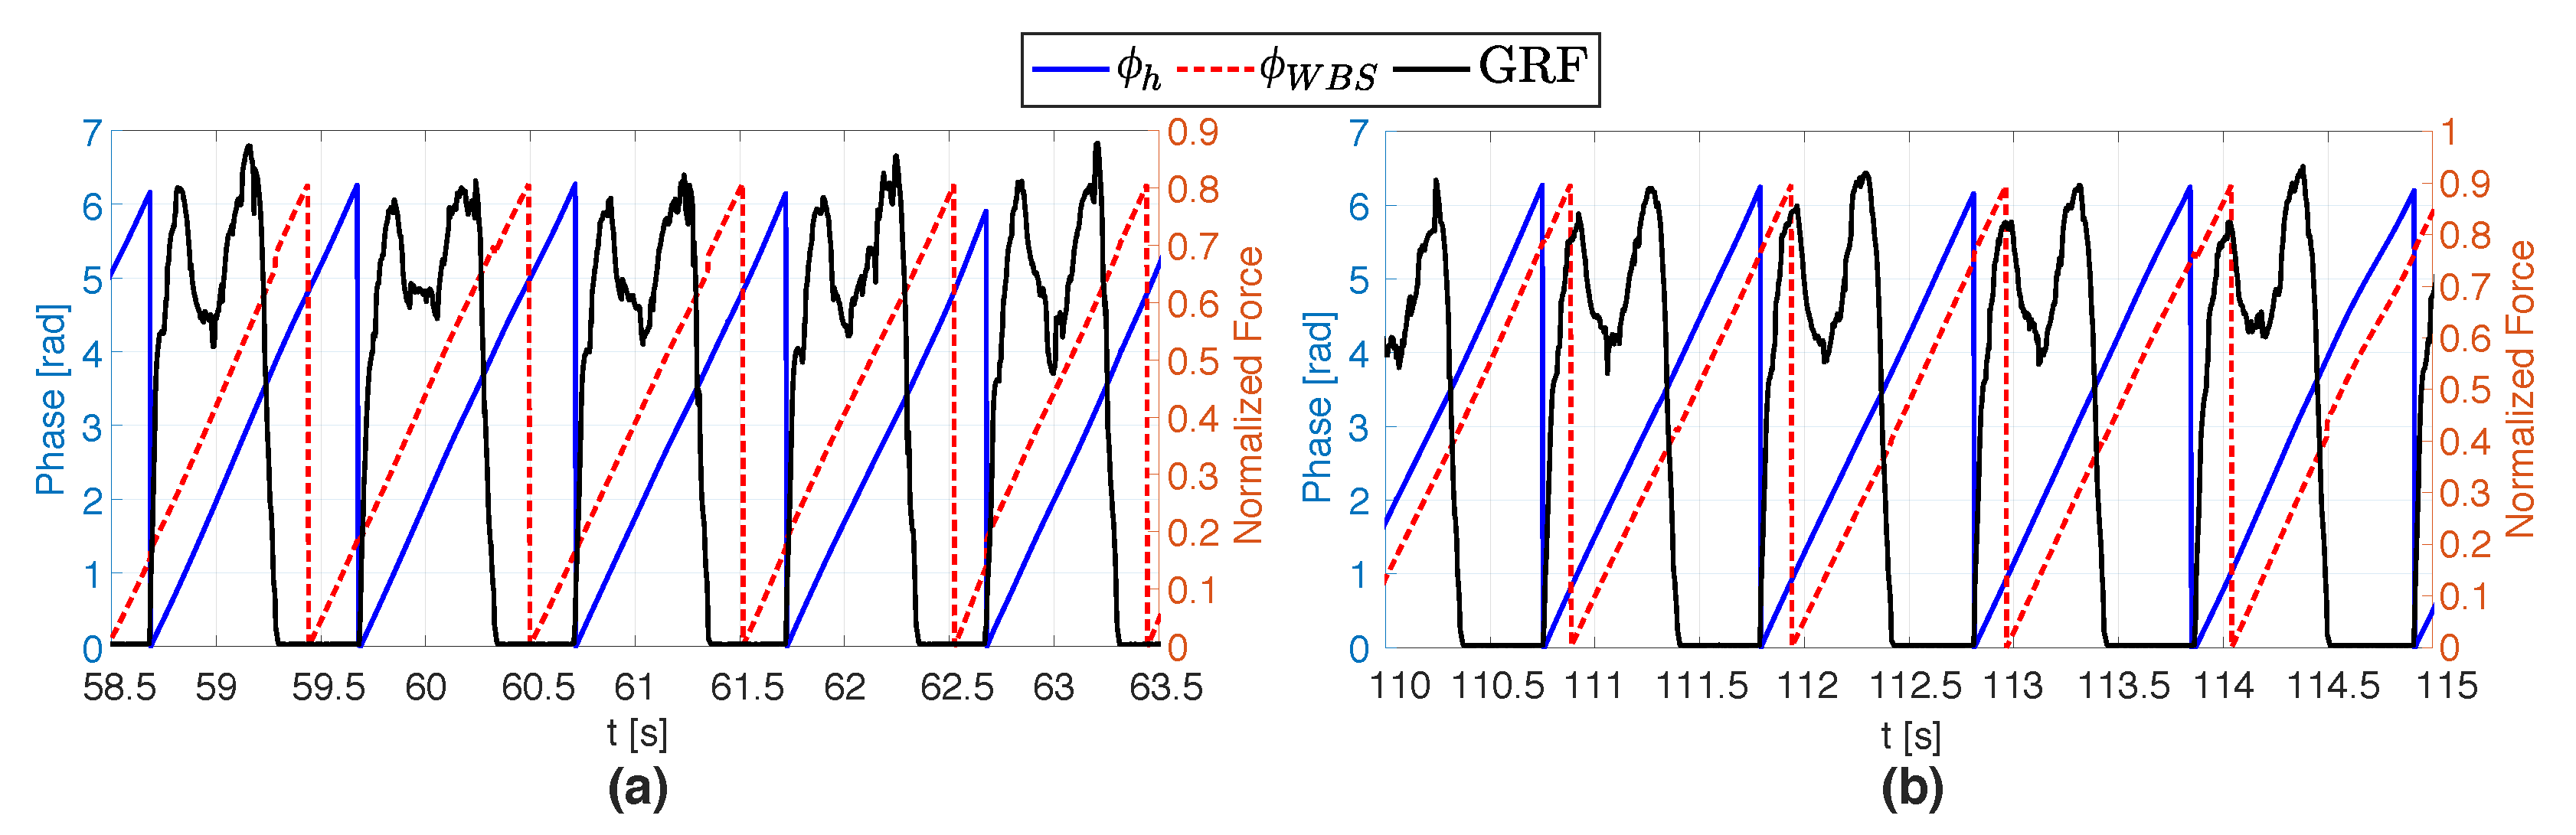
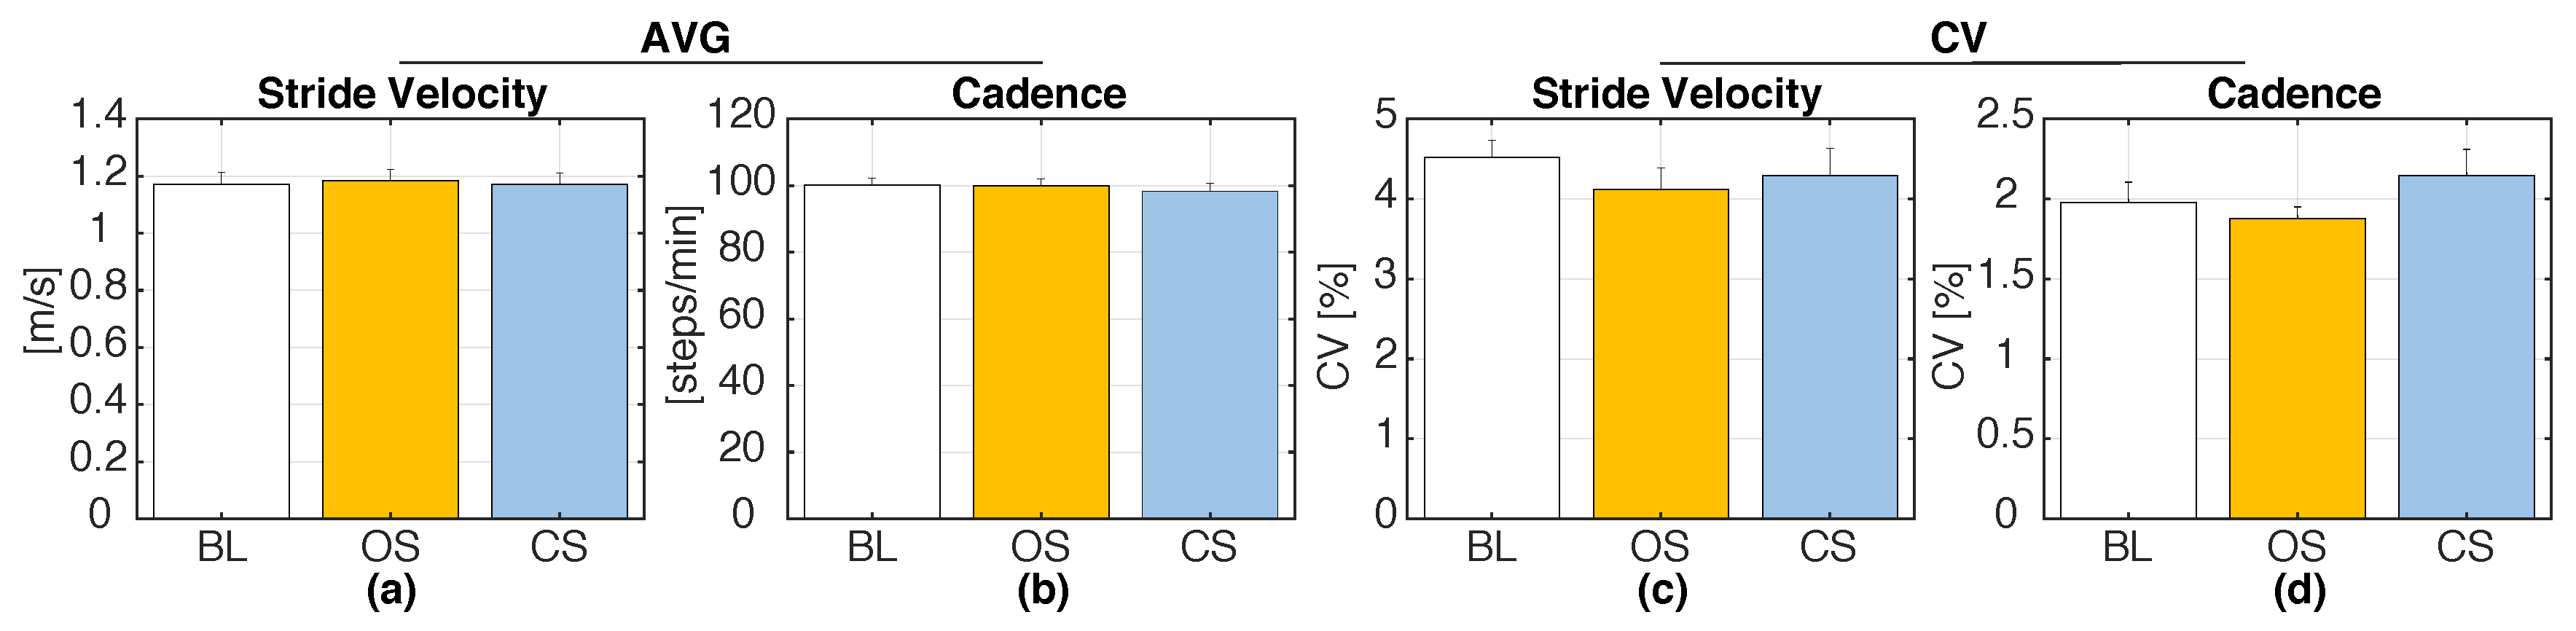
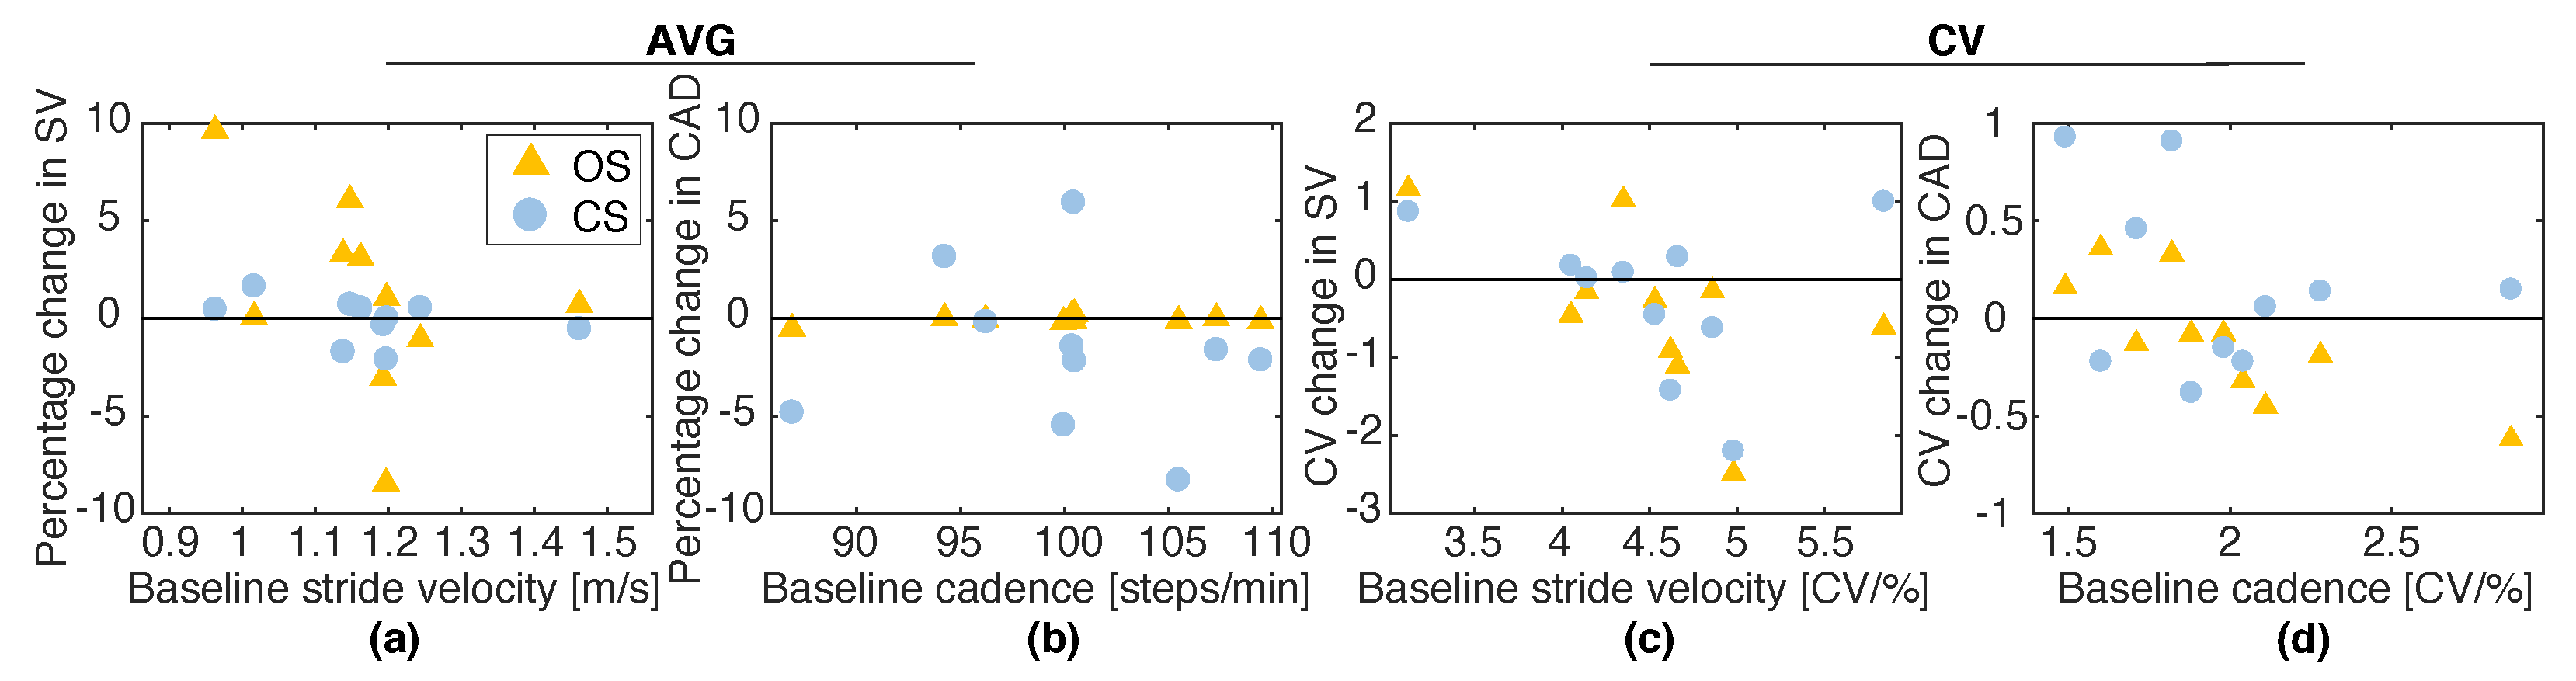
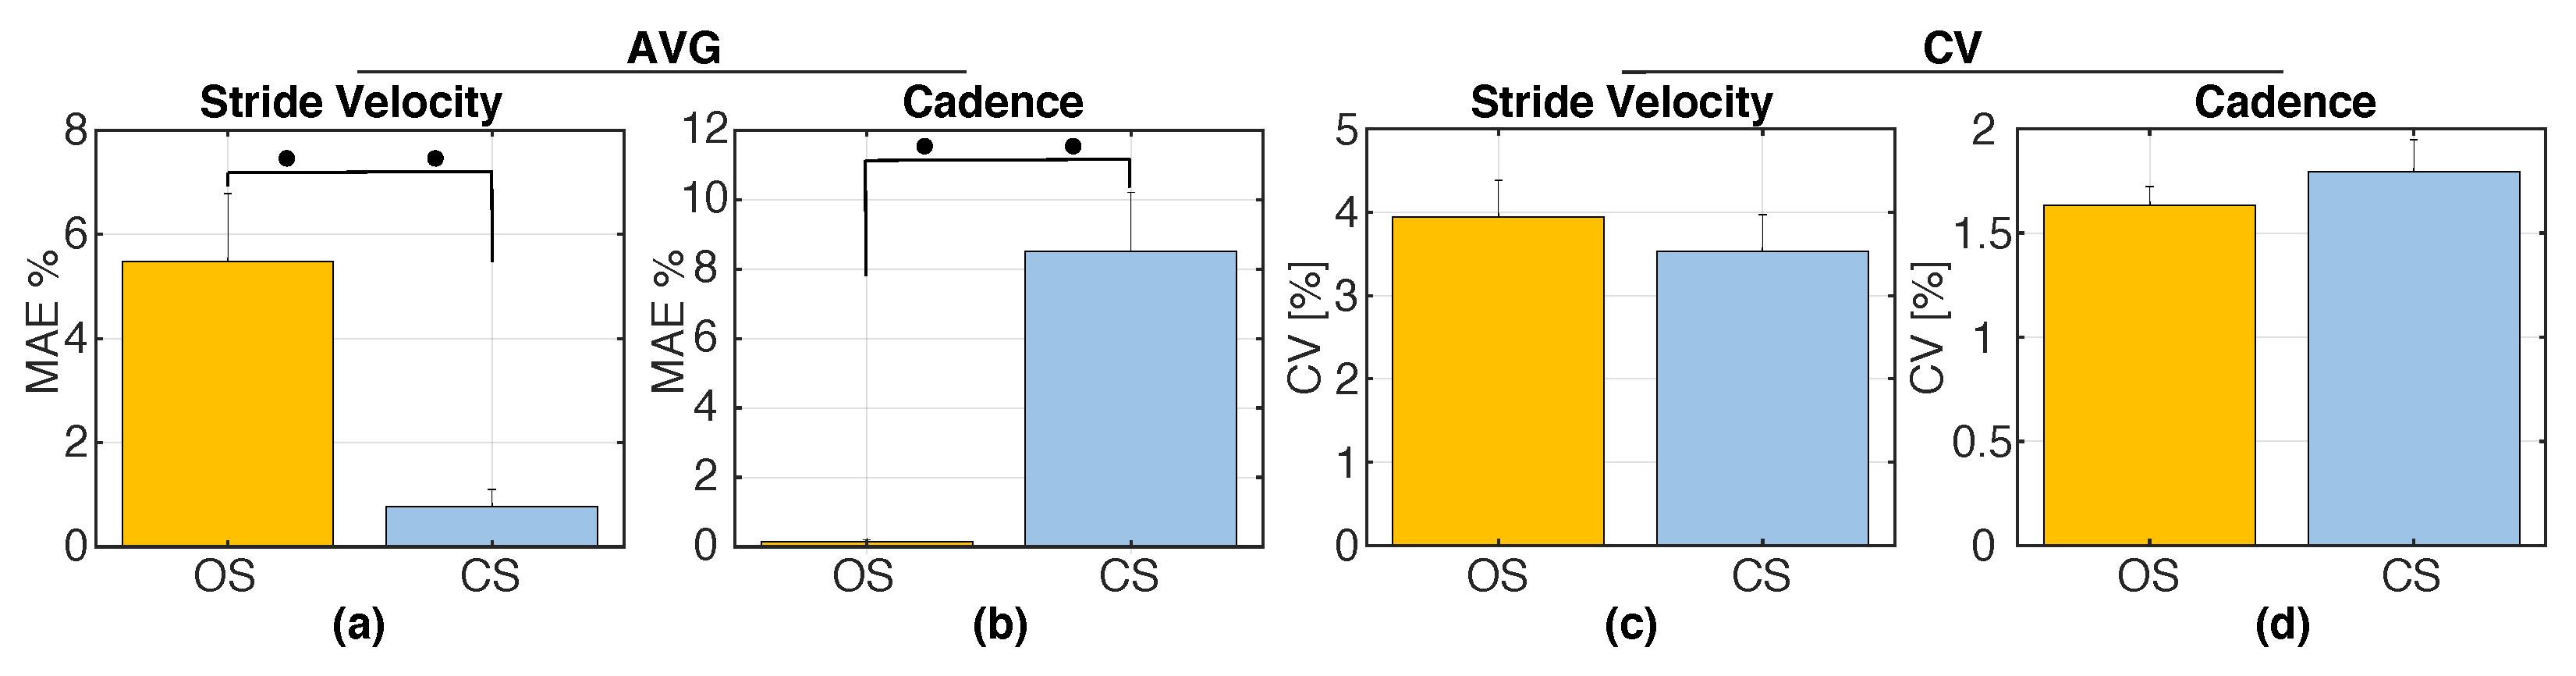
6. Results
7. Discussion
7.1. Open-Loop vs. Closed-Loop Rhythmic Stimulation
7.2. Proposed Closed-Loop Vibrotactile Control vs. Existing Methods
7.3. Limitations and Future Work
8. Conclusions
Author Contributions
Funding
Conflicts of Interest
References
- Middleton, A.; Fritz, S.L.; Lusardi, M. Walking speed: The functional vital sign. J. Aging Phys. Act. 2015, 23, 314–322. [Google Scholar] [CrossRef] [PubMed]
- Maki, B.E. Gait changes in older adults: Predictors of falls or indicators of fear? J. Am. Geriatr. Soc. 1997, 45, 313–320. [Google Scholar] [CrossRef]
- Van Kan, G.A.; Rolland, Y.; Andrieu, S.; Bauer, J.; Beauchet, O.; Bonnefoy, M.; Cesari, M.; Donini, L.; Gillette-Guyonnet, S.; Inzitari, M.; et al. Gait speed at usual pace as a predictor of adverse outcomes in community-dwelling older people an International Academy on Nutrition and Aging (IANA) Task Force. J. Nutr. Health Aging 2009, 13, 881–889. [Google Scholar] [CrossRef] [PubMed]
- Artaud, F.; Singh-Manoux, A.; Dugravot, A.; Tzourio, C.; Elbaz, A. Decline in fast gait speed as a predictor of disability in older adults. J. Am. Geriatr. Soc. 2015, 63, 1129–1136. [Google Scholar] [CrossRef]
- Marengoni, A.; Bandinelli, S.; Maietti, E.; Guralnik, J.; Zuliani, G.; Ferrucci, L.; Volpato, S. Combining gait speed and recall memory to predict survival in late life: Population-based study. J. Am. Geriatr. Soc. 2017, 65, 614–618. [Google Scholar] [CrossRef] [PubMed]
- Hollman, J.H.; McDade, E.M.; Petersen, R.C. Normative spatiotemporal gait parameters in older adults. Gait Posture 2011, 34, 111–118. [Google Scholar] [CrossRef]
- Kubicki, A. Functional assessment in older adults: Should we use timed up and go or gait speed test? Neurosci. Lett. 2014, 577, 89–94. [Google Scholar] [CrossRef]
- Pamoukdjian, F.; Paillaud, E.; Zelek, L.; Laurent, M.; Lévy, V.; Landre, T.; Sebbane, G. Measurement of gait speed in older adults to identify complications associated with frailty: A systematic review. J. Geriatr. Oncol. 2015, 6, 484–496. [Google Scholar] [CrossRef]
- Montero-Odasso, M.; Schapira, M.; Soriano, E.R.; Varela, M.; Kaplan, R.; Camera, L.A.; Mayorga, L.M. Gait velocity as a single predictor of adverse events in healthy seniors aged 75 years and older. J. Gerontol. Ser. A Biol. Sci. Med. Sci. 2005, 60, 1304–1309. [Google Scholar] [CrossRef]
- Zanotto, D.; Mamuyac, E.M.; Chambers, A.R.; Nemer, J.S.; Stafford, J.A.; Agrawal, S.K.; Lalwani, A.K. Dizziness handicap inventory score is highly correlated with markers of gait disturbance. Otol. Neurotol. 2017, 38, 1490–1499. [Google Scholar] [CrossRef] [PubMed]
- Fraga, M.J.; Cader, S.A.; Ferreira, M.A.; Giani, T.S.; Dantas, E.H. Aerobic resistance, functional autonomy and quality of life (QoL) of elderly women impacted by a recreation and walking program. Arch. Gerontol. Geriatr. 2011, 52, e40–e43. [Google Scholar] [CrossRef] [PubMed]
- Kemoun, G.; Thibaud, M.; Roumagne, N.; Carette, P.; Albinet, C.; Toussaint, L.; Paccalin, M.; Dugué, B. Effects of a physical training programme on cognitive function and walking efficiency in elderly persons with dementia. Dement. Geriatr. Cognit. Disord. 2010, 29, 109–114. [Google Scholar] [CrossRef] [PubMed]
- Stevens, J.A.; Burns, E. A CDC Compendium of Effective Fall Interventions: What Works for Community-Dwelling Older Adults; Centers for Disease Control and Prevention: Atlanta, GA, USA, 2015.
- de Labra, C.; Guimaraes-Pinheiro, C.; Maseda, A.; Lorenzo, T.; Millán-Calenti, J.C. Effects of physical exercise interventions in frail older adults: A systematic review of randomized controlled trials. BMC Geriatr. 2015, 15, 154. [Google Scholar] [CrossRef] [PubMed]
- Thaut, M.H.; Abiru, M. Rhythmic auditory stimulation in rehabilitation of movement disorders: A review of current research. Music Percept. Interdiscip. J. 2010, 27, 263–269. [Google Scholar] [CrossRef]
- Winter, D.A. Biomechanics and Motor Control of Human Gait: Normal, Elderly and Pathological; Waterloo Biomechanics: Waterloo, ON, Canada, 1991. [Google Scholar]
- Thaut, M.H.; McIntosh, G.C.; Rice, R.R.; Miller, R.A.; Rathbun, J.; Brault, J. Rhythmic auditory stimulation in gait training for Parkinson’s disease patients. Mov. Disord. Off. J. Mov. Disord. Soc. 1996, 11, 193–200. [Google Scholar] [CrossRef]
- McIntosh, G.C.; Brown, S.H.; Rice, R.R.; Thaut, M.H. Rhythmic auditory-motor facilitation of gait patterns in patients with Parkinson’s disease. J. Neurol. Neurosurg. Psychiatry 1997, 62, 22–26. [Google Scholar] [CrossRef]
- Lopez, W.O.C.; Higuera, C.A.E.; Fonoff, E.T.; de Oliveira Souza, C.; Albicker, U.; Martinez, J.A.E. Listenmee® and Listenmee® smartphone application: Synchronizing walking to rhythmic auditory cues to improve gait in Parkinson’s disease. Hum. Mov. Sci. 2014, 37, 147–156. [Google Scholar] [CrossRef]
- Kim, S.J.; Yoo, G.E.; Shin, Y.K.; Cho, S.R. Gait training for adults with cerebral palsy following harmonic modification in rhythmic auditory stimulation. Ann. N. Y. Acad. Sci. 2020, in press. [Google Scholar] [CrossRef]
- Baram, Y.; Miller, A. Auditory feedback control for improvement of gait in patients with Multiple Sclerosis. J. Neurol. Sci. 2007, 254, 90–94. [Google Scholar] [CrossRef]
- Hove, M.J.; Suzuki, K.; Uchitomi, H.; Orimo, S.; Miyake, Y. Interactive rhythmic auditory stimulation reinstates natural 1/f timing in gait of Parkinson’s patients. PLoS ONE 2012, 7, e32600. [Google Scholar] [CrossRef]
- Nagy, M.A.E.S.M.; Eltohamy, A.M.; Salem, N.E.M. Influence of rhythmic auditory feedback on gait in hemiparetic children. J. Med. Sci. 2020, 40, 1. [Google Scholar] [CrossRef]
- Winfree, K.N.; Pretzer-Aboff, I.; Hilgart, D.; Aggarwal, R.; Behari, M.; Agrawal, S.K. The effect of step-synchronized vibration on patients with Parkinson’s disease: Case studies on subjects with freezing of gait or an implanted deep brain stimulator. IEEE Trans. Neural Syst. Rehabil. Eng. 2013, 21, 806–811. [Google Scholar] [CrossRef] [PubMed]
- Afzal, M.R.; Oh, M.K.; Lee, C.H.; Park, Y.S.; Yoon, J. A portable gait asymmetry rehabilitation system for individuals with stroke using a vibrotactile feedback. BioMed. Res. Int. 2015, 2015, 375638. [Google Scholar] [CrossRef]
- Yasuda, K.; Hayashi, Y.; Tawara, A.; Iwata, H. Development of a vibratory cueing system using an implicit method to increase walking speed in patients with stroke: A proof-of-concept study. ROBOMECH J. 2020, 7, 1–8. [Google Scholar] [CrossRef]
- Grondin, S.; Ouellet, B.; Roussel, M.È. About optimal timing and stability of Weber fraction for duration discrimination. Acoust. Sci. Technol. 2001, 22, 370–372. [Google Scholar] [CrossRef]
- Sharma, A.; Torres-Moreno, R.; Zabjek, K.; Andrysek, J. Toward an artificial sensory feedback system for prosthetic mobility rehabilitation: Examination of sensorimotor responses. J. Rehabil. Res. Dev. 2014, 51, 907–917. [Google Scholar] [CrossRef] [PubMed]
- Crea, S.; Cipriani, C.; Donati, M.; Carrozza, M.C.; Vitiello, N. Providing time-discrete gait information by wearable feedback apparatus for lower-limb amputees: Usability and functional validation. IEEE Trans. Neural Syst. Rehabil. Eng. 2014, 23, 250–257. [Google Scholar] [CrossRef]
- Crea, S.; Edin, B.B.; Knaepen, K.; Meeusen, R.; Vitiello, N. Time-discrete vibrotactile feedback contributes to improved gait symmetry in patients with lower limb amputations: Case series. Phys. Therapy 2017, 97, 198–207. [Google Scholar] [CrossRef]
- Lauretti, C.; Pinzari, G.; Ciancio, A.L.; Davalli, A.; Sacchetti, R.; Sterzi, S.; Guglielmelli, E.; Zollo, L. A vibrotactile stimulation system for improving postural control and knee joint proprioception in lower-limb amputees. In Proceedings of the 2017 26th IEEE International Symposium on Robot and Human Interactive Communication (RO-MAN), Lisbon, Portugal, 28–31 August 2017; pp. 88–93. [Google Scholar]
- Kumar Vimal, A.; Kant Godiyal, A.; Singh, U.; Bhasin, S.; Joshi, D. Transfemoral amputee’s limit of stability and sway analysis during weight shifting exercise with a vibrotactile feedback system. Somatosens. Mot. Res. 2019, 36, 31–41. [Google Scholar] [CrossRef]
- Schütz-Bosbach, S.; Prinz, W. Perceptual resonance: Action-induced modulation of perception. Trends Cognit. Sci. 2007, 11, 349–355. [Google Scholar] [CrossRef]
- Kennel, C.; Streese, L.; Pizzera, A.; Justen, C.; Hohmann, T.; Raab, M. Auditory reafferences: The influence of real-time feedback on movement control. Front. Psychol. 2015, 6, 69. [Google Scholar] [CrossRef]
- Menzer, F.; Brooks, A.; Halje, P.; Faller, C.; Vetterli, M.; Blanke, O. Feeling in control of your footsteps: Conscious gait monitoring and the auditory consequences of footsteps. Cognit. Neurosci. 2010, 1, 184–192. [Google Scholar] [CrossRef] [PubMed]
- Kannape, O.A.; Blanke, O. Self in motion: Sensorimotor and cognitive mechanisms in gait agency. J. Neurophysiol. 2013, 110, 1837–1847. [Google Scholar] [CrossRef] [PubMed]
- Zanotto, D.; Turchet, L.; Boggs, E.M.; Agrawal, S.K. Solesound: Towards a novel portable system for audio-tactile underfoot feedback. In Proceedings of the 5th IEEE RAS/EMBS International Conference on Biomedical Robotics and Biomechatronics, São Paulo, Brazil, 12–15 August 2014; pp. 193–198. [Google Scholar]
- Minto, S.; Zanotto, D.; Boggs, E.M.; Rosati, G.; Agrawal, S.K. Validation of a footwear-based gait analysis system with action-related feedback. IEEE Trans. Neural Syst. Rehabil. Eng. 2015, 24, 971–980. [Google Scholar] [CrossRef] [PubMed]
- Zhang, H.; Zanotto, D.; Agrawal, S.K. Estimating CoP trajectories and kinematic gait parameters in walking and running using instrumented insoles. IEEE Robot. Autom. Lett. 2017, 2, 2159–2165. [Google Scholar] [CrossRef]
- Zhang, H.; Tay, M.O.; Suar, Z.; Kurt, M.; Zanotto, D. Regression models for estimating kinematic gait parameters with instrumented footwear. In Proceedings of the 2018 7th IEEE International Conference on Biomedical Robotics and Biomechatronics (Biorob), Enschede, The Netherlands, 26–29 August 2018; pp. 1169–1174. [Google Scholar]
- Duong, T.T.; Zhang, H.; Lynch, T.S.; Zanotto, D. Improving the accuracy of wearable sensors for human locomotion tracking using phase-locked regression models. In Proceedings of the 2019 IEEE 16th International Conference on Rehabilitation Robotics (ICORR), Toronto, ON, Canada, 24–28 June 2019; pp. 145–150. [Google Scholar]
- Zhang, H.; Guo, Y.; Zanotto, D. Accurate Ambulatory Gait Analysis in Walking and Running Using Machine Learning Models. IEEE Trans. Neural Syst. Rehabil. Eng. 2019, 28, 191–202. [Google Scholar] [CrossRef] [PubMed]
- Zhang, H.; Chen, Z.; Guo, Y.; Zanotto, D. Robot-Assisted and Wearable Sensor-Mediated Autonomous Gait Analysis. In Proceedings of the 2020 IEEE International Conference on Robotics and Automation (ICRA), Paris, France, 31 May–4 June 2020. [Google Scholar]
- Kennedy, P.M.; Inglis, J.T. Distribution and behaviour of glabrous cutaneous receptors in the human foot sole. J. Physiol. 2002, 538, 995–1002. [Google Scholar] [CrossRef] [PubMed]
- Zhang, Y.; Nolan, K.J.; Zanotto, D. Immediate effects of force feedback and plantar somatosensory stimuli on inter-limb coordination during perturbed walking. In Proceedings of the 2019 IEEE 16th International Conference on Rehabilitation Robotics (ICORR), Toronto, ON, Canada, 24–28 June 2019; pp. 252–257. [Google Scholar]
- Skog, I.; Handel, P.; Nilsson, J.O.; Rantakokko, J. Zero-velocity detection—An algorithm evaluation. IEEE Trans. Biomed. Eng. 2010, 57, 2657–2666. [Google Scholar] [CrossRef]
- Ferrari, A.; Ginis, P.; Hardegger, M.; Casamassima, F.; Rocchi, L.; Chiari, L. A mobile Kalman-filter based solution for the real-time estimation of spatio-temporal gait parameters. IEEE Trans. Neural Syst. Rehabil. Eng. 2015, 24, 764–773. [Google Scholar] [CrossRef]
- Hausdorff, J.M.; Ladin, Z.; Wei, J.Y. Footswitch system for measurement of the temporal parameters of gait. J. Biomech. 1995, 28, 347–351. [Google Scholar] [CrossRef]
- Yan, T.; Parri, A.; Garate, V.R.; Cempini, M.; Ronsse, R.; Vitiello, N. An oscillator-based smooth real-time estimate of gait phase for wearable robotics. Auton. Robots 2017, 41, 759–774. [Google Scholar] [CrossRef]
- Zhang, Y.; Nolan, K.J.; Zanotto, D. Oscillator-based transparent control of an active/semiactive ankle-foot orthosis. IEEE Robot. Autom. Lett. 2018, 4, 247–253. [Google Scholar] [CrossRef]
- Hausdorff, J.M.; Lowenthal, J.; Herman, T.; Gruendlinger, L.; Peretz, C.; Giladi, N. Rhythmic auditory stimulation modulates gait variability in Parkinson’s disease. Eur. J. Neurosci. 2007, 26, 2369–2375. [Google Scholar] [CrossRef]
- Nieuwboer, A.; Kwakkel, G.; Rochester, L.; Jones, D.; van Wegen, E.; Willems, A.M.; Chavret, F.; Hetherington, V.; Baker, K.; Lim, I. Cueing training in the home improves gait-related mobility in Parkinson’s disease: The RESCUE trial. J. Neurol. Neurosurg. Psychiatry 2007, 78, 134–140. [Google Scholar] [CrossRef]
- Baram, Y.; Lenger, R. Gait improvement in patients with cerebral palsy by visual and auditory feedback. Neuromodul. Technol. Neural Interface 2012, 15, 48–52. [Google Scholar] [CrossRef] [PubMed]
- Baram, Y.; Aharon-Peretz, J.; Badarny, S.; Susel, Z.; Schlesinger, I. Closed-loop auditory feedback for the improvement of gait in patients with Parkinson’s disease. J. Neurol. Sci. 2016, 363, 104–106. [Google Scholar] [CrossRef]
- Espay, A.J.; Baram, Y.; Dwivedi, A.K.; Shukla, R.; Gartner, M.; Gaines, L.; Duker, A.P.; Revilla, F.J. At-home training with closed-loop augmented-reality cueing device for improving gait in patients with Parkinson disease. J. Rehabil. Res. Dev. 2010, 47, 573–581. [Google Scholar] [CrossRef]
- Cornwell, T.; Woodward, J.; Wu, M.; Jackson, B.; Souza, P.; Siegel, J.; Dhar, S.; Gordon, K.E. Walking with Ears: Altered Auditory Feedback Impacts Gait Step Length in Older Adults. Front. Sports Act. Living 2020, 2, 38. [Google Scholar] [CrossRef]
- Wittwer, J.E.; Webster, K.E.; Hill, K. Music and metronome cues produce different effects on gait spatiotemporal measures but not gait variability in healthy older adults. Gait Posture 2013, 37, 219–222. [Google Scholar] [CrossRef]
- Arias, P.; Cudeiro, J. Effects of rhythmic sensory stimulation (auditory, visual) on gait in Parkinson’s disease patients. Exp. Brain Res. 2008, 186, 589–601. [Google Scholar] [CrossRef]
- Baker, K.; Rochester, L.; Nieuwboer, A. The effect of cues on gait variability—Reducing the attentional cost of walking in people with Parkinson’s disease. Parkinsonism Relat. Disord. 2008, 14, 314–320. [Google Scholar] [CrossRef] [PubMed]
- Beauchet, O.; Annweiler, C.; Lecordroch, Y.; Allali, G.; Dubost, V.; Herrmann, F.R.; Kressig, R.W. Walking speed-related changes in stride time variability: Effects of decreased speed. J. Neuroeng. Rehabil. 2009, 6, 32. [Google Scholar] [CrossRef] [PubMed]


© 2020 by the authors. Licensee MDPI, Basel, Switzerland. This article is an open access article distributed under the terms and conditions of the Creative Commons Attribution (CC BY) license (http://creativecommons.org/licenses/by/4.0/).
Share and Cite
Zhang, H.; Yin, Y.; Chen, Z.; Zhang, Y.; Rao, A.K.; Guo, Y.; Zanotto, D. Wearable Biofeedback System to Induce Desired Walking Speed in Overground Gait Training. Sensors 2020, 20, 4002. https://doi.org/10.3390/s20144002
Zhang H, Yin Y, Chen Z, Zhang Y, Rao AK, Guo Y, Zanotto D. Wearable Biofeedback System to Induce Desired Walking Speed in Overground Gait Training. Sensors. 2020; 20(14):4002. https://doi.org/10.3390/s20144002
Chicago/Turabian StyleZhang, Huanghe, Yefei Yin, Zhuo Chen, Yufeng Zhang, Ashwini K. Rao, Yi Guo, and Damiano Zanotto. 2020. "Wearable Biofeedback System to Induce Desired Walking Speed in Overground Gait Training" Sensors 20, no. 14: 4002. https://doi.org/10.3390/s20144002
APA StyleZhang, H., Yin, Y., Chen, Z., Zhang, Y., Rao, A. K., Guo, Y., & Zanotto, D. (2020). Wearable Biofeedback System to Induce Desired Walking Speed in Overground Gait Training. Sensors, 20(14), 4002. https://doi.org/10.3390/s20144002