Validation of Marker-Less System for the Assessment of Upper Joints Reaction Forces in Exoskeleton Users

 ,
,  ,
, 
 ,
,  and
and 
Abstract
1. Introduction
2. ML Multi-Kinect Motion Tracking System
3. Measurements Set-Up
3.1. Hardware
3.2. Software
3.3. Protocol
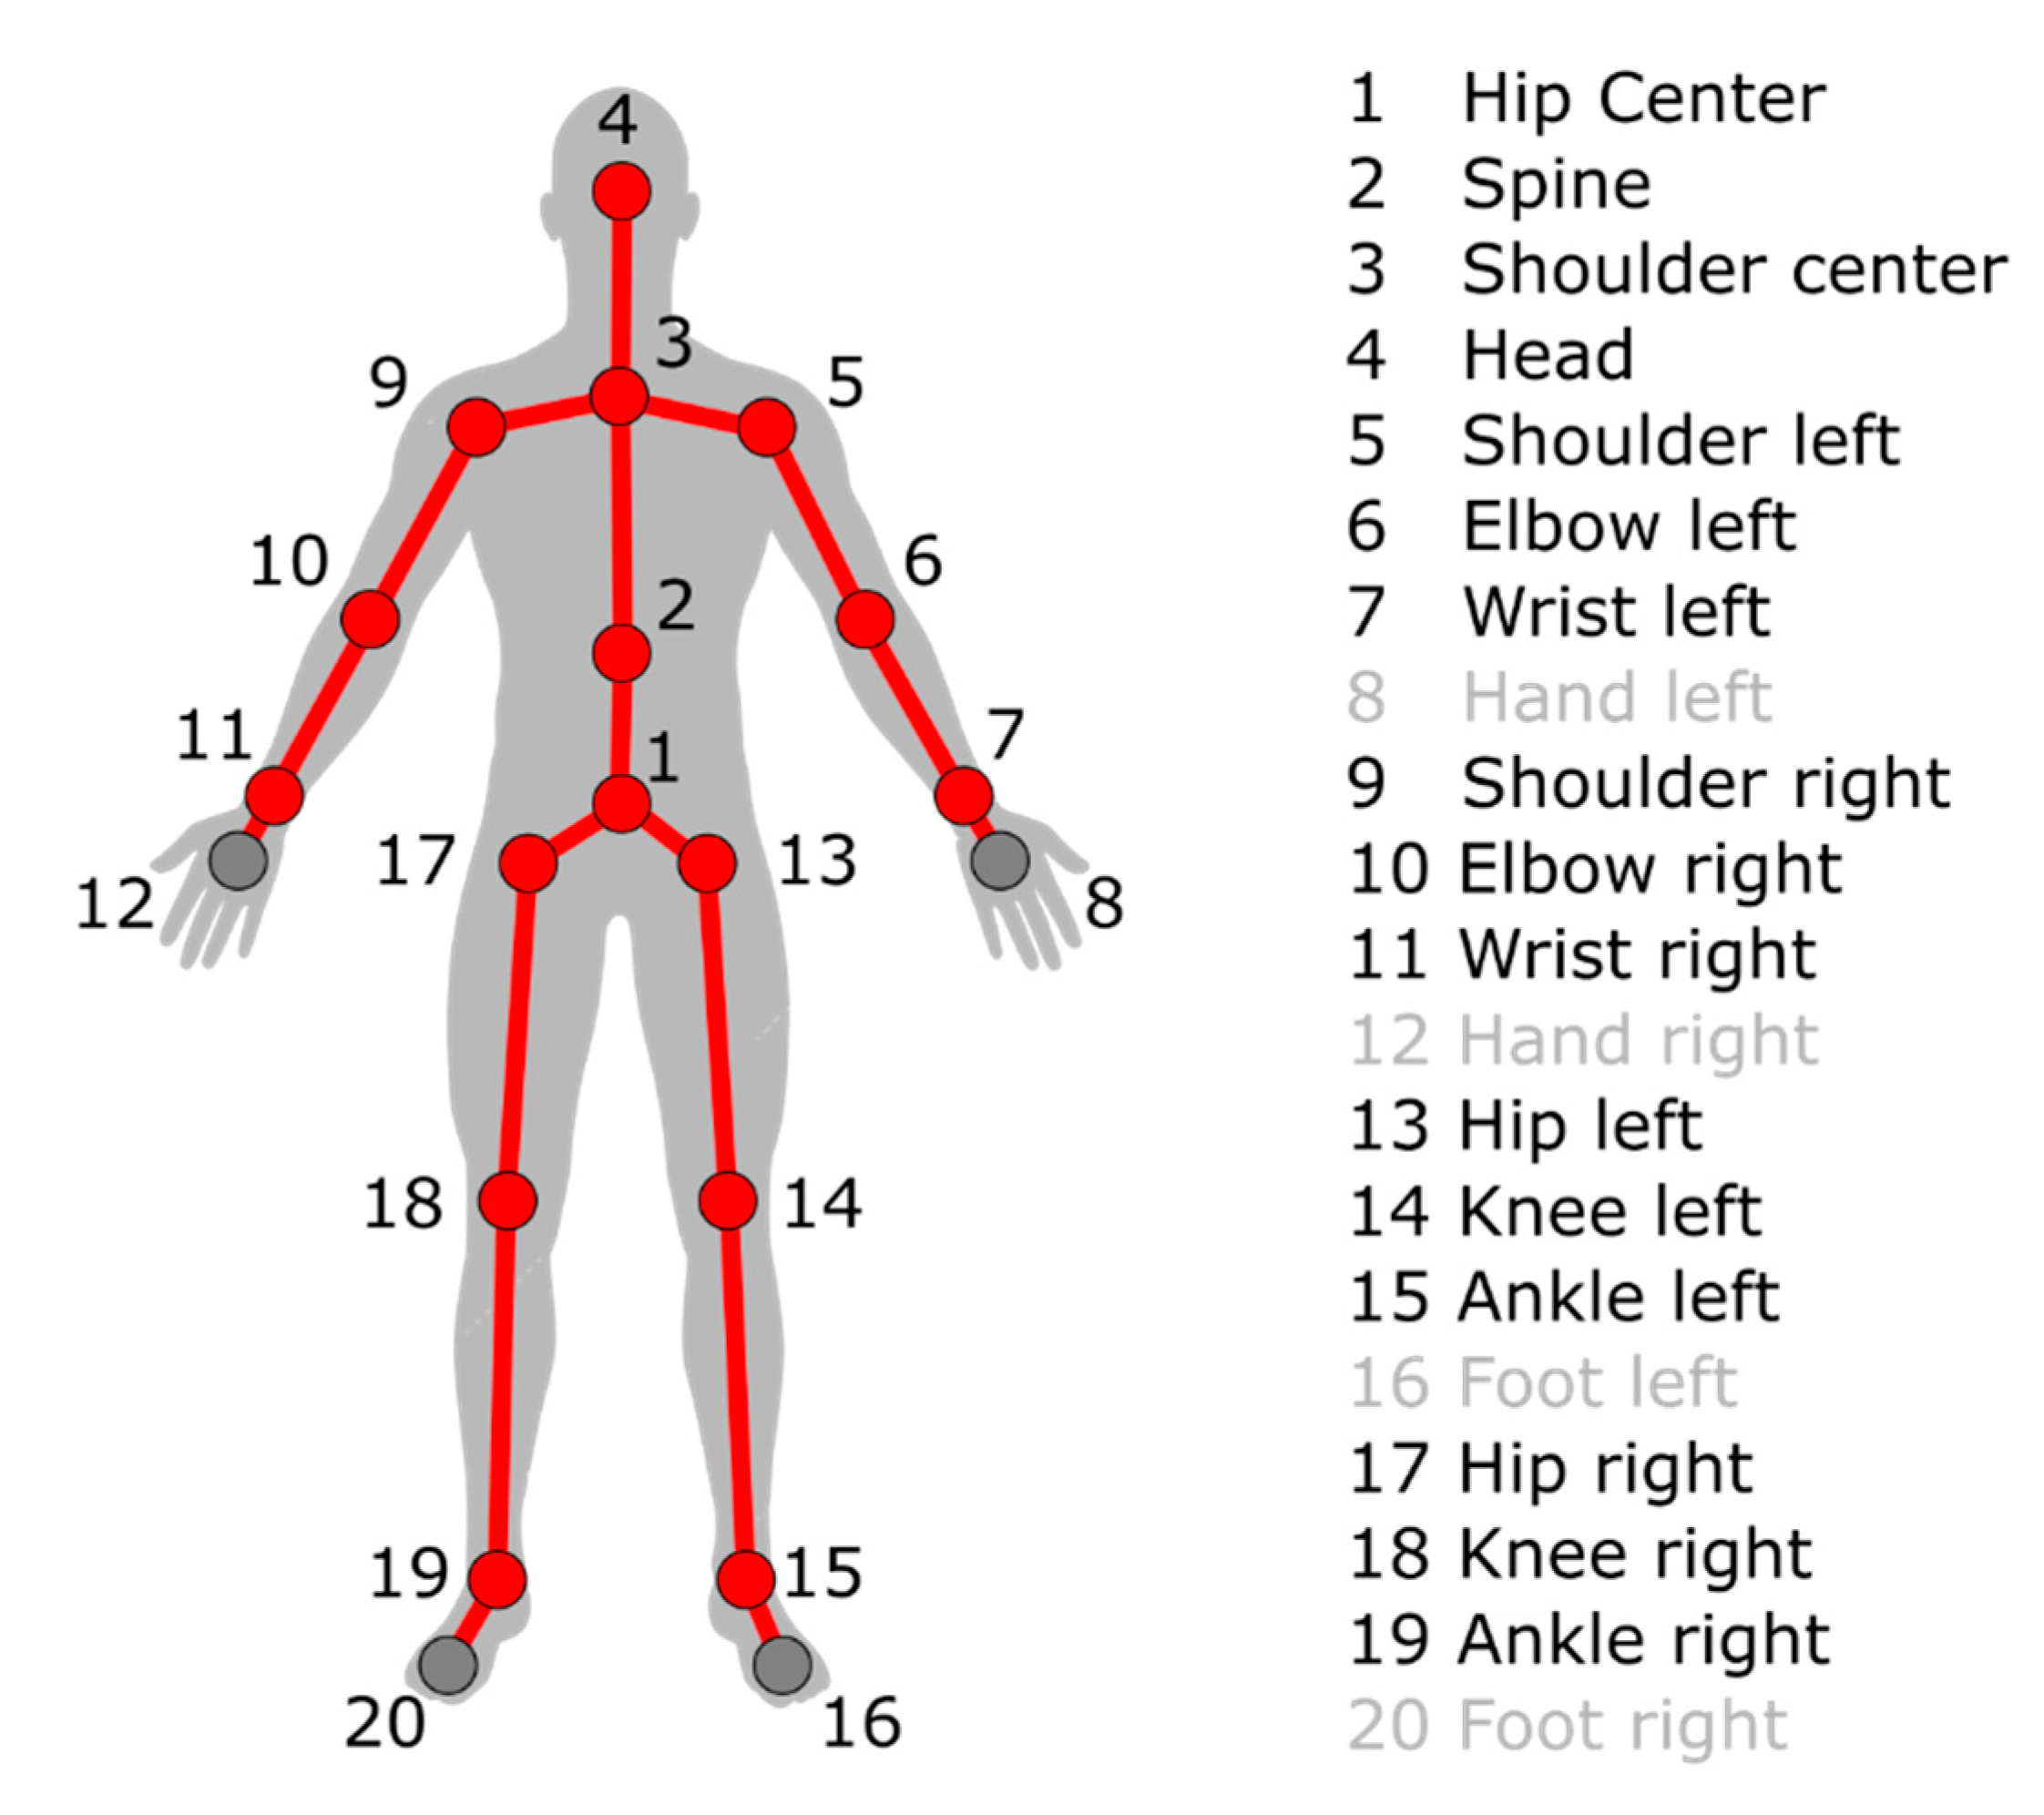
- The vector of the trajectories of the N nodes representing the fused skeleton of the subject, provided by our ML multi-Kinect system,
- the vector of the trajectories calculated by the BTS Smart-DX vision system of the Physical Markers shown in Figure 6;
- the GFRF data set of the measurements provided by the force platforms of both the forces exchanged between the subject feet, the ground, and the gait phases, and
- the GCRF data set of the measurements from the crutches of the forces exchanged between the upper limbs of the subject and the ground. In addition to the forces, the impact times of the crutches with the ground are acquired.
4. Validation Methodology
- Kinematic data set alignment: since the ML multi-Kinect system and the MB BTS System are not synchronized to each other, the skeleton trajectories of vector must be aligned in time with the trajectories of vector . This task is carried out by the procedure presented in Section 4.1.
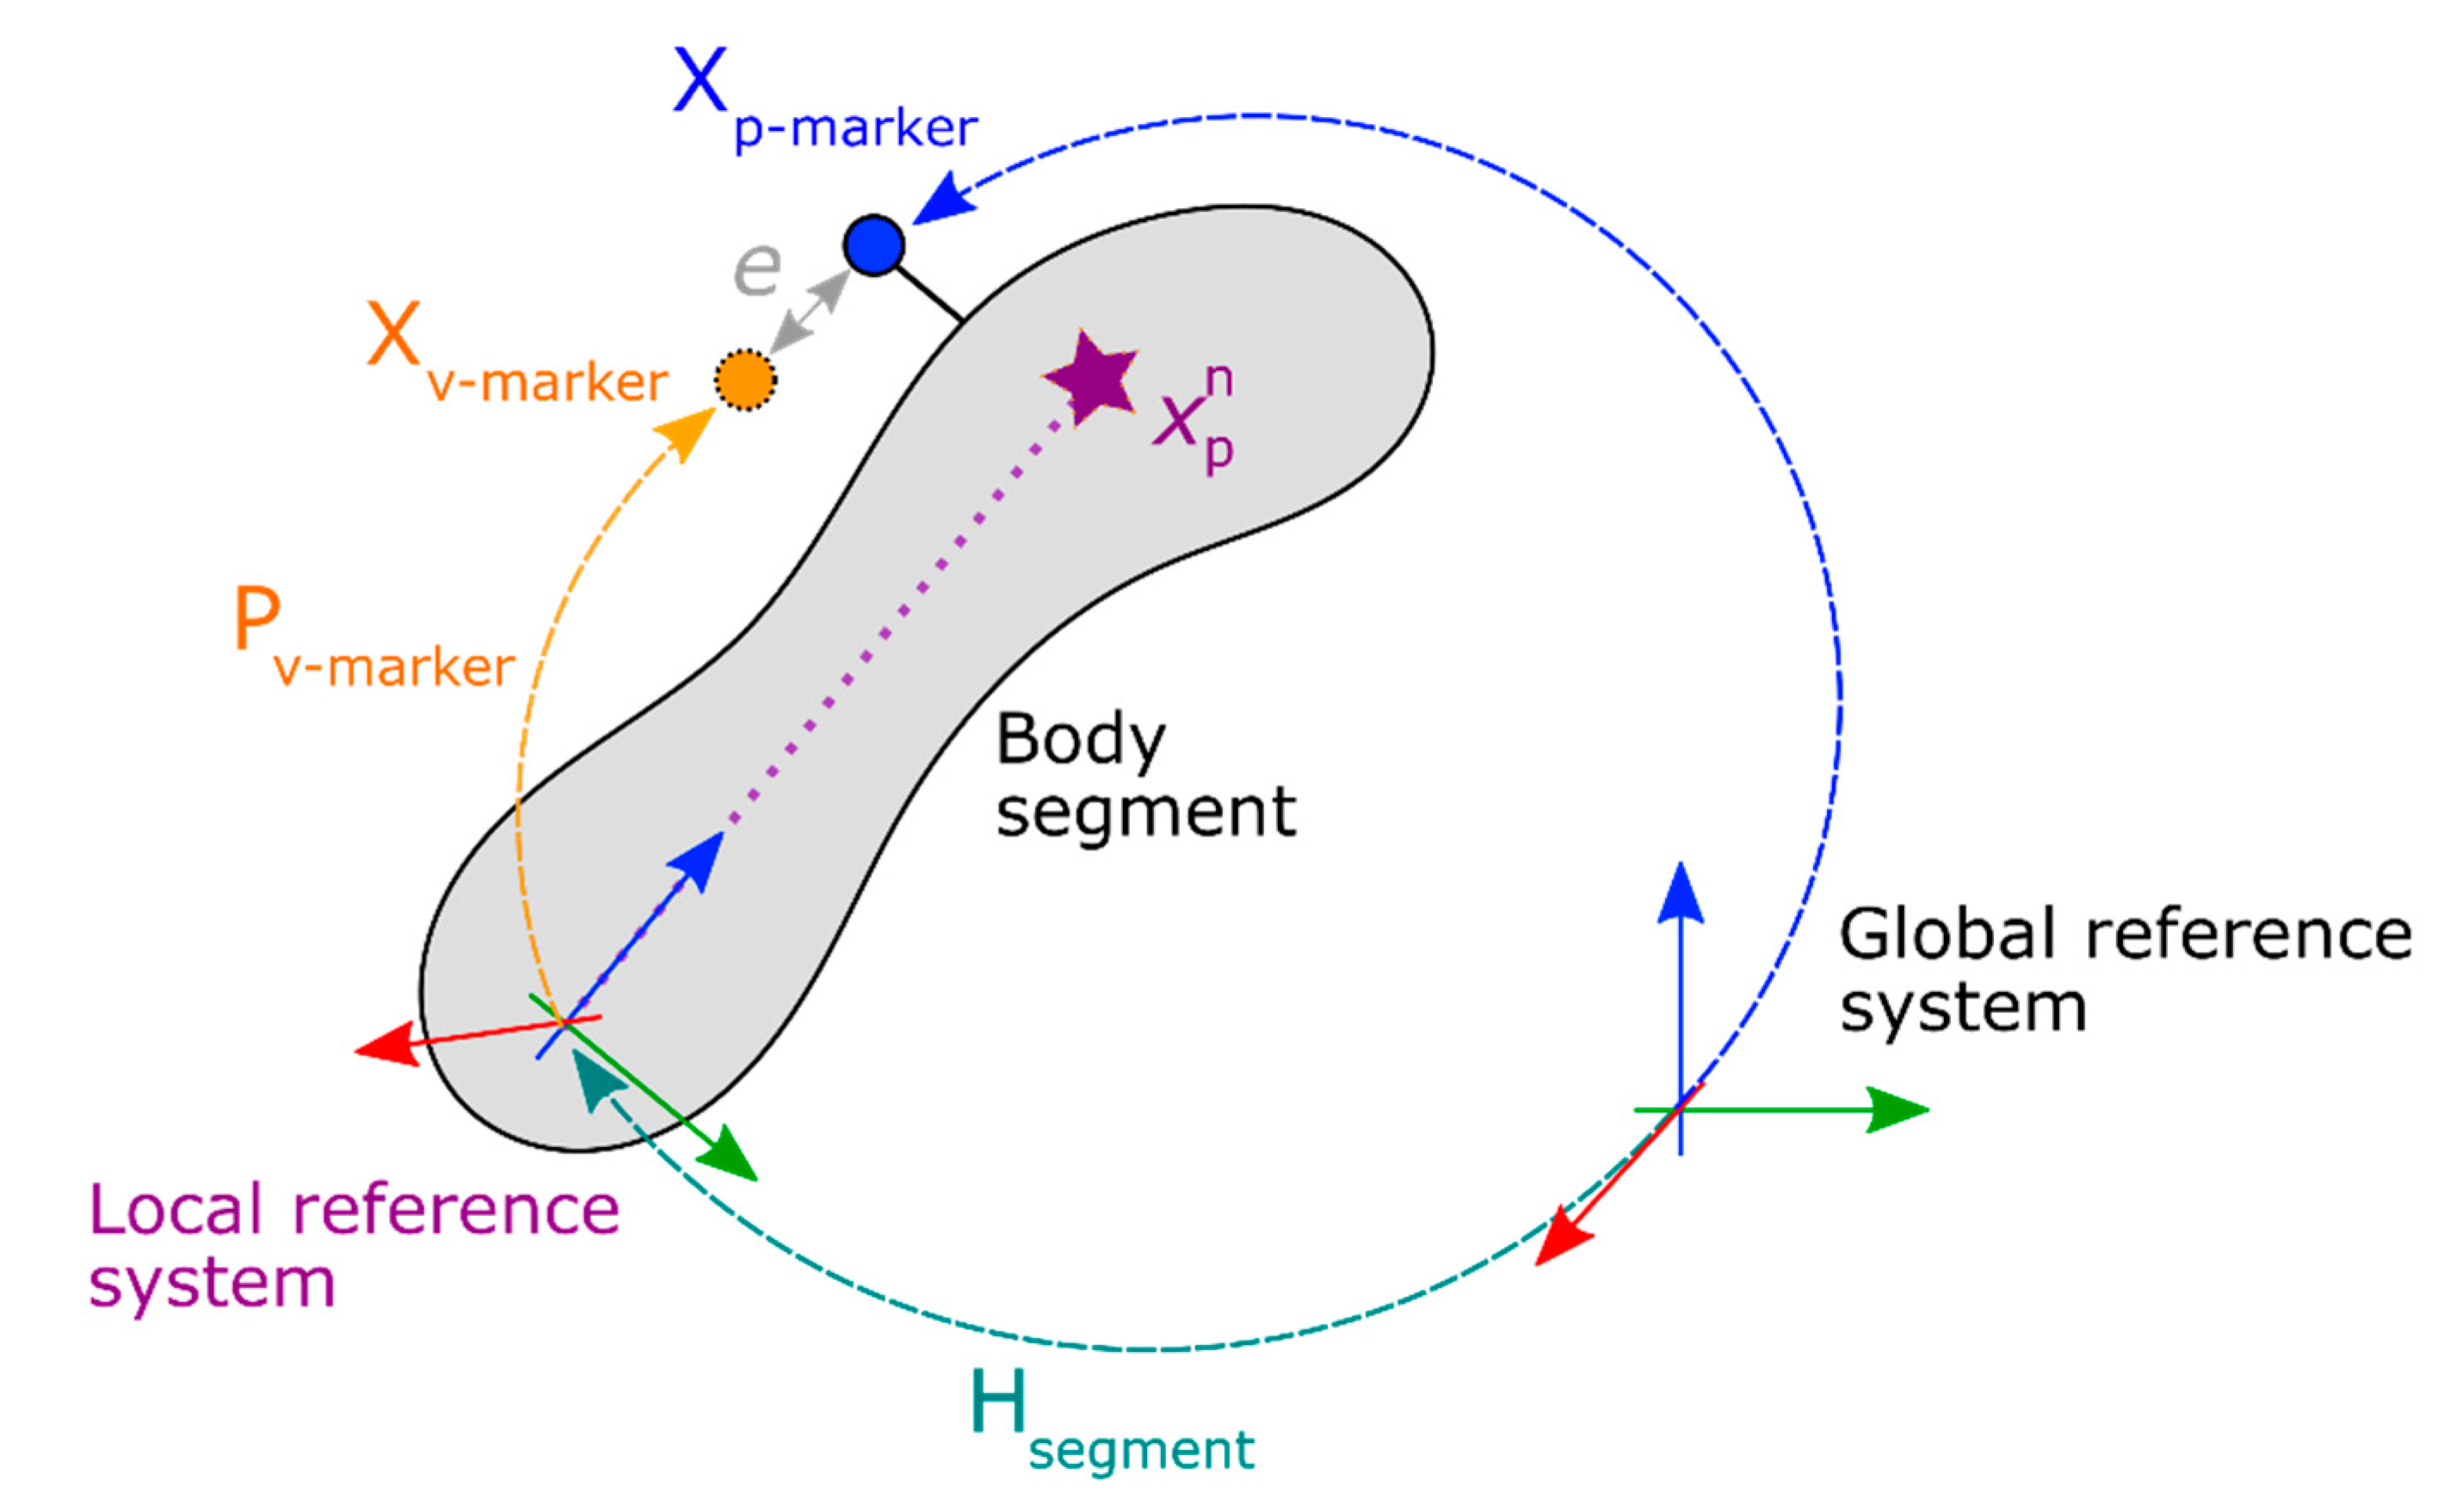
- Mapping skeleton nodes to virtual markers: the skeletal data provide the trajectories of the joints of the body-exoskeleton combination while the BTS data refer to the trajectories of the physical markers placed on the segments of the body-exoskeleton combination. This last set is the one expressed in the correct form and then elaborated on by the biomechanical model. Starting from the joints trajectories, it is mandatory to calculate the trajectories of new points (thereafter called virtual markers), placed where physical markers would be. A suitable procedure presented in Section 4.2. has been designed to perform this task. The output is represented by the data set denoted by .
- Inverse Dynamic Analysis: the core of the process is to solve the set of dynamic equilibrium equations that represent the biomechanical model of the patient body. This model performs the inverse kinematics and the inverse dynamic analysis of the gait, which provides the indirect estimate of the subject internal forces at the upper limbs. The analysis based on the biomechanical model is run twice. The first run is carried out using as input data sets , GFRF, and GGRF. The output is used as the reference measurement of the internal forces at the upper limbs. The second run uses as inputs data sets , GFRF, and GCRF. The output of this run represents the estimate of the internal reaction forces at the upper limbs measured by the ML system.
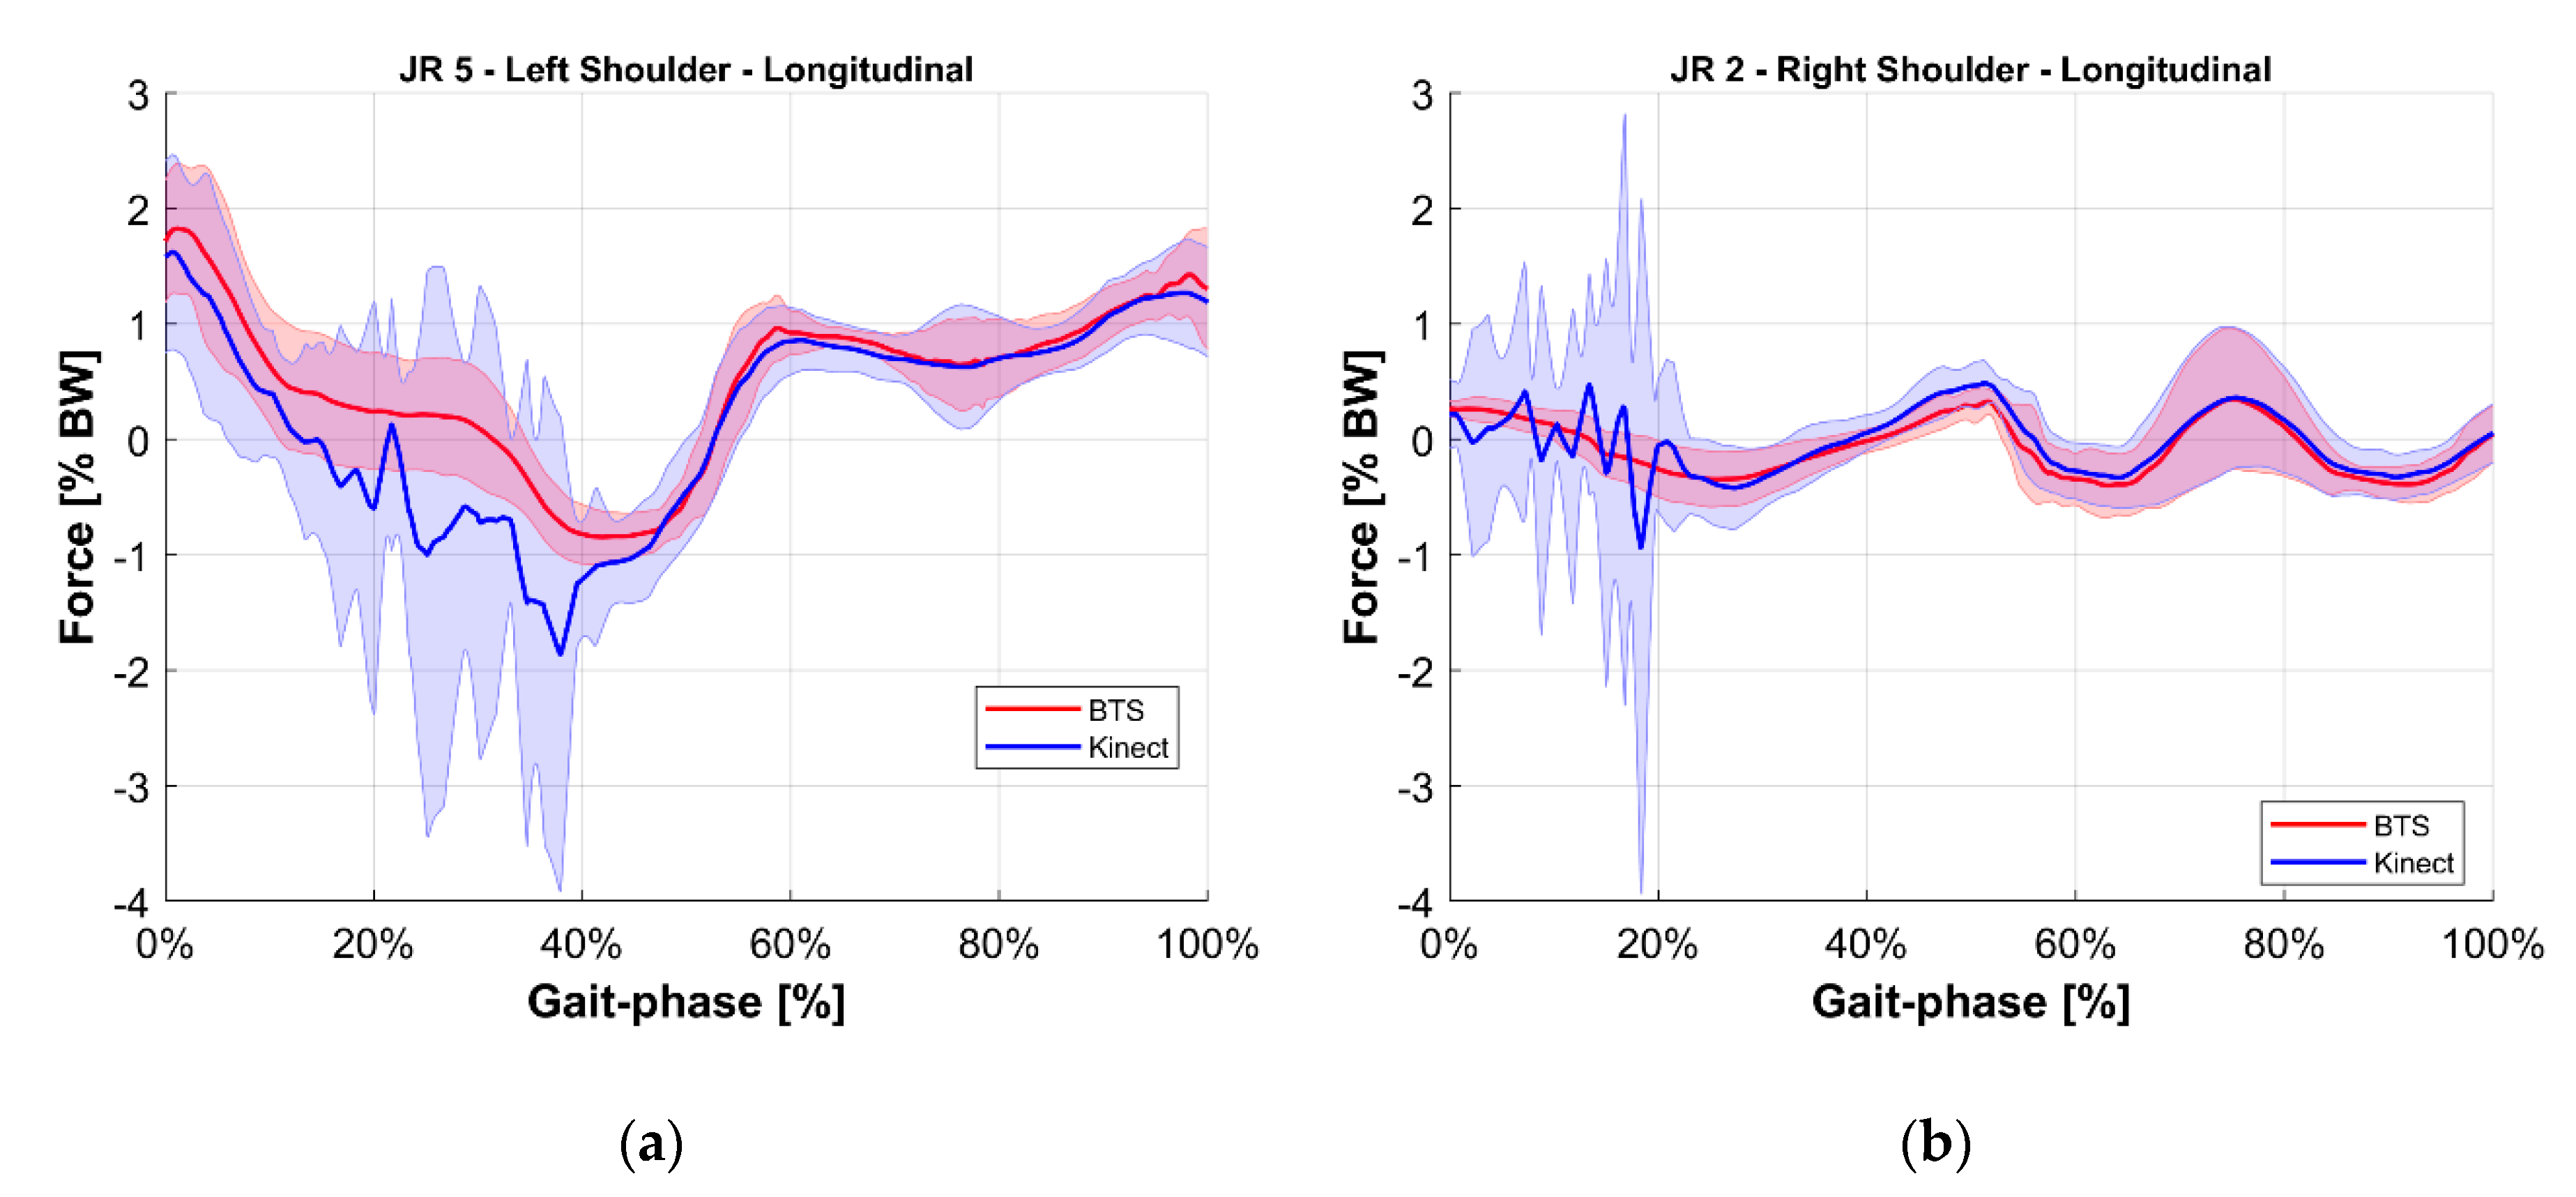
- Validation of the M-K marker-less vision system: it is a comparison of those estimated with the reference upper limbs’ internal reaction forces. The quantities evaluated for this comparison were the longitudinal, lateral, and vertical components of the internal joint reactions in the right and left shoulders and elbows for a total of 12 forces. To provide an overview of the validation, the root mean square of the difference between reference and estimated values of these 12 forces was computed.
4.1. Kinematic Dataset Alignment
- The distance between the right and the left knee: and for the M-K marker-less system and the BTS system respectively,
- the distance between the right knee and its contralateral elbow: and ,
- the distance D3 between the left knee and its contralateral elbow: and .
4.2. Mapping Nodes to Virtual Markers
4.2.1. Kinematic Model Conversion
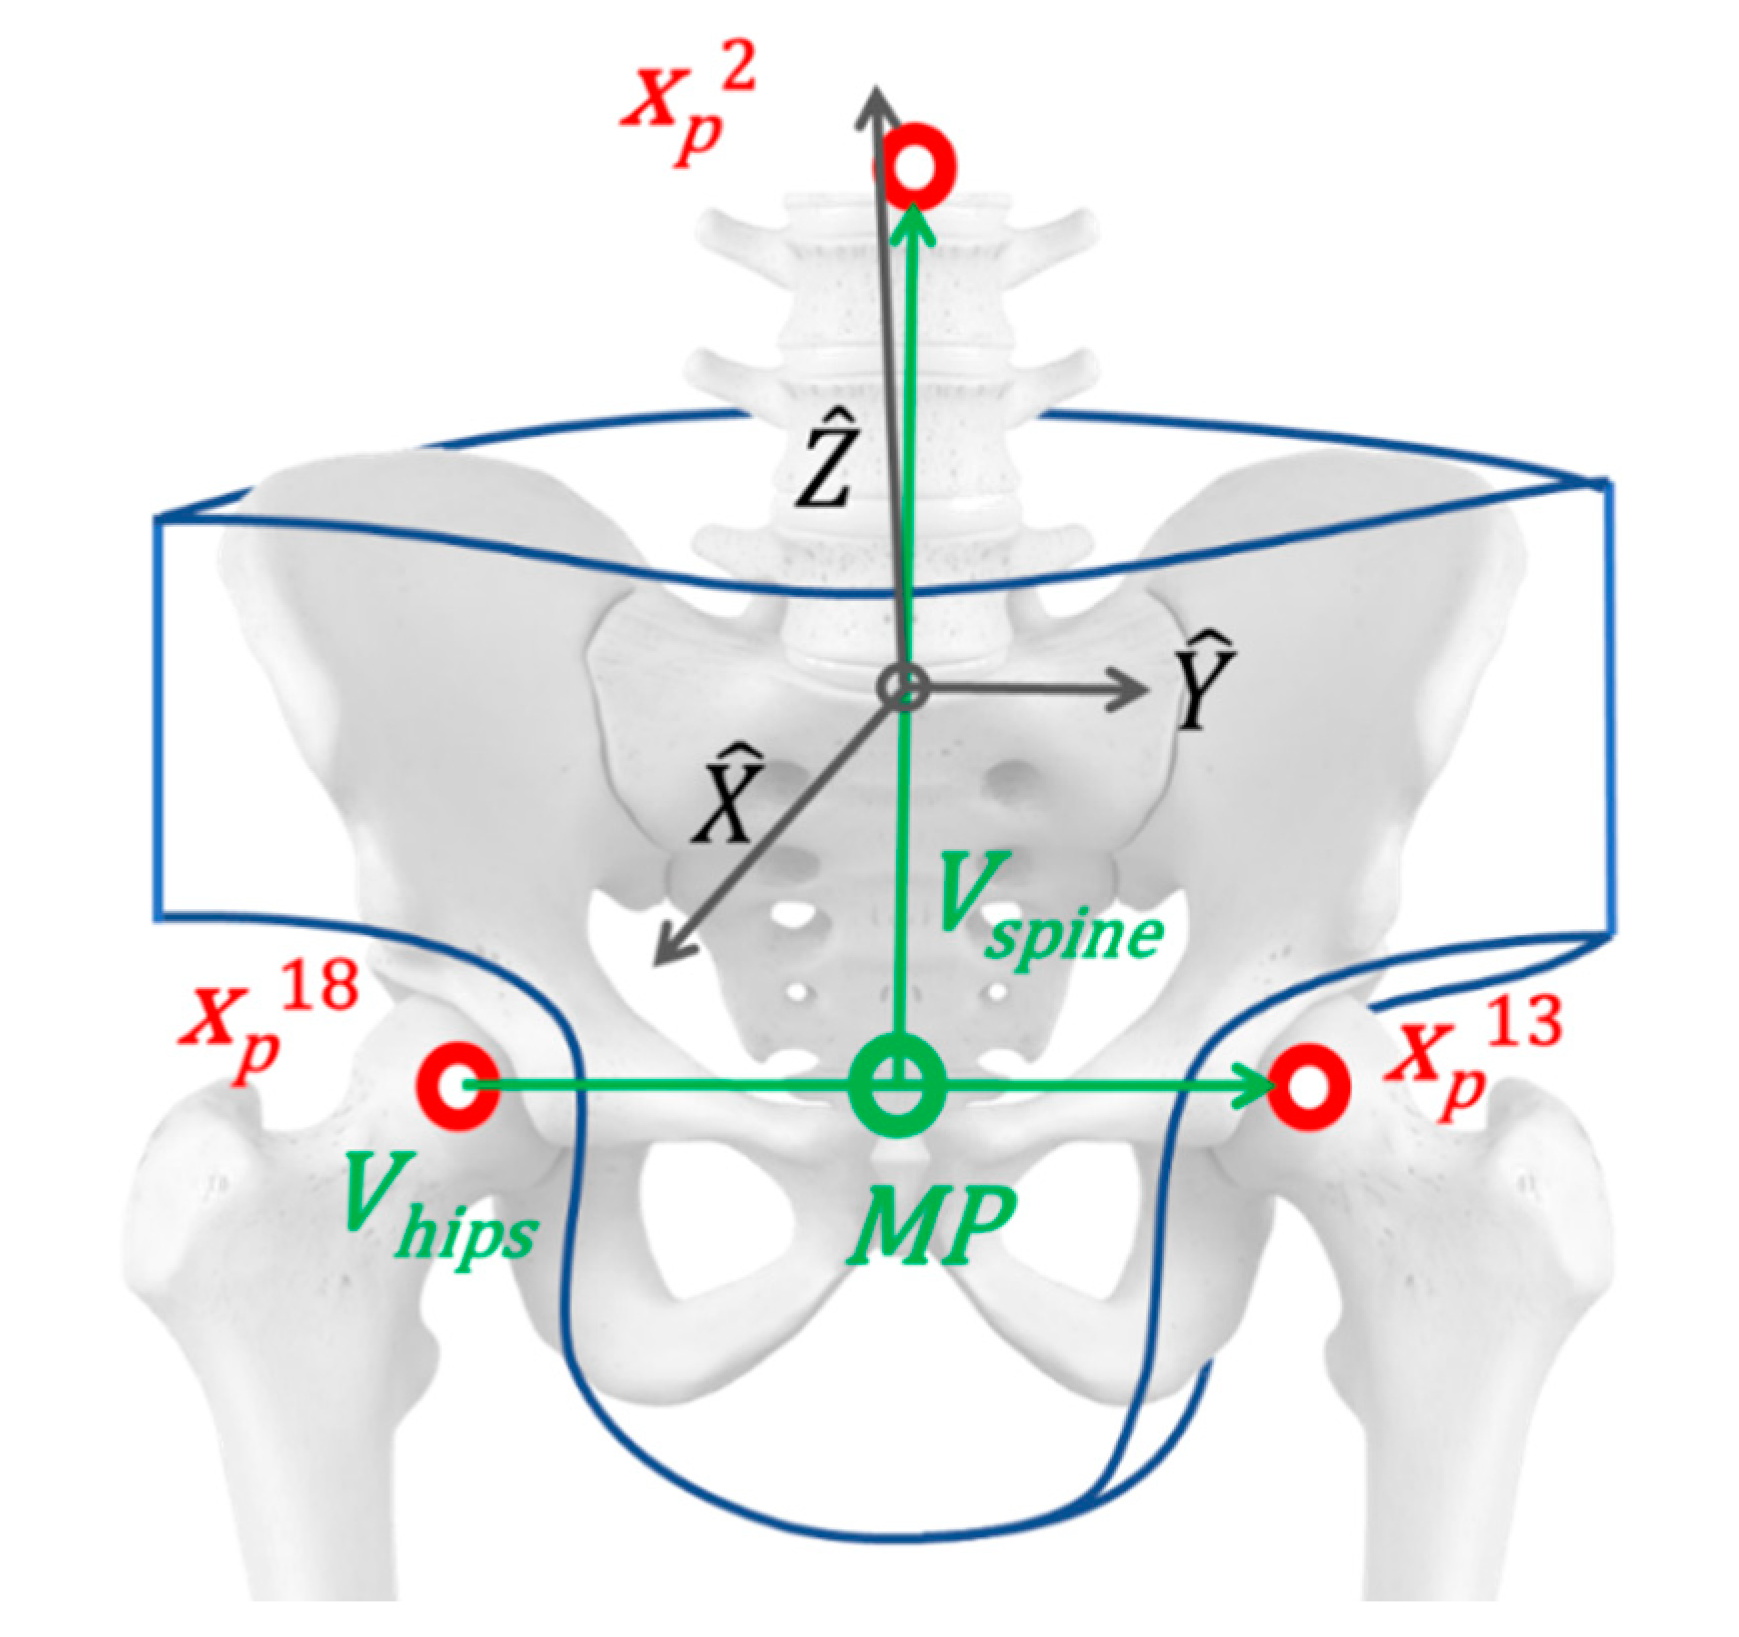
- Pelvis: the pelvis structure is built starting from the hip nodes . The vector that links nodes is set as the principal direction for the local reference system. Its midpoint is used as a base to compute the spinal vector by using as a reference endpoint node located in the middle of the torso. is used as the temporary principal direction, (temporary because and are usually not orthogonal one to the other). Vectors and are normalized ( and ) and used to compute the vector, which points to the frontal direction. Lastly, the cross product of and provides the orthogonal vector which completes the base for the pelvis reference system The origin of the local reference system is defined by moving the hips midpoint MP along the vector of a fixed quantity Equation (1) reports the full notation, and Figure 8 shows a schematic representation of the geometry.
- Torso: for the torso, similarly to the pelvis, the initial reference vector is computed from the nodes of the shoulders. The spinal vector computed for the pelvis is used in a vertical direction. The same normalization procedure is applied.
- Limbs: the reference systems are settled in correspondence with the nodes, from the inner to the outer part of the body. For the upper arm is the shoulder while, for the lower arm, the elbow The wrist and the heel represent the endpoints of the respective limbs. is aligned with the joint while is computed as the normal vector of the plane defined by the motion of the considered limbs frame-by-frame. is derived from the cross product of the previous two. Equation (2) reports the calculation for one of the upper limbs.
- Foot: the foot is defined starting from the definition of the ankle The same orientation is applied to two virtual points.
- Crutch: since the patient’s forearms are strapped to the crutches, each forearm-crutch couple is considered a single rigid body, including the hand. Two virtual points are defined from the reference system of the wrist to model the crutch. Given its geometry, a point is defined for the handle and one is defined for the endpoint.
4.2.2. Virtual Markers Definition
4.3. Inverse Dynamic Analysis
- the inverse kinematic analysis, which provided the degrees of freedom (DoF) value of the model in time, starting from the markers (either virtual or physical) positions,
- the inverse dynamic analysis, to compute the motor torques applied to joints, and the internal joint reaction forces, starting from the kinematic results and the external forces acting on the body (GCRF data and GFRF data from the instrumented crutches and the force platforms, respectively).
- Gait phase normalization: ground reaction forces were used to detect the gait events (heel contact, toe off), and time was scaled to be 0% at the first right heel contact and 100% at the second right heel contact on the force platform.
- Body weight normalization: results in term of force were divided by the weight of the system composed by the subject, the exoskeleton, and the crutches.
- Vertical: axis normal to the gait lab floor, directed upwards,
- Longitudinal: axis normal to the vertical one and along the walking direction of the corridor,
- Lateral: axis normal to the vertical and longitudinal axis, directed towards the right side.
5. Results
6. Discussion
7. Conclusions
Author Contributions
Funding
Acknowledgments
Conflicts of Interest
Appendix A
- We calculate the median value among the four measurements, ;
- For each of the m nodes, the distance from is computed, ;
- The matrix is updated by considering a modified value for in each node by applying the notation reported in Equation (A10).

References
- Ahuja, C.S.; Wilson, J.R.; Nori, S.; Kotter, M.R.N.; Druschel, C.; Curt, A.; Fehlings, M.G. Traumatic spinal cord injury. Nat. Rev. Dis. Primers 2017, 3, 17018. [Google Scholar] [CrossRef] [PubMed]
- Holanda, L.J.; Silva, P.M.M.; Amorim, T.C.; Lacerda, M.O.; Simao, C.R.; Morya, E. Robotic assisted gait as a tool for rehabilitation of individuals with spinal cord injury: A systematic review. J. Neuroeng. Rehabil. 2017, 14, 126. [Google Scholar] [CrossRef] [PubMed]
- Lancini, M.; Serpelloni, M.; Pasinetti, S.; Guanziroli, E.; Lancini, M.; Serpelloni, M.; Pasinetti, S.; Guanziroli, E. Healthcare sensor system exploiting instrumented crutches for force measurement during assisted gait of exoskeleton users. IEEE Sens. J. 2016, 16, 8228–8237. [Google Scholar] [CrossRef]
- Sardini, E.; Serpelloni, M.; Lancini, M.; Pasinetti, S. Wireless instrumented crutches for force and tilt monitoring in lower limb rehabilitation. Procedia Eng. 2014, 87, 348–351. [Google Scholar] [CrossRef]
- Sardini, E.; Serpelloni, M.; Lancini, M. Wireless instrumented crutches for force and movement measurements for gait monitoring. IEEE Trans. Instrum. Meas. 2015, 64, 3369–3379. [Google Scholar] [CrossRef]
- Lancini, M.; Serpelloni, M.; Pasinetti, S. Instrumented crutches to measure the internal forces acting on upper limbs in powered exoskeleton users. In Proceedings of the 2015 6th International Workshop on Advances in Sensors and Interfaces (IWASI), Gallipoli, Italy, 18–19 June 2015; pp. 175–180. [Google Scholar]
- Delp, S.L.; Anderson, F.C.; Arnold, A.S.; Loan, P.; Habib, A.; John, C.T.; Guendelman, E.; Thelen, D.G. OpenSim: Open-source software to create and analyze dynamic simulations of movement. IEEE Trans. Biomed. Eng. 2007, 54, 1940–1950. [Google Scholar] [CrossRef]
- Meyer, J.; Kuderer, M.; Müller, J.; Burgard, W. Online marker labeling for fully automatic skeleton tracking in optical motion capture. In Proceedings of the 2014 IEEE International Conference on Robotics and Automation (ICRA), Hong Kong, China, 31 May–5 June 2014; pp. 5652–5657. [Google Scholar]
- Canton-Ferrer, C.; Casas, J.R.; Pardàs, M. Marker-Based Human motion capture in multiview sequences. EURASIP J. Adv. Signal Process. 2010, 2010, 105476. [Google Scholar] [CrossRef]
- González, I.; López-Nava, I.H.; Fontecha, J.; Muñoz-Meléndez, A.; Pérez-SanPablo, A.I.; Quiñones-Urióstegui, I. Comparison between passive vision-based system and a wearable inertial-based system for estimating temporal gait parameters related to the GAITRite electronic walkway. J. Biomed. Inform. 2016, 62, 210–223. [Google Scholar] [CrossRef]
- Shany, T.; Redmond, S.J.; Narayanan, M.R.; Lovell, N.H. Sensors-based wearable systems for monitoring of human movement and falls. IEEE Sens. J. 2012, 12, 658–670. [Google Scholar] [CrossRef]
- Shi, G.; Chan, C.S.; Li, W.J.; Leung, K.; Zou, Y.; Jin, Y. Mobile human airbag system for fall protection using MEMS sensors and embedded SVM classifier. IEEE Sens. J. 2009, 9, 495–503. [Google Scholar] [CrossRef]
- D’Angelo, L.T.; Neuhaeuser, J.; Zhao, Y.; Lueth, T.C. SIMPLE-Use—Sensor Set for Wearable Movement and Interaction Research. IEEE Sens. J. 2014, 14, 1207–1215. [Google Scholar] [CrossRef]
- Kan, Y.; Chen, C. A wearable inertial sensor node for body motion analysis. IEEE Sens. J. 2012, 12, 651–657. [Google Scholar] [CrossRef]
- King, K.; Yoon, S.W.; Perkins, N.C.; Najafi, K. Wireless MEMS inertial sensor system for golf swing dynamics. Sens. Actuators A Phys. 2008, 141, 619–630. [Google Scholar] [CrossRef]
- McGinnis, R.S.; Perkins, N.C. A highly miniaturized, wireless inertial measurement unit for characterizing the dynamics of pitched baseballs and softballs. Sensors 2012, 12, 11933–11945. [Google Scholar] [CrossRef]
- Zihajehzadeh, S.; Lee, T.J.; Lee, J.K.; Hoskinson, R.; Park, E.J. Integration of MEMS inertial and pressure sensors for vertical trajectory determination. IEEE Trans. Instrum. Meas. 2015, 64, 804–814. [Google Scholar] [CrossRef]
- Antifakos, S.; Schiele, B. Bridging the gap between virtual and physical games using wearable sensors. In Proceedings of the Sixth International Symposium on Wearable Computers, Seattle, WA, USA, 7–10 October 2002; pp. 139–140. [Google Scholar]
- Wang, W.; Fu, L. Mirror therapy with an exoskeleton upper-limb robot based on IMU measurement system. In Proceedings of the 2011 IEEE International Symposium on Medical Measurements and Applications, Bari, Italy, 30–31 May 2011; pp. 370–375. [Google Scholar]
- Cifuentes, C.; Braidot, A.; Rodríguez, L.; Frisoli, M.; Santiago, A.; Frizera, A. Development of a wearable ZigBee sensor system for upper limb rehabilitation robotics. In Proceedings of the 2012 4th IEEE RAS EMBS International Conference on Biomedical Robotics and Biomechatronics (BioRob), Rome, Italy, 25–27 June 2012; pp. 1989–1994. [Google Scholar]
- Lau, H.; Tong, K. The reliability of using accelerometer and gyroscope for gait event identification on persons with dropped foot. Gait Posture 2008, 27, 248–257. [Google Scholar] [CrossRef]
- Seel, T.; Raisch, J.; Schauer, T. IMU-based joint angle measurement for gait analysis. Sensors 2014, 14, 6891–6909. [Google Scholar] [CrossRef]
- Saponara, S. Wearable biometric performance measurement system for combat sports. IEEE Trans. Instrum. Meas. 2017, 66, 2545–2555. [Google Scholar] [CrossRef]
- Zihajehzadeh, S.; Yoon, P.K.; Kang, B.; Park, E.J. UWB-aided inertial motion capture for lower body 3-D dynamic activity and trajectory tracking. IEEE Trans. Instrum. Meas. 2015, 64, 3577–3587. [Google Scholar] [CrossRef]
- Zhang, Z.; Wu, J. A novel hierarchical information fusion method for three-dimensional upper limb motion estimation. IEEE Trans. Instrum. Meas. 2011, 60, 3709–3719. [Google Scholar] [CrossRef]
- Ahmed, H.; Tahir, M.; Ahmed, H.; Tahir, M. Improving the accuracy of human body orientation estimation with wearable IMU sensors. IEEE Trans. Instrum. Meas. 2017, 66, 535–542. [Google Scholar] [CrossRef]
- Jung, J.-Y.; Heo, W.; Yang, H.; Park, H. A neural network-based gait phase classification method using sensors equipped on lower limb exoskeleton robots. Sensors 2015, 15, 27738–27759. [Google Scholar] [CrossRef] [PubMed]
- Pappas, I.P.; Popovic, M.R.; Keller, T.; Dietz, V.; Morari, M. A reliable gait phase detection system. IEEE Trans. Neural Syst. Rehabil. Eng. 2001, 9, 113–125. [Google Scholar] [CrossRef] [PubMed]
- Mohammed, S.; Samé, A.; Oukhellou, L.; Kong, K.; Huo, W.; Amirat, Y. Recognition of gait cycle phases using wearable sensors. Robot. Auton. Syst. 2016, 75, 50–59. [Google Scholar] [CrossRef]
- Liu, D.-X.; Wu, X.; Du, W.; Wang, C.; Xu, T. Gait Phase Recognition for Lower-Limb Exoskeleton with Only Joint Angular Sensors. Sensors 2016, 16, 1579. [Google Scholar] [CrossRef]
- Taylor, W.R.; Ehrig, R.M.; Duda, G.N.; Schell, H.; Seebeck, P.; Heller, M.O. On the influence of soft tissue coverage in the determination of bone kinematics using skin markers. J. Orthop. Res. 2005, 23, 726–734. [Google Scholar] [CrossRef]
- Yang, S.X.M.; Christiansen, M.S.; Larsen, P.K.; Alkjær, T.; Moeslund, T.B.; Simonsen, E.B.; Lynnerup, N. Markerless motion capture systems for tracking of persons in forensic biomechanics: An overview. Comput. Methods Biomech. Biomed. Eng. Imaging Vis. 2014, 2, 46–65. [Google Scholar] [CrossRef]
- Colyer, S.L.; Evans, M.; Cosker, D.P.; Salo, A.I.T. A Review of the Evolution of Vision-Based Motion Analysis and the Integration of Advanced Computer Vision Methods Towards Developing a Markerless System. Sports Med. Open 2018, 4. [Google Scholar] [CrossRef]
- Morrison, C.; Culmer, P.; Mentis, H.; Pincus, T. Vision-based body tracking: Turning Kinect into a clinical tool. Disabil. Rehabil. Assist. Technol. 2016, 11, 516–520. [Google Scholar] [CrossRef][Green Version]
- Pasinetti, S.; Hassan, M.M.; Eberhardt, J.; Lancini, M.; Docchio, F.; Sansoni, G. Performance Analysis of the PMD Camboard Picoflexx Time-of-Flight Camera for Markerless Motion Capture Applications. IEEE Trans. Instrum. Meas. 2019, 1–16. [Google Scholar] [CrossRef]
- Shotton, J.; Fitzgibbon, A.; Blake, A.; Kipman, A.; Finocchio, M.; Moore, B.; Sharp, T. Real-Time Human Pose Recognition in Parts from a Single Depth Image. In Proceedings of the Computer Vision and Pattern Recognition (CVPR), Colorado Springs, CO, USA, 20–25 June 2011. [Google Scholar] [CrossRef]
- Zennaro, S.; Munaro, M.; Milani, S.; Zanuttigh, P.; Bernardi, A.; Ghidoni, S.; Menegatti, E. Performance evaluation of the 1st and 2nd generation Kinect for multimedia applications. In Proceedings of the 2015 IEEE International Conference on Multimedia and Expo (ICME), Turin, Italy, 29 June–3 July 2015; pp. 1–6. [Google Scholar]
- Ciabattoni, L.; Ferracuti, F.; Iarlori, S.; Longhi, S.; Romeo, L. A novel computer vision based e-rehabilitation system: From gaming to therapy support. In Proceedings of the 2016 IEEE International Conference on Consumer Electronics (ICCE), Las Vegas, NV, USA, 9–11 January 2016; pp. 43–44. [Google Scholar]
- Fankhauser, P.; Bloesch, M.; Rodriguez, D.; Kaestner, R.; Hutter, M.; Siegwart, R. Kinect v2 for mobile robot navigation: Evaluation and modeling. In Proceedings of the 2015 International Conference on Advanced Robotics (ICAR), Istanbul, Turkey, 27–31 July 2015; pp. 388–394. [Google Scholar]
- Plouffe, G.; Cretu, A. Static and Dynamic Hand Gesture Recognition in Depth Data Using Dynamic Time Warping. IEEE Trans. Instrum. Meas. 2016, 65, 305–316. [Google Scholar] [CrossRef]
- Nuzzi, C.; Pasinetti, S.; Pagani, R.; Franco, D.; Sansoni, G. Hand gesture recognition for collaborative workstations: A smart command system prototype. In Proceedings of the International Conference on Image Analysis and Processing, Trento, Italy, 9–13 September 2019; pp. 332–342. [Google Scholar]
- Munaro, M.; Basso, F.; Menegatti, E. OpenPTrack: Open source multi-camera calibration and people tracking for RGB-D camera networks. Robot. Auton. Syst. 2016, 75, 525–538. [Google Scholar] [CrossRef]
- Gao, Z.; Yu, Y.; Zhou, Y.; Du, S. Leveraging Two Kinect Sensors for Accurate Full-Body Motion Capture. Sensors 2015, 15, 24297–24317. [Google Scholar] [CrossRef] [PubMed]
- Leightley, D.; McPhee, J.S.; Yap, M.H. Automated Analysis and Quantification of Human Mobility Using a Depth Sensor. IEEE J. Biomed. Health Inform. 2017, 21, 939–948. [Google Scholar] [CrossRef]
- Webster, D.; Celik, O. Systematic review of Kinect applications in elderly care and stroke rehabilitation. J. Neuroeng. Rehabil. 2014, 11, 108. [Google Scholar] [CrossRef] [PubMed]
- van Diest, M.; Stegenga, J.; Wörtche, H.J.; Postema, K.; Verkerke, G.J.; Lamoth, C.J.C. Suitability of Kinect for measuring whole body movement patterns during exergaming. J. Biomech. 2014, 47, 2925–2932. [Google Scholar] [CrossRef] [PubMed]
- Knippenberg, E.; Verbrugghe, J.; Lamers, I.; Palmaers, S.; Timmermans, A.; Spooren, A. Markerless motion capture systems as training device in neurological rehabilitation: A systematic review of their use, application, target population and efficacy. J. Neuroeng. Rehabil. 2017, 14, 61. [Google Scholar] [CrossRef]
- Leightley, D.; Darby, J.; Li, B.; McPhee, J.S.; Yap, M.H. Human Activity Recognition for Physical Rehabilitation. In Proceedings of the 2013 IEEE International Conference on Systems, Man, and Cybernetics, Manchester, UK, 13–16 October 2013; pp. 261–266. [Google Scholar]
- Theofanidis, M.; Lioulemes, A.; Makedon, F. A Motion and Force Analysis System for Human Upper-limb Exercises. In Proceedings of the 9th ACM International Conference on PErvasive Technologies Related to Assistive Environments, Corfu Island, Greece, 29 June–1 July 2016; pp. 9:1–9:8. [Google Scholar]
- Bonnechère, B.; Jansen, B.; Salvia, P.; Bouzahouene, H.; Omelina, L.; Moiseev, F.; Sholukha, V.; Cornelis, J.; Rooze, M.; Jan, S.V.S. Validity and reliability of the Kinect within functional assessment activities: Comparison with standard stereophotogrammetry. Gait Posture 2014, 39, 593–598. [Google Scholar] [CrossRef]
- Zhao, W.; Reinthal, M.A.; Espy, D.D.; Luo, X. Rule-Based Human Motion Tracking for Rehabilitation Exercises: Realtime Assessment, Feedback, and Guidance. IEEE Access 2017, 5, 21382–21394. [Google Scholar] [CrossRef]
- Capecci, M.; Ceravolo, M.G.; Ferracuti, F.; Grugnetti, M.; Iarlori, S.; Longhi, S.; Romeo, L.; Verdini, F. An instrumental approach for monitoring physical exercises in a visual markerless scenario: A proof of concept. J. Biomech. 2018, 69, 70–80. [Google Scholar] [CrossRef]
- Abbondanza, P.; Giancola, S.; Sala, R.; Tarabini, M. Accuracy of the Microsoft Kinect System in the Identification of the Body Posture. In Proceedings of the Wireless Mobile Communication and Healthcare, Vienna, Austria, 14–15 November 2017; pp. 289–296. [Google Scholar]
- Cecco, M.D.; Fornaser, A.; Tomasin, P.; Zanetti, M.; Guandalini, G.; Ianes, P.G.; Pilla, F.; Nollo, G.; Valente, M.; Pisoni, T. Augmented Reality to Enhance the Clinician’s Observation During Assessment of Daily Living Activities. In Proceedings of the Augmented Reality, Virtual Reality, and Computer Graphics 4th International Conference, Ugento, Italy, 12–15 June 2017; pp. 3–21. [Google Scholar]
- Müller, B.; Ilg, W.; Giese, M.A.; Ludolph, N. Validation of enhanced kinect sensor based motion capturing for gait assessment. PLoS ONE 2017, 12, e0175813. [Google Scholar] [CrossRef]
- Geerse, D.J.; Coolen, B.H.; Roerdink, M. Kinematic Validation of a Multi-Kinect v2 Instrumented 10-Meter Walkway for Quantitative Gait Assessments. PLoS ONE 2015, 10, e0139913. [Google Scholar] [CrossRef] [PubMed]
- Pfister, A.; West, A.M.; Bronner, S.; Noah, J.A. Comparative abilities of Microsoft Kinect and Vicon 3D motion capture for gait analysis. J. Med. Eng. Technol. 2014, 38, 274–280. [Google Scholar] [CrossRef] [PubMed]
- Steward, J.; Lichti, D.D.; Chow, D.; Ferber, R.; Osis, S.T. Performance Assessment and Calibration of the Kinect 2.0 Time-of-Flight Range Camera for Use in Motion Capture Applications. In Proceedings of the FIG Working week, Sofia, Bulgaria, 17–21 May 2015; pp. 1–14. [Google Scholar]
- Otte, K.; Kayser, B.; Mansow-Model, S.; Verrel, J.; Paul, F.; Brandt, A.U.; Schmitz-Hübsch, T. Accuracy and Reliability of the Kinect Version 2 for Clinical Measurement of Motor Function. PLoS ONE 2016, 11, e0166532. [Google Scholar] [CrossRef]
- Fornaser, A.; Tomasin, P.; Cecco, M.D.; Tavernini, M.; Zanetti, M. Automatic graph based spatiotemporal extrinsic calibration of multiple Kinect V2 ToF cameras. Robot. Auton. Syst. 2017, 98, 105–125. [Google Scholar] [CrossRef]
- Wei, T.; Lee, B.; Qiao, Y.; Kitsikidis, A.; Dimitropoulos, K.; Grammalidis, N. Experimental study of skeleton tracking abilities from microsoft kinect non-frontal views. In Proceedings of the 2015 3DTV-Conference: The True Vision-Capture, Transmission and Display of 3D Video (3DTV-CON), Lisbon, Portugal, 8–10 July 2015; pp. 1–4. [Google Scholar]
- Hicks, J.L.; Uchida, T.K.; Seth, A.; Rajagopal, A.; Delp, S.L. Is My Model Good Enough? Best Practices for Verification and Validation of Musculoskeletal Models and Simulations of Movement. J. Biomech. Eng. 2015, 137. [Google Scholar] [CrossRef]
- Mills, C.; Pain, M.T.G.; Yeadon, M.R. The influence of simulation model complexity on the estimation of internal loading in gymnastics landings. J. Biomech. 2008, 41, 620–628. [Google Scholar] [CrossRef] [PubMed]
- Seth, A.; Hicks, J.L.; Uchida, T.K.; Habib, A.; Dembia, C.L.; Dunne, J.J.; Ong, C.F.; DeMers, M.S.; Rajagopal, A.; Millard, M.; et al. OpenSim: Simulating musculoskeletal dynamics and neuromuscular control to study human and animal movement. PLoS Comput. Biol. 2018, 14, e1006223. [Google Scholar] [CrossRef]
- Pathirana, P.N.; Li, S.; Trinh, H.M.; Seneviratne, A. Robust Real-Time Bio-Kinematic Movement Tracking Using Multiple Kinects for Tele-Rehabilitation. IEEE Trans. Ind. Electron. 2016, 63, 1822–1833. [Google Scholar] [CrossRef]
- Moon, S.; Park, Y.; Ko, D.W.; Suh, I.H. Multiple Kinect Sensor Fusion for Human Skeleton Tracking Using Kalman Filtering. Int. J. Adv. Robot. Syst. 2016, 13, 65. [Google Scholar] [CrossRef]
- Li, S.; Pathirana, P.N.; Caelli, T. Multi-kinect skeleton fusion for physical rehabilitation monitoring. In Proceedings of the EMBC 2014, 36th Annual international conference of the IEEE engineering in medicine and biology society, Chicago, IL, USA, 26–30 August 2014; pp. 5060–5063. [Google Scholar] [CrossRef]
- González, I.; Fontecha, J.; Hervás, R.; Bravo, J. An Ambulatory System for Gait Monitoring Based on Wireless Sensorized Insoles. Sensors 2015, 15, 16589–16613. [Google Scholar] [CrossRef] [PubMed]
- Winter, D.A. Biomechanics and Motor Control of Human Movement, 4th ed.; John Wiley&Sons: Hoboken, NJ, USA, 2009. [Google Scholar]
- Lund, M.E.; Andersen, M.S.; de Zee, M.; Rasmussen, J. Functional Scaling of Musculoskeletal Models. In Proceedings of the Congress of the International Society of Biomechanics, ISB, Brussels, Belgium, 3–7 July 2011. [Google Scholar]
- Davis, R.B.; Õunpuu, S.; Tyburski, D.; Gage, J.R. A gait analysis data collection and reduction technique. Hum. Mov. Sci. 1991, 10, 575–587. [Google Scholar] [CrossRef]
- Alvarez, M.; Torricelli, D.; del-Ama, A.; Fernández, D.P.; Gonzalez-Vargas, J.; Moreno, J.; Gil-Agudo, A.; Pons, J. Simultaneous estimation of human and exoskeleton motion: A simplified protocol. In Proceedings of the IEEE International Conference on Rehabilitation Robotics (ICORR), Zurich, Switzerland, 27 June–1 July 2011. [Google Scholar]
- Mantovani, G.; Lamontagne, M. How Different Marker Sets Affect Joint Angles in Inverse Kinematics Framework. J. Biomech. Eng. 2017, 139. [Google Scholar] [CrossRef] [PubMed]
- Burnfield, M. Gait analysis: Normal and pathological function. J. Sports Sci. Med. 2010, 9, 353. [Google Scholar]
- Welch, G.; Bishop, G. An Introduction to the Kalman Filter. 2006. Available online: http://citeseerx.ist.psu.edu/viewdoc/download?doi=10.1.1.336.5576&rep=rep1&type=pdf (accessed on 10 July 2020).


| Distances | Nodes | Physical Markers |
|---|---|---|
| D1 | LK, RK | |
| D2 | RK, LE | |
| D3 | LK, RE |
| Variable | Name | Description |
|---|---|---|
| JR1 | Right Shoulder Vertical | Force acting on the torso given by the upper right arm, along the vertical axis of the ground reference. |
| JR2 | Right Shoulder Longitudinal | Force acting on the torso given by the upper right arm, along the longitudinal axis of the ground reference. |
| JR3 | Right Shoulder Lateral | Force acting on the torso given by the upper right arm, along the lateral axis of the ground reference. |
| JR4 | Left Shoulder Vertical | Force acting on the torso given by the upper left arm, along the vertical axis of the ground reference. |
| JR5 | Left Shoulder Longitudinal | Force acting on the torso given by the upper left arm, along the longitudinal axis of the ground reference. |
| JR6 | Left Shoulder Lateral | Force acting on the torso given by the upper left arm, along the lateral axis of the ground reference. |
| JR7 | Right Elbow Vertical | Force acting on the right upper arm given by the right lower arm, along the vertical axis of the ground reference. |
| JR8 | Right Elbow Longitudinal | Force acting on the right upper arm given by the right lower arm, along the longitudinal axis of the ground reference. |
| JR9 | Right Elbow Lateral | Force acting on the right upper arm given by the right lower arm, along the lateral axis of the ground reference. |
| JR10 | Left Elbow Vertical | Force acting on the left upper arm given by the left lower arm, along the vertical axis of the ground reference. |
| JR11 | Left Elbow Longitudinal | Force acting on the left upper arm given by the left lower arm, along the longitudinal axis of the ground reference. |
| JR12 | Left Elbow Lateral | Force acting on the left upper arm given by the left lower arm, along the lateral axis of the ground reference. |
| Joint Reaction | Root Mean Square Error RMSE (%BW) | ||
|---|---|---|---|
| Right | Left | ||
| Shoulder | Longitudinal | 0.4% | 0.9% |
| Vertical | 1.1% | 0.9% | |
| Lateral | 0.8% | 0.7% | |
| Elbow | Longitudinal | 0.8% | 0.5% |
| Vertical | 1.5% | 1.0% | |
| Lateral | 0.4% | 0.4% | |
© 2020 by the authors. Licensee MDPI, Basel, Switzerland. This article is an open access article distributed under the terms and conditions of the Creative Commons Attribution (CC BY) license (http://creativecommons.org/licenses/by/4.0/).
Share and Cite
Pasinetti, S.; Nuzzi, C.; Covre, N.; Luchetti, A.; Maule, L.; Serpelloni, M.; Lancini, M. Validation of Marker-Less System for the Assessment of Upper Joints Reaction Forces in Exoskeleton Users. Sensors 2020, 20, 3899. https://doi.org/10.3390/s20143899
Pasinetti S, Nuzzi C, Covre N, Luchetti A, Maule L, Serpelloni M, Lancini M. Validation of Marker-Less System for the Assessment of Upper Joints Reaction Forces in Exoskeleton Users. Sensors. 2020; 20(14):3899. https://doi.org/10.3390/s20143899
Chicago/Turabian StylePasinetti, Simone, Cristina Nuzzi, Nicola Covre, Alessandro Luchetti, Luca Maule, Mauro Serpelloni, and Matteo Lancini. 2020. "Validation of Marker-Less System for the Assessment of Upper Joints Reaction Forces in Exoskeleton Users" Sensors 20, no. 14: 3899. https://doi.org/10.3390/s20143899
APA StylePasinetti, S., Nuzzi, C., Covre, N., Luchetti, A., Maule, L., Serpelloni, M., & Lancini, M. (2020). Validation of Marker-Less System for the Assessment of Upper Joints Reaction Forces in Exoskeleton Users. Sensors, 20(14), 3899. https://doi.org/10.3390/s20143899