Laboratory Evaluations of Correction Equations with Multiple Choices for Seed Low-Cost Particle Sensing Devices in Sensor Networks


Abstract
1. Introduction
2. Materials and Methods
2.1. Sensors and Instruments
2.2. Hood and Chamber
2.3. Burnt Materials
2.4. Sensor Drift
2.5. Data Analysis
3. Results
3.1. Hood Versus Chamber Experiments
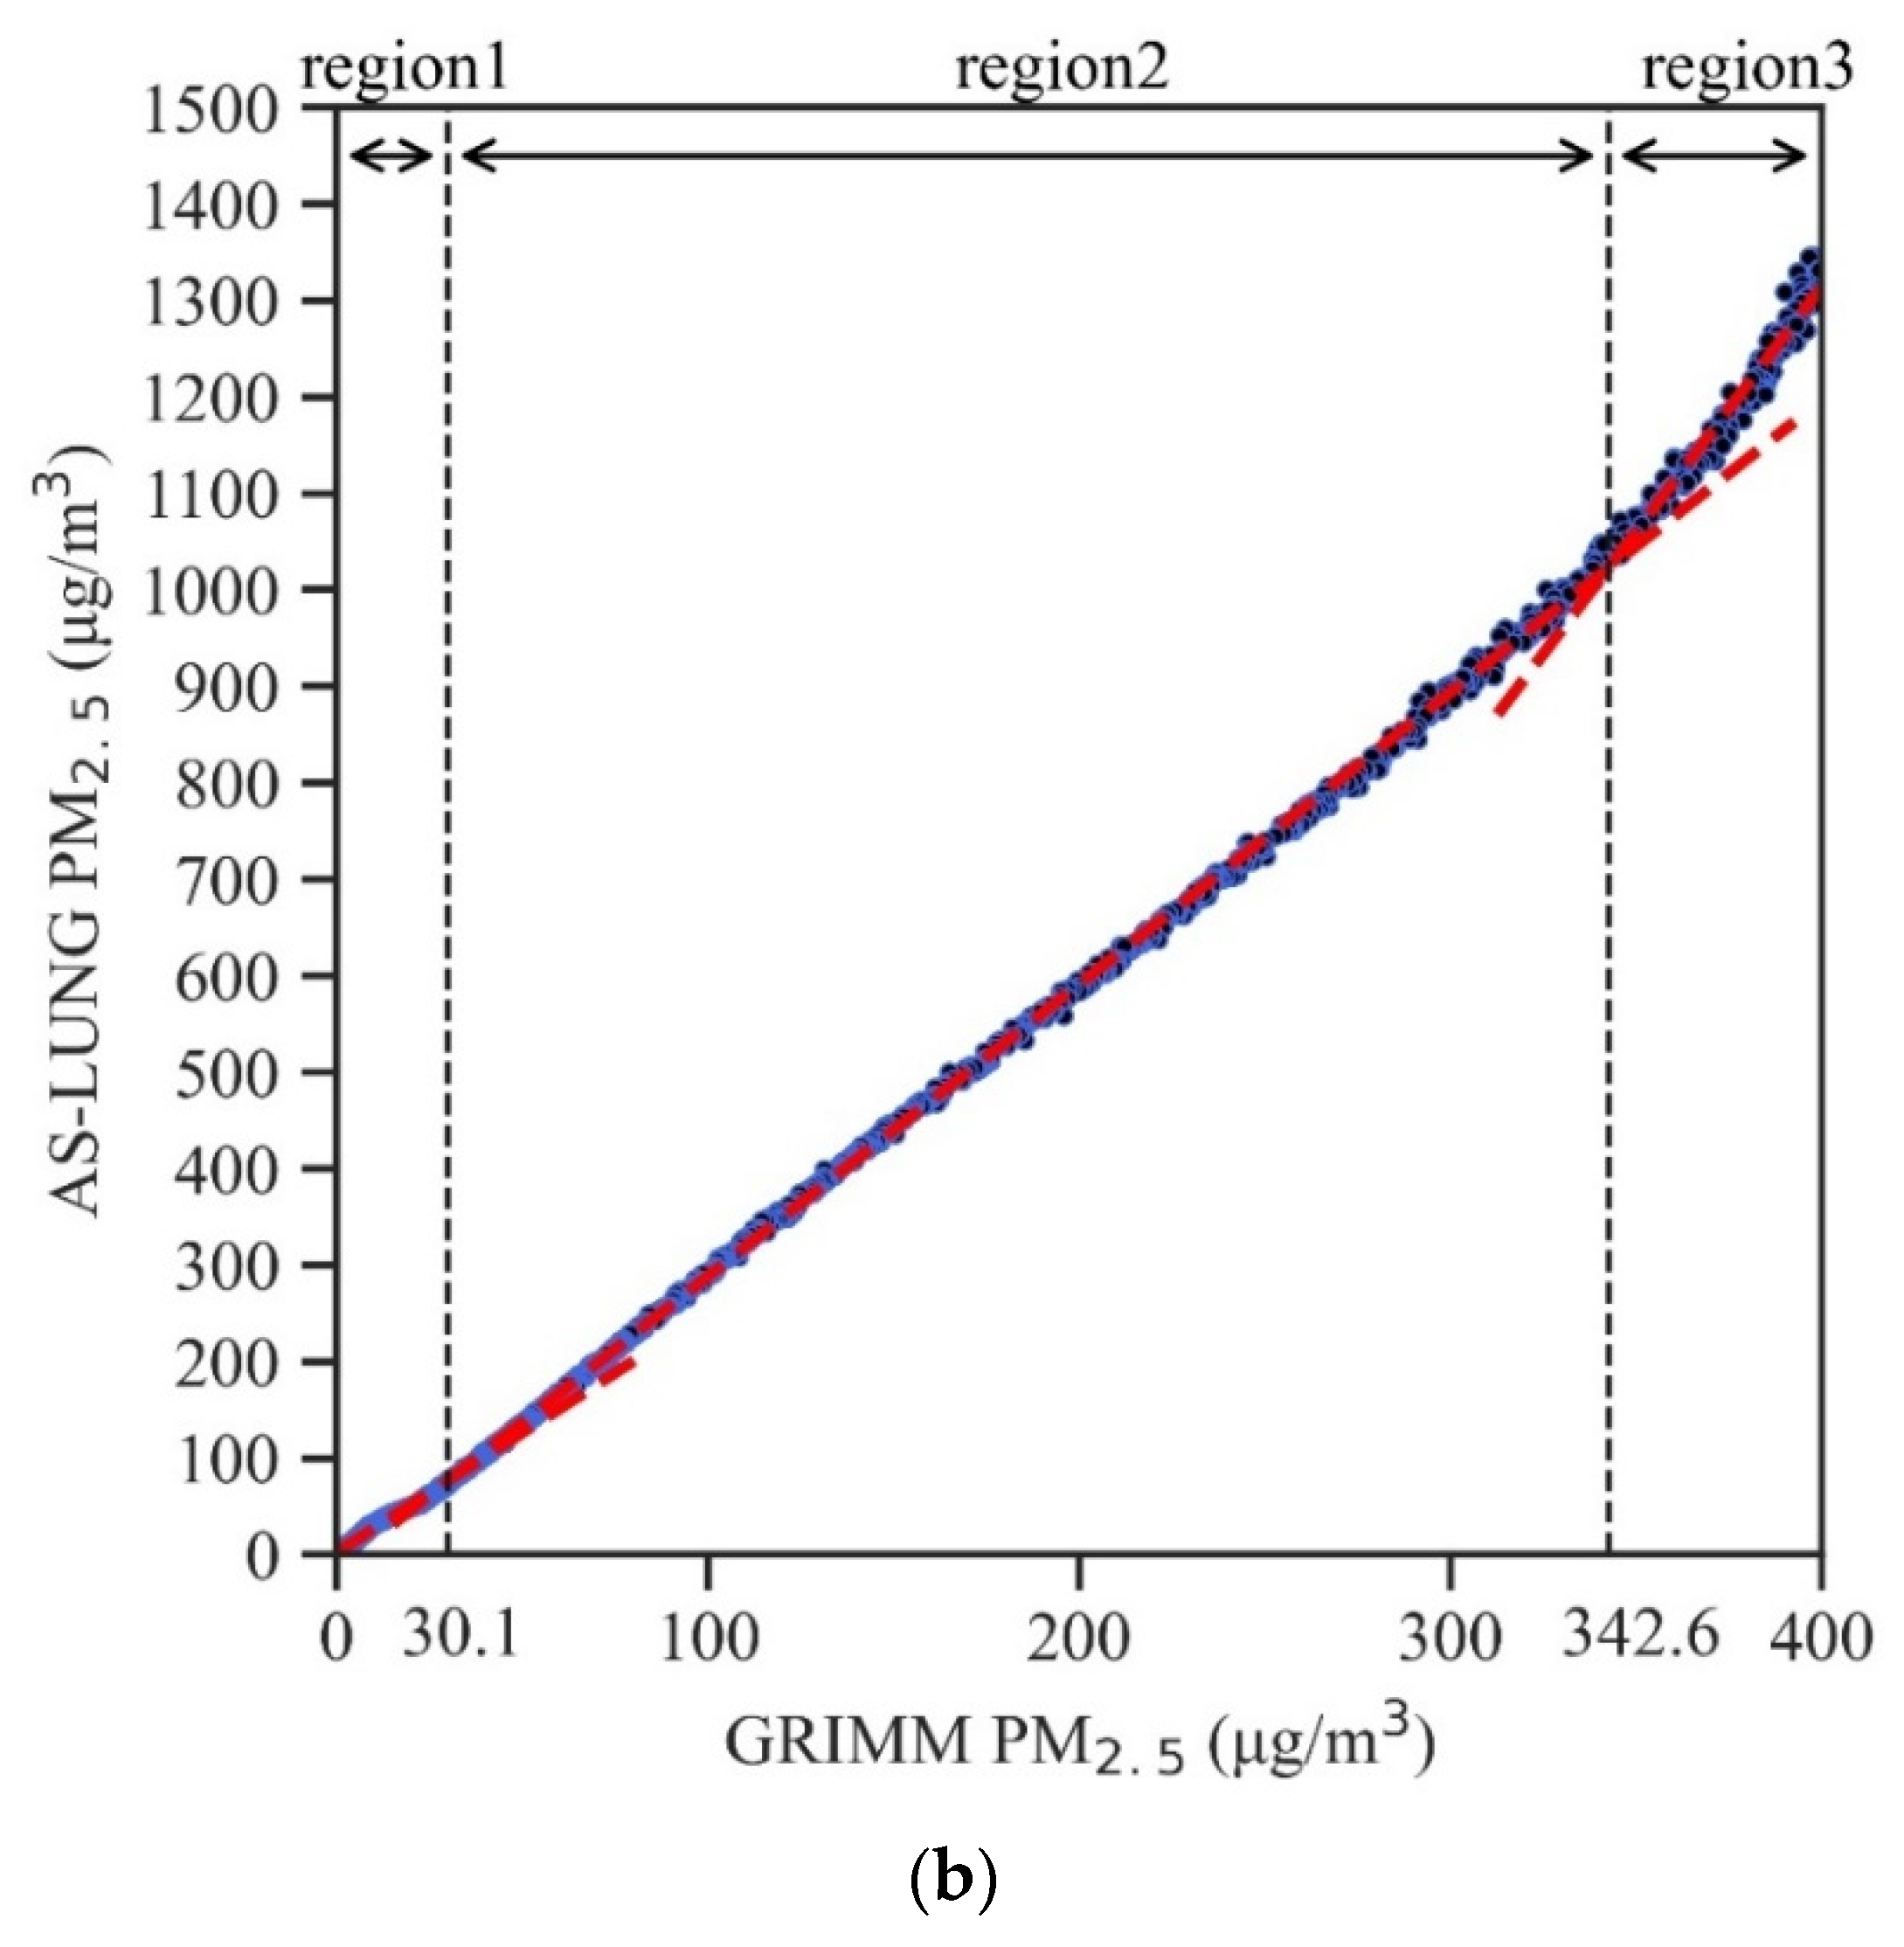
3.2. Linear versus Segmented Regressions
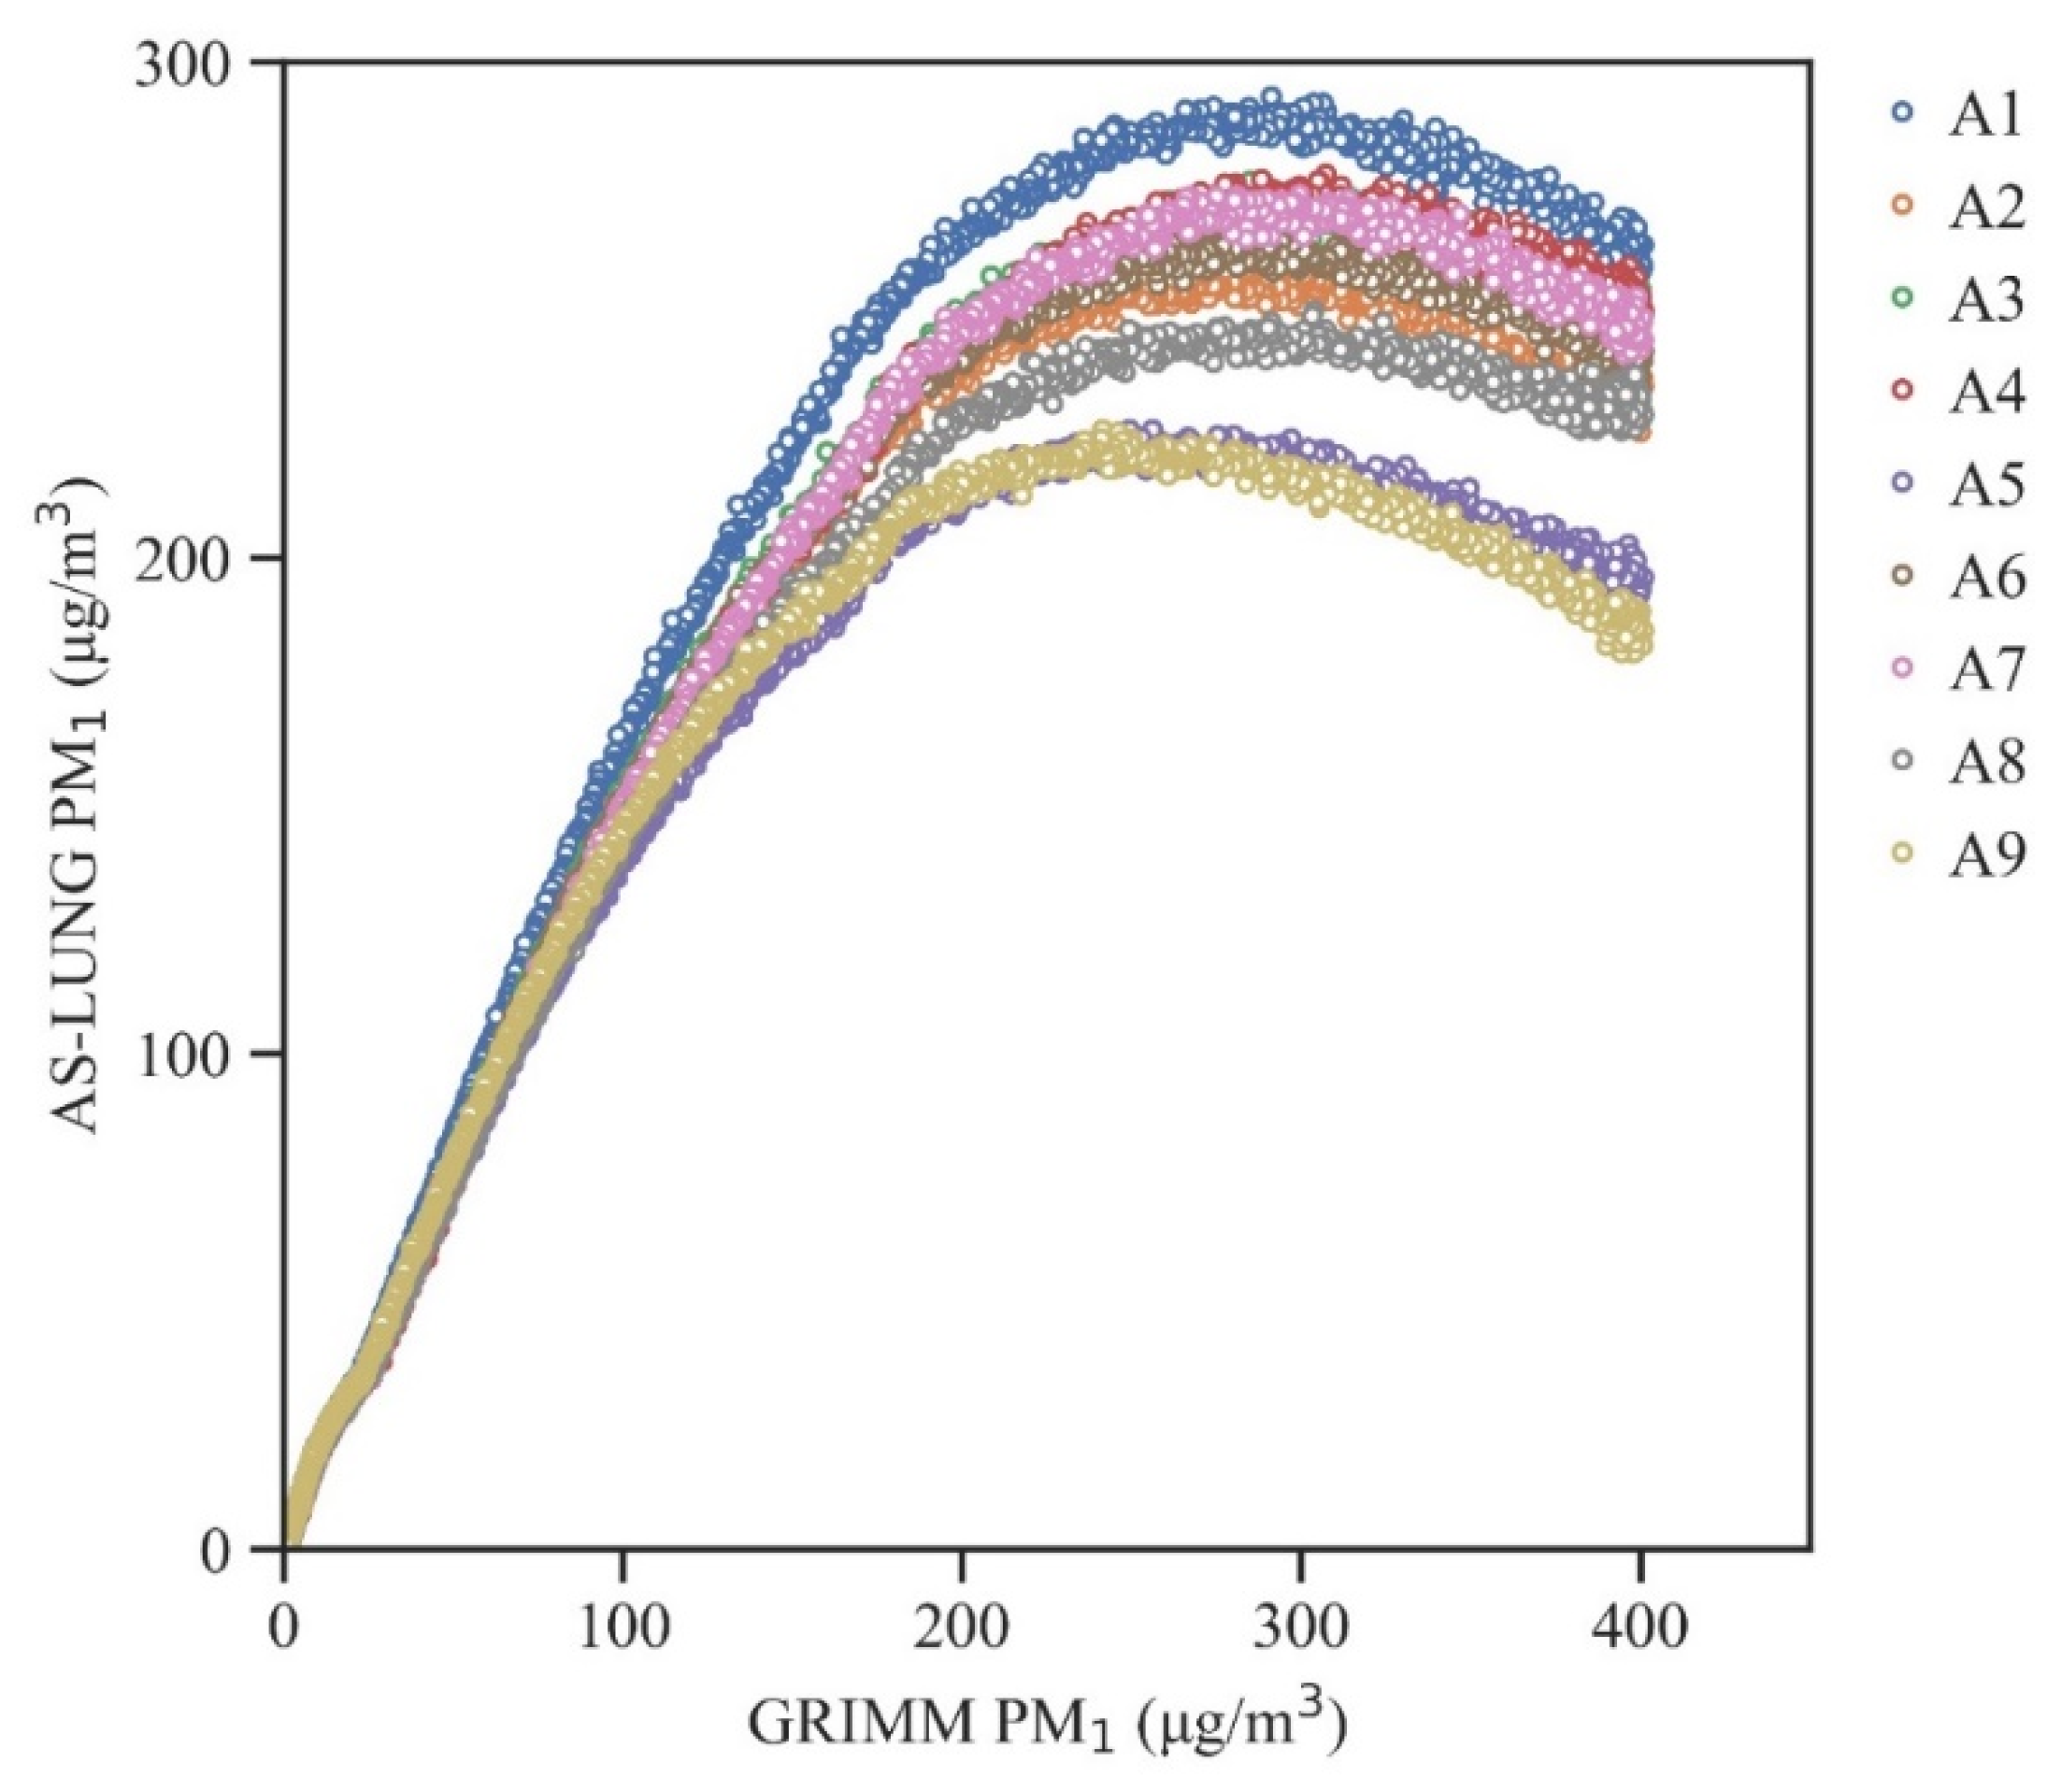
3.3. High-Level Curves and Ceiling Values for PM1
3.4. Incense Versus Mosquito Coils
3.5. Sensor Drift
4. Discussion
4.1. Performance of PMS3003 and AS-LUNG Sets
4.2. Choices of Evaluation Settings
5. Conclusions
Author Contributions
Funding
Acknowledgments
Conflicts of Interest
References
- IARC. IARC Scientific Publication No. 161: Air Pollution and Cancer; International Agency for Research on Cancer (IARC): Lyon, France, 2013. [Google Scholar]
- Forouzanfar, M.H.; Afshin, A.; Alexander, L.T.; Anderson, H.R.; Bhutta, Z.A.; Zodpey, S.; Zuhlke, L.J.; Murray, C.J.L.; Factors, G.B.D.R. Global, regional, and national comparative risk assessment of 79 behavioural, environmental and occupational, and metabolic risks or clusters of risks, 1990–2015: A systematic analysis for the global burden of disease study 2015. Lancet 2016, 388, 1659–1724. [Google Scholar] [CrossRef]
- Lelieveld, J.; Evans, J.S.; Fnais, M.; Giannadaki, D.; Pozzer, A. The contribution of outdoor air pollution sources to premature mortality on a global scale. Nature 2015, 525, 367–371. [Google Scholar] [CrossRef] [PubMed]
- Van Donkelaar, A.; Martin, R.V.; Brauer, M.; Boys, B.L. Use of satellite observations for long-term exposure assessment of global concentrations of fine particulate matter. Environ. Health Perspect. 2015, 123, 135–143. [Google Scholar] [CrossRef] [PubMed]
- Brauer, M.; Freedman, G.; Frostad, J.; van Donkelaar, A.; Martin, R.V.; Forouzanfar, M.H. Ambient air pollution exposure estimation for the global burden of disease 2013. Environ. Sci. Technol. 2016, 50, 79–88. [Google Scholar] [CrossRef] [PubMed]
- World Health Organization (WHO). Ambient (Outdoor) Air Quality and Health. World Health Organization (WHO). Available online: http://www.who.int/mediacentre/factsheets/fs313/en/.2018 (accessed on 18 April 2020).
- Snyder, E.G.; Watkins, T.H.; Solomon, P.A.; Thoma, E.D.; Williams, R.W.; Hagler, G.S.W.; Shelow, D.; Hindin, D.A.; Kilaru, V.J.; Preuss, P.W. The changing paradigm of air pollution monitoring. Environ. Sci. Technol. 2013, 47, 11369–11377. [Google Scholar] [CrossRef] [PubMed]
- Rai, A.C.; Kumar, P.; Pilla, F.; Skouloudis, A.N.; Di Sabatino, S.; Ratti, C.; Yasar, A.; Rickerby, D. End-user perspective of low-cost sensors for outdoor air pollution monitoring. Sci. Total Environ. 2017, 607, 691–705. [Google Scholar] [CrossRef] [PubMed]
- Clements, A.L.; Griswold, W.G.; Abhijit, R.S.; Johnston, J.E.; Herting, M.M.; Thorson, J.; Collier-Oxandale, A.; Hannigan, M. Low-cost air quality monitoring tools: From research to practice (A Workshop Summary). Sensors 2017, 17, 20. [Google Scholar] [CrossRef]
- Lung, S.C.C.; Wang, W.C.; Wen, T.Y.; Liu, C.H.; Hu, S.C. A versatile low-cost sensing device for assessing PM2.5 spatiotemporal variation and qualifying source contribution. Sci. Total Environ. 2020, 716. [Google Scholar] [CrossRef]
- Badura, M.; Batog, P.; Drzeniecka-Osiadacz, A.; Modzel, P. Evaluation of low-cost sensors for ambient PM2.5 monitoring. J. Sens. 2018, 16. [Google Scholar] [CrossRef]
- Wang, Y.; Li, J.Y.; Jing, H.; Zhang, Q.; Jiang, J.K.; Biswas, P. Laboratory evaluation and calibration of three low-cost particle sensors for particulate matter measurement. Aerosol Sci. Technol. 2015, 49, 1063–1077. [Google Scholar] [CrossRef]
- Morawska, L.; Afshari, A.; Bae, G.N.; Buonanno, G.; Chao, C.Y.H.; Hanninen, O.; Hofmann, W.; Isaxon, C.; Jayaratne, E.R.; Pasanen, P.; et al. Indoor aerosols: From personal exposure to risk assessment. Indoor Air 2013, 23, 462–487. [Google Scholar] [CrossRef] [PubMed]
- Zimmerman, N.; Presto, A.A.; Kumar, S.P.N.; Gu, J.; Hauryliuk, A.; Robinson, E.S.; Robinson, A.L.; Subramanian, R. A machine learning calibration model using random forests to improve sensor performance for lower-cost air quality monitoring. Atmos. Meas. Technol. 2018, 11, 291–313. [Google Scholar] [CrossRef]
- Wang, W.C.V.; Lung, S.C.C. Application of Machine Learning for In-Situ Correction of Low-Cost Particle Sensing Devices in Sensor Networks. 2020; under preparation. [Google Scholar]
- Chen, L.J.; Ho, Y.H.; Lee, H.C.; Wu, H.C.; Liu, H.M.; Hsieh, H.H.; Huang, Y.T.; Lung, S.C.C. An open framework for participatory PM2.5 monitoring in smart cities. IEEE Access 2017, 5, 14441–14454. [Google Scholar] [CrossRef]
- Cho, E.M.; Jeon, H.J.; Yoon, D.K.; Park, S.H.; Hong, H.J.; Choi, K.Y.; Cho, H.W.; Cheon, H.C.; Lee, C.M. Reliability of low-cost, sensor-based fine dust measurement devices for monitoring atmospheric particulate matter concentrations. Int. J. Environ. Res. Pub. Health 2019, 16, 10. [Google Scholar] [CrossRef] [PubMed]
- Jayaratne, R.; Liu, X.T.; Ahn, K.H.; Asumadu-Sakyi, A.; Fisher, G.; Gao, J.; Mabon, A.; Mazaheri, M.; Mullins, B.; Nyaku, M.; et al. Low-cost PM2.5 sensors: An assessment of their suitability for various applications. Aerosol Air Qual. Res. 2020, 20, 520–532. [Google Scholar] [CrossRef]
- Jayaratne, R.; Liu, X.T.; Thai, P.; Dunbabin, M.; Morawska, L. The influence of humidity on the performance of a low-cost air particle mass sensor and the effect of atmospheric fog. Atmos. Meas. Tech. 2018, 11, 4883–4890. [Google Scholar] [CrossRef]
- Sayahi, T.; Kaufman, D.; Becnel, T.; Kaur, K.; Butterfield, A.E.; Collingwood, S.; Zhang, Y.; Gaillardon, P.E.; Kelly, K.E. Development of a calibration chamber to evaluate the performance of low-cost particulate matter sensors. Environ. Pollut. 2019, 255, 9. [Google Scholar] [CrossRef]
- Tryner, J.; L’Orange, C.; Mehaffy, J.; Miller-Lionberg, D.; Hofstetter, J.C.; Wilson, A.; Volckens, J. Laboratory evaluation of low-cost PurpleAir PM monitors and in-field correction using co-located portable filter samplers. Atmos. Environ. 2020, 220, 12. [Google Scholar] [CrossRef]
- Zamora, M.L.; Xiong, F.L.Z.; Gentner, D.; Kerkez, B.; Kohrman-Glaser, J.; Koehler, K. Field and laboratory evaluations of the low-cost plantower particulate matter sensor. Environ. Sci. Technol. 2019, 53, 838–849. [Google Scholar] [CrossRef]
- Kelly, K.E.; Whitaker, J.; Petty, A.; Widmer, C.; Dybwad, A.; Sleeth, D.; Martin, R.; Butterfield, A. Ambient and laboratory evaluation of a low-cost particulate matter sensor. Environ. Pollut. 2017, 221. [Google Scholar] [CrossRef] [PubMed]
- Zheng, T.S.; Bergin, M.H.; Johnson, K.K.; Tripathi, S.N.; Shirodkar, S.; Landis, M.S.; Sutaria, R.; Carlson, D.E. Field evaluation of low-cost particulate matter sensors in high-and low-concentration environments. Atmos. Meas. Tech. 2018, 11, 4823–4846. [Google Scholar] [CrossRef]
- Sayahi, T.; Butterfield, A.; Kelly, K.E. Long-term field evaluation of the plantower PMs low-cost particulate matter sensors. Environ. Pollut. 2019, 245, 932–940. [Google Scholar] [CrossRef] [PubMed]
- Lung, S.C.C.; Chen, N.; Hwang, J.S.; Hu, S.C.; Wang, W.C.V.; Wen, T.Y.J.; Liu, C.H. Panel study using novel sensing devices to assess associations of PM2.5 with heart rate variability and exposure sources. J. Exp. Sci. Environ. Epidemiol. 2020. under review. [Google Scholar]
- United States Environmental Protection Agency (USEPA). Quality Assurance Handbook for Air Pollution Measurement Systems: “Volume II: Ambient air Quality Monitoring Program”. 2017. Available online: https://www3.epa.gov/ttn/amtic/qalist.html (accessed on 9 September 2019).
- United States Environmental Protection Agency (USEPA). Air Sensor Guidebook. 2014. Available online: https://cfpub.epa.gov/si/si_public_record_report.cfm?Lab=NERL&dirEntryId=277996 (accessed on 9 September 2019).
- Lung, S.C.C.; Hu, S.C. Generation rates and emission factors of particulate matter and particle-bound polycyclic aromatic hydrocarbons of incense sticks. Chemosphere 2003, 50, 673–679. [Google Scholar] [CrossRef]
- United States Environmental Protection Agency (USEPA). Technical Note –PM2.5 Continuous Monitor Comparability Assessment. Office of Air Quality Planning and Standards, USEPA, Research Triangle Park, NC 27711. 2018. Available online: https://www.epa.gov/outdoor-air-quality-data/pm25-continuous-monitor-comparability-assessments (accessed on 18 April 2020).
- United States Environmental Protection Agency (USEPA). 40 CFR Appendix Table C-4 to Subpart C of Part 53-Test Specifications for PM10, PM2.5 and PM10-2.5 Candidate Equivalent Methods. CFR, US Law, LII, Legal Information Institute. 2006. Available online: https://www.law.cornell.edu/cfr/text/40/appendix-Table_C-4_to_subpart_C_of_part_53 (accessed on 18 April 2020).
- Cicchetti, D.V. Guidelines, criteria, and rules of thumb for evaluating normed and standardized assessment instruments in psychology. Psychol. Assess. 1994, 6, 284–290. [Google Scholar] [CrossRef]
- Nascimento, S.M.; De Macedo, J.A.F.; Lopes, H.C.V.; Da Silva, T.L.C.; Casanova, M.A.; De Castro Machado, J. On computing travel time functions from Trajectory Data Streams. ACM Press. 2017. [Google Scholar] [CrossRef]
- Chołoniewski, J.; Sienkiewicz, J.; Leban, G.; Hołyst, J.A. Modeling of temporal fluctuation scaling in online news network with independent cascade model. Phys. A Stat. Mech. Appl. 2019, 523, 129–144. [Google Scholar] [CrossRef]
- Goel, A.; Wathore, R.; Chakraborty, T.; Agrawal, M. Characteristics of exposure to particles due to incense burning inside temples in Kanpur, India. Aerosol Air Qual. Res. 2017, 17, 608–615. [Google Scholar] [CrossRef]
- Singh, G.K.; Choudhary, V.; Gupta, T.; Paul, D. Investigation of size distribution and mass characteristics of ambient aerosols and their combustion sources during post-monsoon in northern India. Atmos. Pollut. Res. 2020, 11, 170–178. [Google Scholar] [CrossRef]
- Jiao, W.; Hagler, G.; Williams, R.; Sharpe, R.; Brown, R.; Garver, D.; Judge, R.; Caudill, M.; Rickard, J.; Davis, M.; et al. Community Air Sensor Network (CAIRSENSE) project: Evaluation of low-cost sensor performance in a suburban environment in the southeastern United States. Atmos. Meas. Tech. 2016, 9, 5281–5292. [Google Scholar] [CrossRef]
- Mukherjee, A.; Brown, S.G.; McCarthy, M.C.; Pavlovic, N.R.; Stanton, L.G.; Snyder, J.L.; D’Andrea, S.; Hafner, H.R. Measuring spatial and temporal PM2.5 variations in Sacramento, California, communities using a network of low-cost sensors. Sensors 2019, 19, 22. [Google Scholar] [CrossRef] [PubMed]
- Central Weather Bureau (CWB). 1981–2010 Monthly Means. Available online: https://www.cwb.gov.tw/V8/E/C/Statistics/monthlymean.html (accessed on 18 April 2020).
- Liu, H.Y.; Schneider, P.; Haugen, R.; Vogt, M. Performance assessment of a low-cost PM2.5 sensor for a near four-month period in Oslo, Norway. Atmosphere 2019, 10, 18. [Google Scholar] [CrossRef]


| (a) PM2.5 | Hood with Incense | Chamber with Incense | ||||||||
| T1: 24.7–28.6 °C, RH: 57.3–76.0% | T: 28.0–29.9 °C, RH: 36.7–40.2% | |||||||||
| Slope | Intercept | R2 | RMSE2 | n | Slope | Intercept | R2 | RMSE | n | |
| A1 | 3.11 | −9.02 | 0.981 | 1.40 | 840 | 3.10 | −15.4 | 0.993 | 4.76 | 1733 |
| A2 | 3.19 | −6.96 | 0.991 | 0.95 | 840 | 2.92 | −10.8 | 0.996 | 3.56 | 1733 |
| A3 | 3.39 | −10.1 | 0.994 | 0.78 | 840 | 2.92 | −12.5 | 0.995 | 4.08 | 1733 |
| A4 | 3.59 | −7.26 | 0.991 | 1.26 | 827 | 2.96 | −13.1 | 0.994 | 4.27 | 1733 |
| A5 | 2.44 | −6.20 | 0.930 | 3.89 | 665 | 2.93 | −9.80 | 0.997 | 3.25 | 1733 |
| A6 | 3.52 | −6.82 | 0.989 | 1.42 | 827 | 2.94 | −12.7 | 0.994 | 4.11 | 1732 |
| A7 | 2.71 | −4.67 | 0.976 | 2.07 | 826 | 2.94 | −13.4 | 0.994 | 4.38 | 1732 |
| A8 | 2.51 | −3.24 | 0.985 | 1.63 | 829 | 2.85 | −10.6 | 0.996 | 3.54 | 1733 |
| A9 | 2.49 | −2.49 | 0.985 | 1.61 | 829 | 2.80 | −9.11 | 0.996 | 3.30 | 1732 |
| Average | 2.99 | −6.30 | 0.980 | 1.67 | 2.927 | −11.9 | 0.995 | 3.92 | ||
| SD | 0.47 | 2.49 | 0.020 | 0.92 | 0.083 | 1.98 | 0.001 | 0.53 | ||
| %CV3 | 15.5% | −39.6% | 54.9% | 2.8% | −16.6% | 13.4% | ||||
| (b) PM1 | Hood with Incense | Chamber with Incense | ||||||||
| T: 24.7–28.6 °C, RH: 57.3–76.0% | T: 28.0–29.9 °C, RH: 36.7–40.2% | |||||||||
| Slope | Intercept | R2 | RMSE | n | Slope | Intercept | R2 | RMSE | n | |
| A1 | 1.88 | −3.23 | 0.991 | 0.95 | 840 | 1.69 | −1.4 | 0.997 | 2.92 | 1733 |
| A2 | 1.90 | −0.96 | 0.990 | 1.03 | 840 | 1.60 | 1.2 | 0.995 | 3.93 | 1733 |
| A3 | 2.00 | −3.3 | 0.986 | 1.21 | 840 | 1.62 | −0.3 | 0.997 | 3.11 | 1733 |
| A4 | 2.24 | −3.72 | 0.988 | 1.47 | 827 | 1.68 | −1.4 | 0.998 | 2.66 | 1733 |
| A5 | 2.13 | −5.53 | 0.945 | 3.45 | 665 | 1.48 | 3.40 | 0.991 | 5.15 | 1733 |
| A6 | 2.15 | −3.09 | 0.988 | 1.45 | 827 | 1.59 | 0.1 | 0.997 | 3.24 | 1732 |
| A7 | 1.81 | −2.71 | 0.994 | 0.99 | 826 | 1.61 | −1.1 | 0.997 | 2.81 | 1732 |
| A8 | 1.79 | −2.02 | 0.994 | 1.04 | 829 | 1.59 | 0.7 | 0.996 | 3.50 | 1733 |
| A9 | 1.65 | −1.19 | 0.996 | 0.87 | 829 | 1.40 | 3.51 | 0.991 | 5.26 | 1732 |
| Average | 1.95 | −2.86 | 0.986 | 1.38 | 1.58 | 0.53 | 0.995 | 3.62 | ||
| SD | 0.20 | 1.39 | 0.016 | 0.80 | 0.091 | 1.87 | 0.003 | 0.98 | ||
| %CV | 10.1% | −48.5% | 58.0% | 5.7% | 356.4% | 26.9% | ||||
| (c) PM | Hood with Incense (PM2.5) | Hood with Incense (PM1) | ||||||||
| T: 20.8–34.1 °C, RH: 30.4–64.1% | T: 20.8–34.1 °C, RH: 30.4–64.1% | |||||||||
| Slope | Intercept | R2 | RMSE | n | Slope | Intercept | R2 | RMSE | n | |
| B1 | 2.27 | −4.32 | 0.986 | 1.66 | 768 | 1.71 | −4.41 | 0.993 | 1.19 | 768 |
| B2 | 2.28 | −3.17 | 0.986 | 1.58 | 819 | 1.69 | −3.14 | 0.994 | 1.02 | 819 |
| B3 | 2.15 | −2.14 | 0.968 | 2.44 | 785 | 1.73 | −4.31 | 0.979 | 2.01 | 785 |
| B4 | 2.04 | −3.73 | 0.982 | 1.85 | 785 | 1.51 | −3.30 | 0.992 | 1.25 | 785 |
| B5 | 2.55 | −6.72 | 0.979 | 2.82 | 417 | 1.77 | −3.59 | 0.987 | 2.21 | 417 |
| B6 | 2.43 | −7.97 | 0.982 | 2.59 | 419 | 1.69 | −4.39 | 0.987 | 2.17 | 419 |
| B7 | 2.43 | −6.46 | 0.975 | 2.94 | 407 | 1.73 | −5.66 | 0.984 | 2.33 | 407 |
| B8 | 2.36 | −4.68 | 0.985 | 2.33 | 772 | 1.67 | −2.65 | 0.984 | 2.35 | 772 |
| B9 | 2.08 | −6.57 | 0.969 | 2.47 | 638 | 1.69 | −4.86 | 0.983 | 1.85 | 638 |
| B10 | 2.37 | −6.93 | 0.984 | 2.34 | 620 | 1.81 | −4.30 | 0.992 | 1.59 | 620 |
| B11 | 2.90 | −10.39 | 0.979 | 2.31 | 829 | 1.95 | −4.87 | 0.992 | 1.38 | 829 |
| B12 | 2.64 | −9.22 | 0.985 | 1.93 | 821 | 1.91 | −4.85 | 0.994 | 1.26 | 821 |
| Average | 2.42 | −6.96 | 0.980 | 2.40 | 1.75 | −4.27 | 0.988 | 1.82 | ||
| SD | 0.26 | 2.06 | 0.005 | 0.36 | 0.13 | 0.94 | 0.004 | 0.46 | ||
| %CV | 10.9% | −29.6% | 15.1% | 7.6% | −21.9% | 25.3% | ||||
| (a) | Hood with Incense | Chamber with Incense | Chamber with Mosquito Coils | |||
| PM2.5 | PM1 | PM2.5 | PM1 | PM2.5 | PM1 | |
| A1 | 0.969 | 0.993 | 0.997 | 0.999 | 0.997 | 0.998 |
| A2 | 0.970 | 0.995 | 0.998 | 0.999 | 0.998 | 0.997 |
| A3 | 0.952 | 0.988 | 0.998 | 0.999 | 0.998 | 0.998 |
| A4 | 0.928 | 0.970 | 0.998 | 1.000 | 0.997 | 0.997 |
| A5 | 0.994 | 0.980 | 0.999 | 0.999 | 0.998 | 0.996 |
| A6 | 0.965 | 0.988 | 0.998 | 0.999 | 0.998 | 0.997 |
| A7 | 0.982 | 0.985 | 0.998 | 0.999 | 0.998 | 0.997 |
| A8 | 0.979 | 0.981 | 0.999 | 0.999 | 0.998 | 0.997 |
| A9 | 0.975 | 0.980 | 0.999 | 0.997 | 0.999 | 0.995 |
| Average | 0.968 | 0.984 | 0.998 | 0.999 | 0.998 | 0.997 |
| SD | 0.019 | 0.008 | 0.001 | 0.001 | 0.001 | 0.001 |
| (b) Hood with Incense | ||||||
| PM2.5 | PM1 | |||||
| B1 | 0.995 | 0.995 | ||||
| B2 | 0.997 | 0.998 | ||||
| B3 | 0.991 | 0.996 | ||||
| B4 | 0.993 | 0.991 | ||||
| B5 | 0.996 | 0.998 | ||||
| B6 | 0.988 | 0.981 | ||||
| B7 | 0.993 | 0.985 | ||||
| B8 | 0.997 | 0.997 | ||||
| B9 | 0.992 | 0.998 | ||||
| B10 | 0.998 | 0.992 | ||||
| B11 | 0.995 | 0.987 | ||||
| B12 | 0.988 | 0.972 | ||||
| Average | 0.993 | 0.989 | ||||
| SD | 0.004 | 0.009 | ||||
| (a) PM2.5 | Chamber with Incense (0.1–200 μg/m3) with Segmented Regressions | |||||||||
| T: 27.5–30.7 °C, RH: 47.7–54.1% | ||||||||||
| Region 1 | Region 2 | |||||||||
| Slope 1 | Intercept 1 | BP1 1 | Slope 2 | Intercept 2 | R2 | n | ||||
| A1 | 2.48 | 2.21 | 31.7 | 3.06 | −16.2 | 0.999 | 1909 | |||
| A2 | 2.44 | 2.18 | 31.8 | 2.79 | −9.1 | 0.999 | 1905 | |||
| A3 | 2.40 | 2.12 | 33.9 | 2.80 | −11.5 | 0.999 | 1887 | |||
| A4 | 2.28 | 2.06 | 36.0 | 2.72 | −13.7 | 0.999 | 1873 | |||
| A5 | 2.47 | 2.16 | 29.6 | 2.75 | −6.2 | 0.999 | 1913 | |||
| A6 | 2.39 | 2.24 | 31.9 | 2.84 | −12.0 | 0.999 | 1895 | |||
| A7 | 2.38 | 2.12 | 34.7 | 2.86 | −14.5 | 0.999 | 1873 | |||
| A8 | 2.35 | 2.20 | 31.7 | 2.70 | −8.9 | 0.999 | 1877 | |||
| A9 | 2.70 | 0.46 | 151.7 | 2.44 | 40.2 | 0.999 | 1915 | |||
| Average | 2.43 | 1.97 | 2.77 | 0.999 | ||||||
| SD | 0.12 | 0.57 | 0.16 | 0.000 | ||||||
| %CV | 4.8% | 28.9% | 5.9% | |||||||
| (b) PM1 | Chamber with Incense (0.1–200 μg/m3) with Segmented Regressions | |||||||||
| T: 27.5–30.7 °C, RH: 47.7–54.1% | ||||||||||
| Region 1 | Region 2 | |||||||||
| Slope 1 | Intercept 1 | BP 1 | Slope 2 | Intercept 2 | R2 | n | ||||
| A1 | 1.64 | 1.28 | 107.8 | 1.03 | 66.8 | 0.999 | 1909 | |||
| A2 | 1.51 | 1.70 | 103.1 | 0.89 | 65.3 | 0.999 | 1905 | |||
| A3 | 1.53 | 1.52 | 104.1 | 0.96 | 60.2 | 0.999 | 1887 | |||
| A4 | 1.47 | 1.21 | 110.3 | 0.97 | 56.3 | 0.999 | 1873 | |||
| A5 | 1.43 | 2.06 | 97.7 | 0.75 | 67.8 | 0.999 | 1913 | |||
| A6 | 1.52 | 1.64 | 103.1 | 0.93 | 63.0 | 0.999 | 1895 | |||
| A7 | 1.49 | 1.28 | 105.8 | 0.99 | 54.5 | 0.999 | 1873 | |||
| A8 | 1.45 | 1.71 | 101.7 | 0.84 | 63.5 | 0.999 | 1877 | |||
| A9 | 1.50 | 2.24 | 95.2 | 0.72 | 76.5 | 0.999 | 1915 | |||
| Average | 1.50 | 1.63 | 0.90 | 0.999 | ||||||
| SD | 0.061 | 0.35 | 0.11 | 0.000 | ||||||
| %CV | 4.0% | 21.8% | 11.8% | |||||||
| (c) PM2.5 | Chamber with Incense (0.1–300 μg/m3) with Segmented Regressions | |||||||||
| T: 27.5–30.7 °C, RH: 47.7–54.1% | ||||||||||
| Region 1 | Region 2 | |||||||||
| Slope 1 | Intercept 1 | BP 1 | Slope 2 | Intercept 2 | R2 | n | ||||
| A1 | 2.50 | 2.11 | 28.8 | 3.01 | −12.7 | 0.999 | 2113 | |||
| A2 | 2.72 | −1.18 | 184.7 | 2.60 | 22.0 | 0.999 | 2109 | |||
| A3 | 2.43 | 1.95 | 29.2 | 2.74 | −7.2 | 0.999 | 2091 | |||
| A4 | 2.30 | 1.94 | 31.6 | 2.67 | −9.7 | 0.999 | 2077 | |||
| A5 | 2.71 | −0.51 | 170.7 | 2.55 | 26.2 | 0.999 | 2117 | |||
| A6 | 2.43 | 2.04 | 28.2 | 2.78 | −8.0 | 0.999 | 2099 | |||
| A7 | 2.40 | 2.02 | 30.7 | 2.81 | −10.7 | 0.999 | 2077 | |||
| A8 | 2.63 | −1.20 | 182.8 | 2.50 | 23.3 | 0.999 | 2081 | |||
| A9 | 2.70 | 0.47 | 145.2 | 2.50 | 29.6 | 0.999 | 2119 | |||
| Average | 2.53 | 0.85 | 2.68 | 0.999 | ||||||
| SD | 0.16 | 1.46 | 0.17 | 0.000 | ||||||
| %CV | 6.2% | 172.1% | 6.3% | |||||||
| (d) PM2.5 | Chamber with Incense (0.1–400 μg/m3) with Segmented Regressions | |||||||||
| T: 27.1–30.7 °C, RH: 47.7–54.7% | ||||||||||
| Region 1 | Region 2 | Region 3 | ||||||||
| Slope 1 | Intercept 1 | BP 1 | Slope 2 | Intercept 2 | BP 2 | Slope 3 | Intercept 3 | R2 | n | |
| A1 | 2.48 | 2.17 | 30.1 | 3.03 | −14.2 | 342.6 | 5.08 | −716.6 | 0.999 | 2359 |
| A2 | 2.69 | −0.30 | 332.2 | 3.45 | −251.5 | 377.7 | 5.36 | −971.7 | 0.999 | 2355 |
| A3 | 2.41 | 2.02 | 30.3 | 2.75 | −8.19 | 349.9 | 4.78 | −717.7 | 0.999 | 2337 |
| A4 | 2.30 | 1.98 | 32.5 | 2.68 | −10.5 | 351.3 | 4.60 | −684.2 | 0.999 | 2323 |
| A5 | 2.71 | −0.49 | 150.8 | 2.60 | 14.8 | 348.6 | 4.11 | −508.8 | 0.999 | 2363 |
| A6 | 2.42 | 2.11 | 29.2 | 2.80 | −8.96 | 347.4 | 4.86 | −726.9 | 0.999 | 2345 |
| A7 | 2.40 | 2.05 | 31.6 | 2.82 | −11.4 | 348.1 | 4.59 | −627.7 | 0.999 | 2323 |
| A8 | 2.43 | 1.74 | 26.2 | 2.62 | −3.02 | 355.3 | 4.05 | −510.7 | 0.999 | 2327 |
| A9 | 2.70 | 0.51 | 131.1 | 2.55 | 19.7 | 336.4 | 4.18 | −528.3 | 0.999 | 2365 |
| Average | 2.50 | 1.31 | 2.81 | 4.62 | 0.999 | |||||
| SD | 0.15 | 1.09 | 0.28 | 0.45 | 0.000 | |||||
| %CV | 6.2% | 83.3% | 9.9% | 9.8% | ||||||
| (a) PM2.5 | Chamber with Incense (0.1–200 μg/m3) | Chamber with Mosquito Coils (0.1–200 μg/m3) | ||||||
| Region 1 | Region 2 | Overall | Region 1 | Region 2 | Overall | |||
| A1 | 1.08 | 1.21 | 1.13 | 1.11 | 1.00 | 1.07 | ||
| A2 | 1.11 | 1.25 | 1.16 | 1.09 | 1.03 | 1.07 | ||
| A3 | 1.11 | 1.19 | 1.14 | 1.08 | 1.00 | 1.05 | ||
| A4 | 1.15 | 1.18 | 1.16 | 1.13 | 0.98 | 1.08 | ||
| A5 | 1.09 | 1.42 | 1.22 | 1.06 | 1.18 | 1.10 | ||
| A6 | 1.13 | 1.20 | 1.15 | 1.13 | 0.97 | 1.07 | ||
| A7 | 1.12 | 1.06 | 1.09 | 1.13 | 1.01 | 1.09 | ||
| A8 | 1.15 | 1.29 | 1.20 | 1.14 | 0.98 | 1.08 | ||
| A9 | 1.31 | 1.64 | 1.33 | 1.11 | 1.14 | 1.12 | ||
| Average | 1.14 | 1.27 | 1.18 | 1.11 | 1.03 | 1.08 | ||
| SD | 0.07 | 0.17 | 0.07 | 0.03 | 0.08 | 0.02 | ||
| %CV | 6.0% | 1.9% | ||||||
| (b) PM1 | Chamber with Incense (0.1–200 μg/m3) | Chamber with Mosquito Coils (0.1–200 μg/m3) | ||||||
| Region 1 | Region 2 | Overall | Region 1 | Region 2 | Overall | |||
| A1 | 1.21 | 2.83 | 1.51 | 1.62 | 2.53 | 1.73 | ||
| A2 | 1.27 | 2.52 | 1.51 | 1.47 | 2.05 | 1.56 | ||
| A3 | 1.24 | 2.25 | 1.42 | 1.50 | 1.89 | 1.55 | ||
| A4 | 1.30 | 2.13 | 1.41 | 1.67 | 1.97 | 1.71 | ||
| A5 | 1.36 | 3.16 | 1.77 | 1.32 | 2.79 | 1.62 | ||
| A6 | 1.28 | 2.59 | 1.53 | 1.44 | 2.46 | 1.60 | ||
| A7 | 1.27 | 2.32 | 1.45 | 1.63 | 2.32 | 1.72 | ||
| A8 | 1.33 | 2.45 | 1.55 | 1.41 | 2.16 | 1.53 | ||
| A9 | 1.34 | 3.41 | 1.85 | 1.28 | 2.94 | 1.64 | ||
| Average | 1.29 | 2.63 | 1.56 | 1.48 | 2.35 | 1.63 | ||
| SD | 0.05 | 0.43 | 0.15 | 0.14 | 0.37 | 0.08 | ||
| %CV | 9.9% | 4.7% | ||||||
| (c) PM2.5 | Chamber with Incense (0.1–300 μg/m3) | Chamber with Mosquito Coils (0.1–300 μg/m3) | ||||||
| Region 1 | Region 2 | Overall | Region 1 | Region 2 | Overall | |||
| A1 | 1.08 | 1.68 | 1.38 | 1.11 | 1.31 | 1.19 | ||
| A2 | 1.56 | 2.17 | 1.64 | 1.11 | 1.77 | 1.45 | ||
| A3 | 1.11 | 1.83 | 1.48 | 1.09 | 1.36 | 1.22 | ||
| A4 | 1.15 | 1.69 | 1.41 | 1.13 | 1.41 | 1.26 | ||
| A5 | 1.44 | 2.26 | 1.57 | 1.06 | 2.09 | 1.64 | ||
| A6 | 1.11 | 1.80 | 1.46 | 1.13 | 1.37 | 1.24 | ||
| A7 | 1.12 | 1.61 | 1.36 | 1.13 | 1.44 | 1.28 | ||
| A8 | 1.61 | 2.13 | 1.68 | 1.15 | 1.87 | 1.53 | ||
| A9 | 1.31 | 2.04 | 1.45 | 1.12 | 1.63 | 1.39 | ||
| Average | 1.28 | 1.91 | 1.49 | 1.12 | 1.58 | 1.36 | ||
| SD | 0.21 | 0.24 | 0.11 | 0.03 | 0.27 | 0.16 | ||
| %CV | 7.6% | 11.6% | ||||||
| (d) PM2.5 | Chamber with Incense (0.1–400 μg/m3) | Chamber with Mosquito Coils (0.1–400 μg/m3) | ||||||
| Region 1 | Region 2 | Region 3 | Overall | Region 1 | Region 2 | Region 3 | Overall | |
| A1 | 1.08 | 1.93 | 3.31 | 1.71 | 1.11 | 1.34 | 4.31 | 1.44 |
| A2 | 1.83 | 2.46 | 2.45 | 1.88 | 1.11 | 1.63 | 4.17 | 1.63 |
| A3 | 1.11 | 2.04 | 2.96 | 1.73 | 1.09 | 1.37 | 4.73 | 1.52 |
| A4 | 1.15 | 1.94 | 3.15 | 1.70 | 1.13 | 1.34 | 4.01 | 1.49 |
| A5 | 1.44 | 2.57 | 3.55 | 1.88 | 1.06 | 1.98 | 5.18 | 1.92 |
| A6 | 1.12 | 2.00 | 3.10 | 1.73 | 1.13 | 1.37 | 4.24 | 1.50 |
| A7 | 1.12 | 1.83 | 3.06 | 1.64 | 1.13 | 1.36 | 4.11 | 1.50 |
| A8 | 1.25 | 2.21 | 3.13 | 1.90 | 1.15 | 1.53 | 3.92 | 1.63 |
| A9 | 1.31 | 2.43 | 3.31 | 1.79 | 1.12 | 1.53 | 3.67 | 1.54 |
| Average | 1.27 | 2.16 | 3.11 | 1.77 | 1.11 | 1.50 | 4.26 | 1.57 |
| SD | 0.24 | 0.27 | 0.30 | 0.09 | 0.03 | 0.21 | 0.45 | 0.14 |
| %CV | 5.3% | 9.0% | ||||||
| Chamber with Mosquito Coils (PM2.5) | Chamber with Mosquito Coils (PM1) | |||||||||
|---|---|---|---|---|---|---|---|---|---|---|
| T: 28.0–31.4 °C, RH: 60.9–66.0% | T: 28.0–31.4 °C, RH: 60.9–66.0% | |||||||||
| Slope | Intercept | R2 | RMSE | n | Slope | Intercept | R2 | RMSE | n | |
| A1 | 2.89 | −9.20 | 0.995 | 3.54 | 1831 | 1.56 | 0.87 | 0.997 | 3.10 | 1831 |
| A2 | 2.72 | −6.41 | 0.997 | 2.80 | 1826 | 1.45 | 2.44 | 0.994 | 3.97 | 1826 |
| A3 | 2.72 | −7.19 | 0.997 | 3.05 | 1819 | 1.47 | 1.68 | 0.996 | 3.30 | 1819 |
| A4 | 2.68 | −8.00 | 0.996 | 3.36 | 1805 | 1.46 | 0.63 | 0.997 | 2.81 | 1805 |
| A5 | 2.74 | −5.05 | 0.998 | 2.33 | 1842 | 1.35 | 4.31 | 0.990 | 5.32 | 1842 |
| A6 | 2.79 | −7.36 | 0.997 | 3.04 | 1824 | 1.48 | 2.27 | 0.995 | 3.71 | 1824 |
| A7 | 2.78 | −8.18 | 0.996 | 3.29 | 1800 | 1.47 | 1.06 | 0.997 | 3.04 | 1800 |
| A8 | 2.65 | −6.01 | 0.997 | 2.70 | 1821 | 1.40 | 2.70 | 0.994 | 4.08 | 1821 |
| A9 | 2.71 | −4.01 | 0.998 | 2.18 | 1846 | 1.34 | 5.22 | 0.987 | 5.96 | 1846 |
| Average | 2.74 | −6.82 | 0.997 | 2.92 | 1.44 | 2.35 | 0.994 | 3.92 | ||
| SD | 0.072 | 1.63 | 0.001 | 0.46 | 0.069 | 1.56 | 0.003 | 1.08 | ||
| %CV | 2.6% | −23.9% | 15.8% | 4.8% | 66.3% | 27.4% | ||||
| (a) PM2.5 | Chamber with Mosquito Coils (0.1–200 μg/m3) with Segmented Regressions | ||||||||||
| T: 27.5–30.7 °C, RH: 47.7–54.1% | |||||||||||
| Region 1 | Region 2 | ||||||||||
| Slope 1 | Intercept 1 | BP1 1 | Slope 2 | Intercept 2 | R2 | n | |||||
| A1 | 2.19 | 1.35 | 42.7 | 3.15 | −39.7 | 0.999 | 1831 | ||||
| A2 | 2.17 | 1.58 | 39.6 | 2.90 | −27.3 | 0.999 | 1826 | ||||
| A3 | 2.14 | 1.40 | 41.9 | 2.92 | −31.1 | 0.999 | 1819 | ||||
| A4 | 2.07 | 1.31 | 43.8 | 2.90 | −35.0 | 0.999 | 1805 | ||||
| A5 | 2.25 | 1.59 | 35.6 | 2.87 | −20.6 | 0.999 | 1842 | ||||
| A6 | 2.16 | 1.73 | 39.0 | 2.99 | −30.6 | 0.999 | 1824 | ||||
| A7 | 2.16 | 1.37 | 43.1 | 3.00 | −35.1 | 0.999 | 1800 | ||||
| A8 | 2.12 | 1.60 | 38.4 | 2.81 | −25.0 | 0.999 | 1821 | ||||
| A9 | 2.25 | 2.10 | 34.4 | 2.83 | −17.9 | 0.999 | 1846 | ||||
| Average | 2.17 | 1.56 | 2.93 | 0.999 | |||||||
| SD | 0.06 | 0.25 | 0.10 | 0.000 | |||||||
| %CV | 2.6% | 16.0% | 3.5% | ||||||||
| (b) PM1 | Chamber with Mosquito Coils (0.1–200 μg/m3) with Segmented Regressions | ||||||||||
| T: 28.0–31.4 °C, RH: 60.9–66.0% | |||||||||||
| Region 1 | Region 2 | ||||||||||
| Slope 1 | Intercept 1 | BP 1 | Slope 2 | Intercept 2 | R2 | n | |||||
| A1 | 1.64 | −0.95 | 133.9 | 1.13 | 67.6 | 0.999 | 1831 | ||||
| A2 | 1.57 | −0.30 | 120.2 | 1.01 | 66.4 | 0.999 | 1826 | ||||
| A3 | 1.56 | −0.48 | 123.2 | 1.10 | 56.7 | 0.999 | 1819 | ||||
| A4 | 1.53 | −0.92 | 130.2 | 1.14 | 49.5 | 0.999 | 1805 | ||||
| A5 | 1.52 | 0.48 | 110.7 | 0.86 | 73.1 | 0.999 | 1842 | ||||
| A6 | 1.59 | −0.28 | 121.0 | 1.06 | 63.2 | 0.999 | 1824 | ||||
| A7 | 1.54 | −0.69 | 131.1 | 1.10 | 57.6 | 0.999 | 1800 | ||||
| A8 | 1.53 | −0.13 | 118.0 | 0.98 | 64.0 | 0.999 | 1821 | ||||
| A9 | 1.55 | 0.77 | 107.4 | 0.82 | 78.3 | 0.999 | 1846 | ||||
| Average | 1.56 | −0.28 | 1.02 | 0.999 | |||||||
| SD | 0.037 | 0.59 | 0.11 | 0.000 | |||||||
| %CV | 2.4% | −214% | 11.1% | ||||||||
| (c) PM2.5 | Chamber with Mosquito Coils (0.1–300 μg/m3) with Segmented Regressions | ||||||||||
| T: 28.0–31.6 °C, RH: 60.9–68.9% | |||||||||||
| Region 1 | Region 2 | ||||||||||
| Slope 1 | Intercept 1 | BP 1 | Slope 2 | Intercept 2 | R2 | n | |||||
| A1 | 2.20 | 1.27 | 44.4 | 3.17 | −41.9 | 0.999 | 2074 | ||||
| A2 | 2.17 | 1.58 | 34.9 | 2.84 | −21.7 | 0.999 | 2069 | ||||
| A3 | 2.14 | 1.42 | 40.0 | 2.89 | −28.8 | 0.999 | 2062 | ||||
| A4 | 2.06 | 1.36 | 42.2 | 2.88 | −33.2 | 0.999 | 2048 | ||||
| A5 | 2.28 | 1.44 | 30.3 | 2.80 | −14.5 | 0.999 | 2085 | ||||
| A6 | 2.15 | 1.76 | 37.0 | 2.96 | −28.0 | 0.999 | 2067 | ||||
| A7 | 2.14 | 1.46 | 40.5 | 2.97 | −32.1 | 0.999 | 2043 | ||||
| A8 | 2.13 | 1.54 | 33.5 | 2.74 | −19.2 | 0.999 | 2064 | ||||
| A9 | 2.26 | 2.03 | 31.0 | 2.78 | −14.2 | 0.999 | 2089 | ||||
| Average | 2.17 | 1.54 | 2.89 | 0.999 | |||||||
| SD | 0.07 | 0.23 | 0.13 | 0.000 | |||||||
| %CV | 3.0% | 15.0% | 4.5% | ||||||||
| (d) PM2.5 | Chamber with Mosquito coils (0.1–400 μg/m3) with Segmented Regressions | ||||||||||
| T: 27.0–31.6 °C, RH: 60.9–74.4% | |||||||||||
| Region 1 | Region 2 | Region 3 | |||||||||
| Slope 1 | Intercept 1 | BP 1 | Slope 2 | Intercept 2 | BP 2 | Slope 3 | Intercept 3 | R2 | n | ||
| A1 | 2.20 | 1.27 | 44.2 | 3.17 | −41.6 | 305.4 | 1.55 | 452.0 | 0.999 | 2163 | |
| A2 | 2.17 | 1.59 | 35.6 | 2.84 | −22.4 | 289.1 | 1.50 | 365.2 | 0.999 | 2158 | |
| A3 | 2.14 | 1.42 | 40.0 | 2.89 | −28.76 | 301.0 | 1.37 | 429.0 | 0.999 | 2151 | |
| A4 | 2.07 | 1.33 | 42.8 | 2.89 | −33.8 | 290.3 | 1.68 | 316.6 | 0.999 | 2137 | |
| A5 | 2.27 | 1.48 | 30.8 | 2.81 | −15.1 | 289.9 | 1.23 | 441.8 | 0.999 | 2174 | |
| A6 | 2.15 | 1.76 | 37.0 | 2.96 | −28.06 | 299.0 | 1.40 | 437.8 | 0.999 | 2156 | |
| A7 | 2.15 | 1.44 | 41.0 | 2.98 | −32.6 | 294.5 | 1.47 | 412.2 | 0.999 | 2132 | |
| A8 | 2.12 | 1.57 | 34.9 | 2.76 | −20.80 | 277.5 | 1.72 | 267.1 | 0.999 | 2153 | |
| A9 | 2.26 | 2.04 | 31.5 | 2.79 | −14.7 | 288.8 | 1.57 | 335.8 | 0.999 | 2178 | |
| Average | 2.17 | 1.55 | 2.90 | 1.50 | 0.999 | ||||||
| SD | 0.06 | 0.24 | 0.12 | 0.15 | 0.000 | ||||||
| %CV | 2.9% | 15.3% | 4.3% | 10.3% | |||||||
© 2020 by the authors. Licensee MDPI, Basel, Switzerland. This article is an open access article distributed under the terms and conditions of the Creative Commons Attribution (CC BY) license (http://creativecommons.org/licenses/by/4.0/).
Share and Cite
Wang, W.-C.V.; Lung, S.-C.C.; Liu, C.H.; Shui, C.-K. Laboratory Evaluations of Correction Equations with Multiple Choices for Seed Low-Cost Particle Sensing Devices in Sensor Networks. Sensors 2020, 20, 3661. https://doi.org/10.3390/s20133661
Wang W-CV, Lung S-CC, Liu CH, Shui C-K. Laboratory Evaluations of Correction Equations with Multiple Choices for Seed Low-Cost Particle Sensing Devices in Sensor Networks. Sensors. 2020; 20(13):3661. https://doi.org/10.3390/s20133661
Chicago/Turabian StyleWang, Wen-Cheng Vincent, Shih-Chun Candice Lung, Chun Hu Liu, and Chen-Kai Shui. 2020. "Laboratory Evaluations of Correction Equations with Multiple Choices for Seed Low-Cost Particle Sensing Devices in Sensor Networks" Sensors 20, no. 13: 3661. https://doi.org/10.3390/s20133661
APA StyleWang, W.-C. V., Lung, S.-C. C., Liu, C. H., & Shui, C.-K. (2020). Laboratory Evaluations of Correction Equations with Multiple Choices for Seed Low-Cost Particle Sensing Devices in Sensor Networks. Sensors, 20(13), 3661. https://doi.org/10.3390/s20133661