Dibenzocyclamnickel(II) as Ionophore in PVC-Matrix for Ni2+-Selective Sensor

Abstract
:Introduction
Experimental
Reagents and Materials
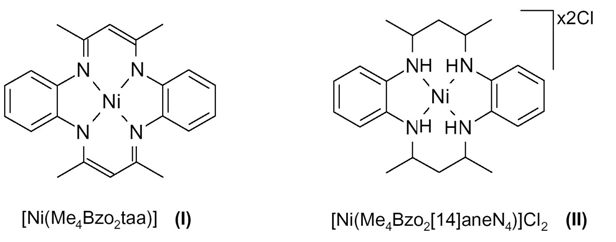
Synthesis of [Ni(Me4Bzo2taa)] Complex(I)
Synthesis of [Ni(Me4Bzo2[14]aneN4)]Cl2 Macrocycle (II)
Preparation of Membranes
Equilibration of Membranes and Potential Measurements
Dissolution of Waste Samples
Treatment of Electroplating Waste
Dissolution of Spent Fe-Cr catalyst
Dissolution of Chocolates Samples
Result and Discussion
Response and Life Time

Sensor. No. | Composition of the membranes (% w/w) | Working concentrationRange (M) | Slope with 90% confidence limit (mV/decade of activity) | Response time (±2s) | Standard deviation in potential (mV) | |||||||
|---|---|---|---|---|---|---|---|---|---|---|---|---|
(II) | NaTPB | DBBP | DBP | TBP | DOP | CN | PVC | |||||
1. | 5.0 | - | - | - | - | - | - | 200 | 1.1210-4-1.0×10⁻¹ | 34.9±0.5 | 40 | 2.78 |
2. | 5.0 | 2.5 | 200 | - | - | - | - | 200 | 7.08×10⁻⁶-1.0×10⁻¹ | 29.8±0.2 | 12 | 1.42 |
3. | 5.0 | 2.0 | - | 100 | - | - | - | 200 | 6.30×10⁻⁵-1.0×10⁻¹ | 36.9±0.5 | 18 | 3.89 |
4. | 5.0 | 2.5 | - | - | 90 | - | - | 200 | 3.98×10⁻⁴-1.0×10⁻¹ | 31.6±0.5 | 25 | 3.98 |
5. | 5.0 | 2.0 | - | - | - | 150 | - | 200 | 8.91×10⁻⁵-1.0×10⁻¹ | 37.0±0.7 | 20 | 3.75 |
6. | 5.0 | 2.5 | - | - | - | - | 150 | 200 | 1.58×10⁻⁵-1.0×10⁻¹ | 35.5±0.2 | 25 | 1.31 |
| Sensor No. | Working concentrationrange (M) | Slope (mV/decade ofactivity) | pH range | Response time(s) | Life time (months) | Selectivity | Reference no. |
|---|---|---|---|---|---|---|---|
1 | 1.0×10⁻³-1.0×10⁻¹ | Non Nernstian | NM | NM | NM | NM | 12 |
2 | 8.0×10⁻⁶-5.0×10⁻² | Near Nernstian | 1.7-5.4 | 10 | 6 | Highly selective | 11 |
| 3 | 5.0×10⁻⁵-1.0×10⁻¹ | Non Nernstian | 3.5-8.0 | 40 | NM | Interference due to Mn2+, CO2+, Cu2+ and Zn2+ | 10 |
4 | 5.0×10⁻⁵-1.0×10⁻¹ | Non Nernstian | 3.5-6.5 | NM | 5-6 | Poorly selective | 13 |
5 | 6.3×10⁻⁴-1.17×10⁻² | Near Nernstian | NM | NM | NM | Poorly selective | 17 |
6 | 4.0×10⁻⁵-1.0×10⁻¹ | Nernstian | 3.0-7.5 | 10 | 2 | Sufficiently selective | 14 |
7 | 1.0×10⁻⁵-1.0×10⁻² | NM | 4.0-8.0 | NM | NM | NM | 19 |
8 | 7.1×10⁻⁷-1.2×10⁻² | NM | 3.0-6.0 | NM | 2 | NM | 20 |
9 | 7.9x10⁻⁶-1.0x10⁻¹ | Nernstian | 2.7-7.6 | 15 | 6 | Highly selective | 9 |
| 10 | 7.08x10⁻⁶-1.0x10⁻¹ | Nernstian | 2.0-7.5 | 12 | 6 | Highly selective | Proposed sensor |
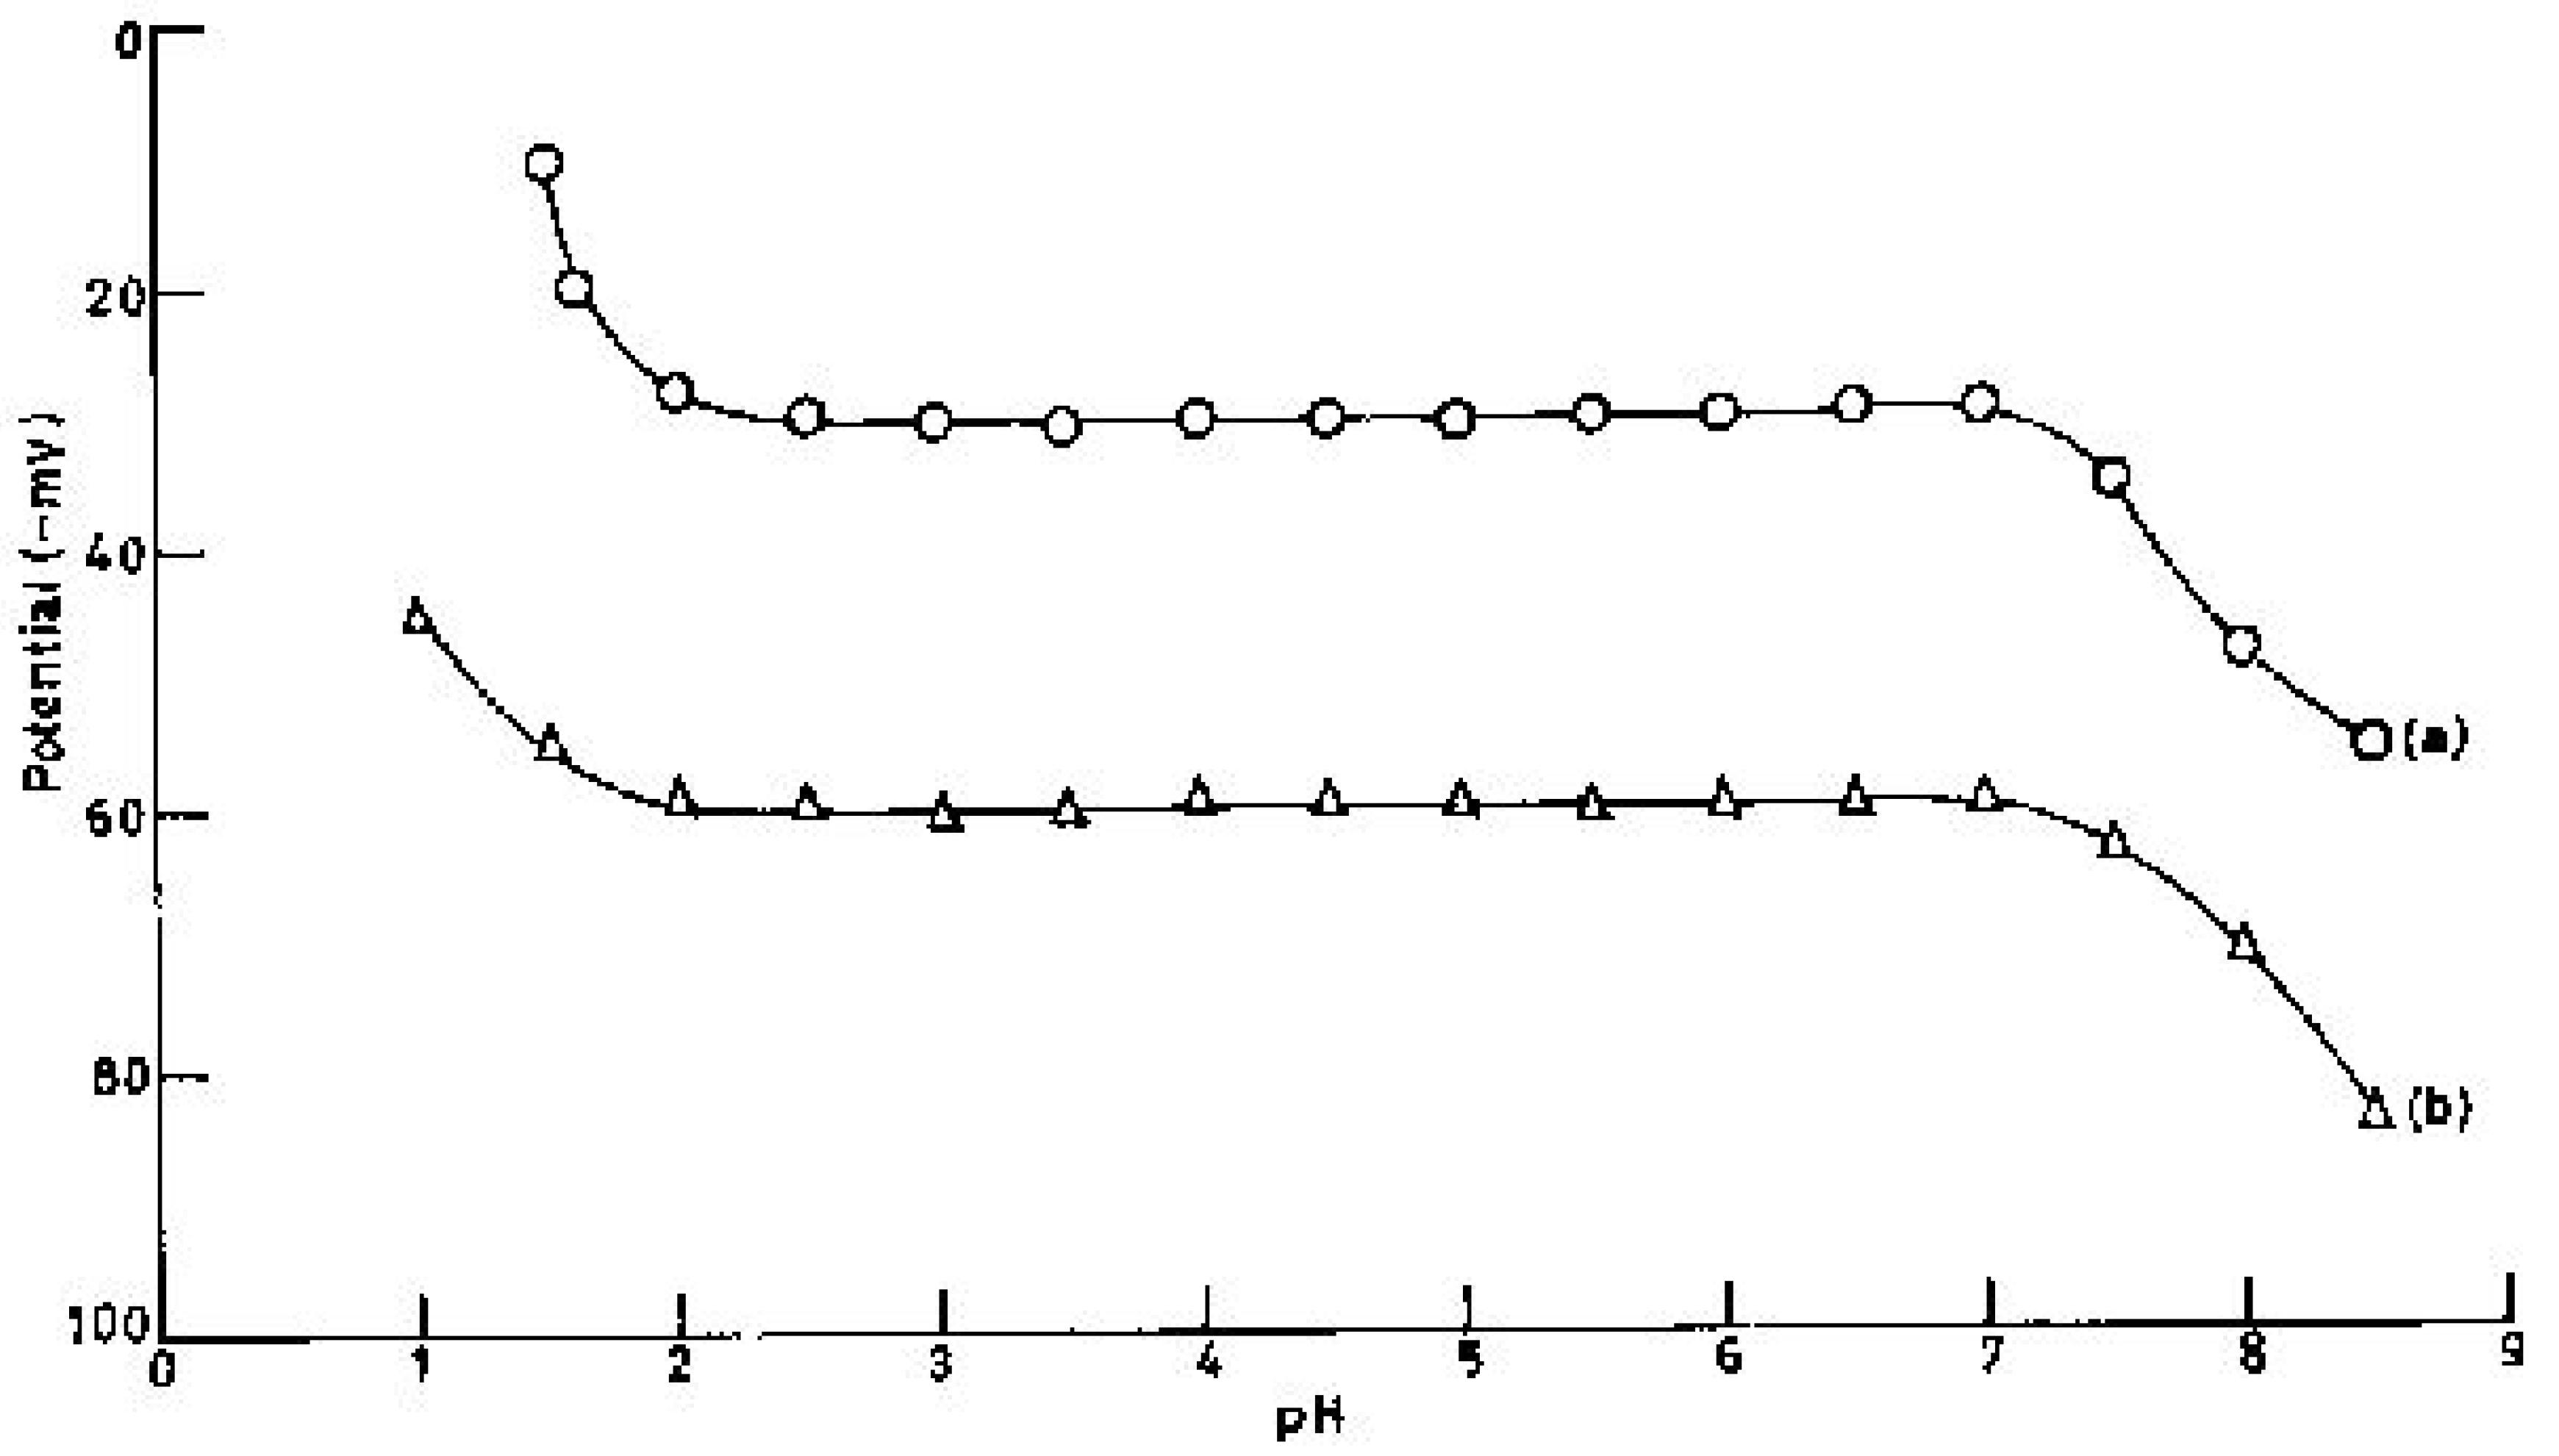
pH and Solvent Effect


| Non aqueous Content % (v/v) | Working concentration range (M) | Slope with 90% confidence limit (mV/decade of activity) | Standard deviation in potential (mV) |
|---|---|---|---|
| 0 | 7.08×10⁻⁶ - 1.0×10⁻¹ | 29.8±0.2 | 1.42 |
| Methanol | |||
| 10 | 7.08×10⁻⁶ - 1.0×10⁻¹ | 29.8±0.2 | 1.42 |
| 20 | 7.08×10⁻⁶ - 1.0×10⁻¹ | 29.8±0.2 | 1.52 |
| 30 | 7.08×10⁻⁶ - 1.0×10⁻¹ | 29.8±0.2 | 1.50 |
| 40 | 7.08×10⁻⁶ - 1.0×10⁻¹ | 29.5±0.2 | 1.76 |
| 45 | 1.99×10⁻⁵ - 1.0×10⁻¹ | 28.1±0.3 | 1.95 |
| Ethanol | |||
| 10 | 7.08×10⁻⁶ - 1.0×10⁻¹ | 29.8±0.2 | 1.42 |
| 20 | 7.08×10⁻⁶ - 1.0×10⁻¹ | 29.8±0.2 | 1.42 |
| 30 | 7.08×10⁻⁶ - 1.0×10⁻¹ | 29.8±0.2 | 1.50 |
| 40 | 8.91×10⁻⁶ - 1.0×10⁻¹ | 29.5±0.2 | 1.75 |
| 45 | 2.23×10⁻⁵ - 1.0×10⁻¹ | 26.5±0.3 | 2.08 |
| Acetone | |||
| 10 | 7.08×10⁻⁶ - 1.0×10⁻¹ | 29.8±0.2 | 1.42 |
| 20 | 7.08×10⁻⁶ - 1.0×10⁻¹ | 29.8±0.2 | 1.42 |
| 30 | 7.08×10⁻⁶ - 1.0×10⁻¹ | 29.8±0.2 | 1.42 |
| 40 | 7.94×10⁻⁶ - 1.0×10⁻¹ | 28.8±0.3 | 1.53 |
| 45 | 3.16×10⁻⁵ - 1.0×10⁻¹ | 26.0±0.5 | 1.98 |
Selectivity
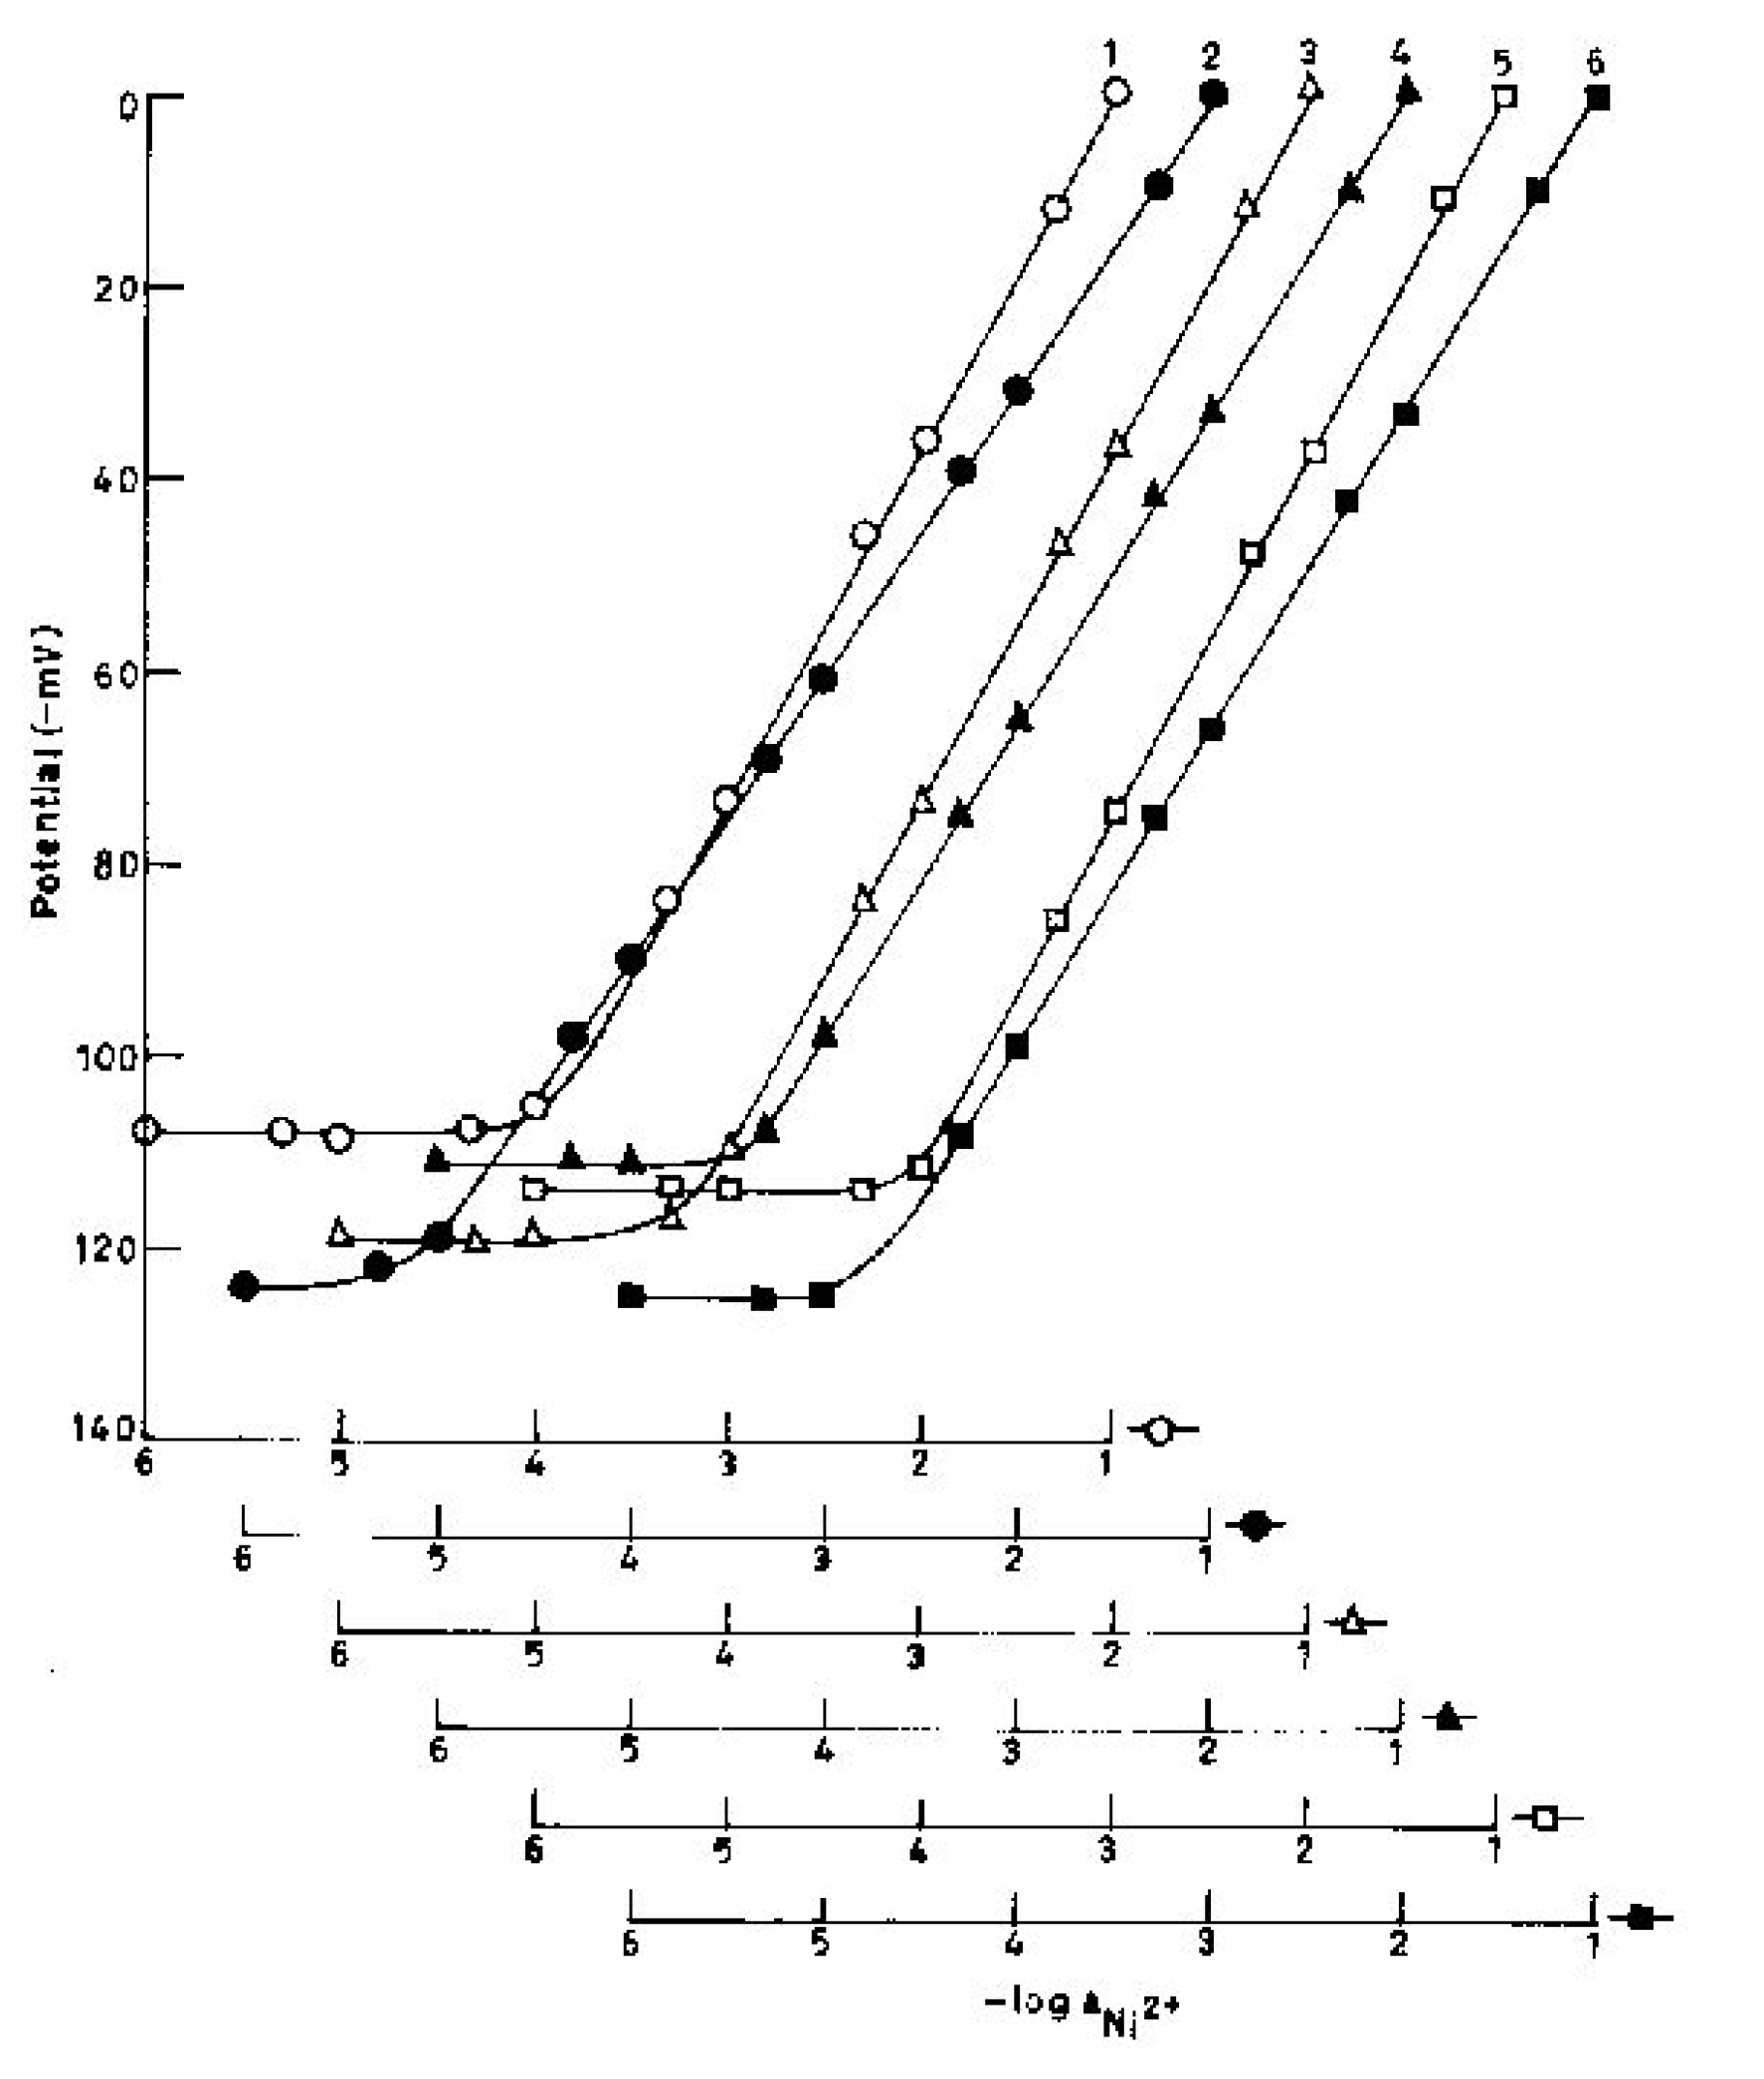
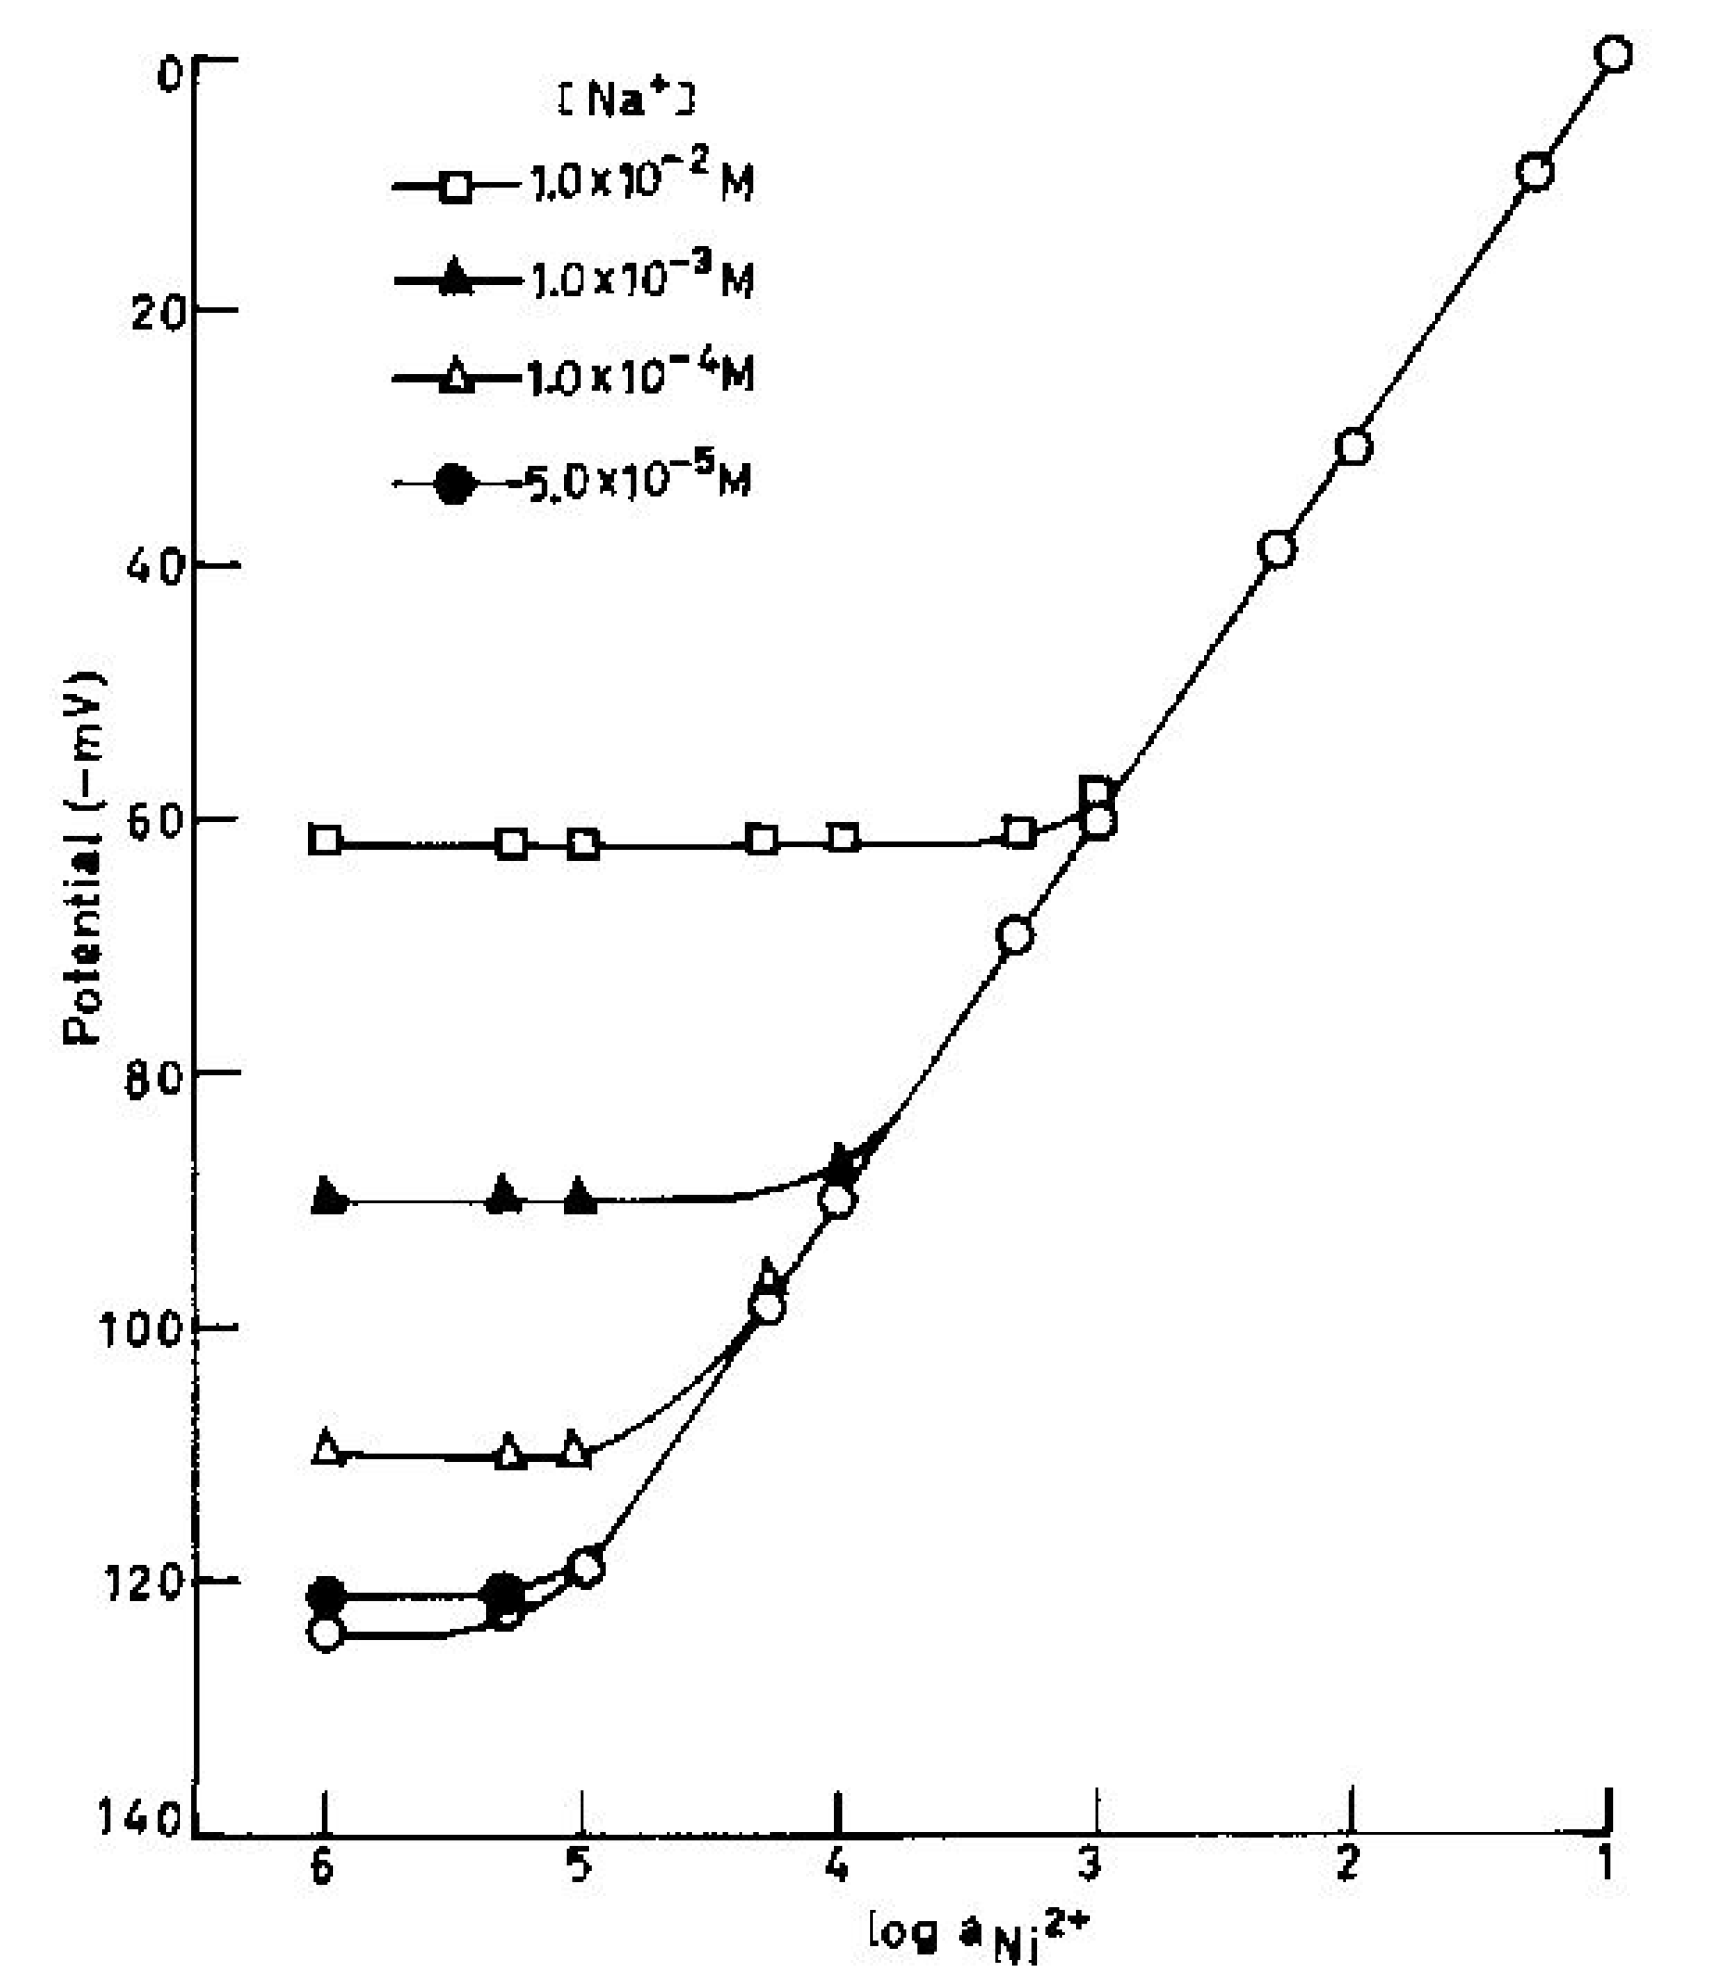
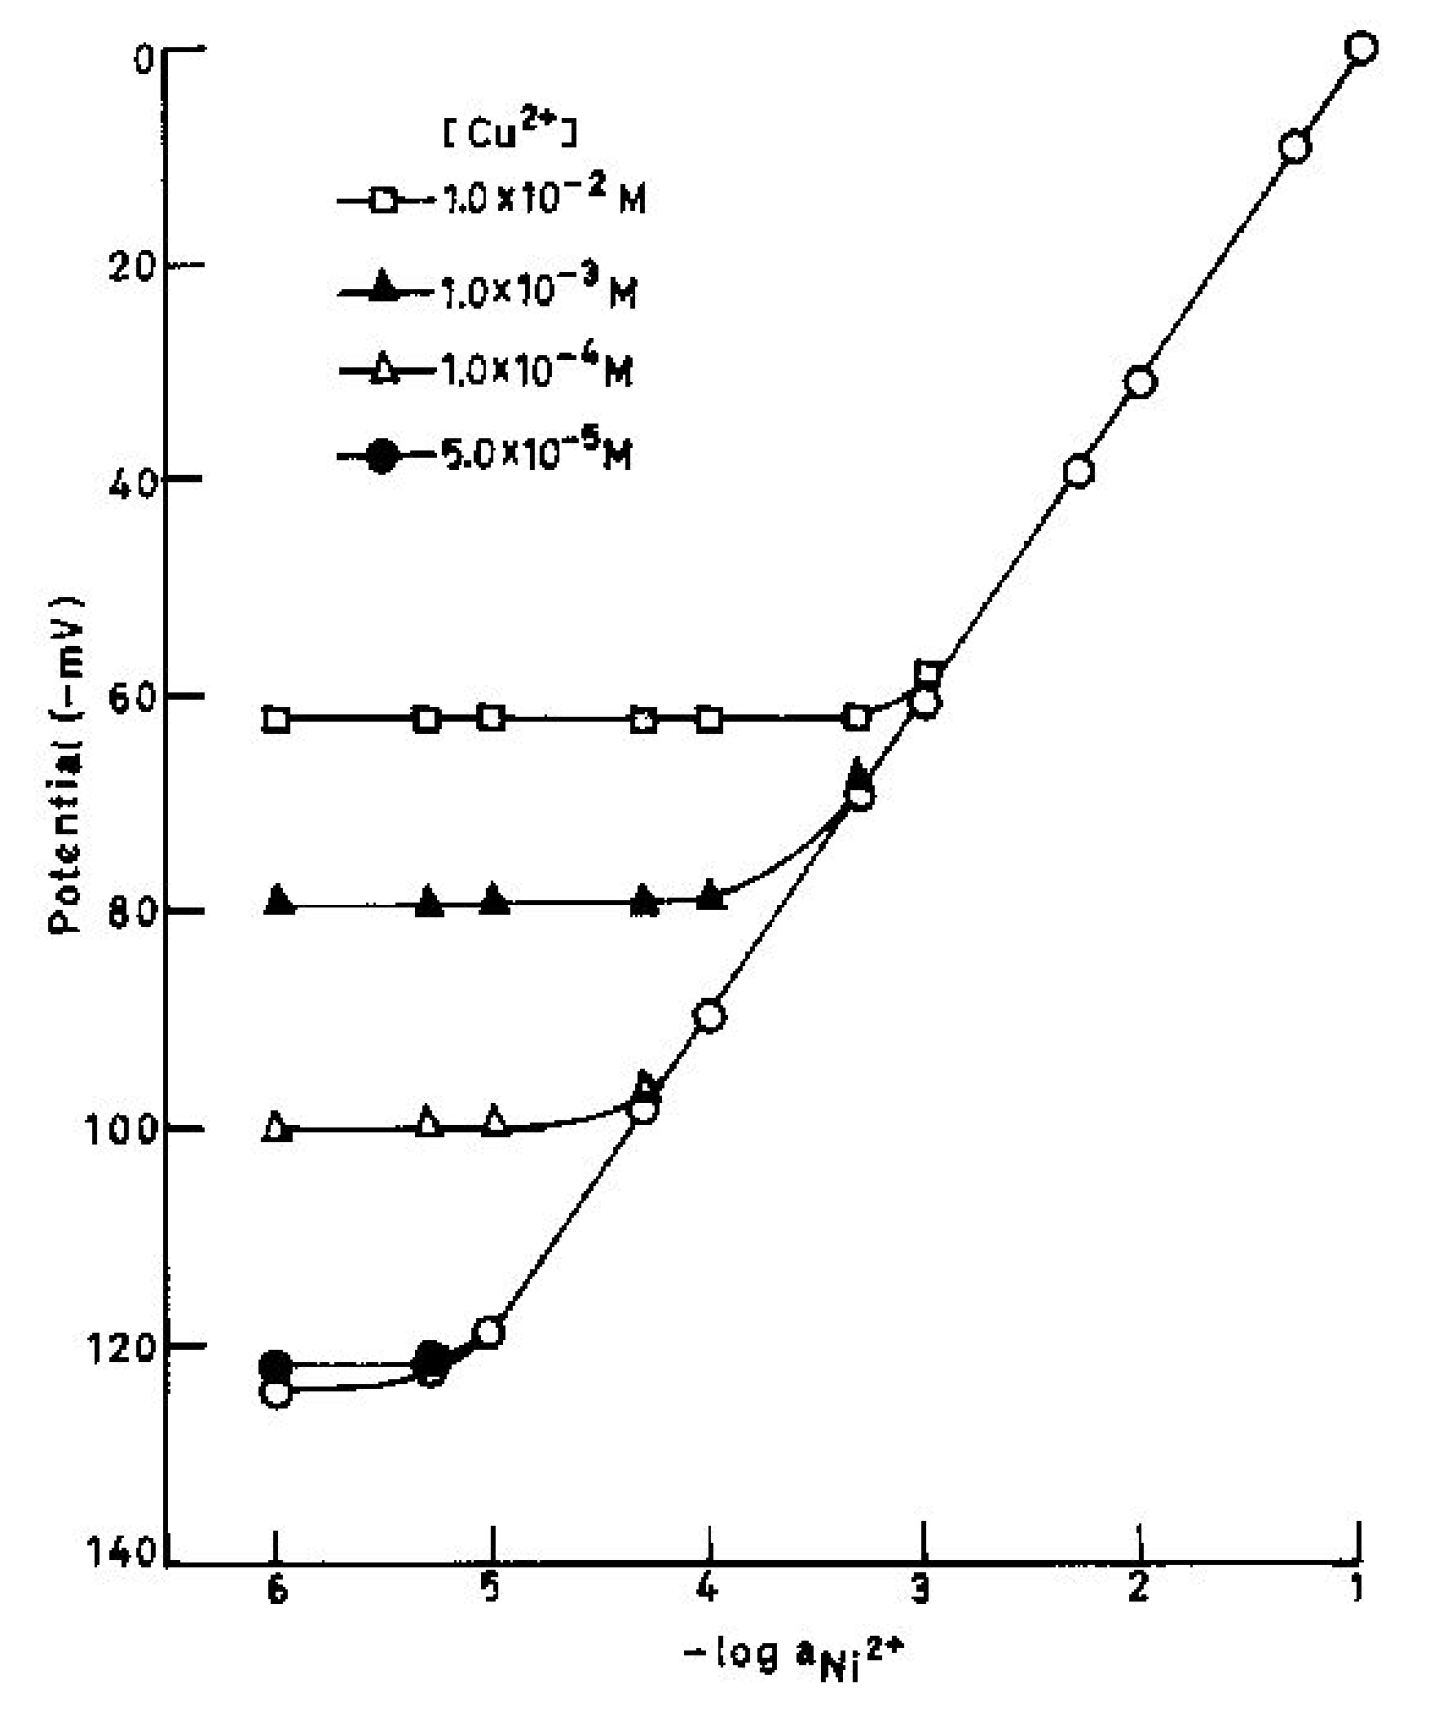
 (Table 4) clearly point out that the electrode is moderately selective to Ni2+ over a number of other cations except for Na+ and Cu2+. Even though Na+ and Cu2+ are likely to cause some interference as the selectivity coefficient values for these ions are higher than other cations, but at low concentrations still these would not cause much interference. To determine the maximum tolerance limit of these ions in the determination of Ni2+, some mixed run studies were performed [30,31,32,33,34]. It is clear from Fig.3 that Na+ at < 5.0×10⁻⁵ M do not cause any deviation in the original plot obtained in pure Ni2+. Thus the electrode can tolerate Na+ at < 5.0×10⁻⁵ M over the entire working concentration range. When Na+ is present at higher concentration, the electrode can be used over reduced concentration ranges. Fig.3 shows that in the presence of 1.0×10⁻⁴, 1.0×10⁻³ and 1.0×10⁻² M, Na+, the sensor assembly can be used to determine Ni2+ in the concentration ranges of 2.0×10⁻⁵–1.0×10⁻¹, 1.0×10⁻⁴–1.0×10⁻¹ and 7.1×10⁻⁴–1.0×10⁻¹ M, respectively. Similarly it can be seen from Fig.4 that Cu2+ can also be tolerated over the entire concentration range when present at concentrations < 5.0×10⁻⁵ M. The working concentration reduces to 4.4×10⁻⁵ – 1.0×10⁻¹, 2.0×10⁻⁴ – 1.0×10⁻¹ and 7.9×10⁻⁴–1.0×10⁻¹ M in the presence of 1.0×10⁻⁴, 1.0×10⁻³ and 1.0×10⁻² M Cu2+ respectively. It is significant to point out that the slope remains unaltered in both cases.

| Interfering ion (B) | Selectivity coefficient values  | |
|---|---|---|
| Fixed interference method (M) | Matched Potential method | |
| Li+ | 2.3×10⁻² | 0.11 |
| Na+ | 6.8×10⁻¹ | 0.67 |
| K+ | 5.4×10⁻² | 0.27 |
| Ag+ | 1.3×10⁻² | 0.14 |
| NH4+ | 1.5×10⁻² | 0.13 |
| Tl+ | 2.4×10⁻² | 0.21 |
| Ca2+ | 1.1×10⁻³ | 0.18 |
| Mg2+ | 2.4×10⁻³ | 0.17 |
| Sr2+ | 3.4×10⁻³ | 0.13 |
| Ba2+ | 5.6×10⁻³ | 0.19 |
| Cu2+ | 8.9×10⁻² | 0.59 |
| Cd2+ | 2.9×10⁻³ | 0.21 |
| CO2+ | 1.7×10⁻³ | 0.13 |
| Pb2+ | 3.9×10⁻³ | 0.14 |
| Zn2+ | 4.7×10⁻³ | 0.14 |
| Mn2+ | 2.3×10⁻³ | 0.17 |
| Pb2+ | 3.4×10⁻³ | 0.10 |
| Hg2+ | 2.3×10⁻³ | 0.11 |
| Cr2+ | 3.4×10⁻³ | 0.13 |
| Al3+ | 1.8×10⁻³ | 0.27 |
| Ce3+ | 1.0×10⁻³ | 0.19 |
| Fe3+ | 3.9×10⁻³ | 0.32 |
| Bi3+ | 1.5×10⁻³ | 0.18 |
Analytical applications
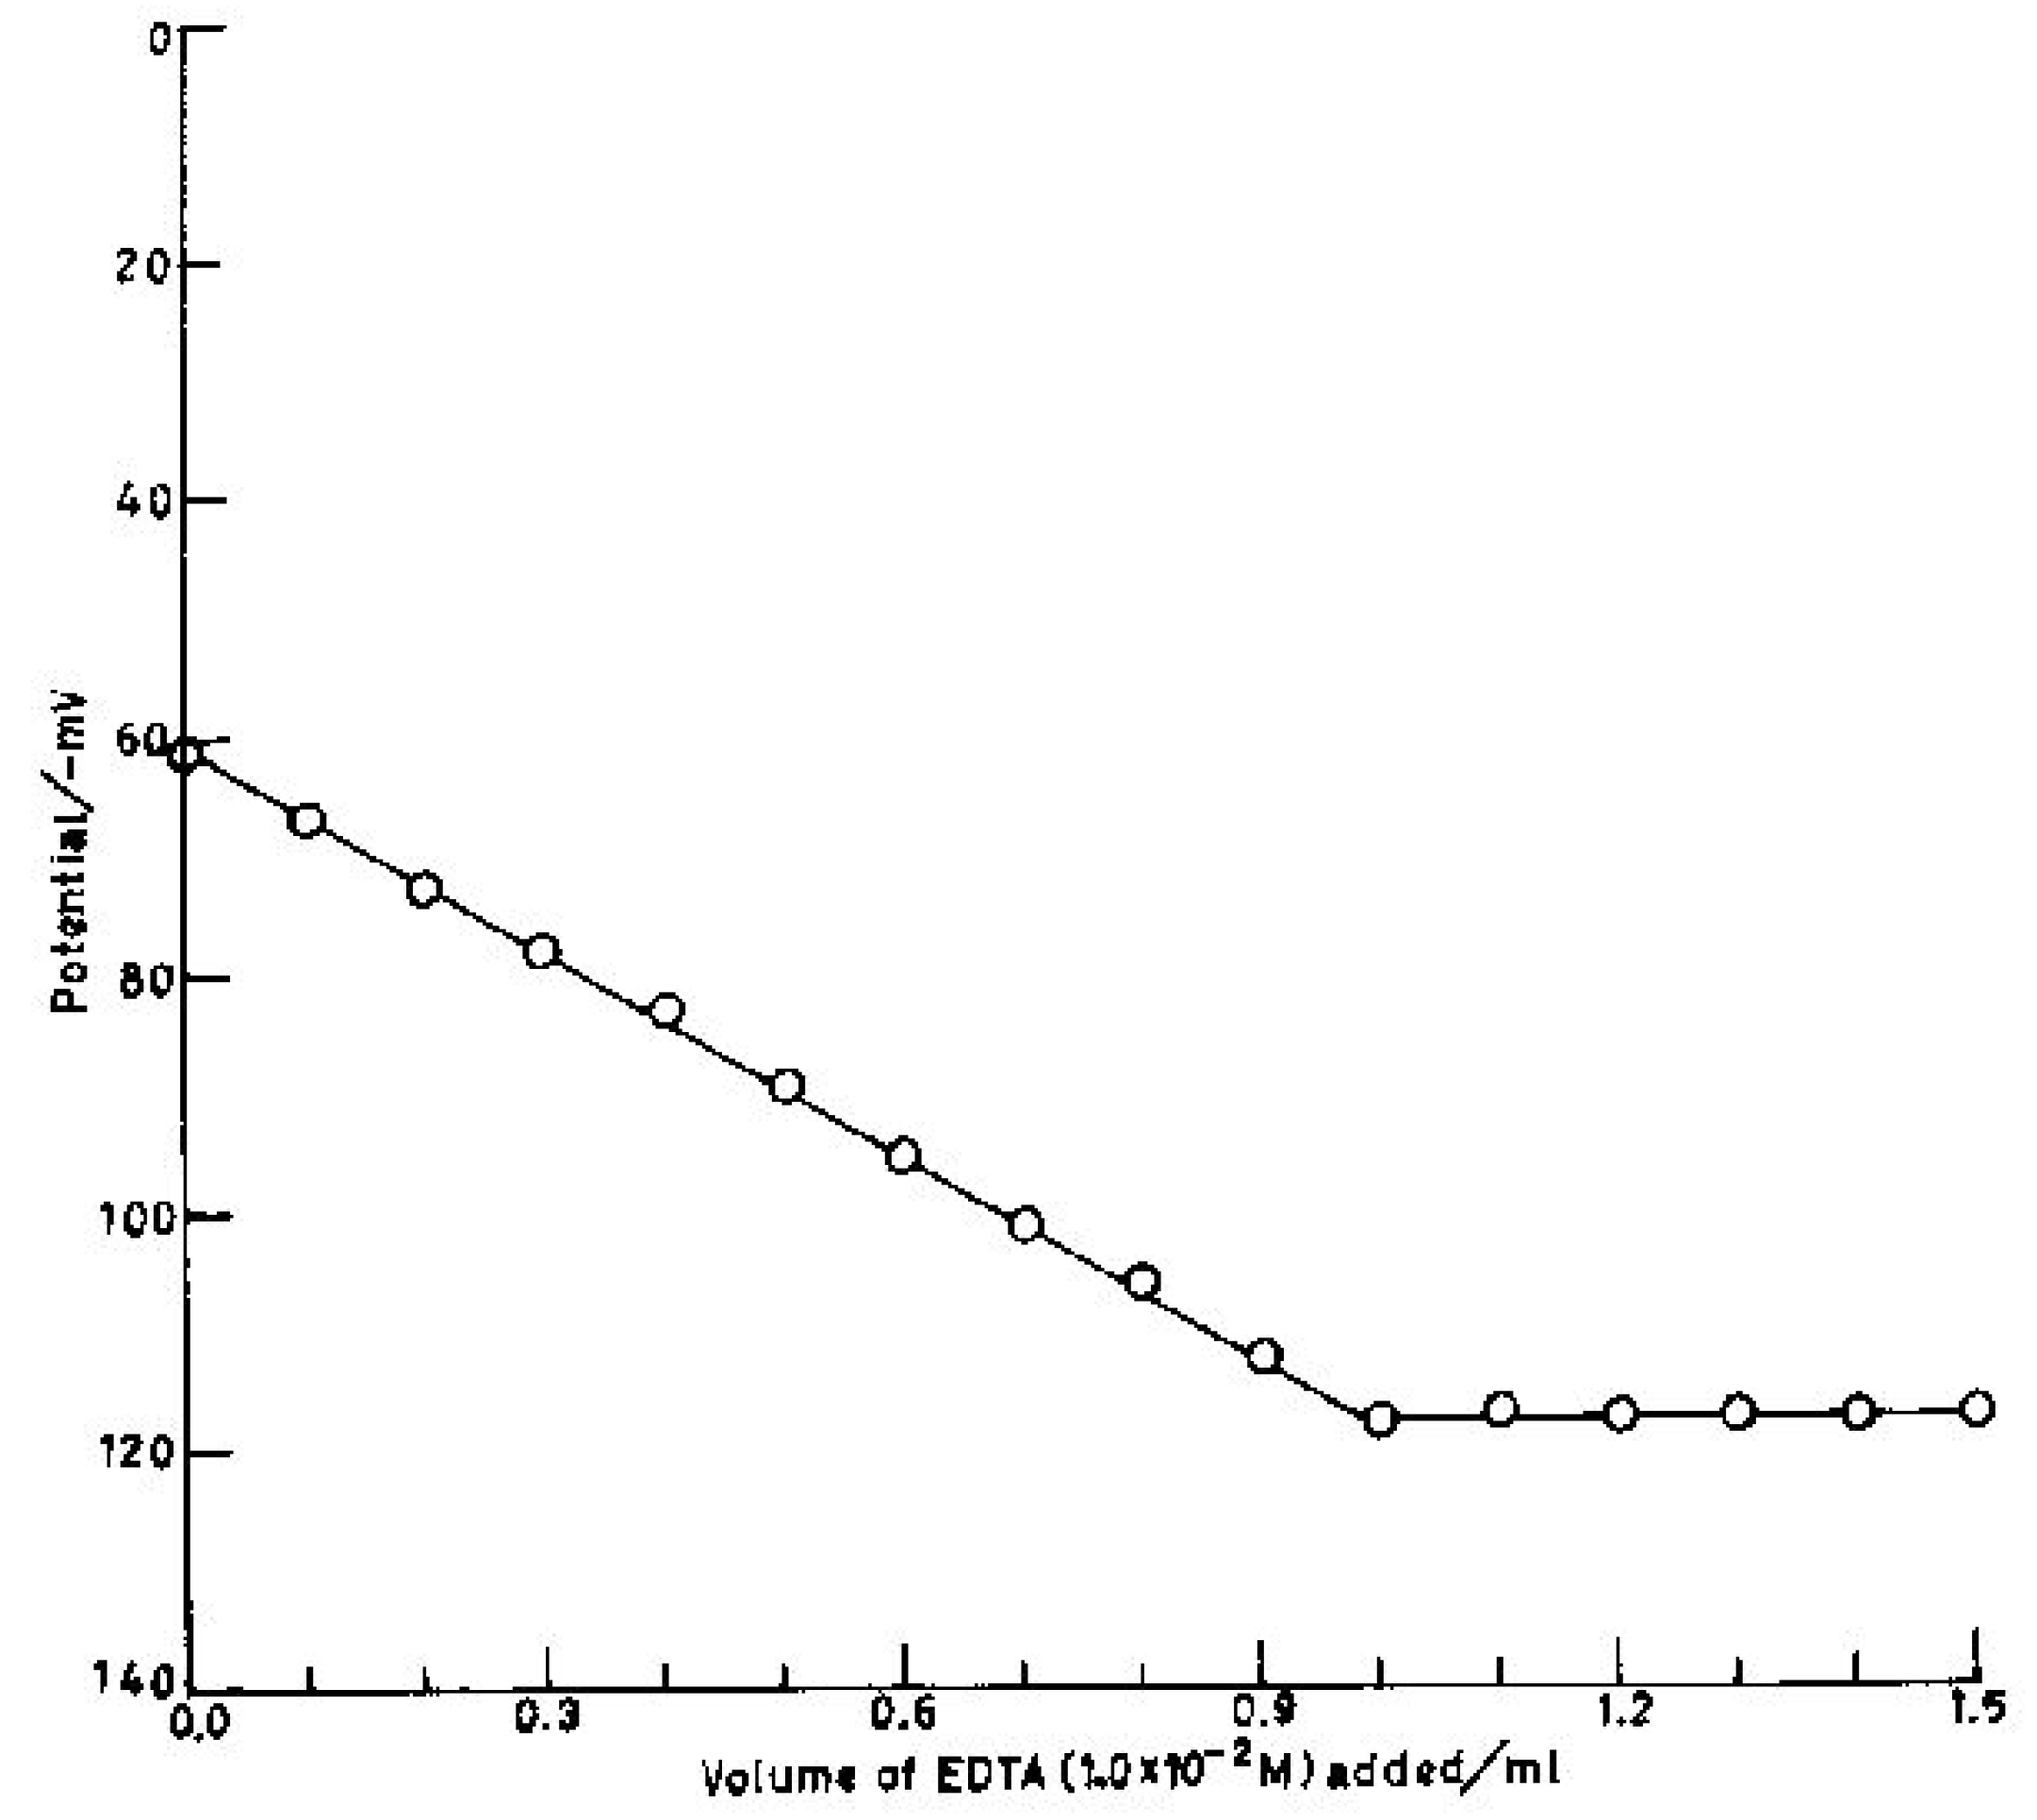
Potentiometric titration
Waste analysis
Conclusion
Acknowledgements
References
- Moore, J.W. Inorganic contaminments of surface water 1991, 215.
- Dietrich, B.; Viout, P.; Lehn, J.M. Macrocyclic Chemistry; VCH: Weinheim, 1993. [Google Scholar]
- Kimura, E. Pure Appl. Chem 1989, 61, 823.
- Creutz, C.; Sullivan, B.P.; Krist, K.; Guard, H.E. (Eds.) Electrochemical and Electrocatalytic Reduction of Carbon Dioxide; Elsevier: Amsterdam, 1993; p. 19.
- Taniguchi, I.; Nakashima, N.; Yasukouchi, K. J. J. Chem. Soc. Chem. Commun. 1986, 1814.
- Kinneary, J.F.; Albert, J.S.; Burrows, C.J. J. Am. Chem. Soc. 1988, 110, 6124. [PubMed]
- Stolzenberg, A.M.; Zhang, Z. Inorg. Chem. 1997, 36, 593.
- Kaden, T.A. Top. Curr. Chem. 1984, 121, 157.
- Gupta, V.K.; Prasad, R.; Kumar, P.; Mangla, R. Anal, Chim. Acta 2000, 20655, 1.
- Lal, U.S.; Chattopadhyaya, M.C.; Dey, A.K. J. Ind. Chem. Soc. 1982, 59, 493.
- Jain, A.K.; Gupta, V.K.; Singh, R.D.; Khurana, U.; Singh, L.P. Sens. Actuators B 1997, 40, 15.
- Pungor, E.; Toth, K.; Havas, J. Acta Chim. Acad. Sci. Hung 1966, 48, 17.
- Awasthi, S.P.; Kulkarni, V.T.; Sundaresan, M. J. Electrochem. Soc. India 1988, 37, 309.
- Rao, G.N.; Srivastava, S.; Srivastava, S.K.; Singh, M. Talanta 1966, 43, 1821.
- Luca, C.; Pleniceanu, M.; Muregasan, N. Chem. Rev. 1976, 27, 1088.
- Smirnova, E.A.; Petrukhin, O.M.; Rogatinskaya, S.L. Zh. Anal Khim 1982, 37, 2137.
- Hampton, M.D.; Peters, C.A.; Wellington, L.A. Anal. Chim. Acta 1987, 194, 171. [CrossRef]
- Gupta, V.K.; Jain, A.K.; Singh, L.P.; Khurana, U. Anal. Chim. Acta 1997, 355, 33.
- Ganjali, M.R.; Hosseini, S.M.; Javanbakht, M.; Hashemi, O.R. Anal. Lett. 2000, 33, 3139.
- Shamsipur, M.; Kajemi, S.Y. Electroanalysis 2000, 12, 1472.
- Streeky, J.A.; Pillsbury, D.G.; Busch, D.G. Inorg. Chem. 1980, 19, 3148.
- Lehn, J.M. Supramolecular Chemistry, Concepts and Perspectives; VCH: Weinheim, 1995. [Google Scholar]
- Tsukube, H. Talanta 1993, 40, 1313. [PubMed]
- Jyo, H.; Minakami, R.; Kanda, Y.; Egawa, H. Sensors and Actuators B 1993, 13/14, 200.
- Chaniotakis, N.A.; Chasser, A.M.; Meyerhoff, M.E. Anal. Chem. 1988, 60, 88.
- Gao, D.; Jun, G.; Yu, R.; Zheng, G. Analyst 1995, 120, 499.
- Chipperfield, J.P.; Woodward, S. J. Chem. Educ. 1994, 71, 75.
- Sa’ez de Viteri, F.I.; Diamond, D. Analyst 1994, 119, 749.
- Gadzekpo, V.P.Y.; Christian, G.D. Anal. Chim. Acta 1984, 164, 279.
- Gupta, V.K.; Kumar, P. Anal. Chim. Acta 1999, 389, 205.
- Gupta, V.K. Sensors and Actuators B 1999, 55, 195.
- Gupta, V.K.; Jain, A.K.; Singh, L.P.; Khurana, U. Sensors and Actuators B 1999, 55, 201.
- Gupta, V.K.; Jain, A.K.; Singh, L.P.; Khurana, U. Electrochim. Acta 1998, 43, 2047.
- Gupta, V.K.; Khurana, U.; Mangla, R.; Kumar, P. Electroanalysis 1999, 11, 573.
- Sample Availability: Available from the authors.
2002 by MDPI (http://www.mdpi.net). Reproduction is permitted for noncommercial purposes.
Share and Cite
Gupta, V.K.; Prasad, R.; Kumar, A. Dibenzocyclamnickel(II) as Ionophore in PVC-Matrix for Ni2+-Selective Sensor. Sensors 2002, 2, 384-396. https://doi.org/10.3390/s21000384
Gupta VK, Prasad R, Kumar A. Dibenzocyclamnickel(II) as Ionophore in PVC-Matrix for Ni2+-Selective Sensor. Sensors. 2002; 2(10):384-396. https://doi.org/10.3390/s21000384
Chicago/Turabian StyleGupta, Vinod K., Rajendra Prasad, and Azad Kumar. 2002. "Dibenzocyclamnickel(II) as Ionophore in PVC-Matrix for Ni2+-Selective Sensor" Sensors 2, no. 10: 384-396. https://doi.org/10.3390/s21000384
APA StyleGupta, V. K., Prasad, R., & Kumar, A. (2002). Dibenzocyclamnickel(II) as Ionophore in PVC-Matrix for Ni2+-Selective Sensor. Sensors, 2(10), 384-396. https://doi.org/10.3390/s21000384