An Evaluation of Gearbox Condition Monitoring Using Infrared Thermal Images Applied with Convolutional Neural Networks


Abstract
1. Introduction
2. CNN-Based Feature Extraction
2.1. Convolutional Layer
2.2. Batch Normalization Layer
2.3. Activation Layer
2.4. Pooling Layer
3. SoftMax Regression
4. IRT–CNN Method for Gearbox Diagnosis
5. Experimental IRT Images Acquisition
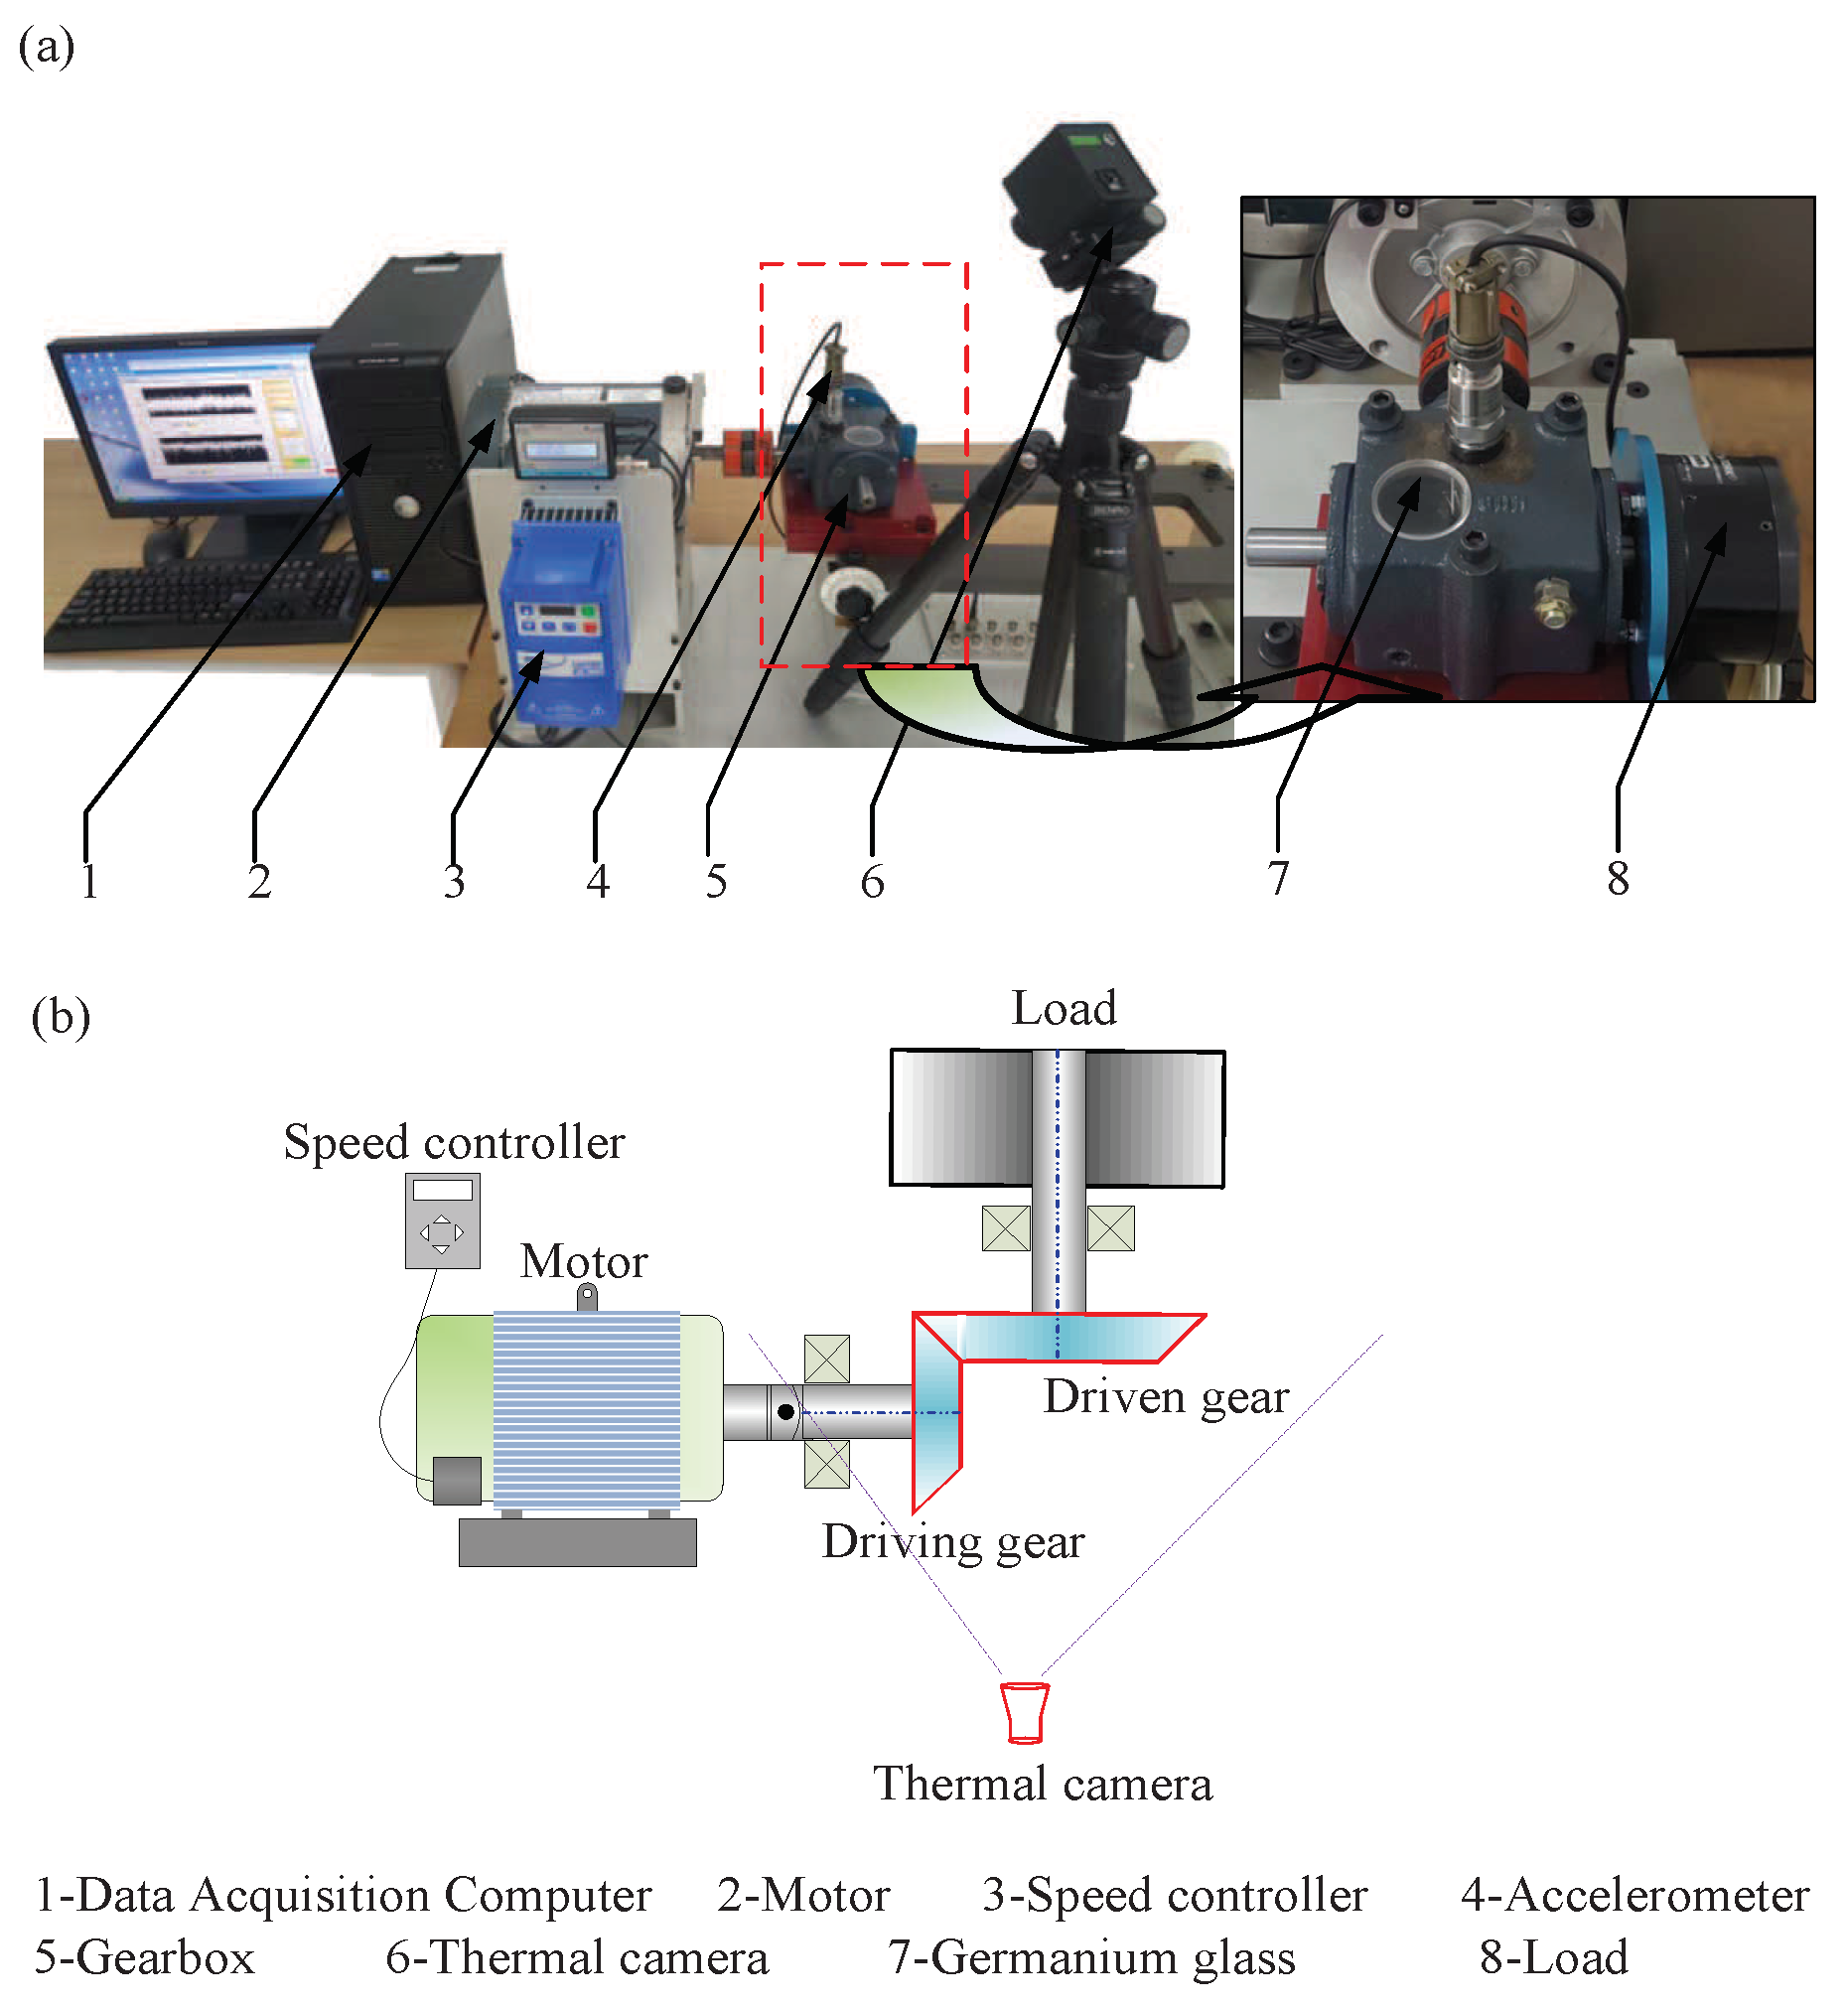
5.1. Experimental Setup
| Algorithm 1 Steps for the thermal image acquisition. |
|
5.2. Condition Monitoring Performance Evaluation
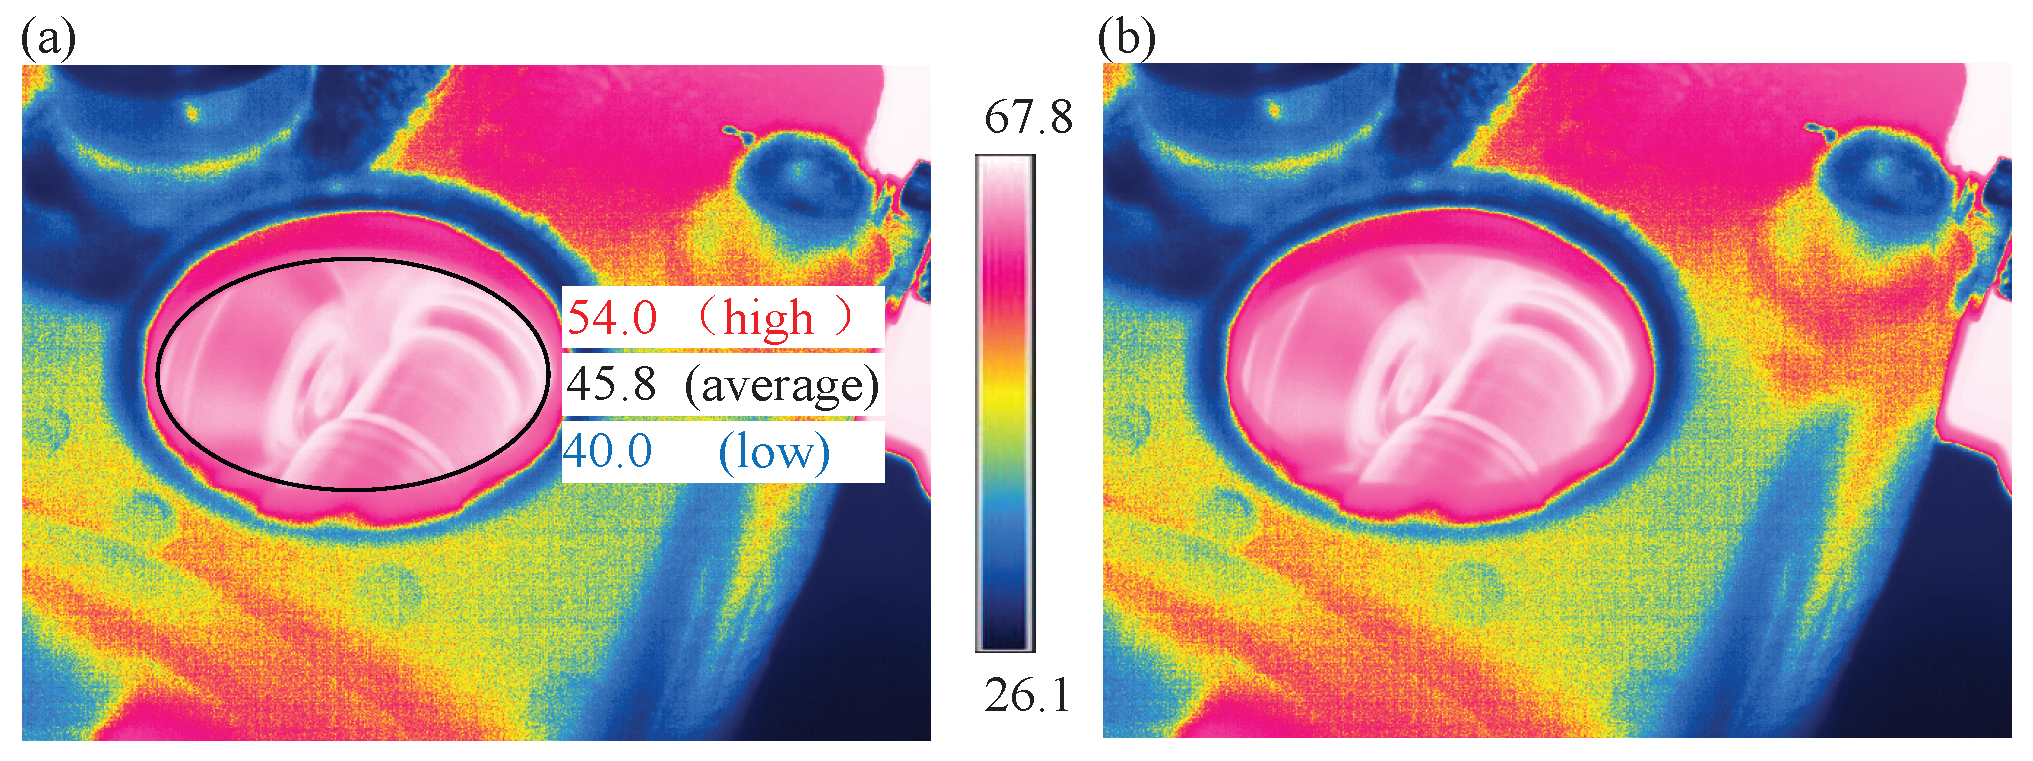
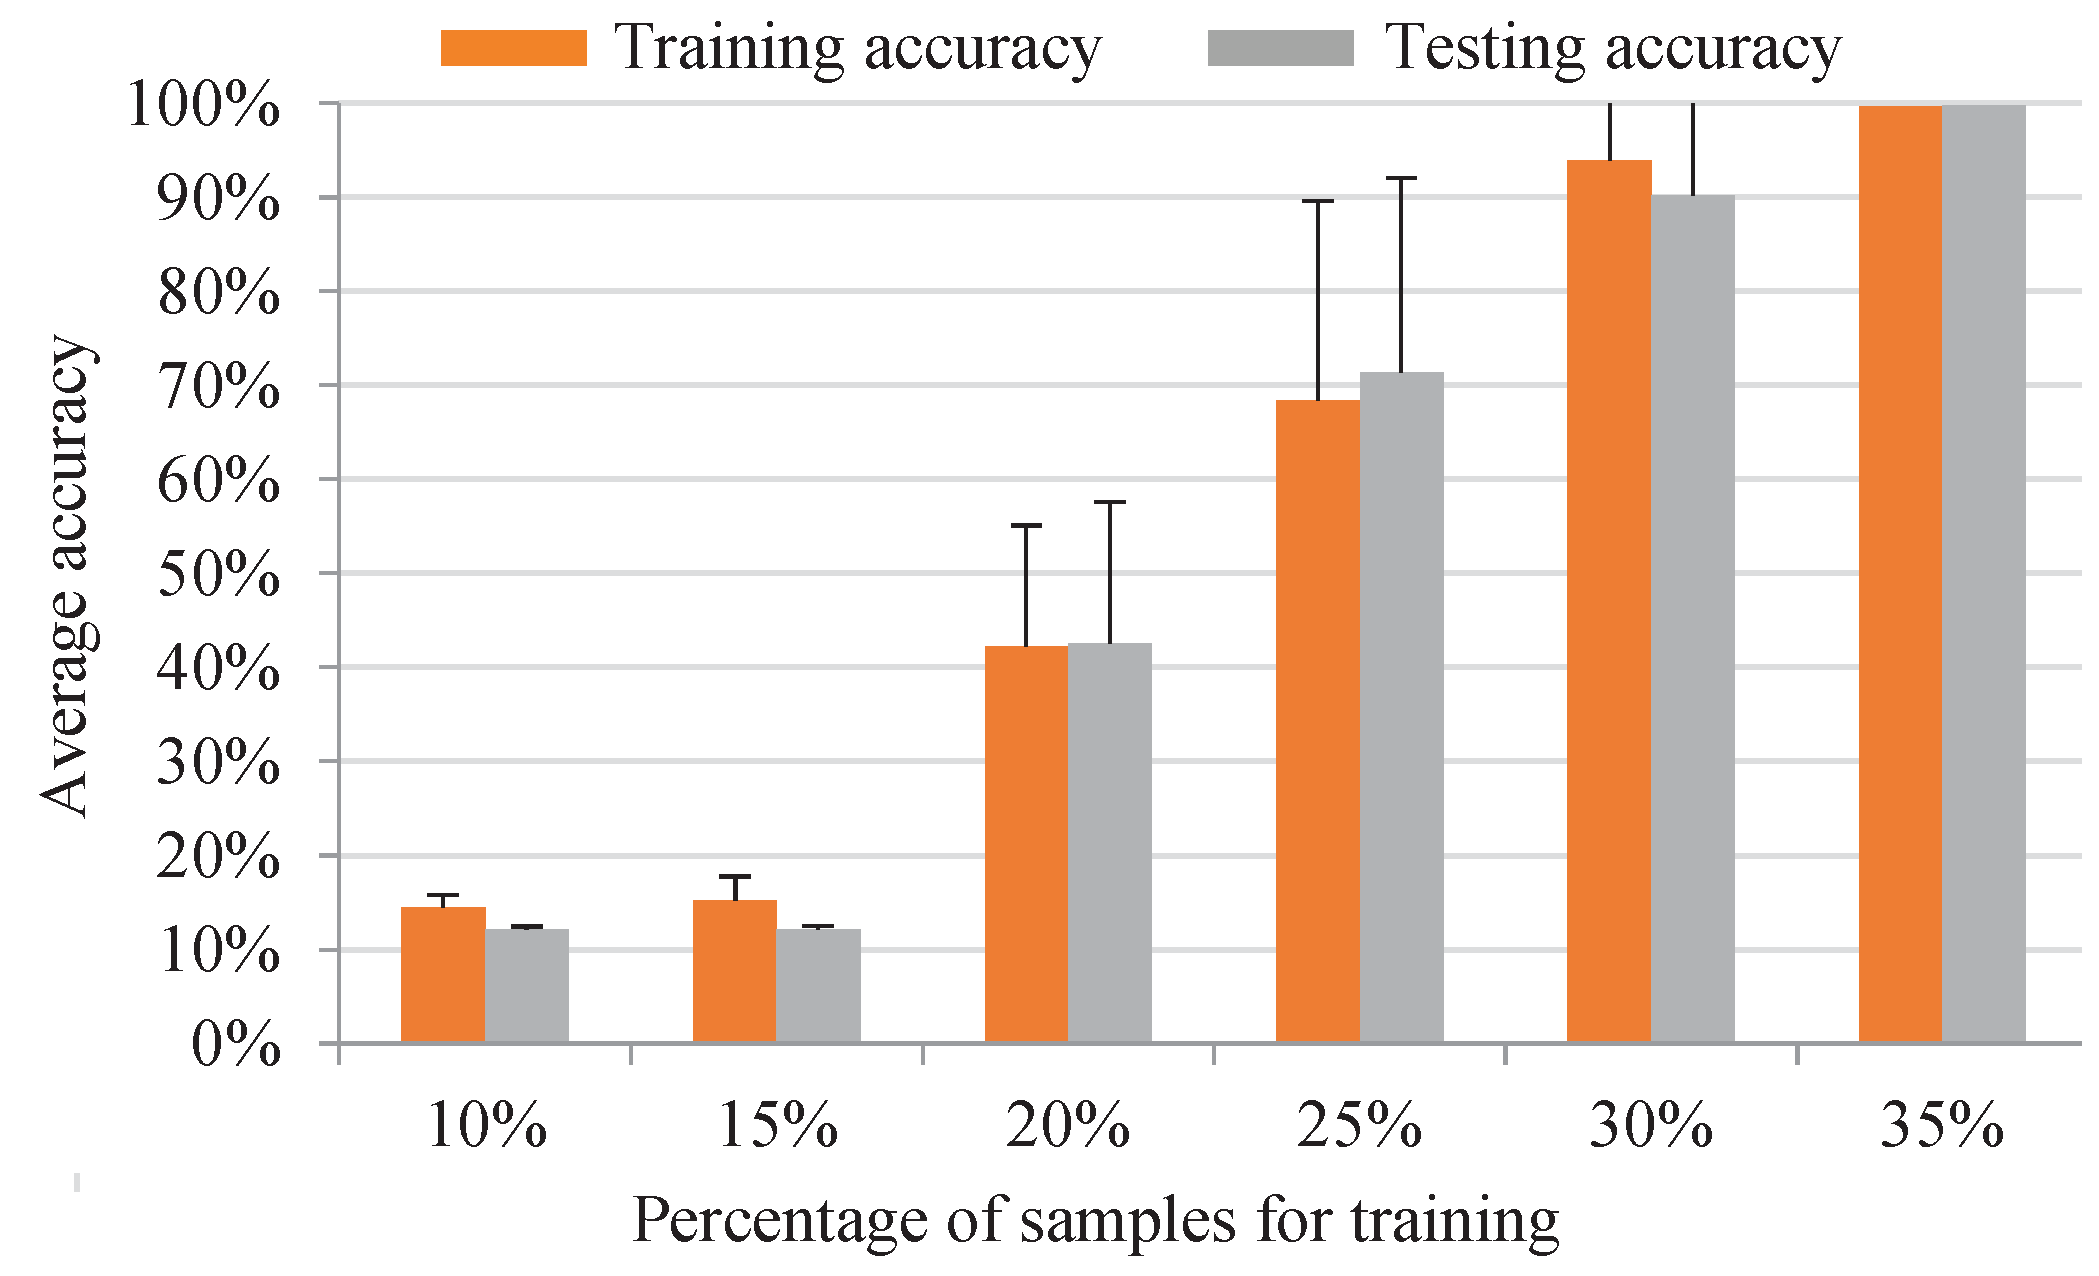
5.2.1. Evaluation with IRT Image at a Specified Temperature
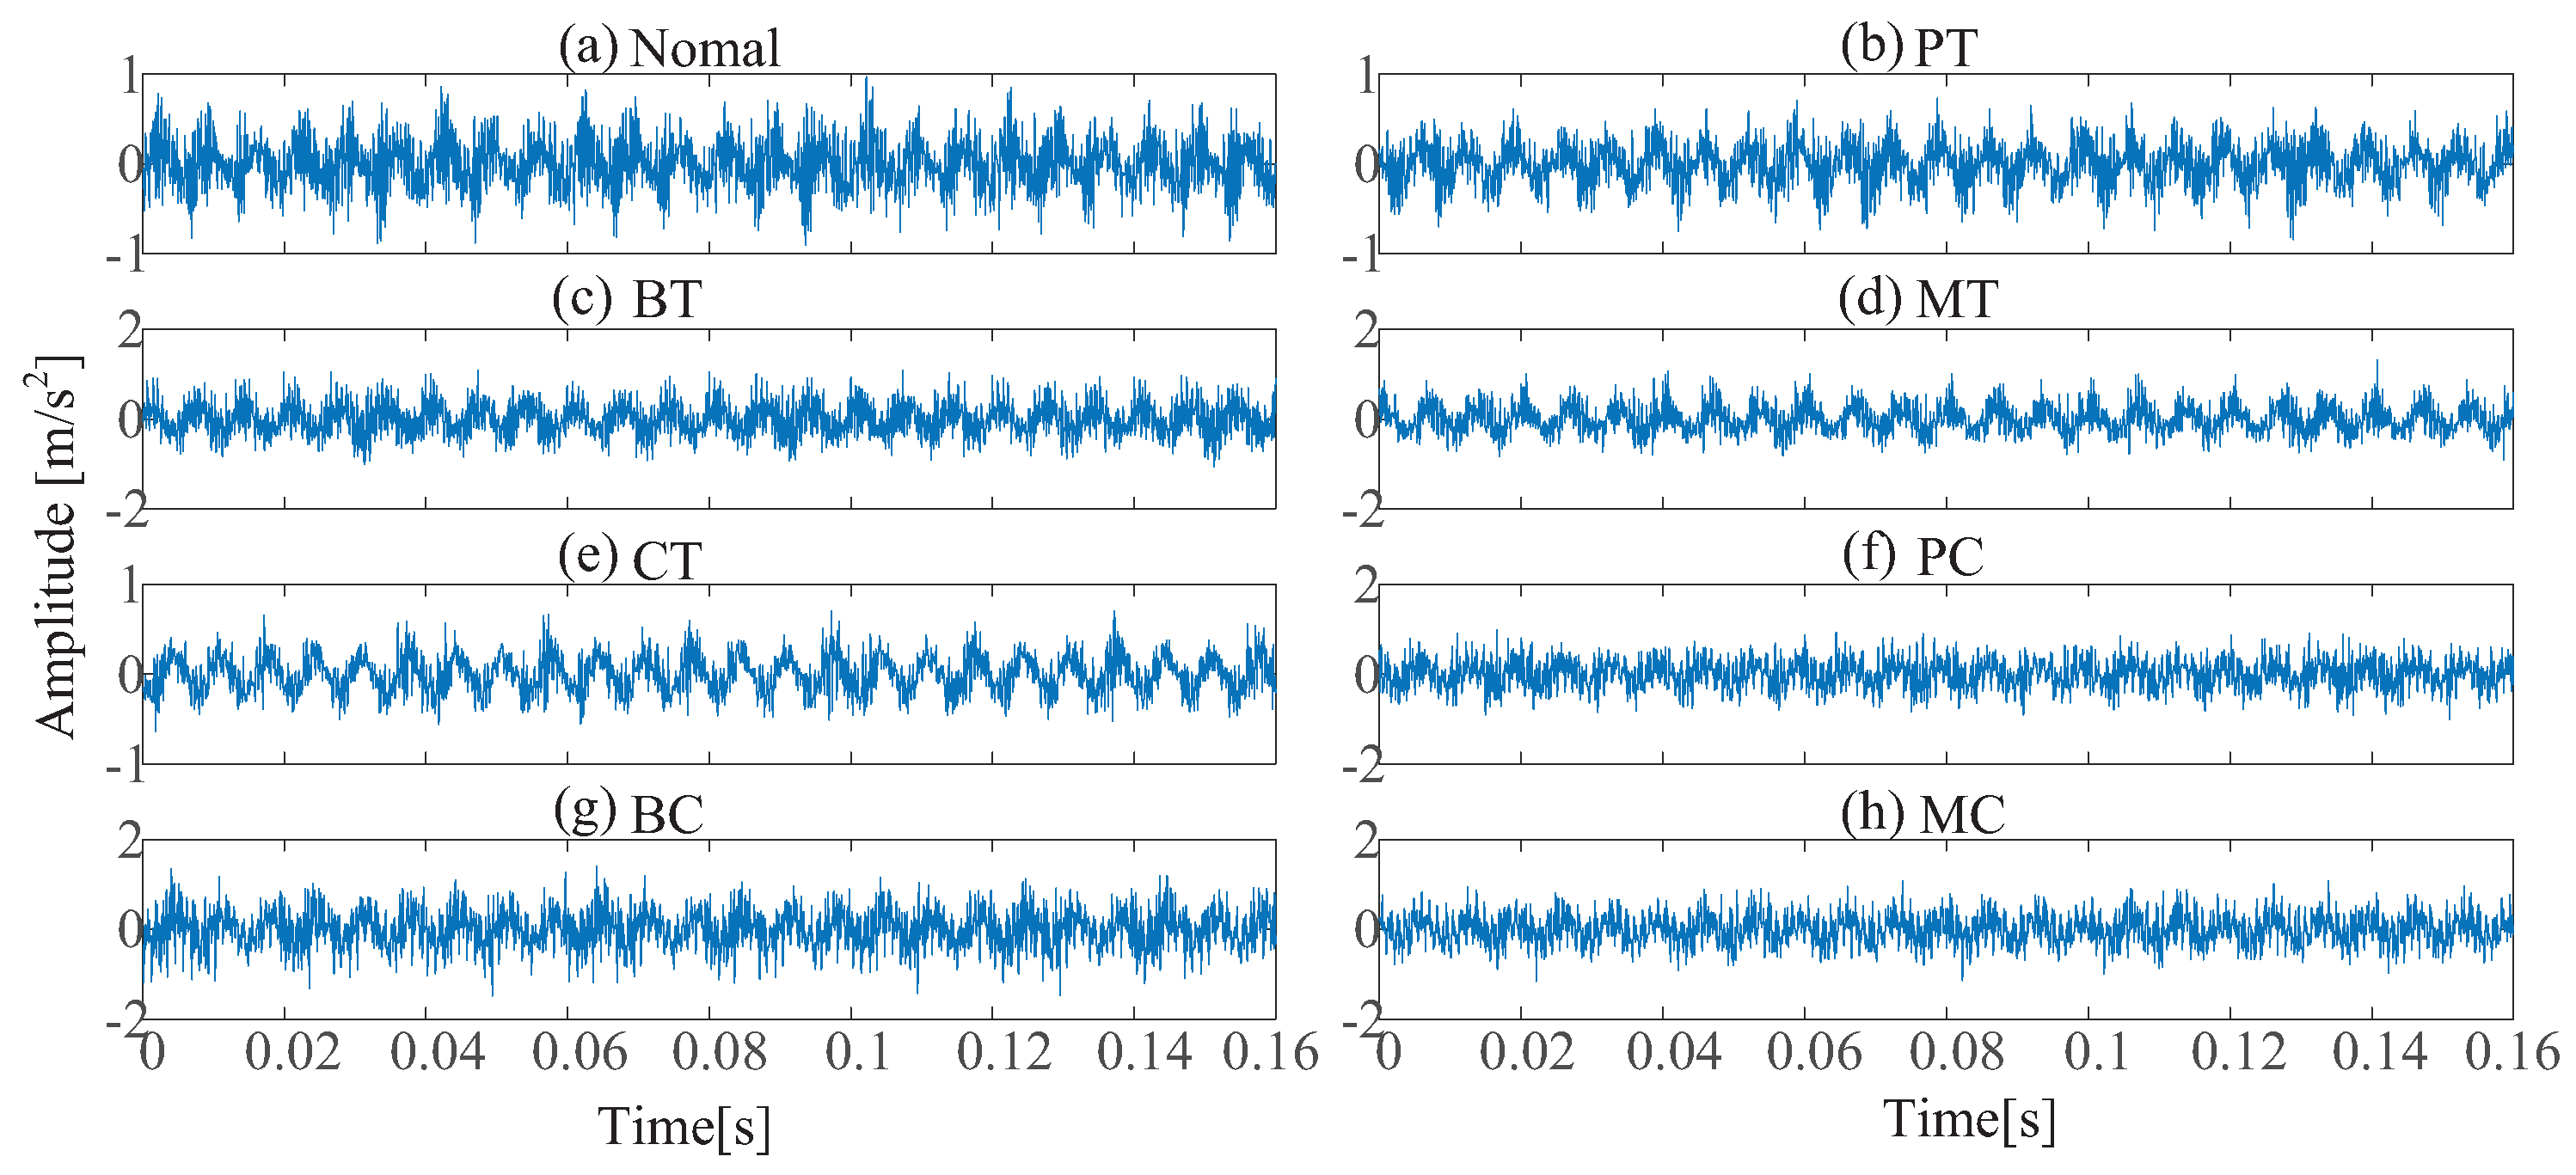
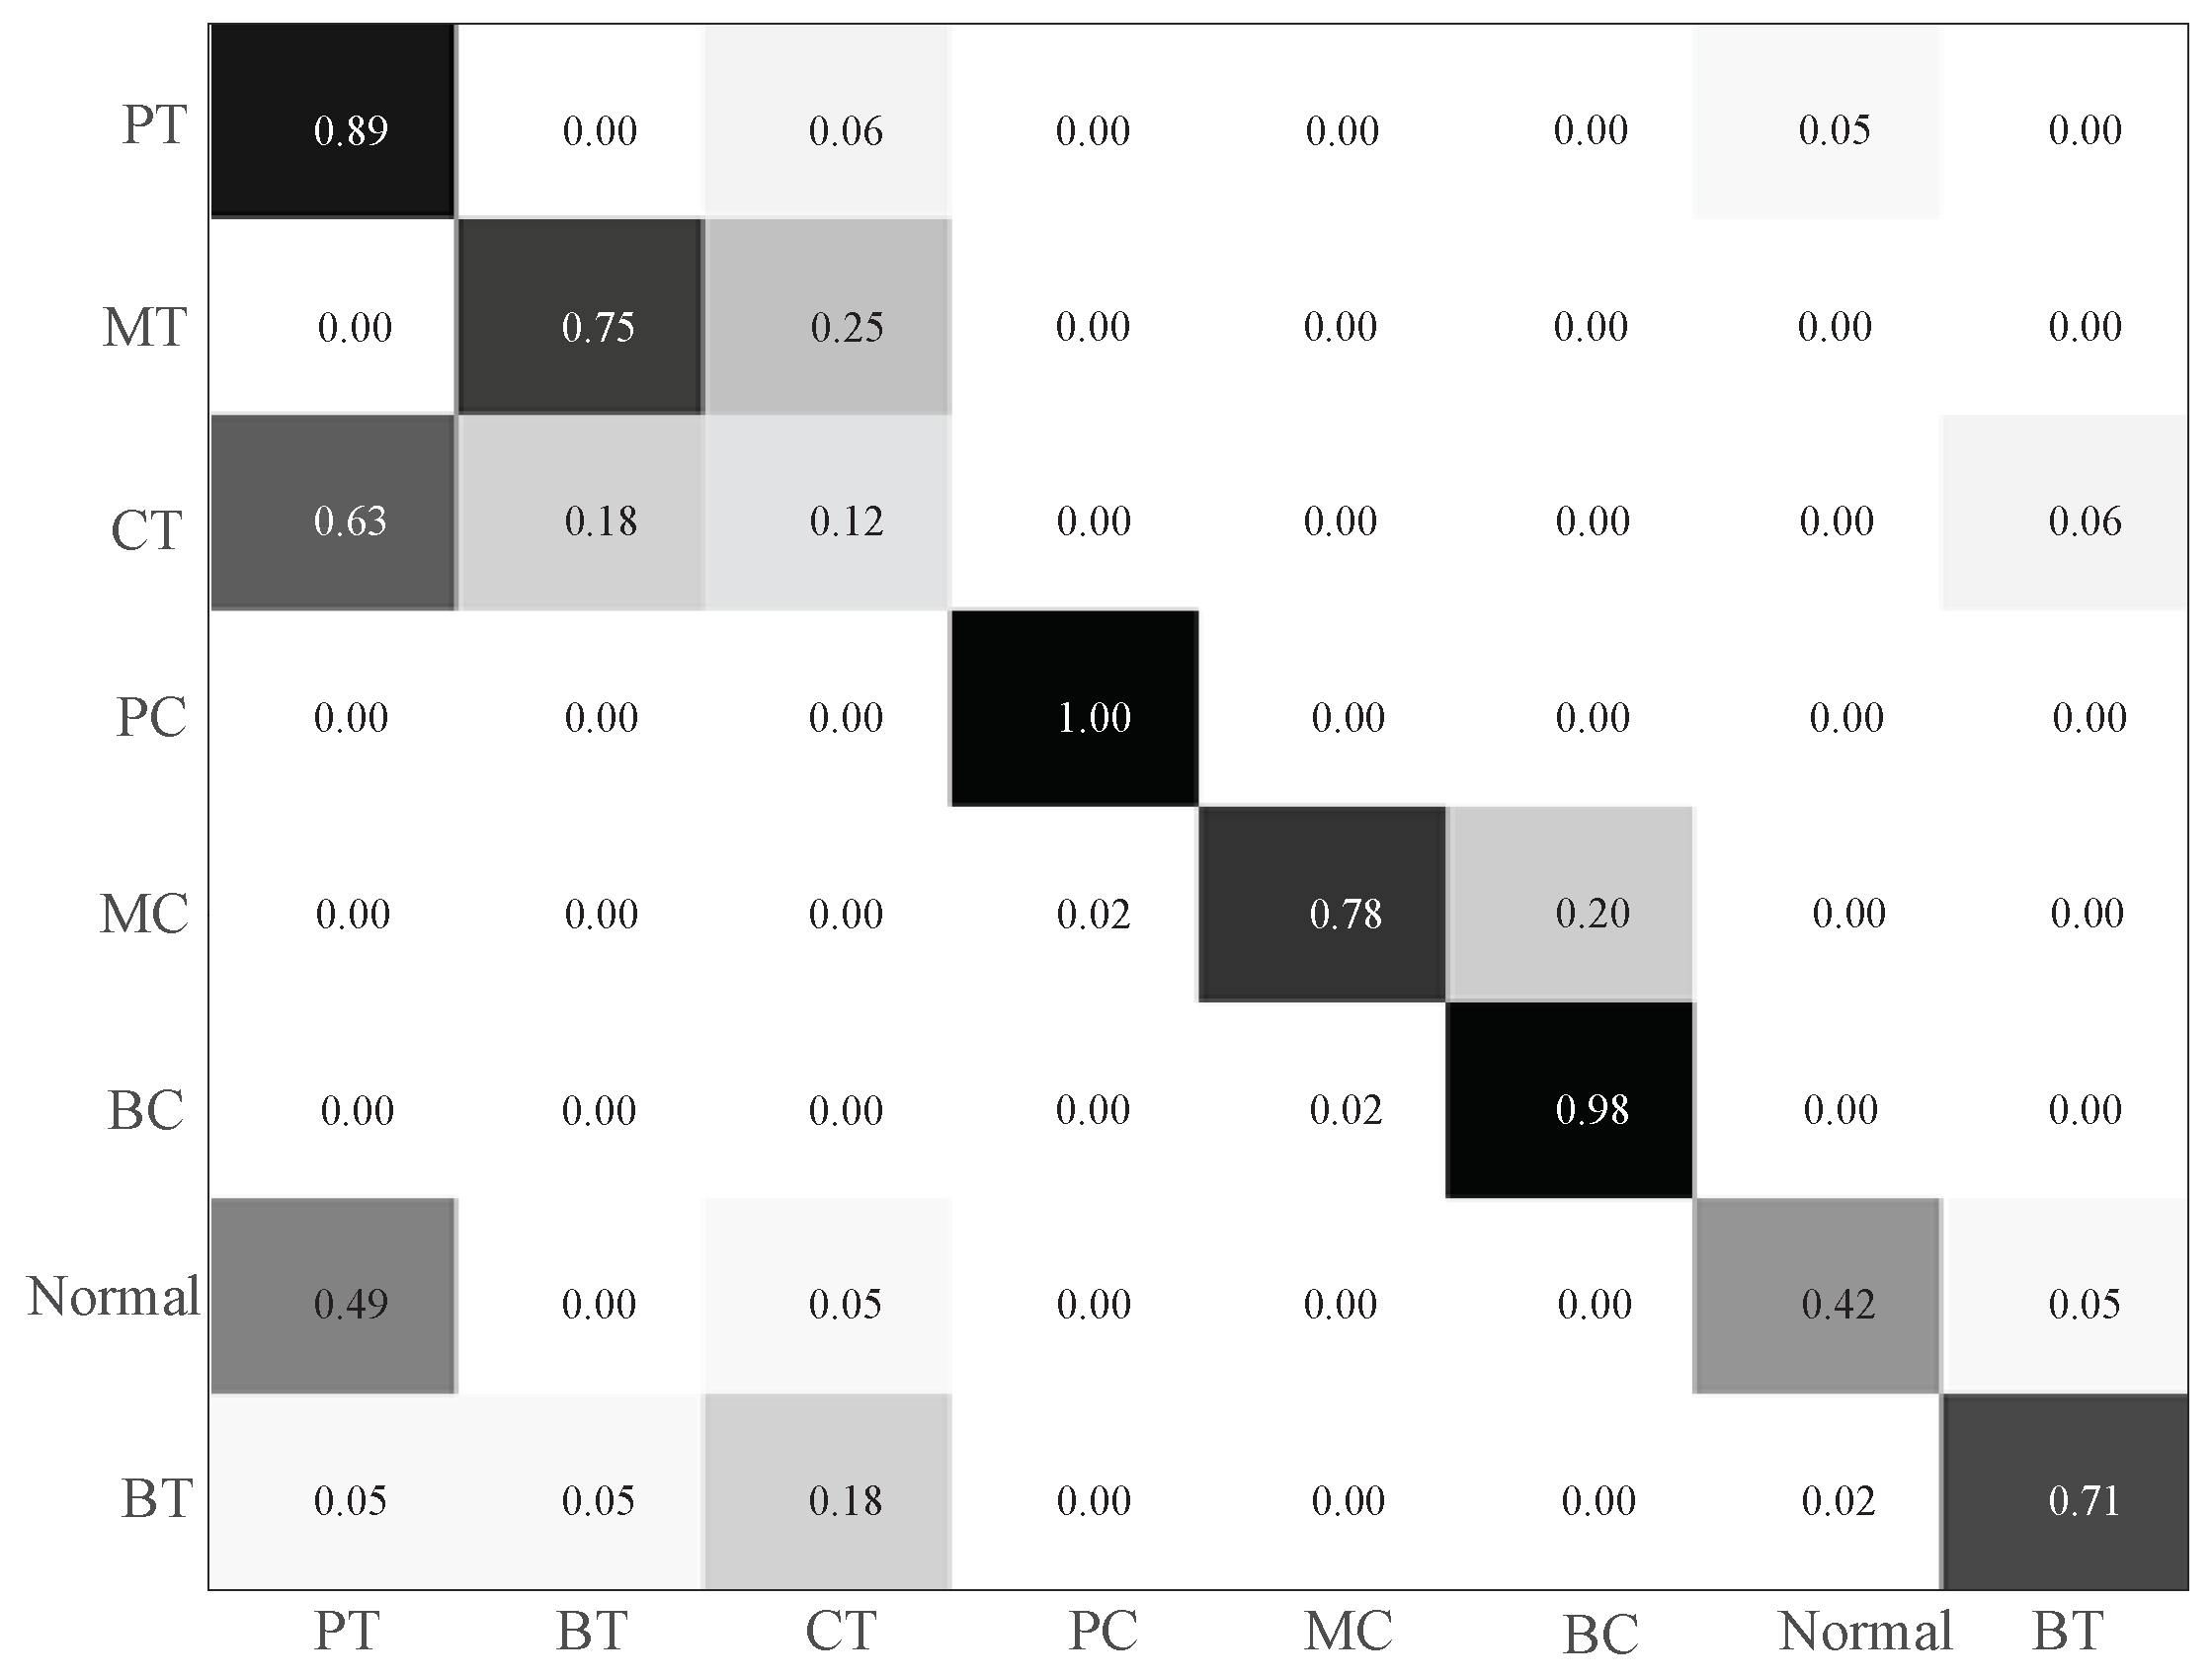
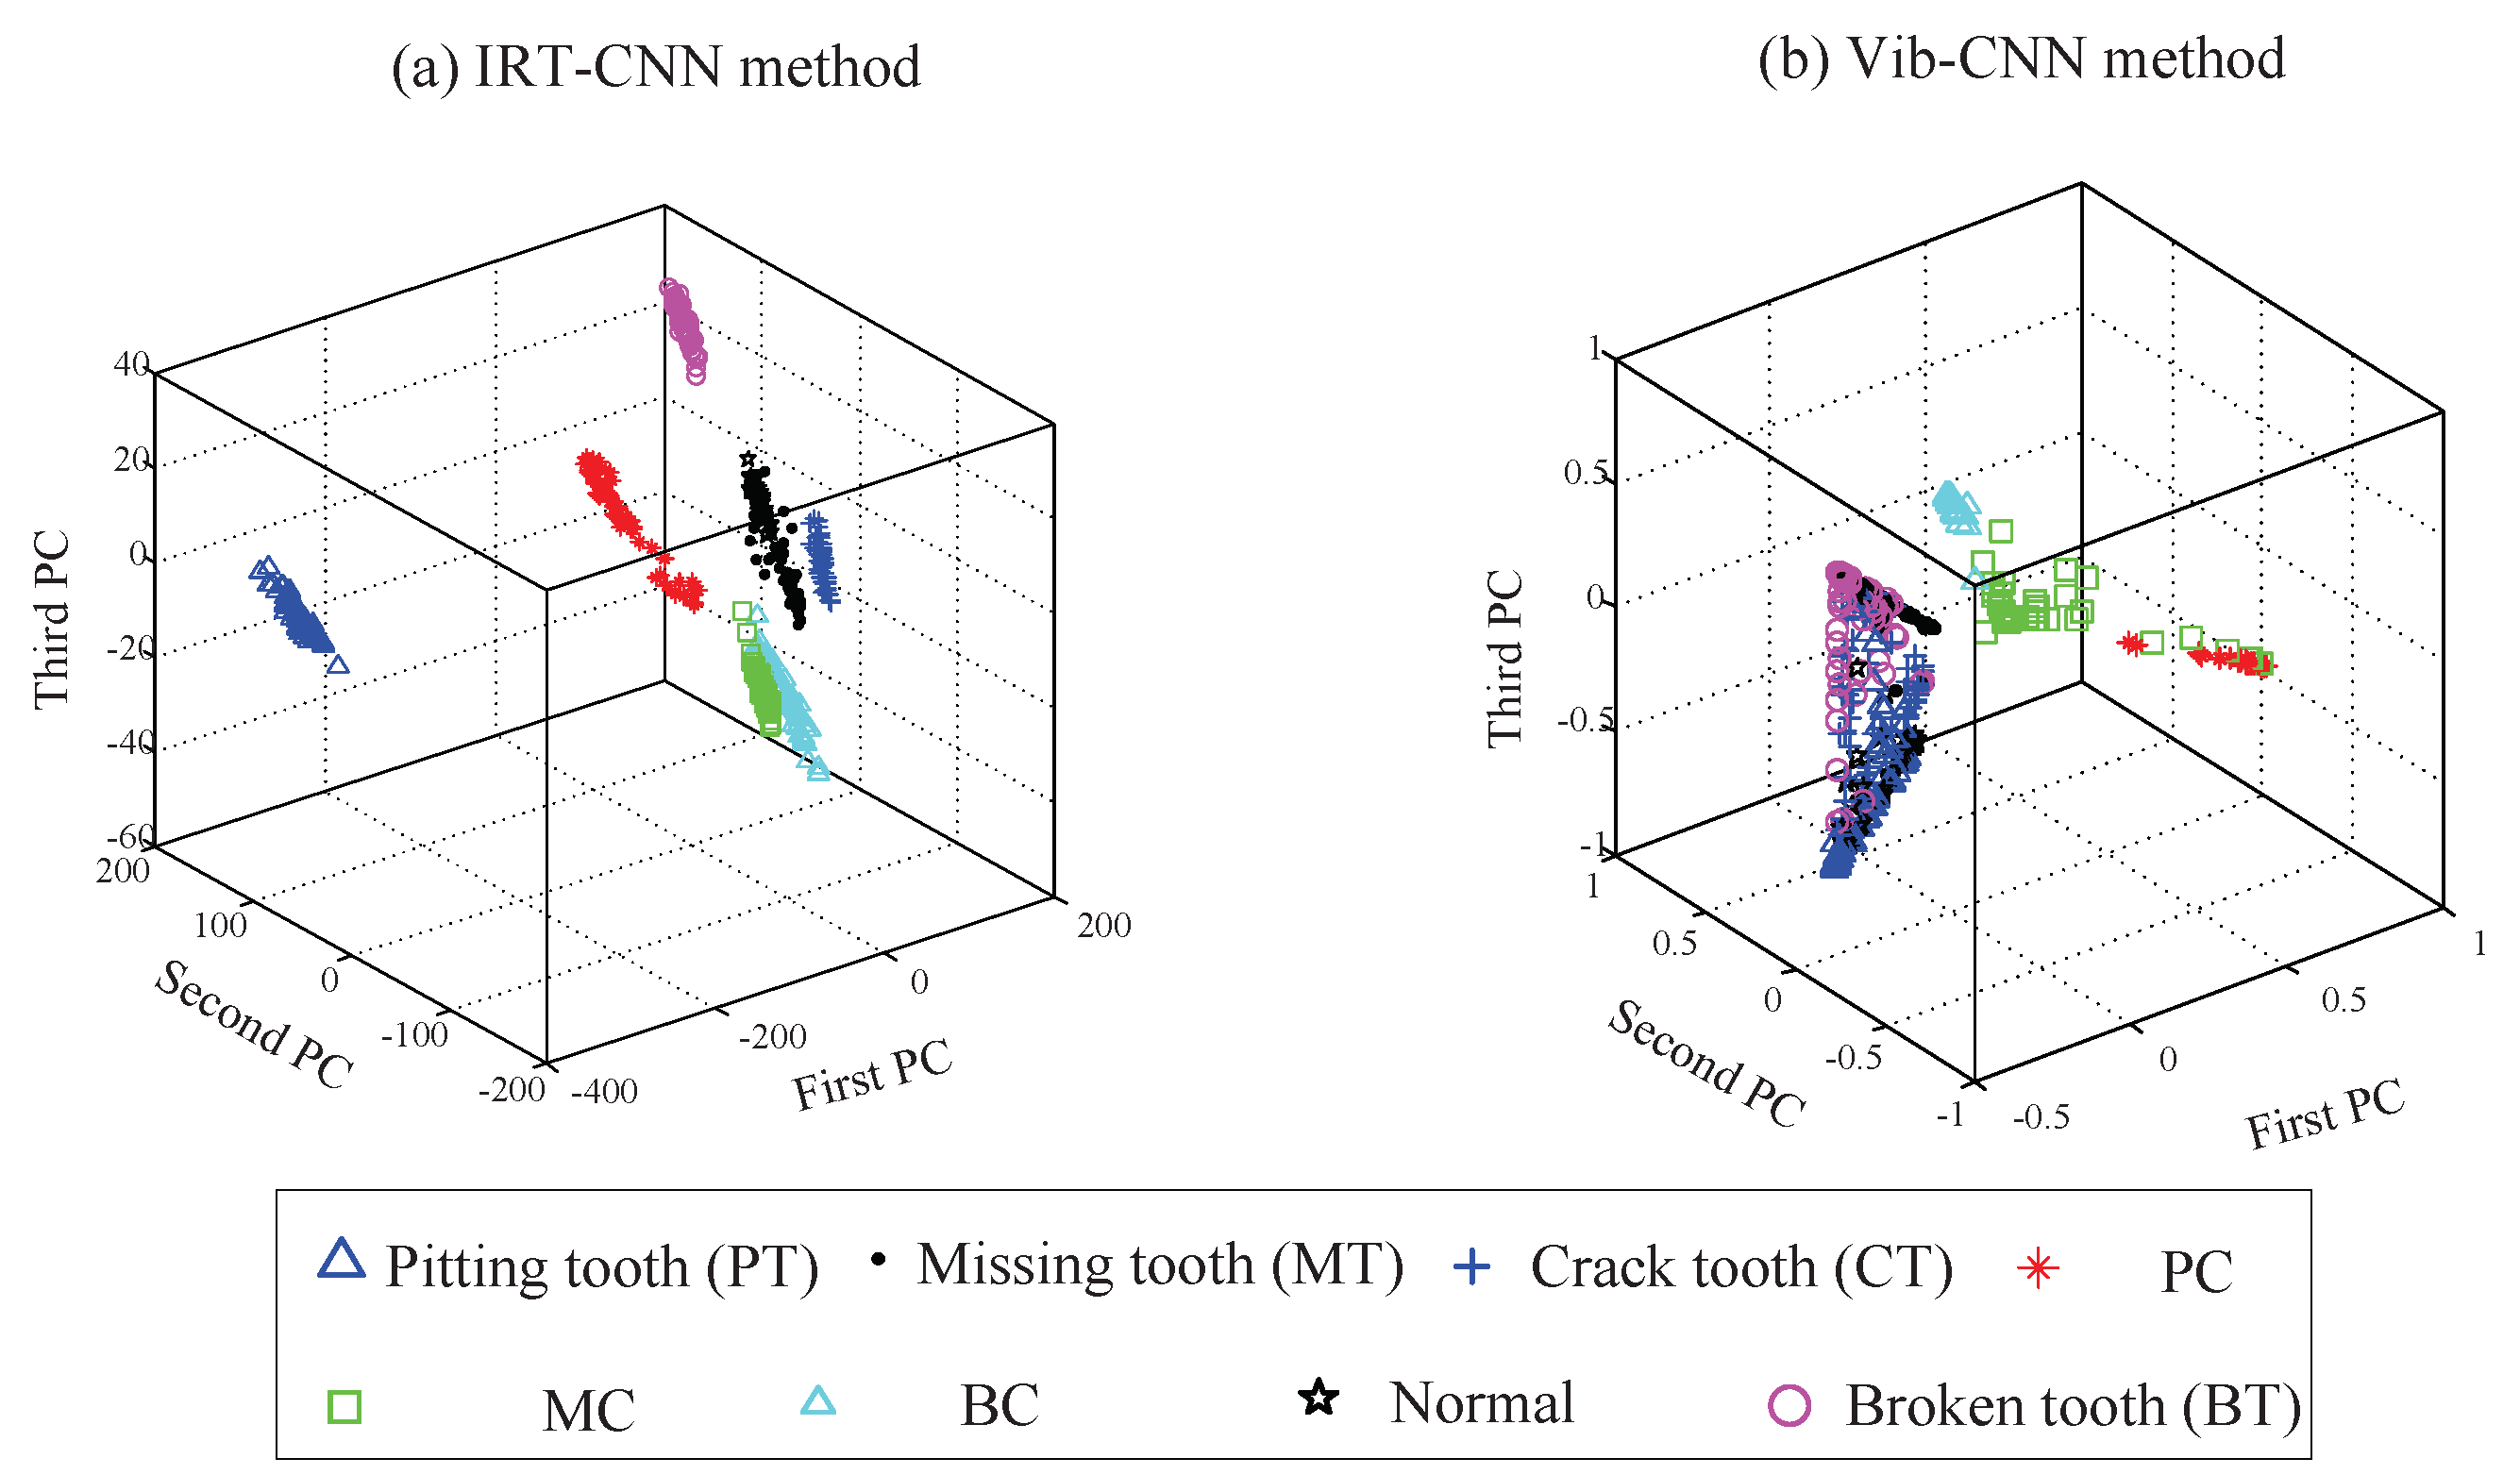
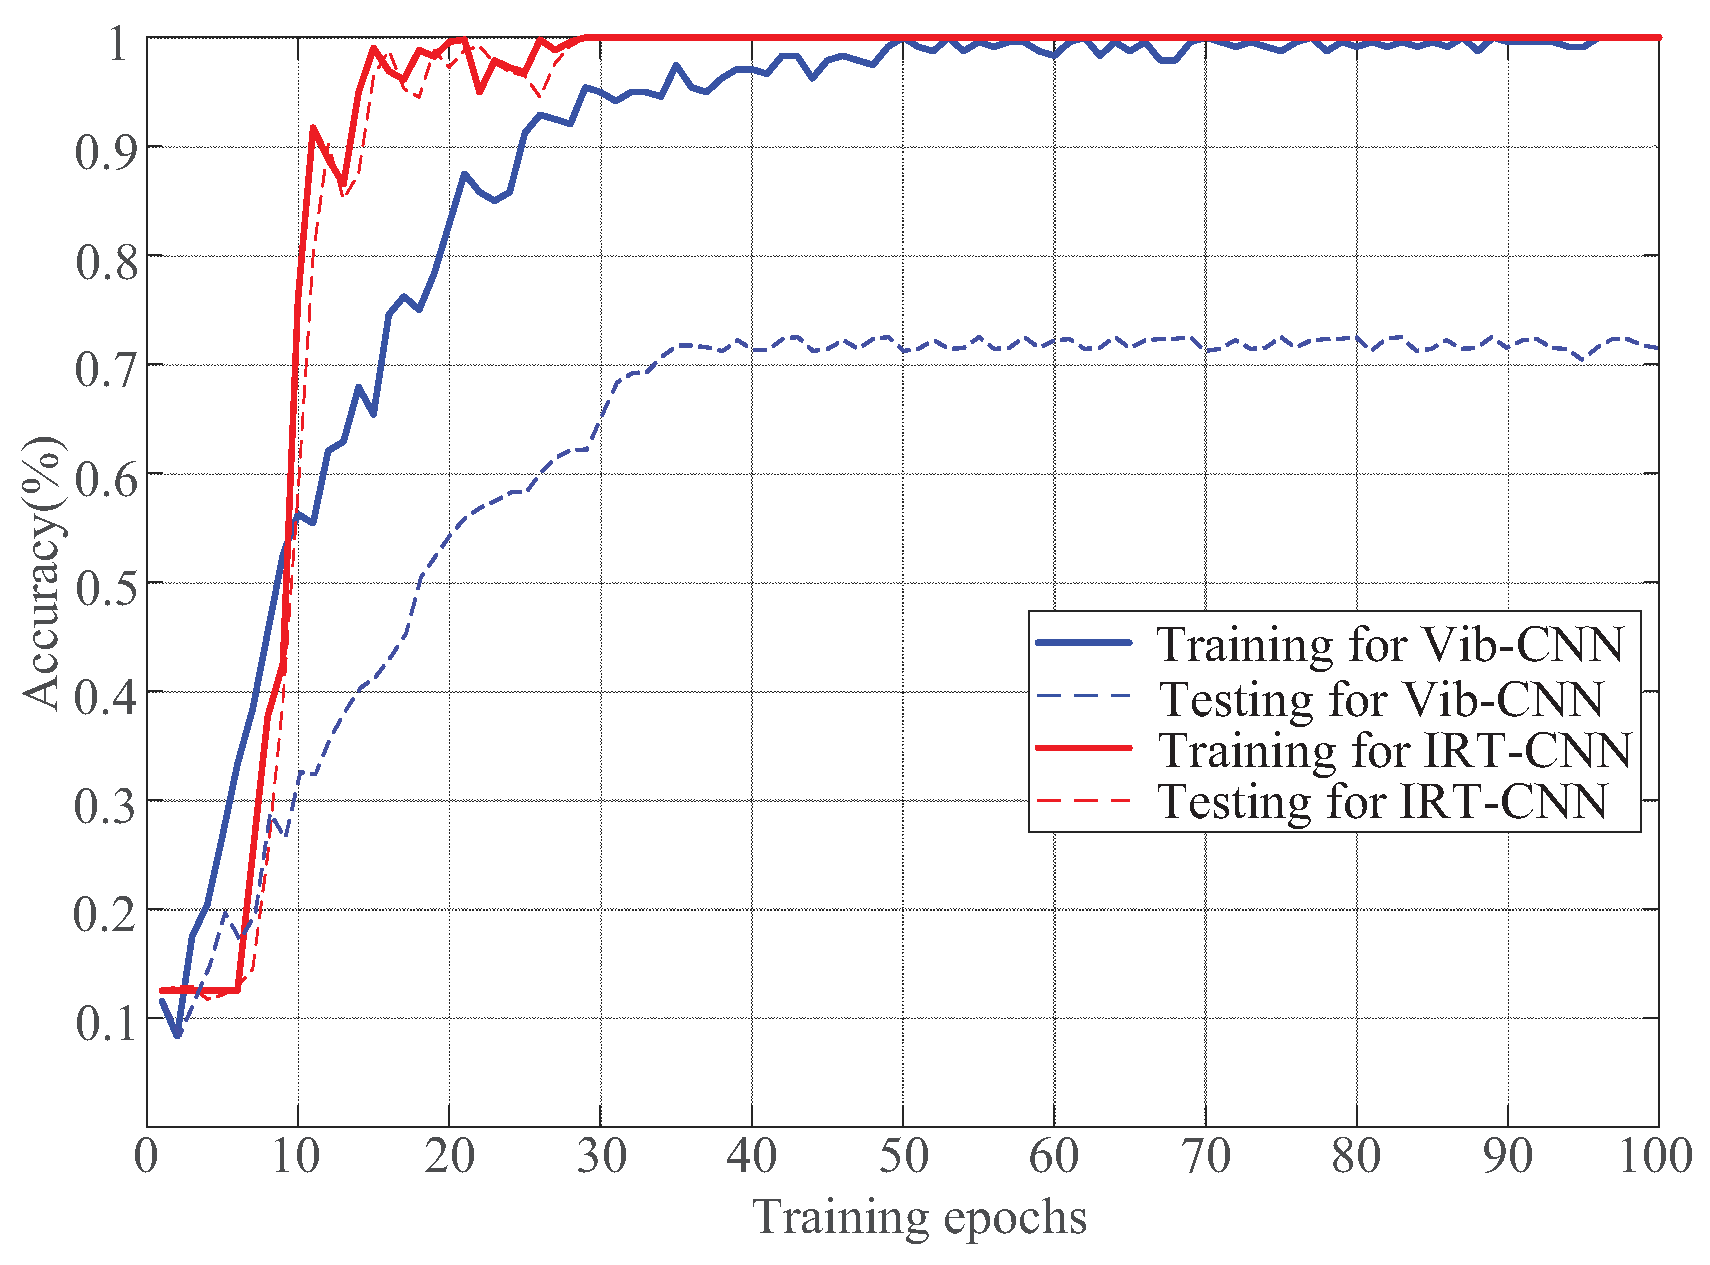
5.2.2. Comparison with Vibration Signals
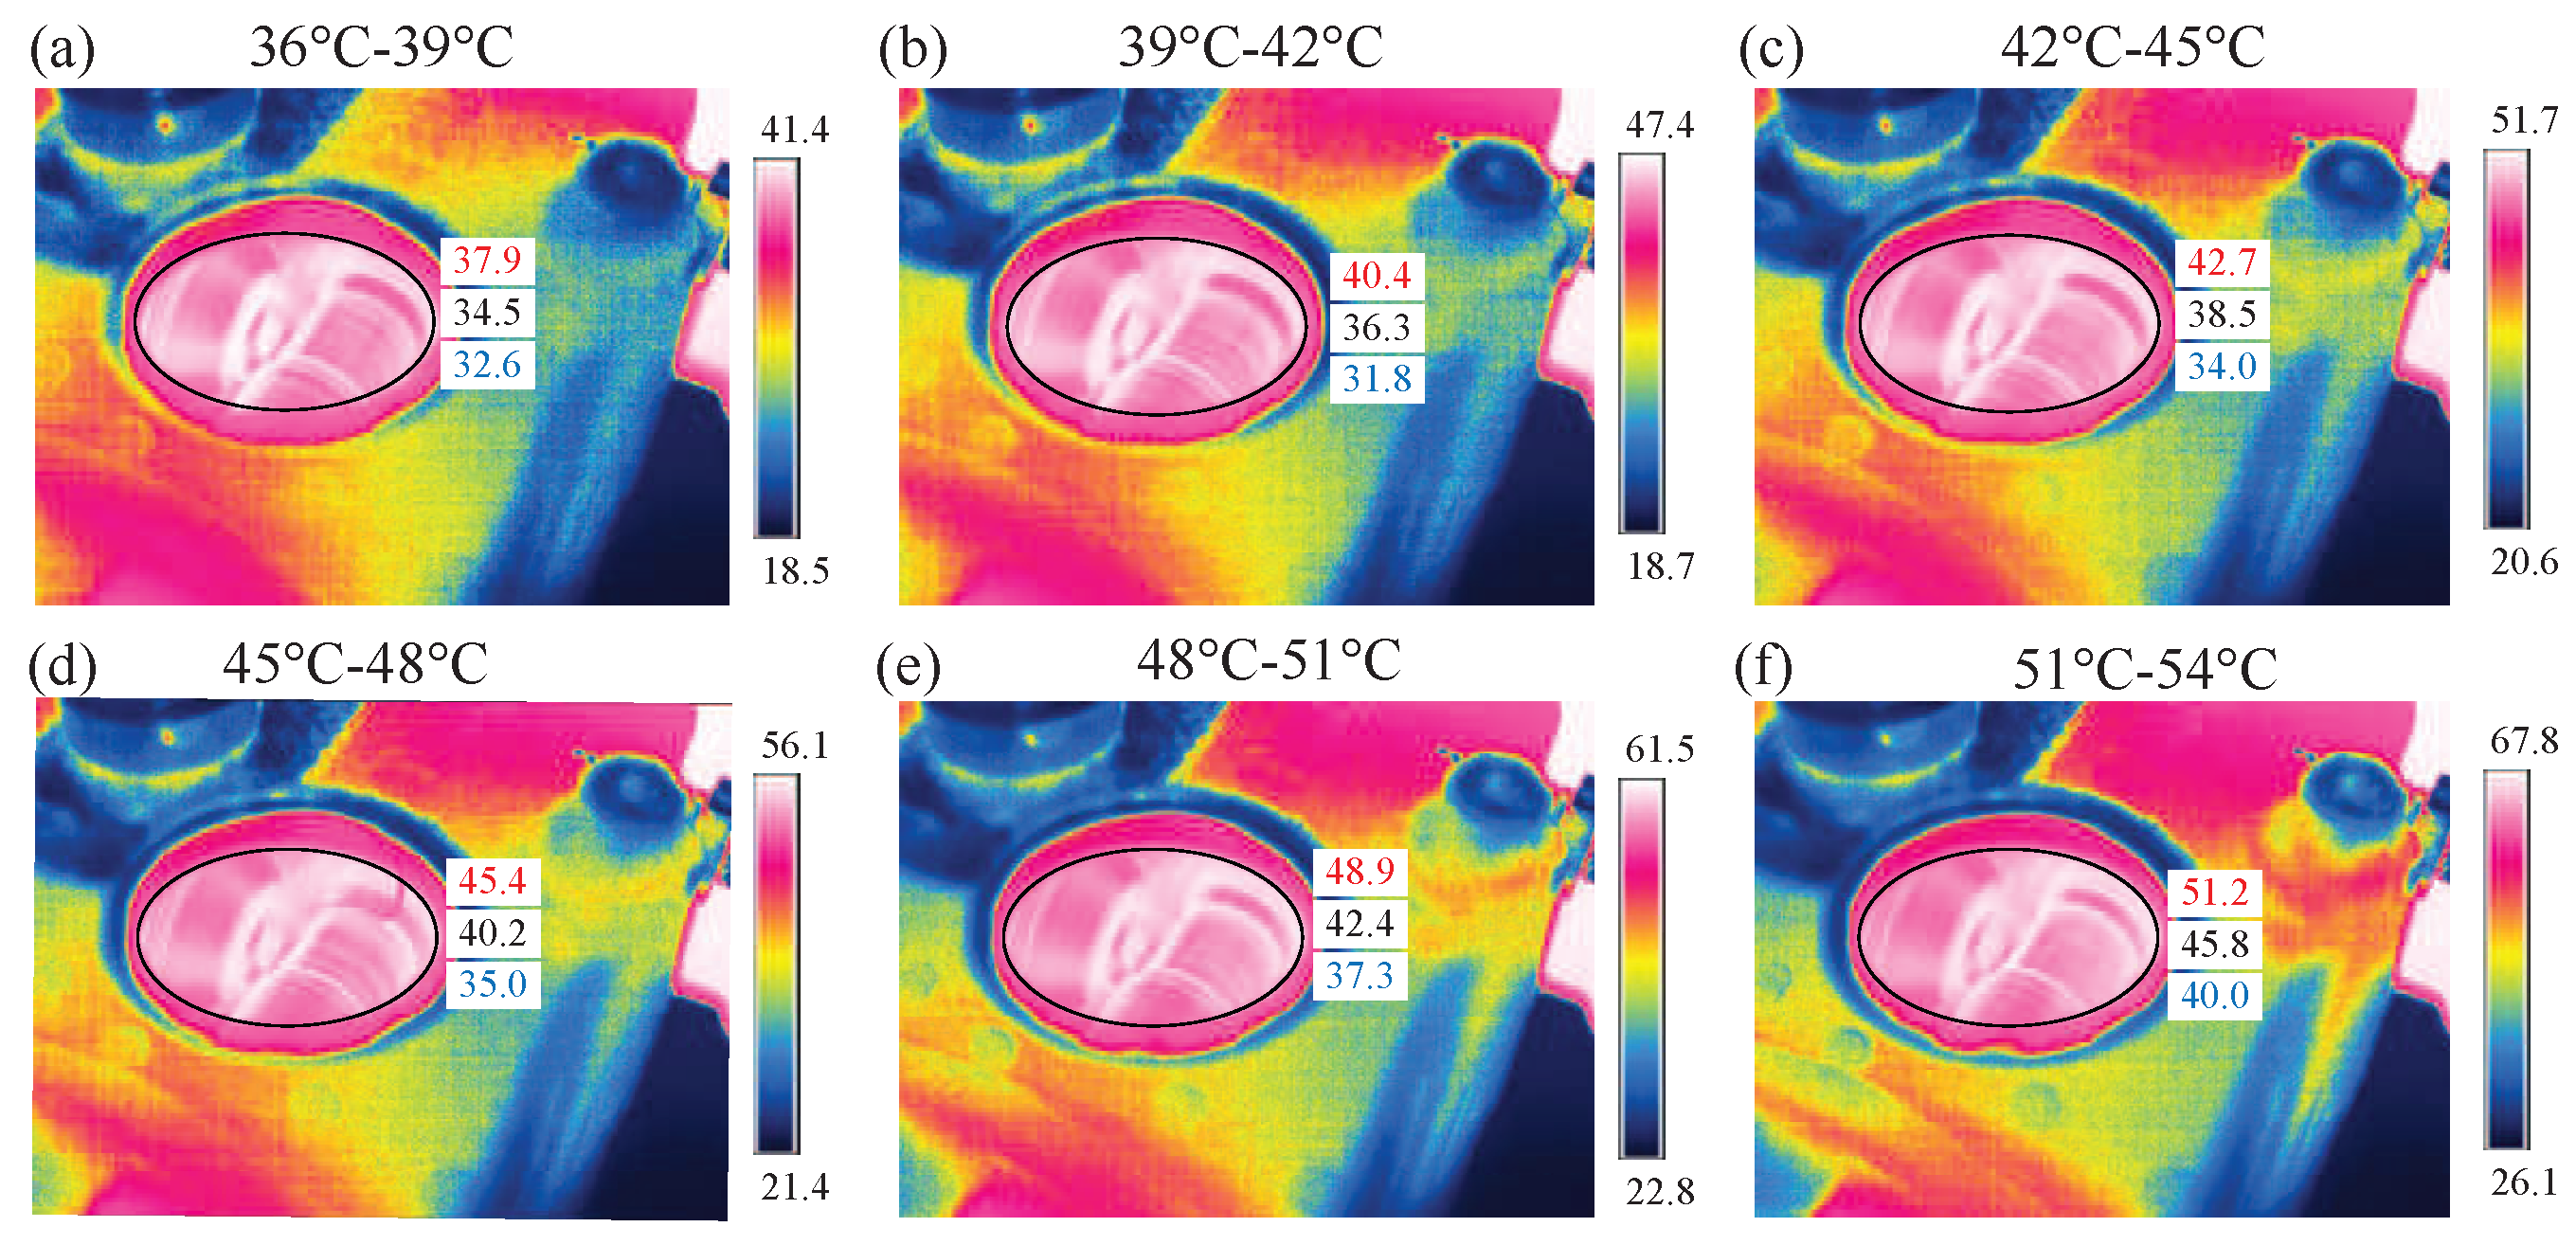
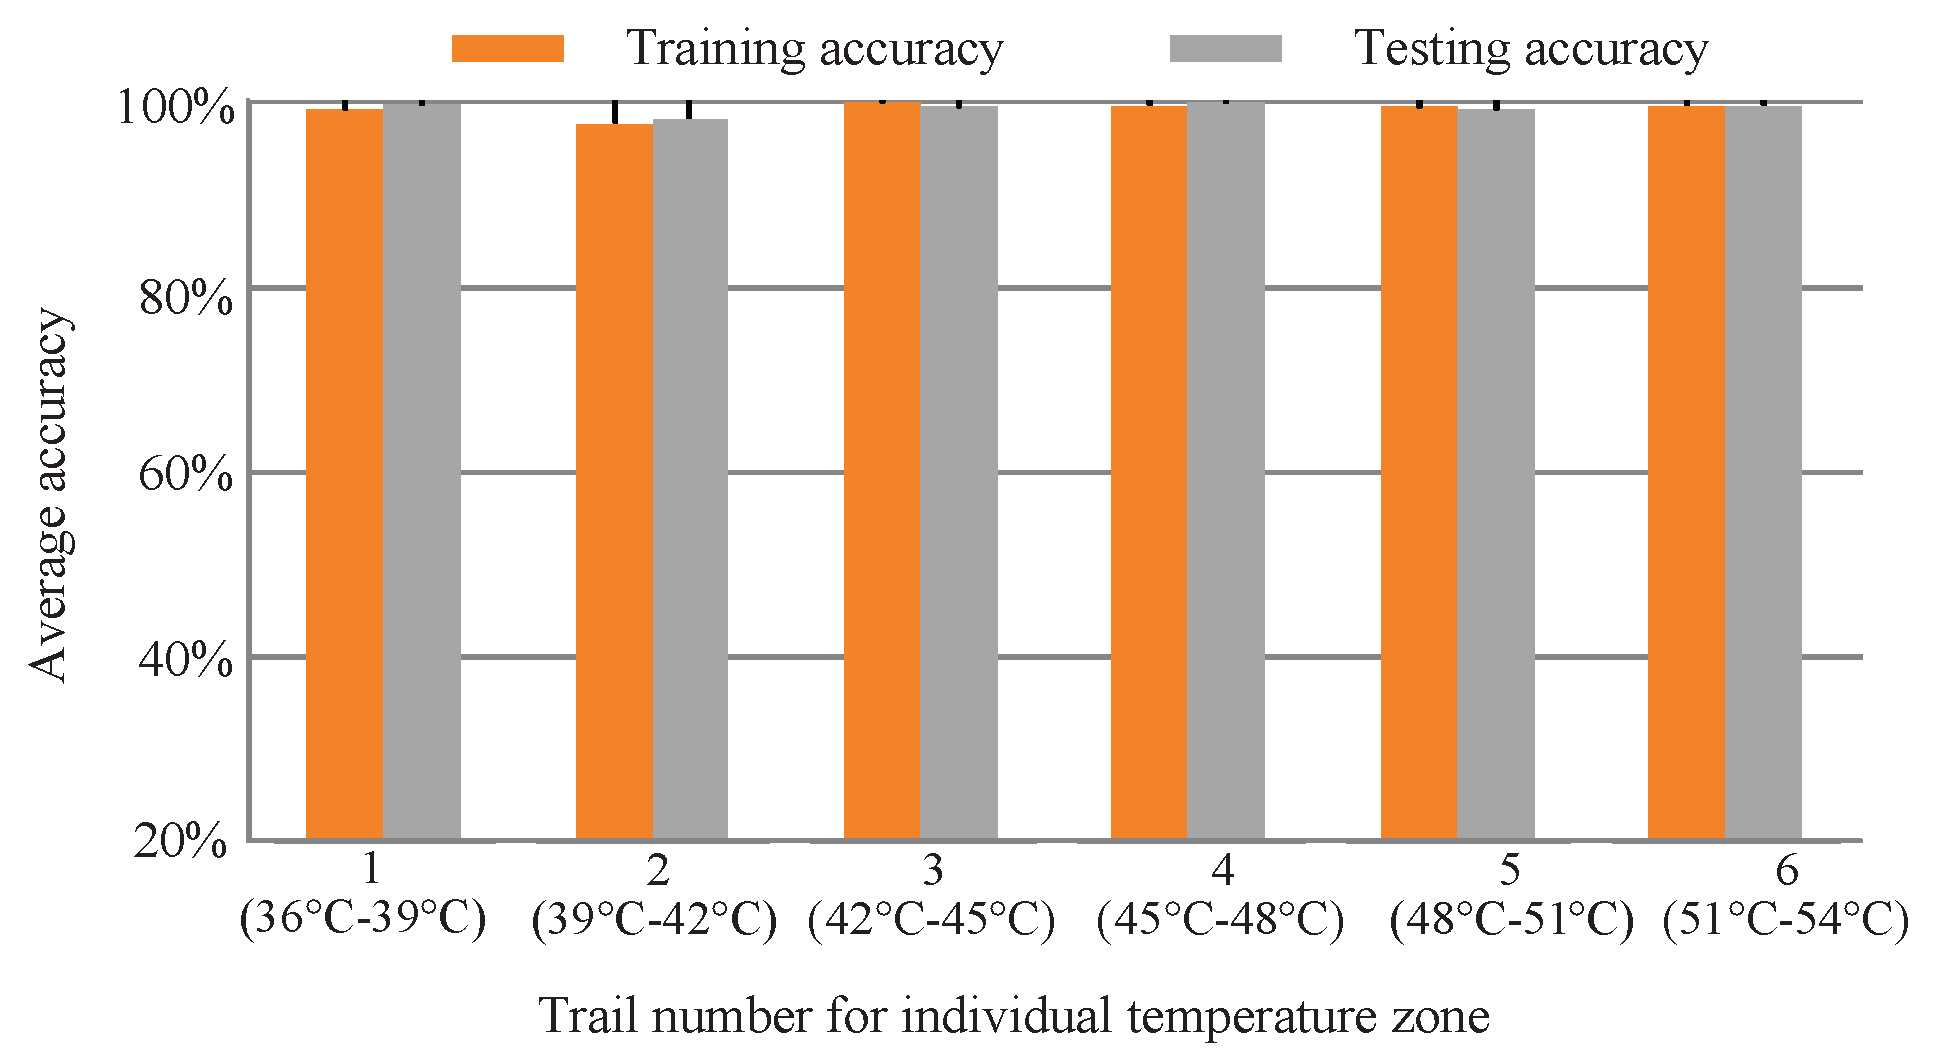
5.2.3. Evaluation with IRT Images from Specified Temperature Ranges
6. Conclusions
Author Contributions
Funding
Conflicts of Interest
References
- Liang, X.; Zuo, M.J.; Feng, Z. Dynamic modeling of gearbox faults: A review. Mech. Syst. Sig. Process. 2018, 98, 852–876. [Google Scholar] [CrossRef]
- Li, Y.; Yang, Y.; Li, G.; Xu, M.; Huang, W. A fault diagnosis scheme for planetary gearboxes using modified multi-scale symbolic dynamic entropy and mRMR feature selection. Mech. Syst. Sig. Process. 2017, 91, 295–312. [Google Scholar] [CrossRef]
- Zhou, S.; Zuo, L. Nonlinear dynamic analysis of asymmetric tristable energy harvesters for enhanced energy harvesting. Commun. Nonlinear Sci. Numer. Simul. 2018, 61, 271–284. [Google Scholar] [CrossRef]
- Li, Y.; Yang, Y.; Wang, X.; Liu, B.; Liang, X. Early fault diagnosis of rolling bearings based on hierarchical symbol dynamic entropy and binary tree support vector machine. J. Sound Vib. 2018, 428, 72–86. [Google Scholar] [CrossRef]
- Zhao, R.; Yan, R.; Chen, Z.; Mao, K.; Wang, P.; Gao, R.X. Deep learning and its applications to machine health monitoring. Mech. Syst. Sig. Process. 2019, 115, 213–237. [Google Scholar] [CrossRef]
- Feng, Z.; Chen, X.; Liang, M. Iterative generalized synchrosqueezing transform for fault diagnosis of wind turbine planetary gearbox under nonstationary conditions. Mech. Syst. Sig. Process. 2015, 52, 360–375. [Google Scholar] [CrossRef]
- Li, Y.; Wang, X.; Liu, Z.; Liang, X.; Si, S. The entropy algorithm and its variants in the fault diagnosis of rotating machinery: A review. IEEE Access 2018, 6, 66723–66741. [Google Scholar] [CrossRef]
- Santos, P.; Villa, L.; Reñones, A.; Bustillo, A.; Maudes, J. An svm-based solution for fault detection in wind turbines. Sensors 2015, 15, 5627–5648. [Google Scholar] [CrossRef]
- Naha, A.; Samanta, A.K.; Routray, A.; Deb, A.K. Low complexity motor current signature analysis using sub-nyquist strategy with reduced data length. IEEE Trans. Instrum. Meas. 2017, 66, 3249–3259. [Google Scholar] [CrossRef]
- Li, Y.; Wang, X.; Si, S.; Huang, S. Entropy based fault classification using the Case Western Reserve University data: A benchmark study. IEEE Trans. Reliab. 2019. [Google Scholar] [CrossRef]
- Li, Y.; Xu, M.; Wei, Y.; Huang, W. A new rolling bearing fault diagnosis method based on multiscale permutation entropy and improved support vector machine based binary tree. Measurement 2016, 77, 80–94. [Google Scholar] [CrossRef]
- Wang, Y.; Miao, Q.; Ma, E.W.; Tsui, K.-L.; Pecht, M.G. Online anomaly detection for hard disk drives based on mahalanobis distance. IEEE Trans. Reliab. 2013, 62, 136–145. [Google Scholar] [CrossRef]
- Elasha, F.; Greaves, M.; Mba, D.; Fang, D. A comparative study of the effectiveness of vibration and acoustic emission in diagnosing a defective bearing in a planetry gearbox. Appl. Acoust. 2017, 115, 181–195. [Google Scholar] [CrossRef]
- Sharma, R.B.; Parey, A. Modelling of acoustic emission generated due to pitting on spur gear. Eng. Fail. Anal. 2018, 86, 1–20. [Google Scholar] [CrossRef]
- Zhang, Y.; Lu, W.; Chu, F. Planet gear fault localization for wind turbine gearbox using acoustic emission signals. Renew. Energy 2017, 109, 449–460. [Google Scholar] [CrossRef]
- Shibata, K.; Takahashi, A.; Shirai, T. Fault diagnosis of rotating machinery through visualisation of sound signals. Mech. Syst. Sig. Process. 2000, 14, 229–241. [Google Scholar] [CrossRef]
- Han, C.-F.; He, H.-Q.; Wei, C.-C.; Horng, J.-H.; Chiu, Y.-L.; Hwang, Y.-C.; Lin, J.-F. Techniques developed for fault diagnosis of long-range running ball screw drive machine to evaluate lubrication condition. Measurement 2018, 126, 274–288. [Google Scholar] [CrossRef]
- Zhao, M.; Lin, J. Health assessment of rotating machinery using a rotary encoder. IEEE Trans. Ind. Electron. 2018, 65, 2548–2556. [Google Scholar] [CrossRef]
- Ciabattoni, L.; Ferracuti, F.; Freddi, A.; Monteriu, A. Statistical spectral analysis for fault diagnosis of rotating machines. IEEE Trans. Ind. Electron. 2018, 65, 4301–4310. [Google Scholar] [CrossRef]
- Samuel, P.D.; Pines, D.J. A review of vibration-based techniques for helicopter transmission diagnostics. J. Sound Vib. 2005, 282, 475–508. [Google Scholar] [CrossRef]
- Dalvand, F.; Dalvand, S.; Sharafi, F.; Pecht, M. Current noise cancellation for bearing fault diagnosis using time shifting. IEEE Trans. Ind. Electron. 2017, 64, 8138–8147. [Google Scholar] [CrossRef]
- Glowacz, A.; Glowacz, Z. Diagnosis of the three-phase induction motor using thermal imaging. Infrared Phys. Technol. 2017, 81, 7–16. [Google Scholar] [CrossRef]
- Ciampa, F.; Mahmoodi, P.; Pinto, F.; Meo, M. Recent advances in active infrared thermography for non-destructive testing of aerospace components. Sensors 2018, 18, 609. [Google Scholar] [CrossRef]
- Laborda, A.; Robinson, A.; Wang, S.; Zhang, Y.; Reed, P. Fatigue assessment of multilayer coatings using lock-in thermography. Mater. Des. 2018, 141, 361–373. [Google Scholar] [CrossRef]
- Grammatikos, S.A.; Kordatos, E.Z.; Matikas, T.E.; Paipetis, A.S. On the fatigue response of a bonded repaired aerospace composite using thermography. Compos. Struct. 2018, 188, 461–469. [Google Scholar] [CrossRef]
- Lim, G.-M.; Bae, D.-M.; Kim, J.-H. Fault diagnosis of rotating machine by thermography method on support vector machine. J. Mech. Sci. Technol. 2014, 28, 2947–2952. [Google Scholar] [CrossRef]
- Younus, A.M.; Yang, B.-S. Intelligent fault diagnosis of rotating machinery using infrared thermal image. Expert Syst. Appl. 2012, 39, 2082–2091. [Google Scholar] [CrossRef]
- Janssens, O.; Schulz, R.; Slavkovikj, V.; Stockman, K.; Loccufier, M.; Van de Walle, R.; Van Hoecke, S. Thermal image based fault diagnosis for rotating machinery. Infrared Phys. Technol. 2015, 73, 78–87. [Google Scholar] [CrossRef]
- Janssens, O.; Loccufier, M.; Van de Walle, R.; Van Hoecke, S. Data-driven imbalance and hard particle detection in rotating machinery using infrared thermal imaging. Infrared Phys. Technol. 2017, 82, 28–39. [Google Scholar] [CrossRef]
- Bagavathiappan, S.; Lahiri, B.; Saravanan, T.; Philip, J.; Jayakumar, T. Infrared thermography for condition monitoring—A review. Infrared Phys. Technol. 2013, 60, 35–55. [Google Scholar] [CrossRef]
- Mao, W.; Feng, W.; Liang, X. A novel deep output kernel learning method for bearing fault structural diagnosis. Mech. Syst. Signal Process. 2019, 117, 293–318. [Google Scholar] [CrossRef]
- Wen, L.; Li, X.; Gao, L.; Zhang, Y. A new convolutional neural network-based data-driven fault diagnosis method. IEEE Trans. Ind. Electron. 2018, 65, 5990–5998. [Google Scholar] [CrossRef]
- Cheng, G.; Han, J.; Lu, X. Remote sensing image scene classification: Benchmark and state of the art. Proc. IEEE 2017, 105, 1865–1883. [Google Scholar] [CrossRef]
- Sun, Y.; Wen, G. Ensemble softmax regression model for speech emotion recognition. Multimed. Tools Appl. 2017, 76, 8305–8328. [Google Scholar] [CrossRef]
- Chen, L.; Zhou, M.; Su, W.; Wu, M.; She, J.; Hirota, K. Softmax regression based deep sparse autoencoder network for facial emotion recognition in human-robot interaction. Inf. Sci. 2018, 428, 49–61. [Google Scholar] [CrossRef]
- Jiang, M.; Liang, Y.; Feng, X.; Fan, X.; Pei, Z.; Xue, Y.; Guan, R. Text classification based on deep belief network and softmax regression. Neural Comput. Appl. 2018, 29, 61–70. [Google Scholar] [CrossRef]
- Behley, J.; Steinhage, V.; Cremers, A.B. Laser-based segment classification using a mixture of bag-of-words. In Proceedings of the 2013 IEEE/RSJ International Conference on Intelligent Robots and Systems, Tokyo, Japan, 3–7 November 2013; pp. 4195–4200. [Google Scholar]
- Lei, Y.; Jia, F.; Lin, J.; Xing, S.; Ding, S.X. An intelligent fault diagnosis method using unsupervised feature learning towards mechanical big data. IEEE Trans. Ind. Electron. 2016, 63, 3137–3147. [Google Scholar] [CrossRef]
- Bielza, C.; Robles, V.; Larrañaga, P. Regularized logistic regression without a penalty term: An application to cancer classification with microarray data. Expert Syst. Appl. 2011, 38, 5110–5118. [Google Scholar] [CrossRef]
- Schulz, R.; Verstockt, S.; Vermeiren, J.; Loccufier, M.; Stockman, K.; Van Hoecke, S. Thermal imaging for monitoring rolling element bearings. In Proceedings of the 12th International conference on Quantitative InfraRed Thermography (QIRT 2014), Leuven, Belgium, 10 November 2015. [Google Scholar]


| Configuration Parameters | Values |
|---|---|
| Producer of thermal camera | Hawk, China |
| Image resolution | 384 × 288 |
| Frame rate | 25 fps |
| Temperature measurement range | −25 °C 260 °C |
| Environmental temperature | 18.9 °C |
| Thermal sensitivity | 0.05 °C |
| Palette | rainbow |
| Contrast | 50 |
| Brightness | 50 |
| Gain | 2 |
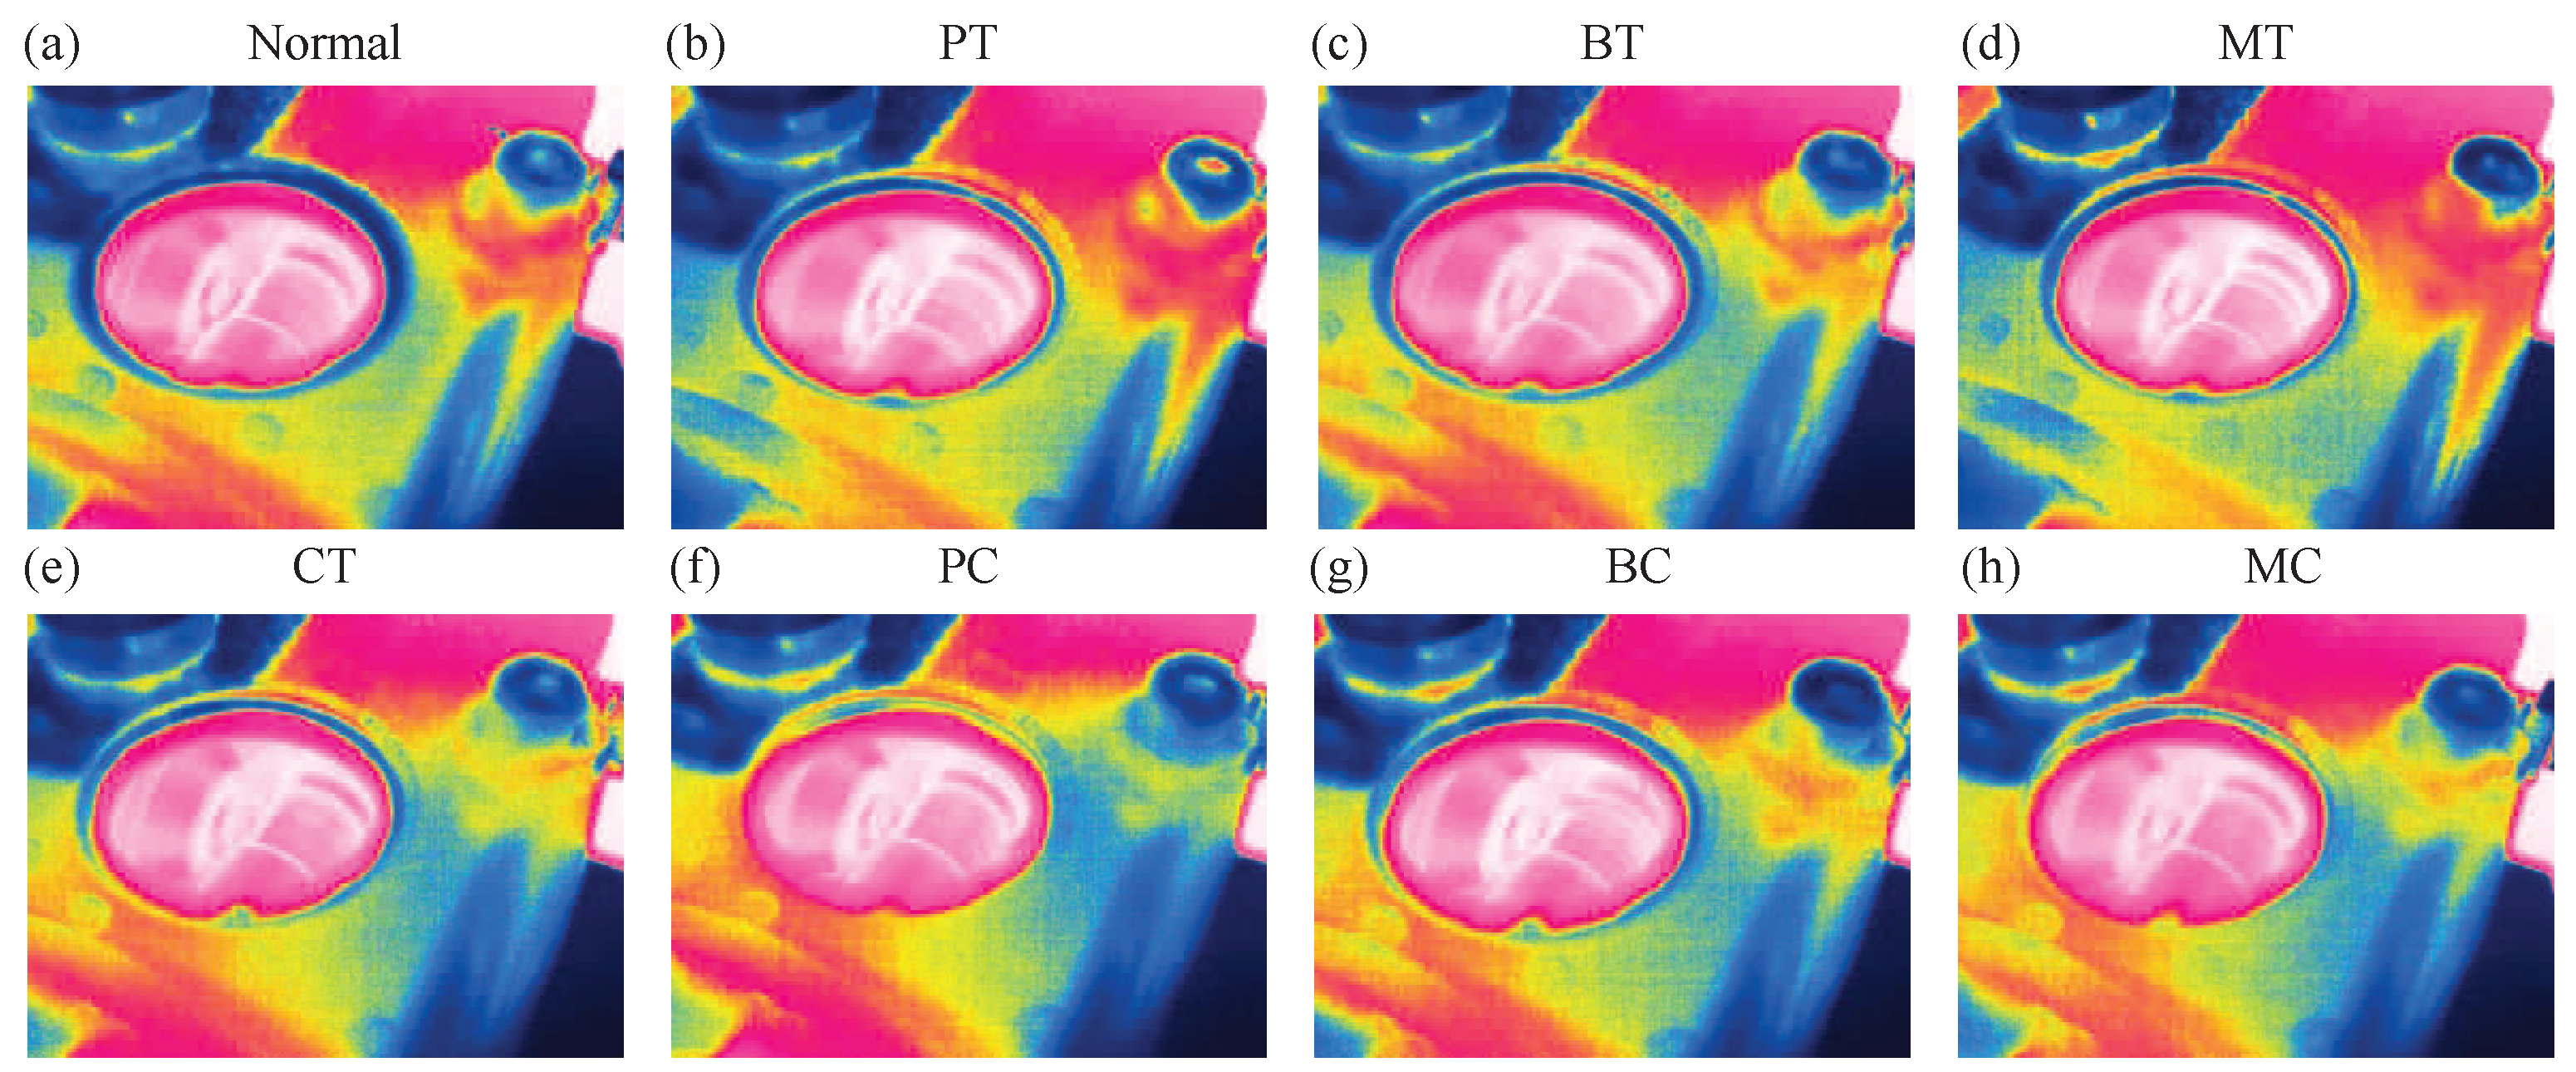
| Fault Types | Class Label | Number of Training Data | Number of Resting Data |
|---|---|---|---|
| PT | 1 | 35 | 65 |
| BT | 2 | 35 | 65 |
| CT | 3 | 35 | 65 |
| PC | 4 | 35 | 65 |
| MC | 5 | 35 | 65 |
| BC | 6 | 35 | 65 |
| Normal | 7 | 35 | 65 |
| MT | 8 | 35 | 65 |
| Layer Type | Number of Filter | Size of Feature Map | Size of Kernel | Number of Stride | Number of Padding |
|---|---|---|---|---|---|
| Image input layer | - | 100 × 100 × 3 | - | - | - |
| CL1 (Convolution layer-1) | 32 | 100 × 100 × 32 | 5 × 5 | 1 × 1 | 2 × 2 |
| M1 (Max-Pooling layer-1) | 1 | 50 × 50 × 32 | 2 × 2 | 2 × 2 | 0 × 0 |
| CL2 (Convolution layer-2) | 64 | 50 × 50 × 64 | 5 × 5 | 1 × 1 | 2 × 2 |
| M2 (Max-Pooling layer-2) | 1 | 25 × 25 × 64 | 2 × 2 | 2 × 2 | 0 × 0 |
| CL3 (Convolution layer-3) | 128 | 25 × 25 × 128 | 3 × 3 | 1 × 1 | 1 × 1 |
| M3 (Max-Pooling layer-3) | 1 | 12 × 12 × 128 | 2 × 2 | 2 × 2 | 0 × 0 |
| CL4 (Convolution layer-4) | 128 | 12 × 12 × 128 | 3 × 3 | 1 × 1 | 1 × 1 |
| M4 (Max-Pooling layer-4) | 1 | 6 × 6 × 128 | 2 × 2 | 2 × 2 | 0 × 0 |
| F1 (Full connection layer-1) | - | 1024 × 1 | - | - | - |
| F2 (Full connection layer-2) | - | 512 × 1 | - | - | - |
| Output layer | - | 8 × 1 | - | - | - |
| Data Source | Average Testing Accuracy | Standard Deviation | CPU Time (s) |
|---|---|---|---|
| Vibration signals | 71.53% (372/520) | 0.5591 | 470 |
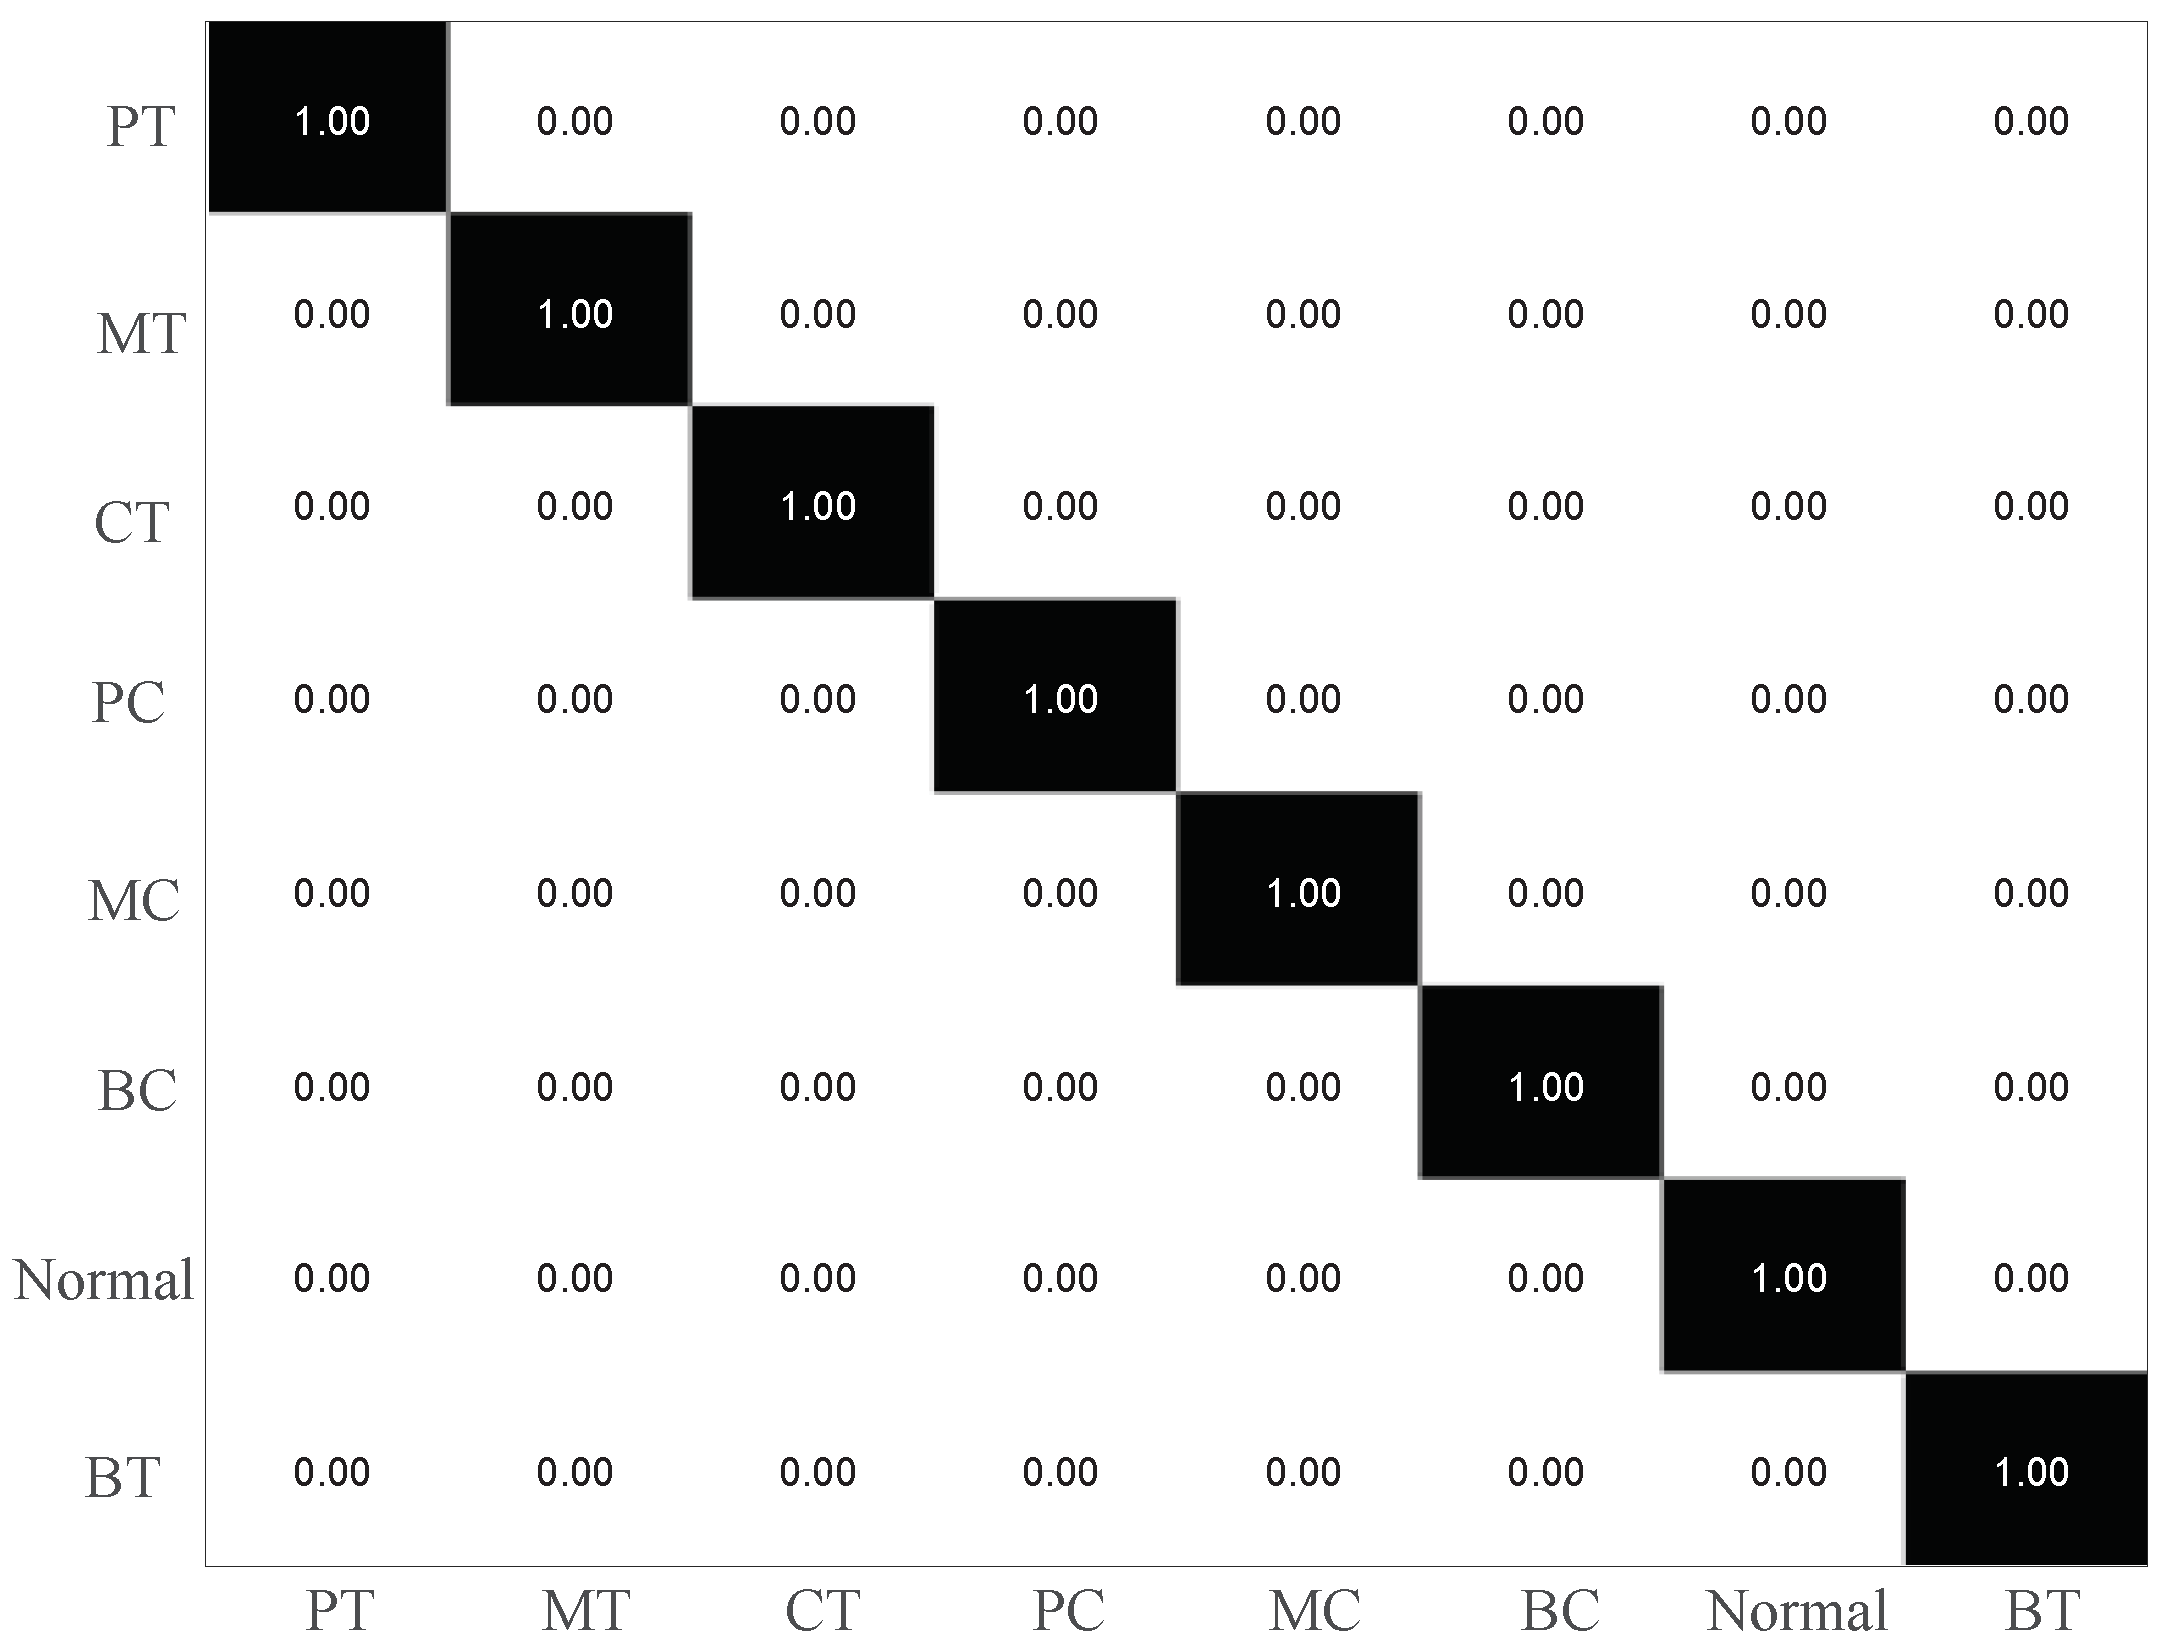
| IRT images | 100% (520/520) | 0.00 | 542 |
| Temperature Ranges | Average Testing Accuracy | Standard Deviation |
|---|---|---|
| 3 °C range | 95.97% (2994/3120) | 1.0105 |
| 19 °C range | 95.53% (2980/3120) | 0.912 |
© 2019 by the authors. Licensee MDPI, Basel, Switzerland. This article is an open access article distributed under the terms and conditions of the Creative Commons Attribution (CC BY) license (http://creativecommons.org/licenses/by/4.0/).
Share and Cite
Li, Y.; Gu, J.X.; Zhen, D.; Xu, M.; Ball, A. An Evaluation of Gearbox Condition Monitoring Using Infrared Thermal Images Applied with Convolutional Neural Networks. Sensors 2019, 19, 2205. https://doi.org/10.3390/s19092205
Li Y, Gu JX, Zhen D, Xu M, Ball A. An Evaluation of Gearbox Condition Monitoring Using Infrared Thermal Images Applied with Convolutional Neural Networks. Sensors. 2019; 19(9):2205. https://doi.org/10.3390/s19092205
Chicago/Turabian StyleLi, Yongbo, James Xi Gu, Dong Zhen, Minqiang Xu, and Andrew Ball. 2019. "An Evaluation of Gearbox Condition Monitoring Using Infrared Thermal Images Applied with Convolutional Neural Networks" Sensors 19, no. 9: 2205. https://doi.org/10.3390/s19092205
APA StyleLi, Y., Gu, J. X., Zhen, D., Xu, M., & Ball, A. (2019). An Evaluation of Gearbox Condition Monitoring Using Infrared Thermal Images Applied with Convolutional Neural Networks. Sensors, 19(9), 2205. https://doi.org/10.3390/s19092205