Improved Sensitivity of α-Fe2O3 Nanoparticle-Decorated ZnO Nanowire Gas Sensor for CO

 ,
,
Abstract
:1. Introduction
2. Materials and Methods
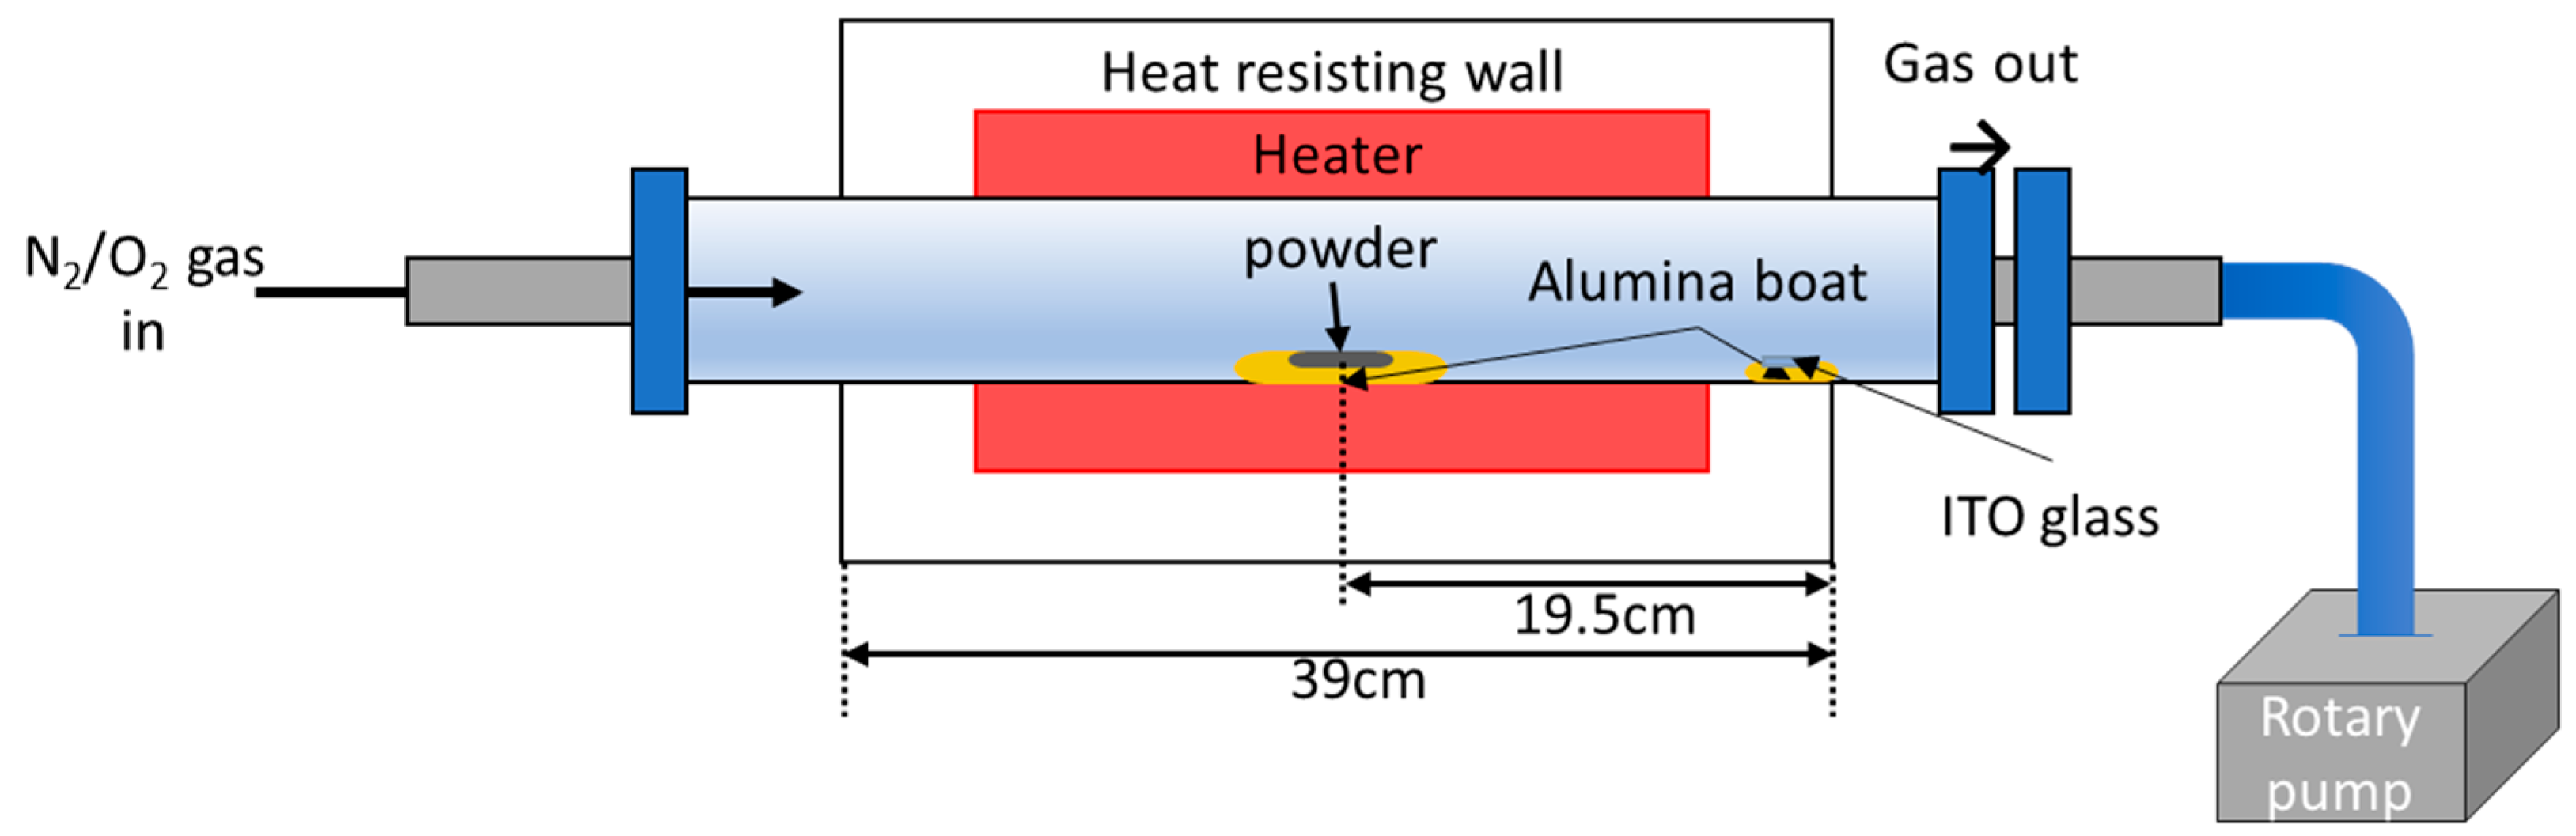
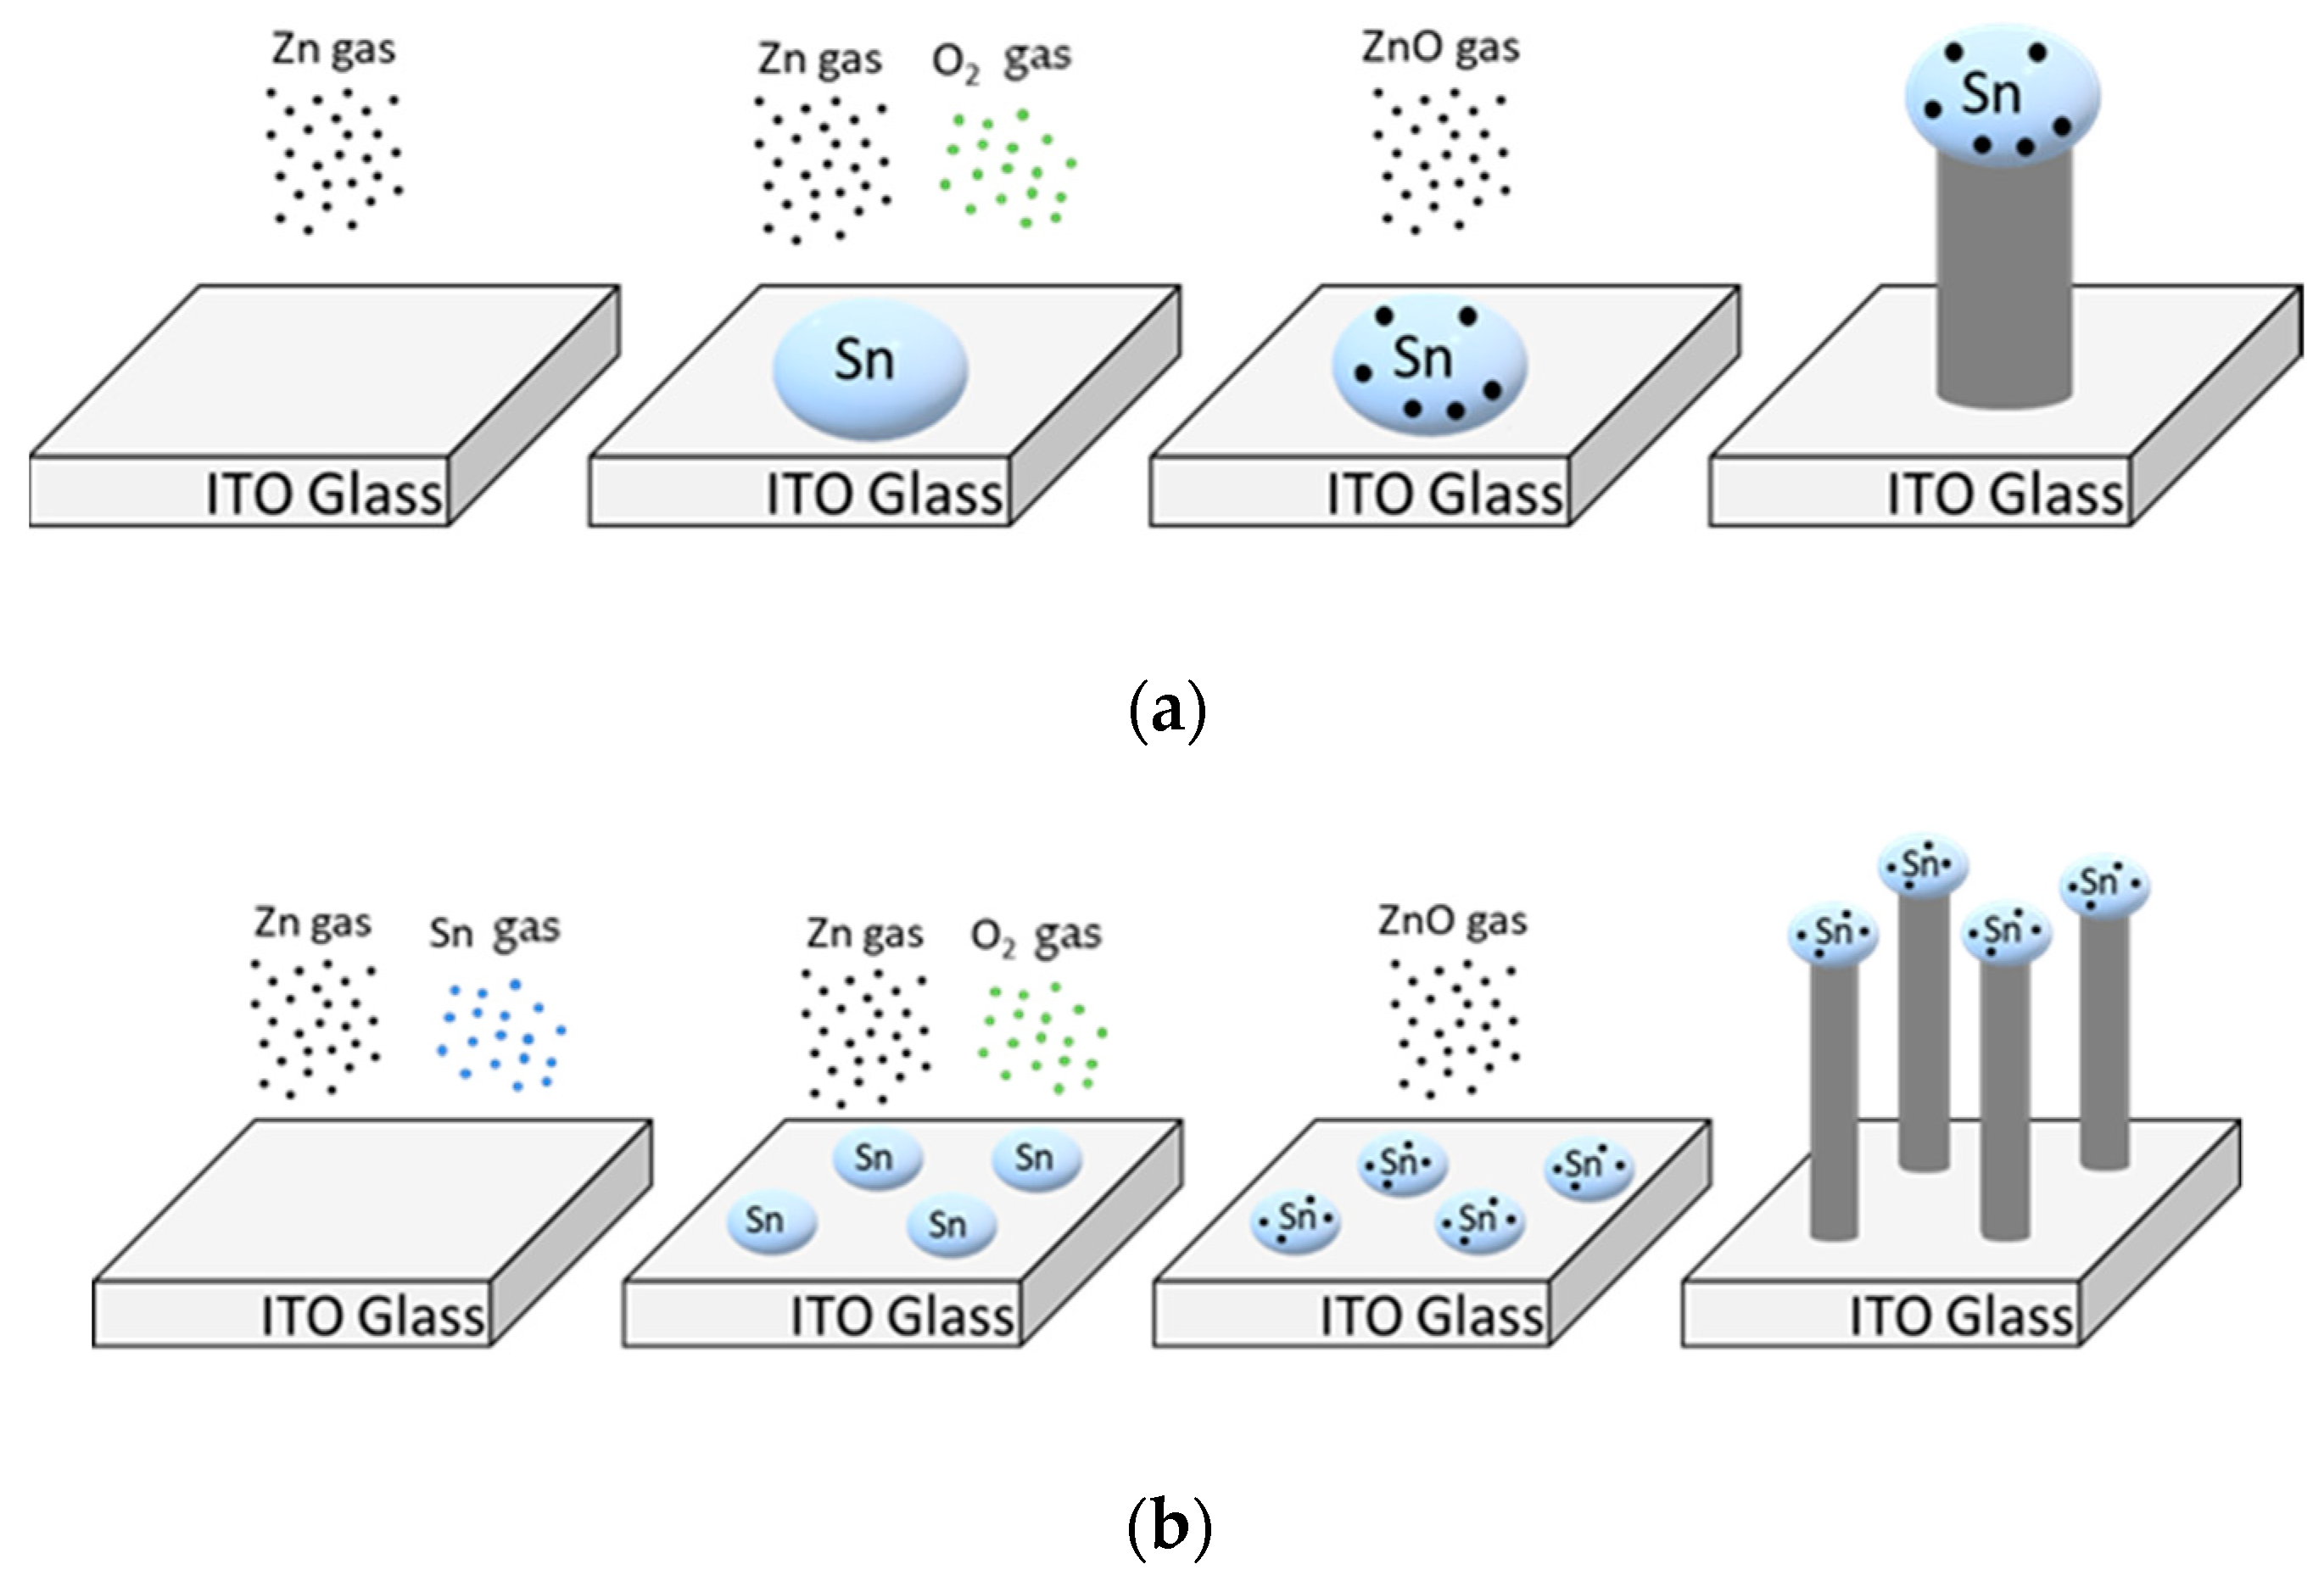
2.1. Growth of ZnO Nanostructures
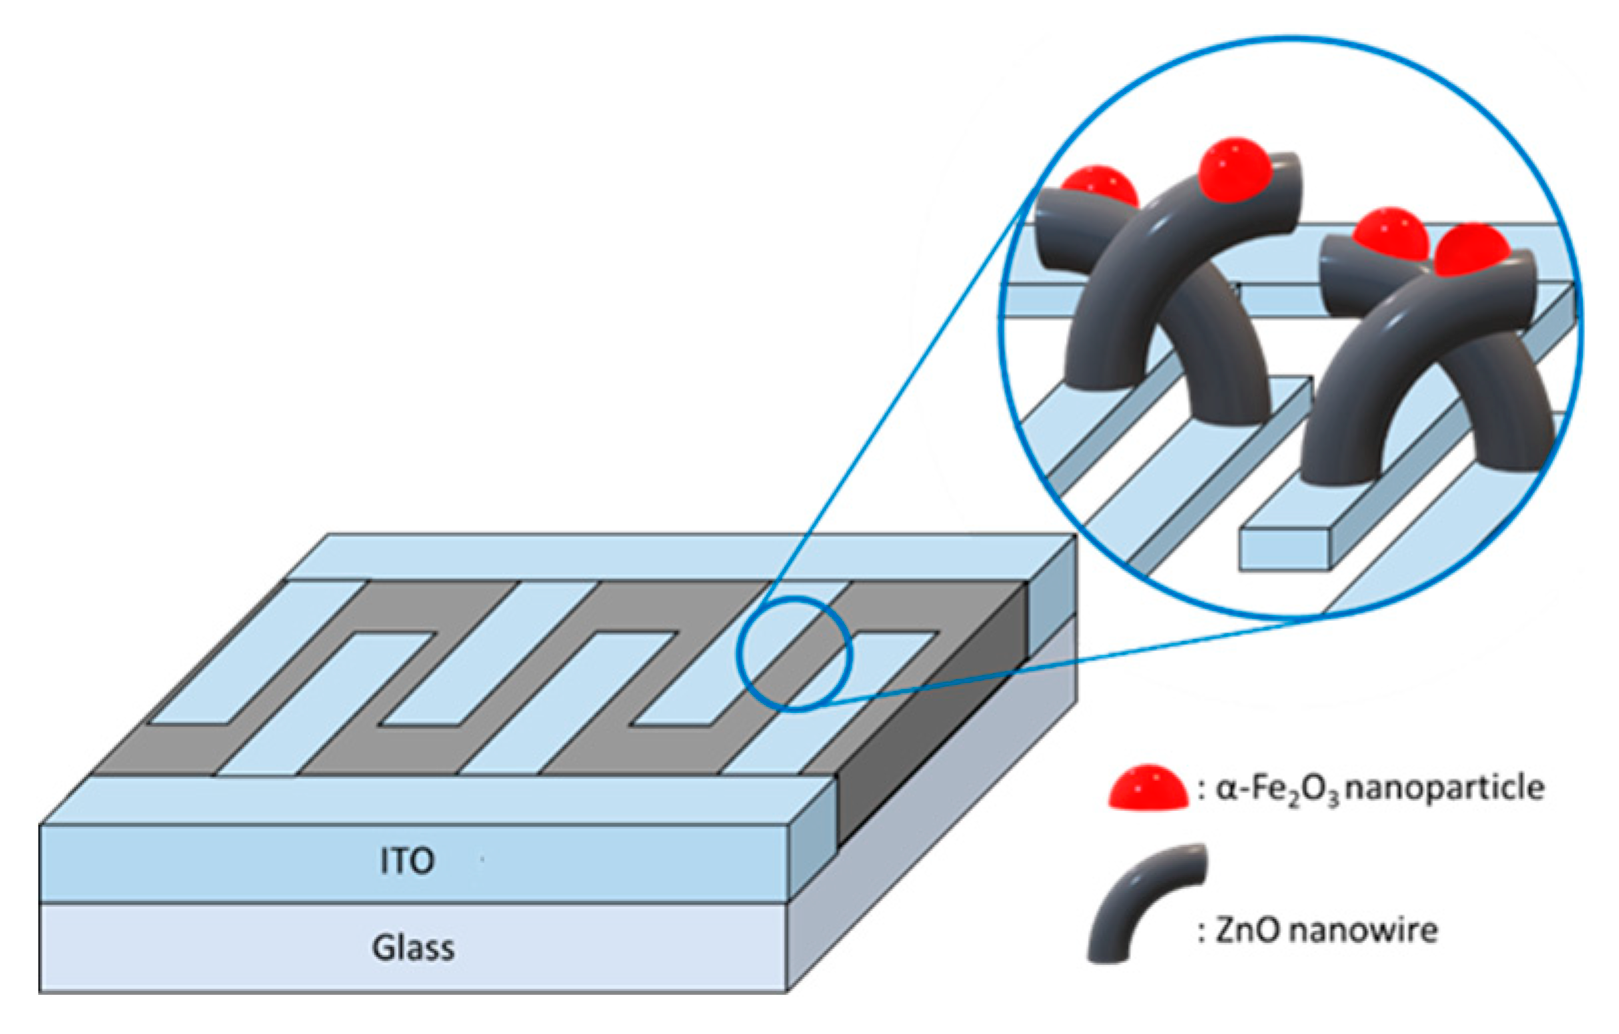
2.2. Synthesis of α-Fe2O3/ZnO Heterojunction
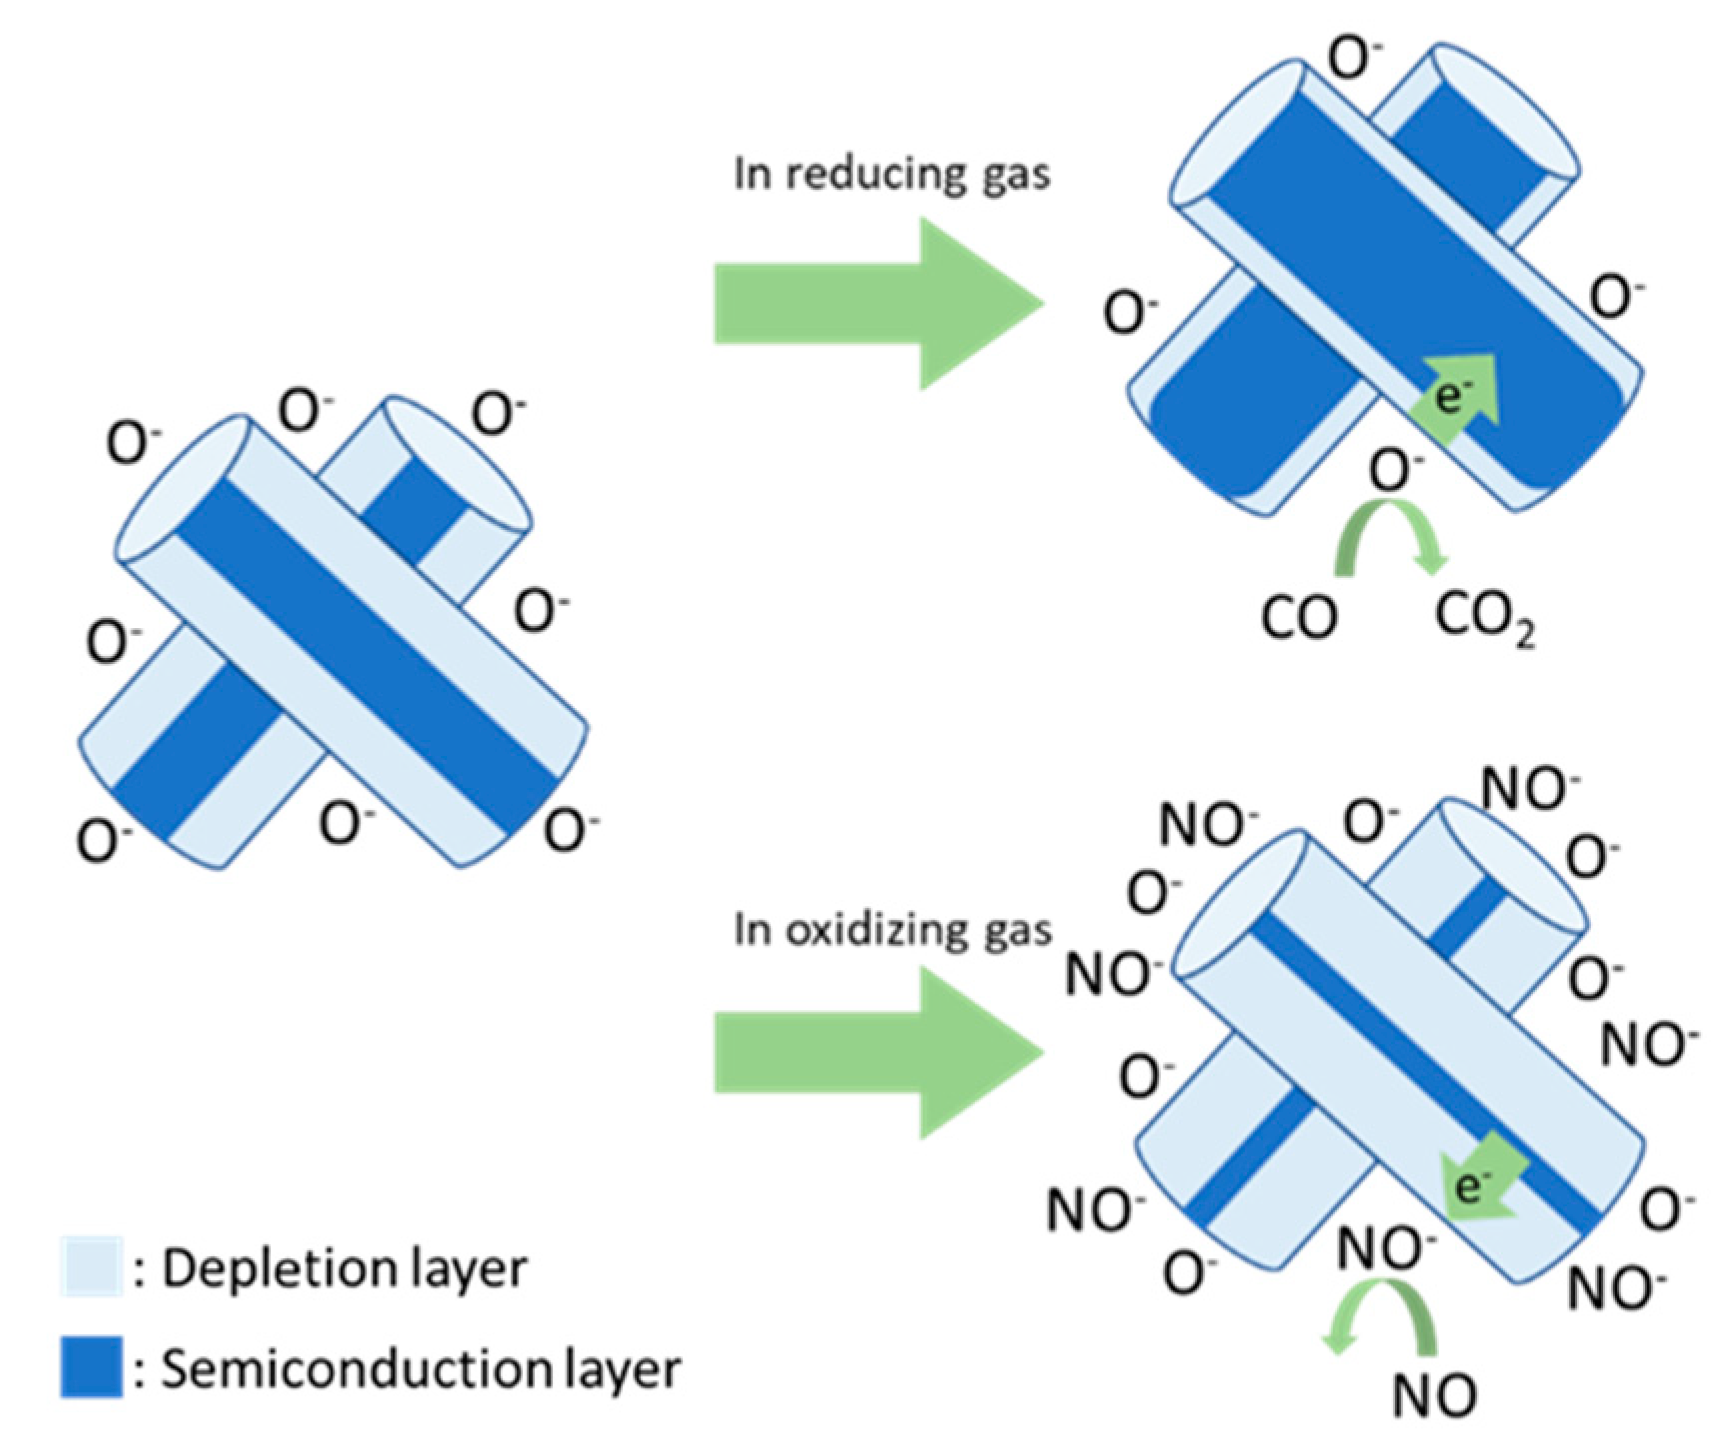
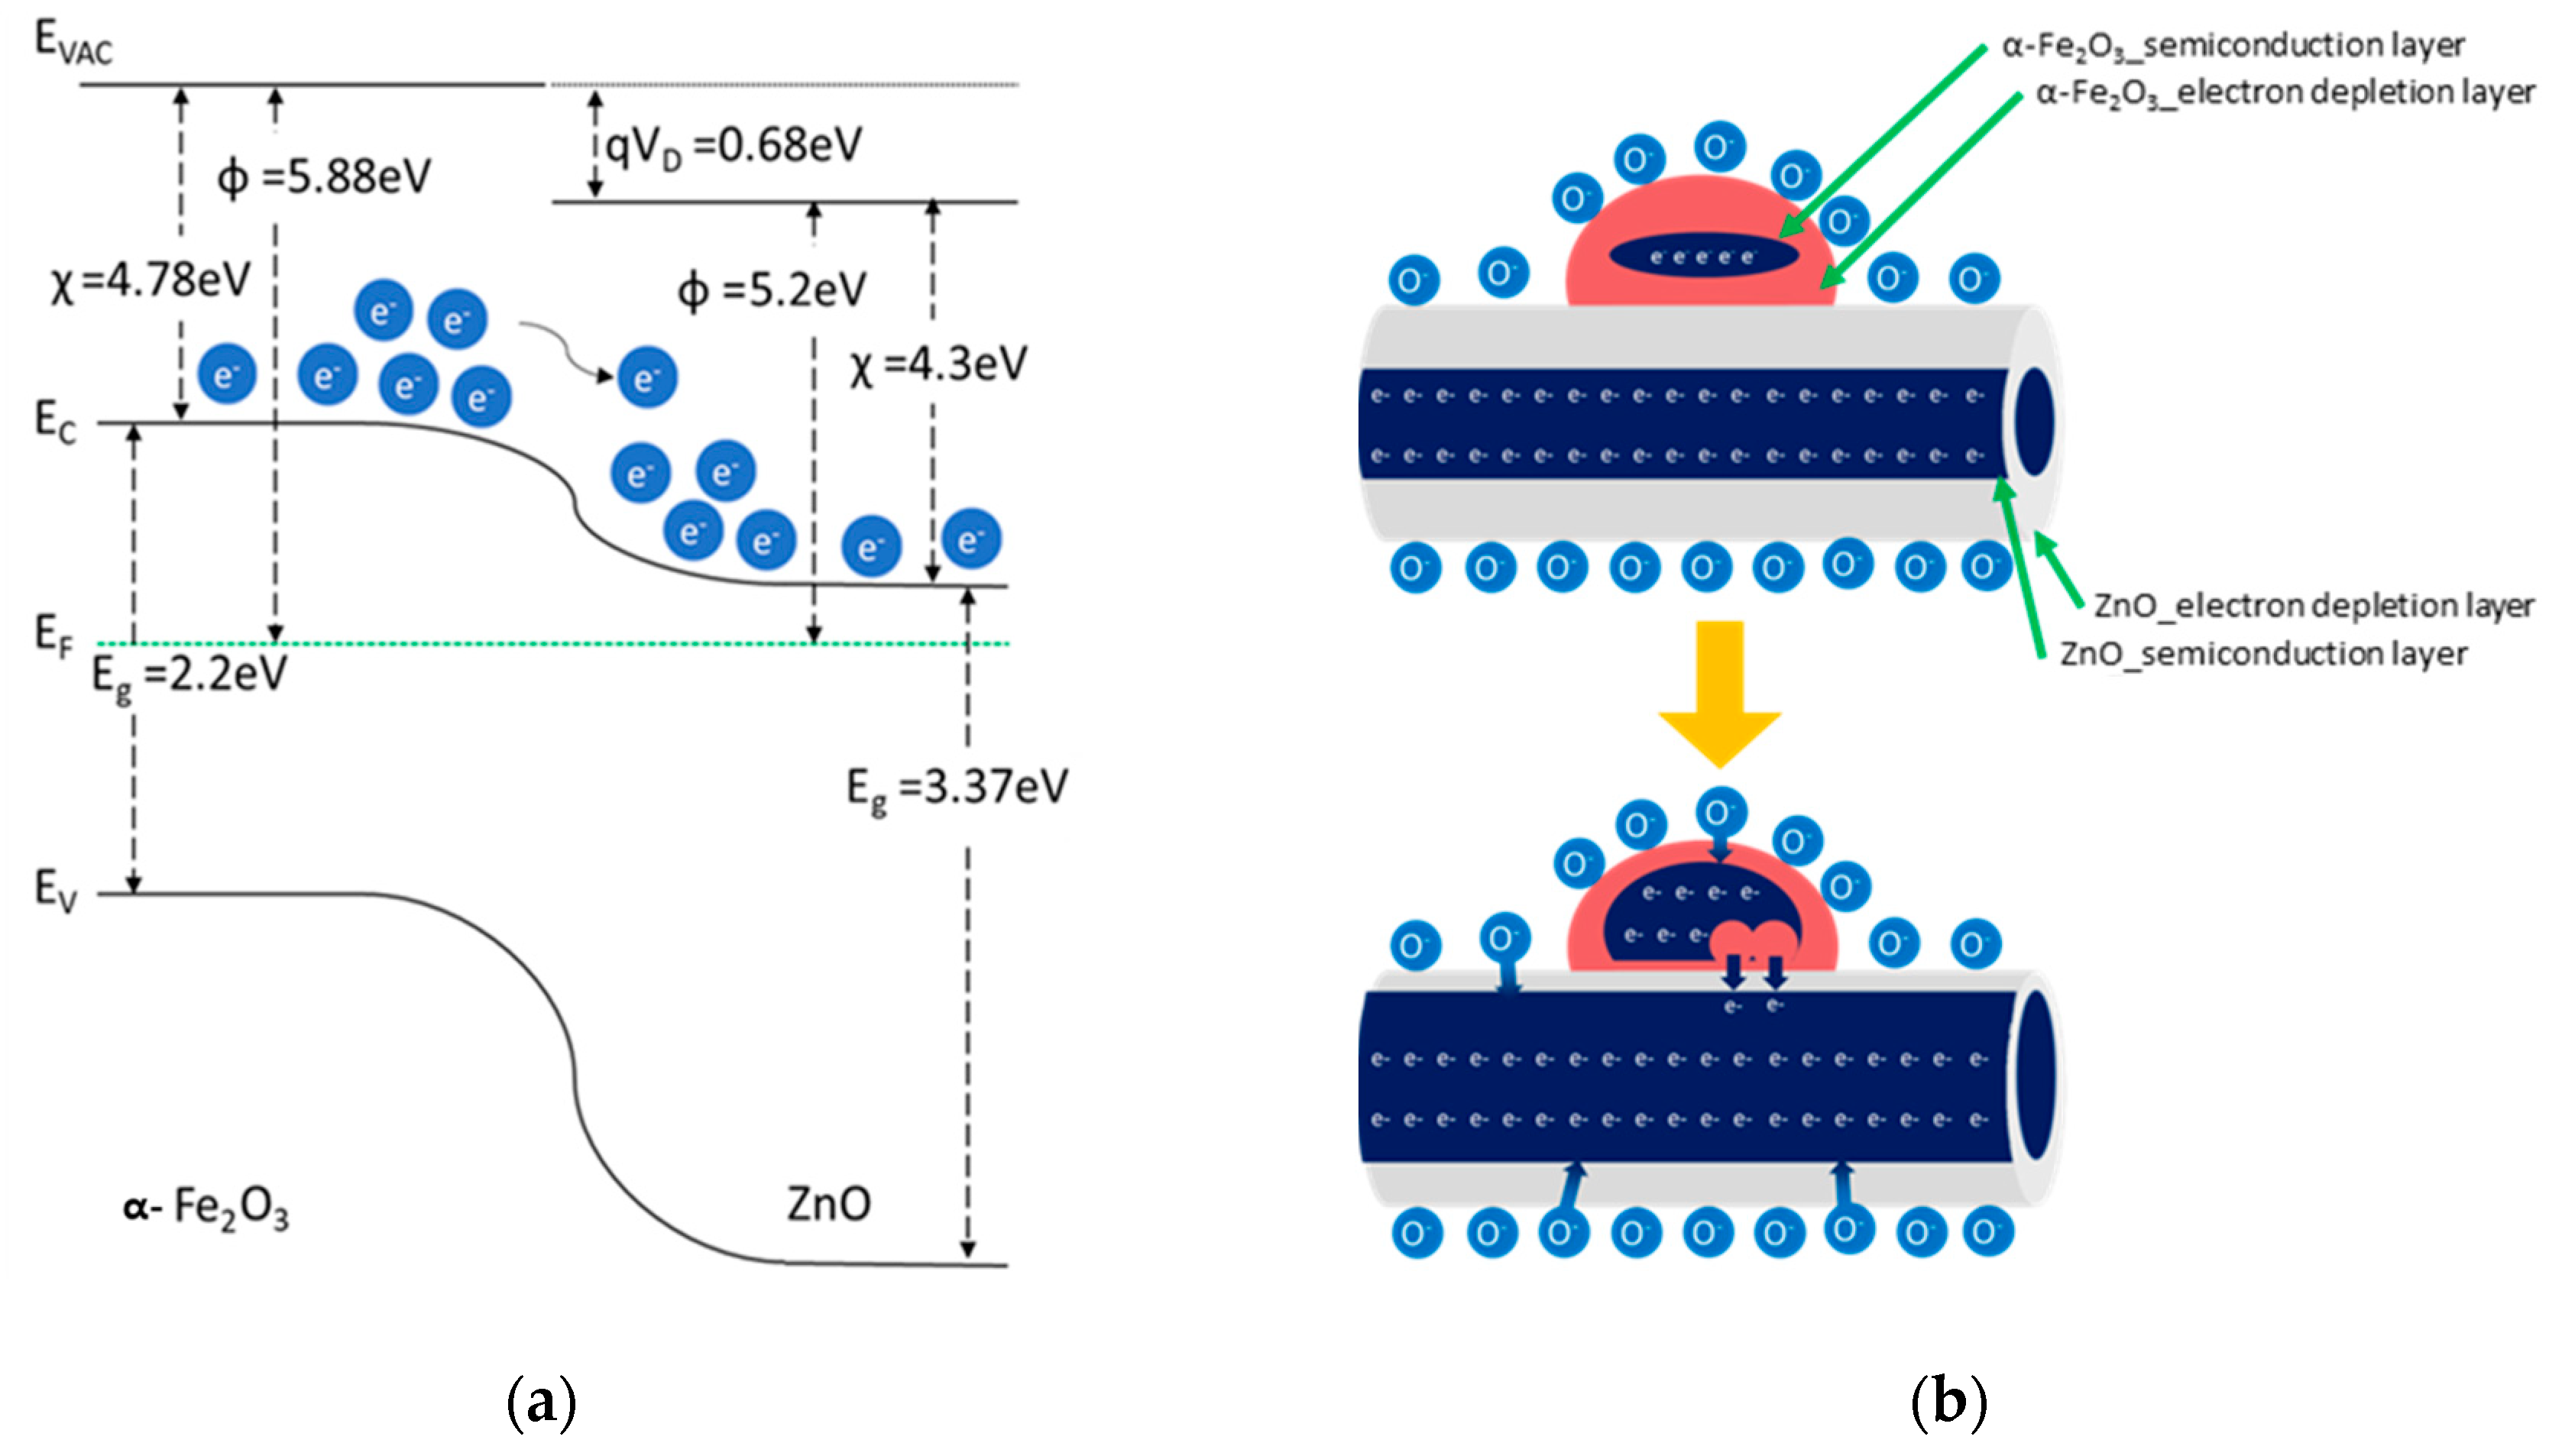
2.3. Effect of α-Fe2O3/ZnO Heterojunction for Gas Sensing Mechanism
3. Results and Discussion
3.1. Materials Analysis
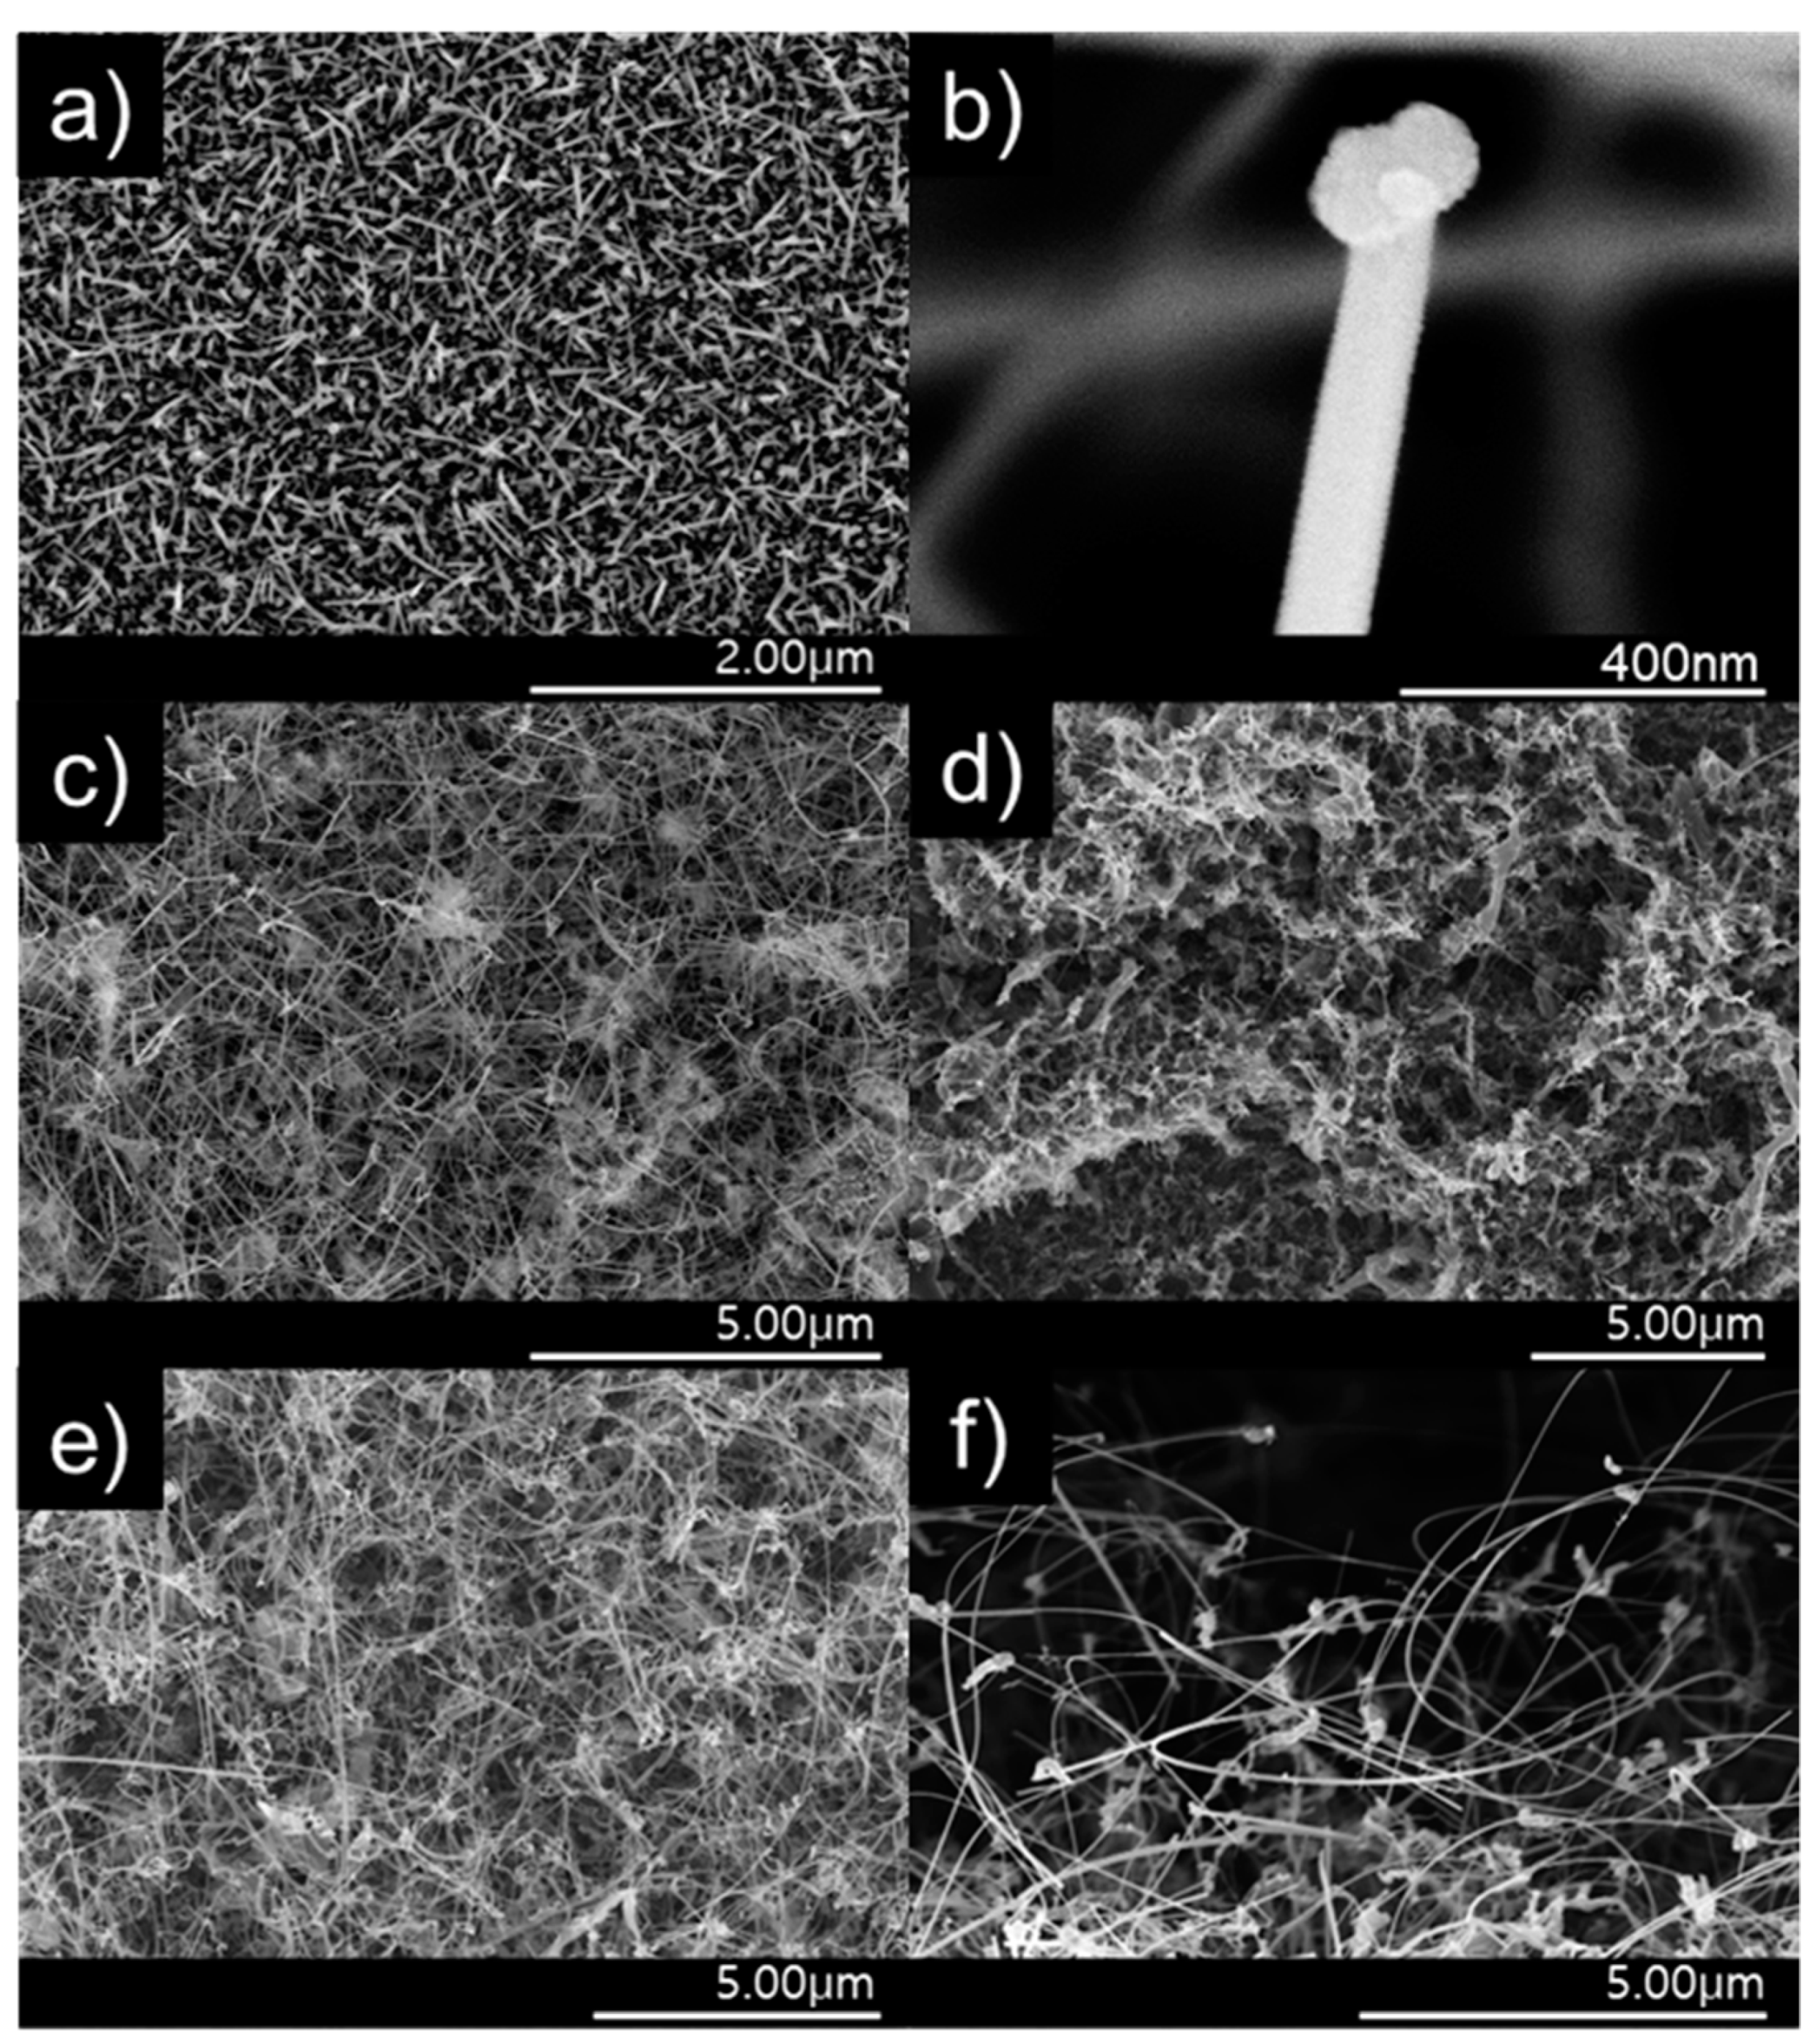
3.1.1. SEM Analysis
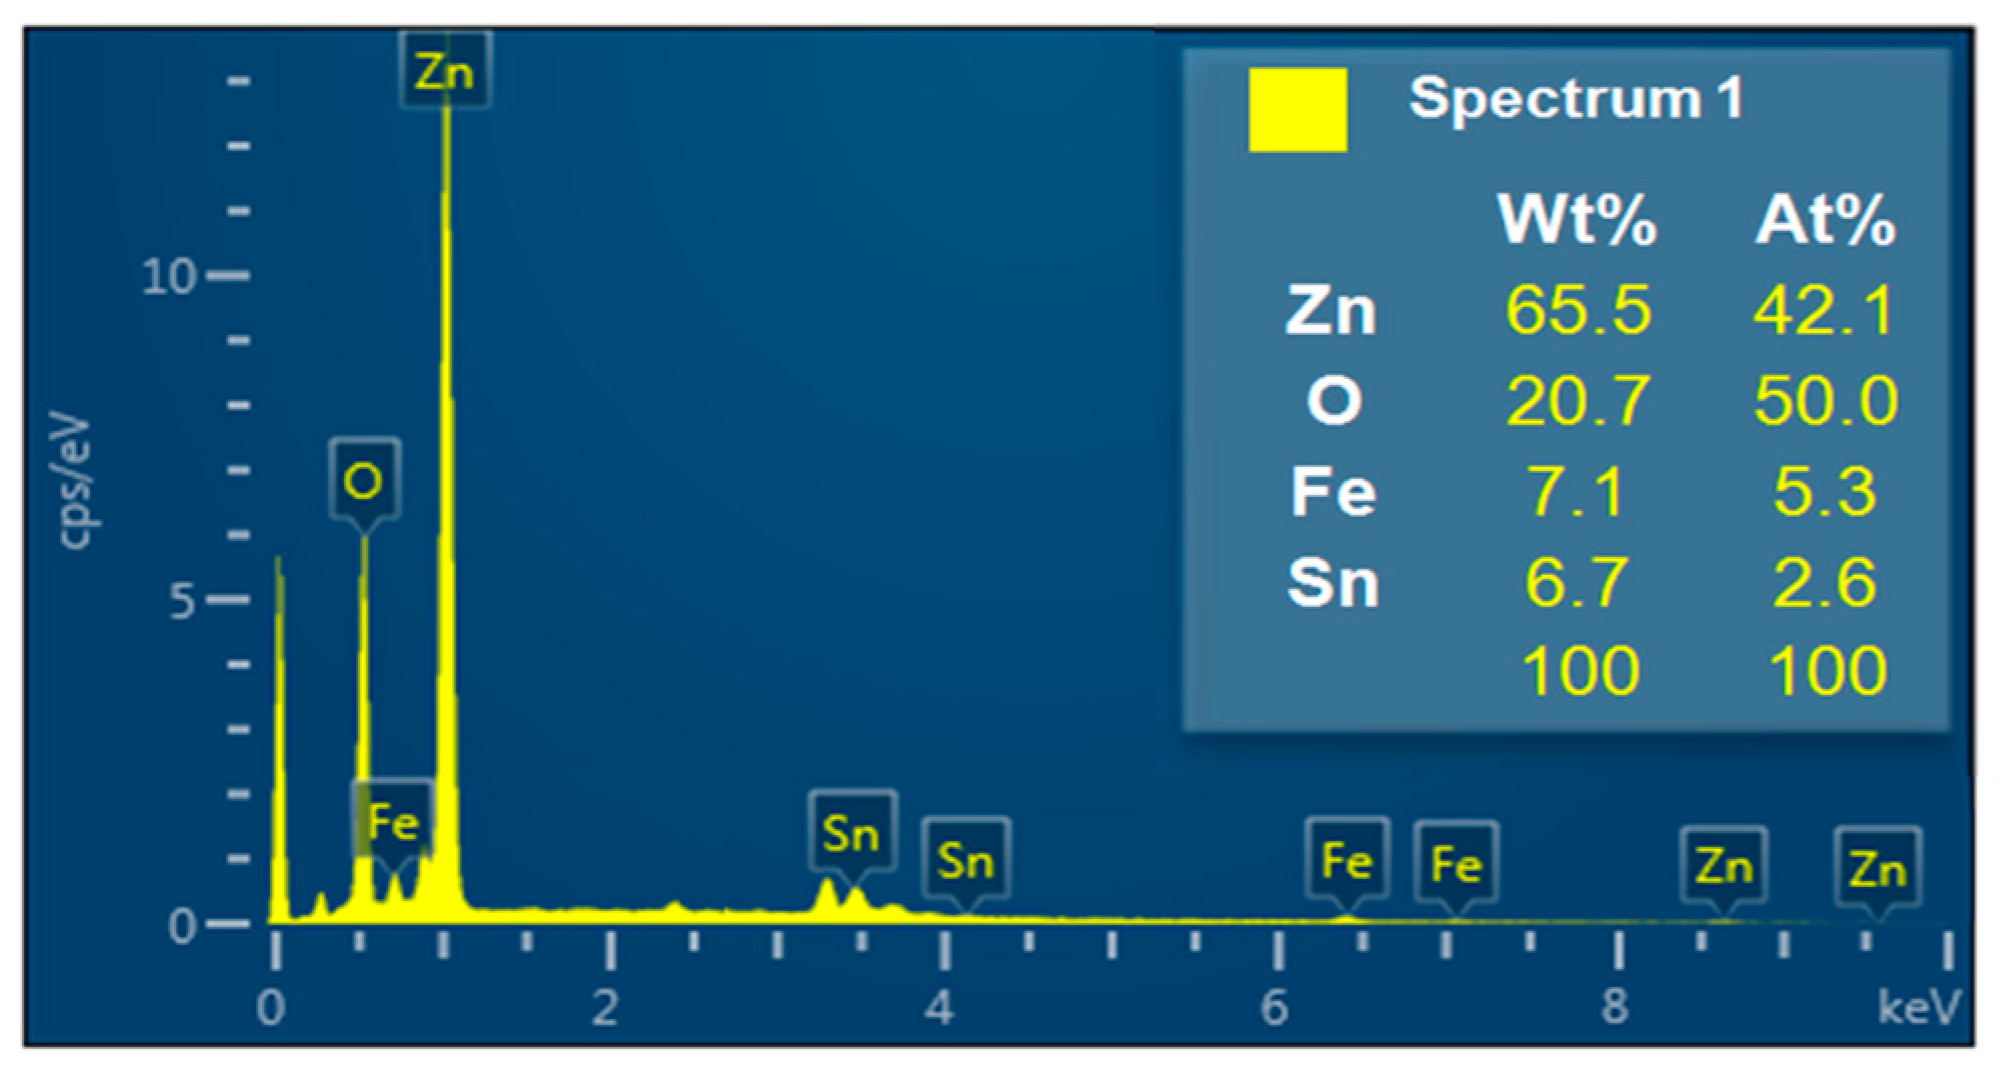
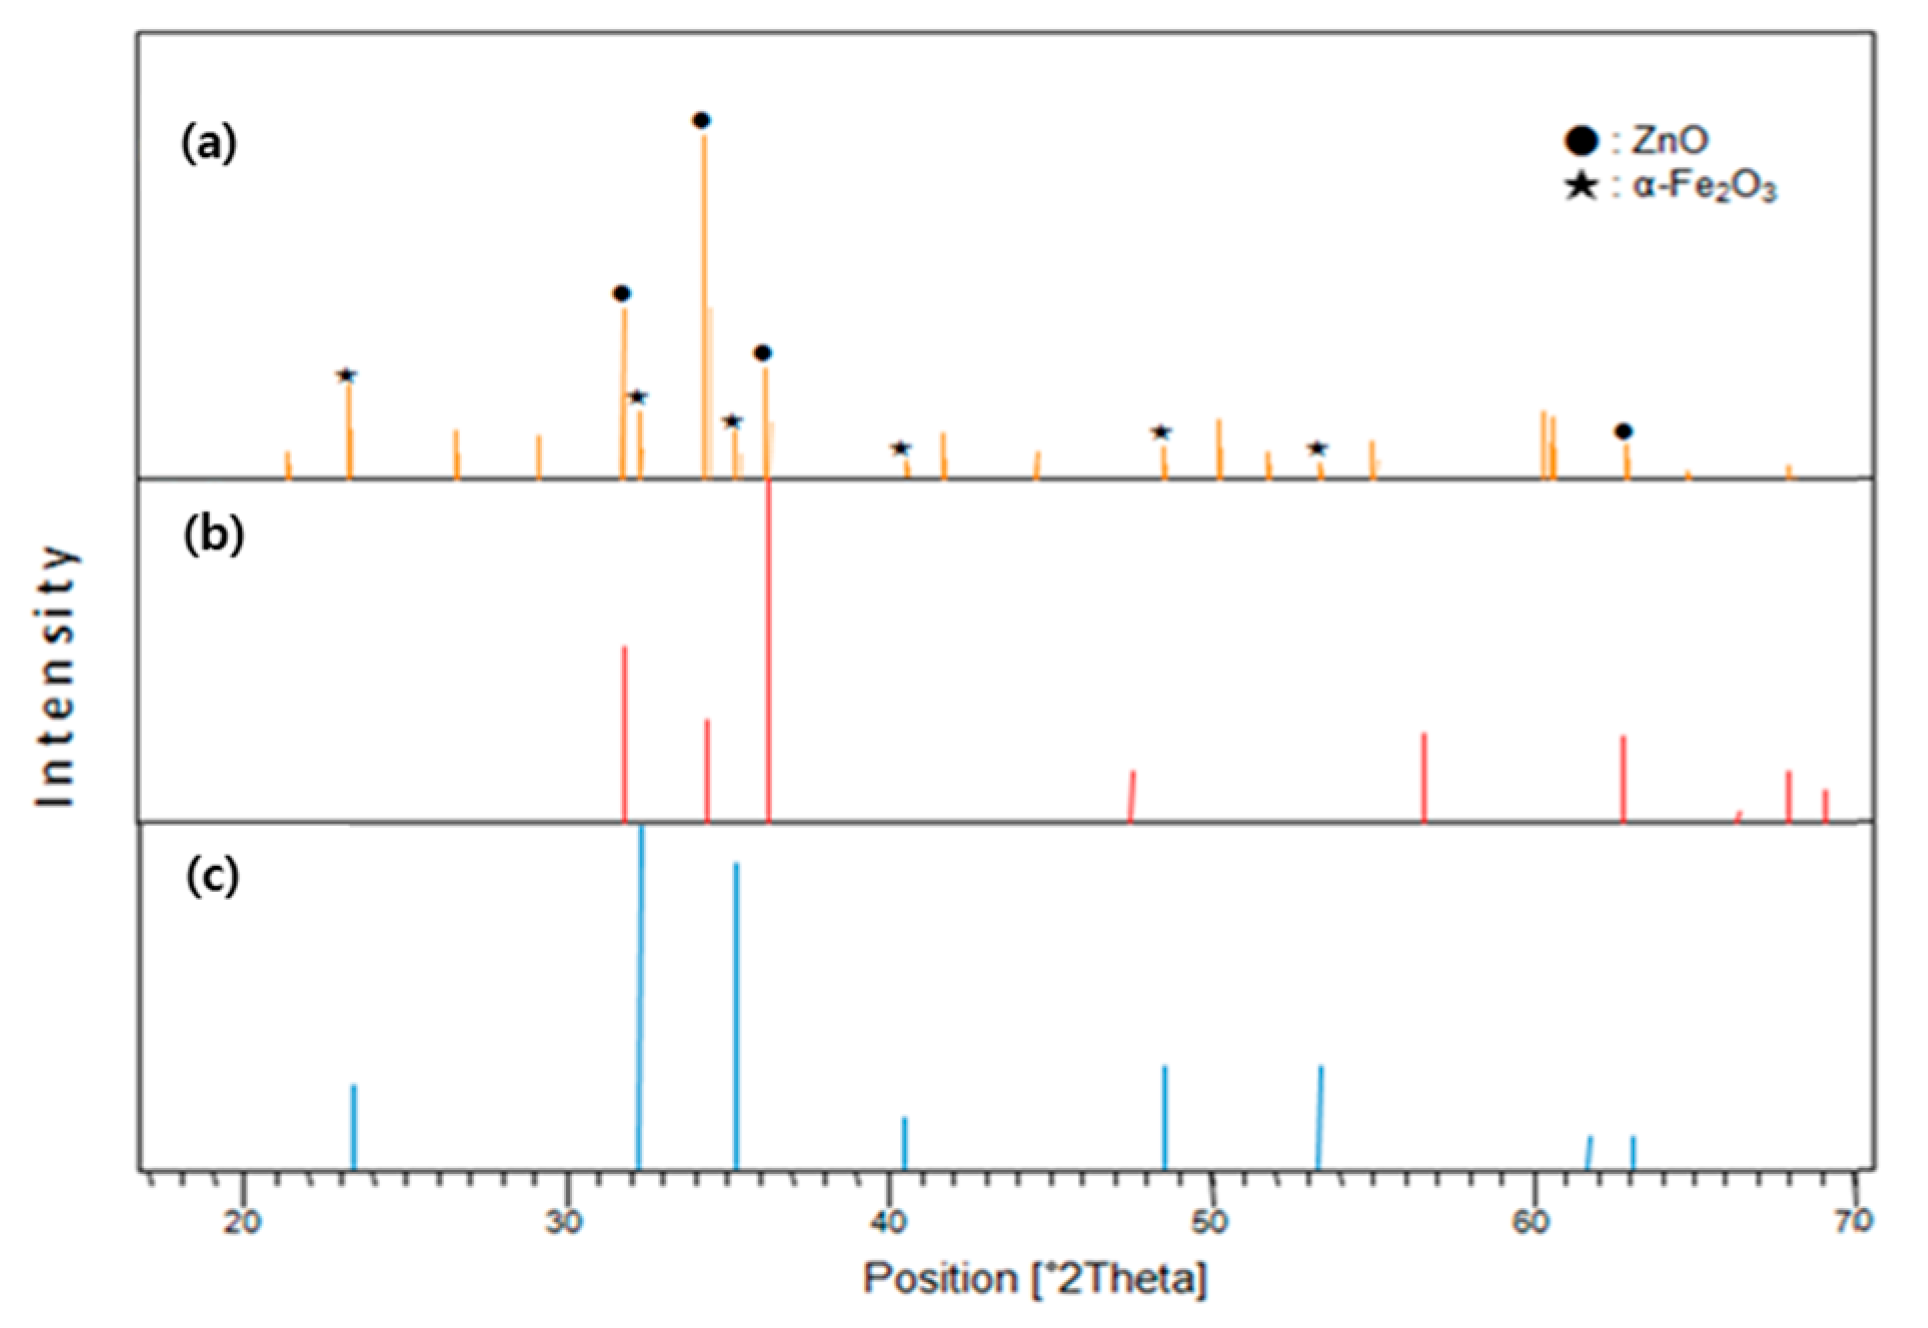
3.1.2. EDS and XRD Analysis
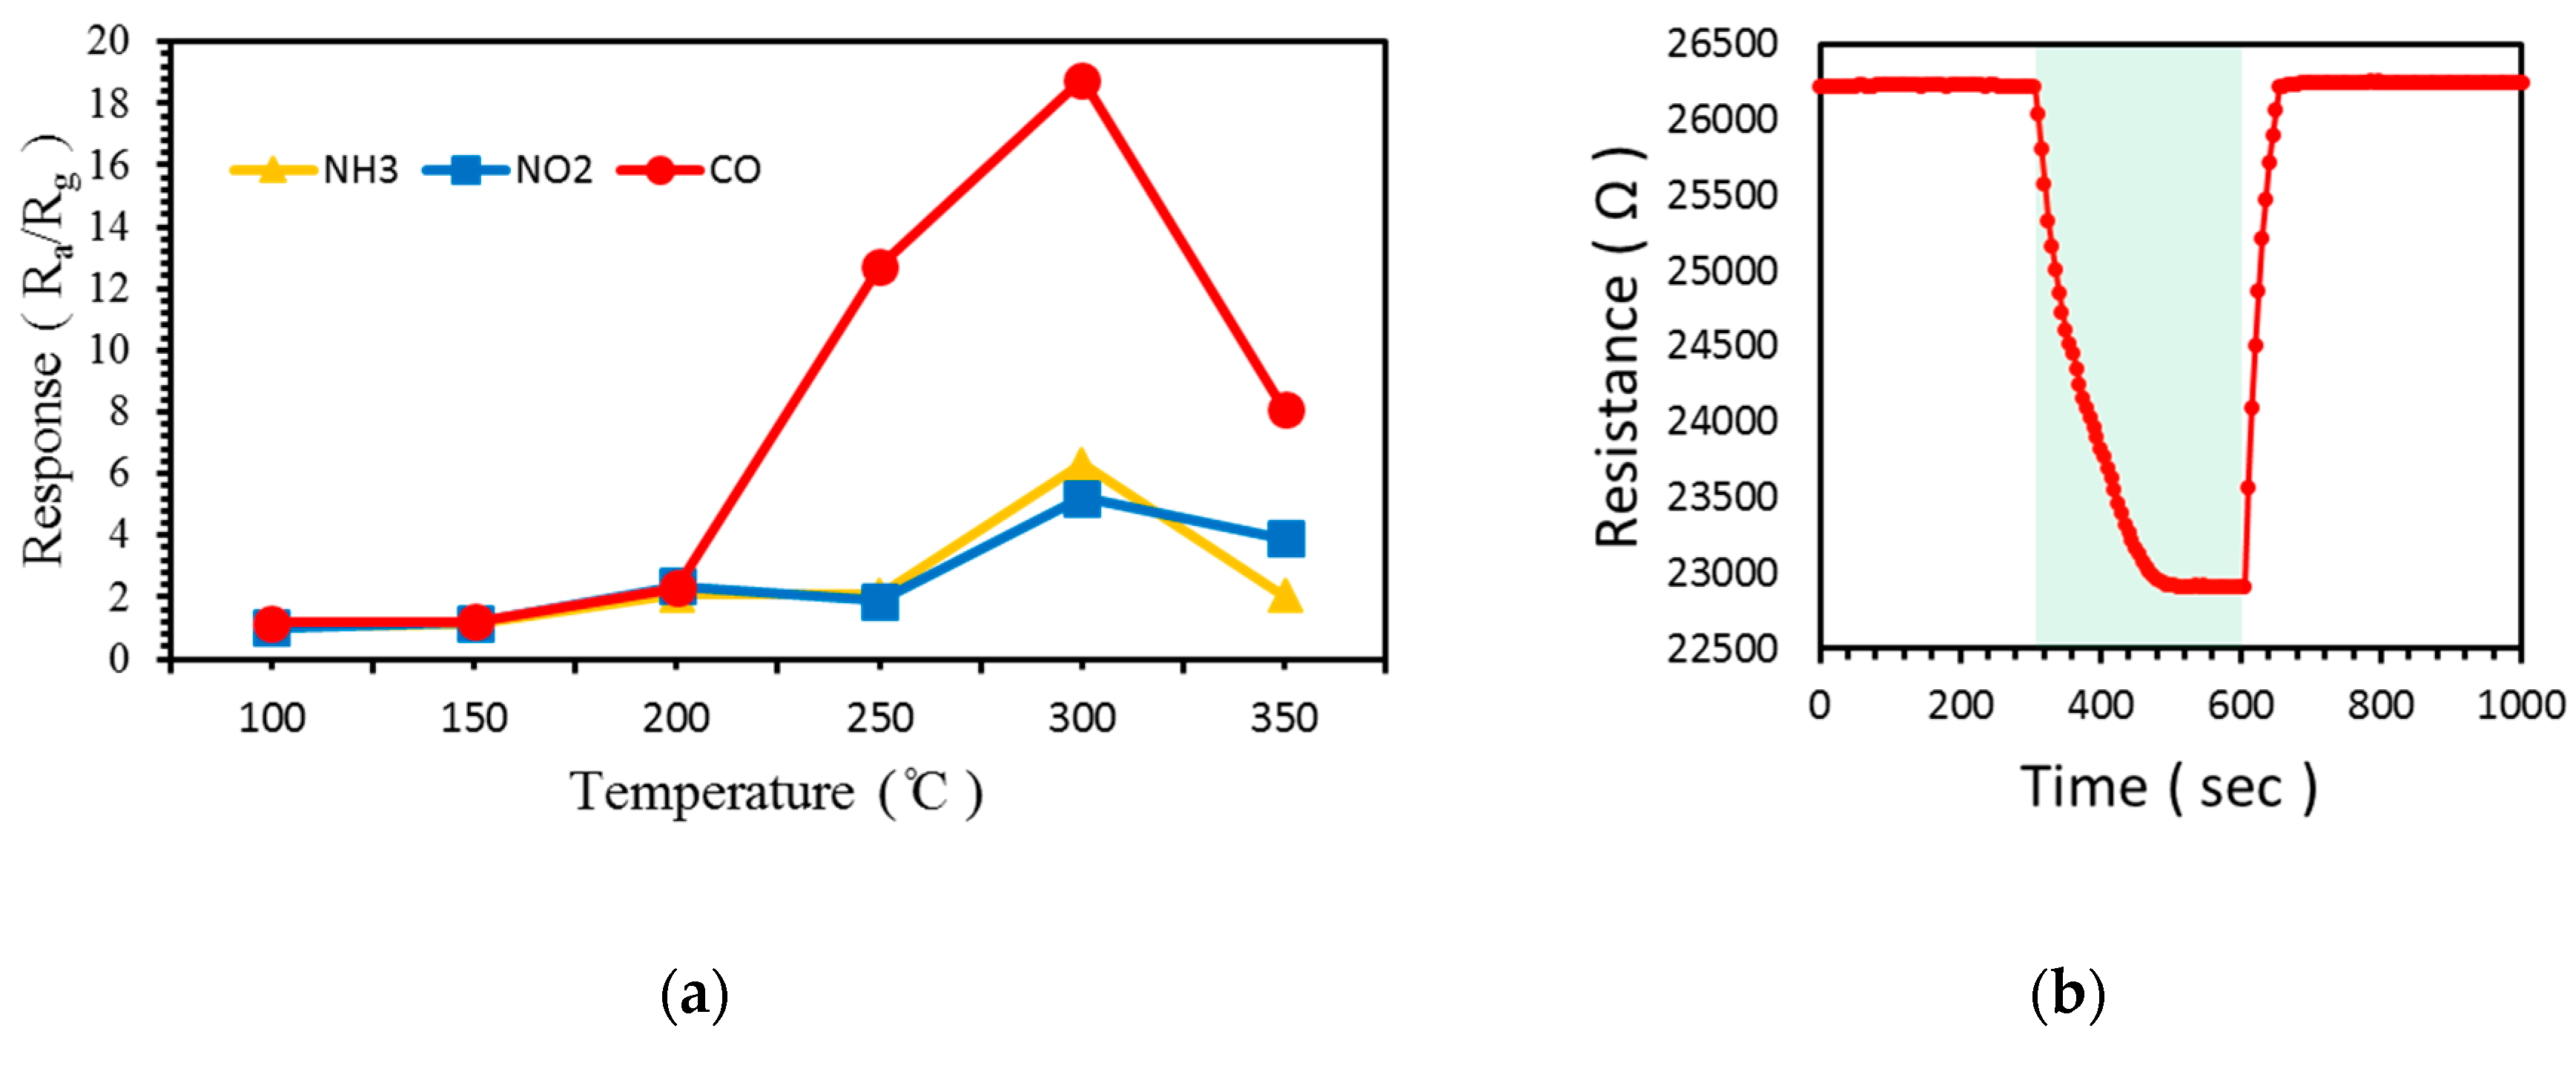
3.2. Gas Sensing Measurements
4. Conclusions
Author Contributions
Funding
Conflicts of Interest
References
- Woo, H.-S.; Na, C.-W.; Lee, J.-H. Design of highly selective gas sensors via physicochemical modification of oxide. Sensors 2016, 16, 1531. [Google Scholar] [CrossRef] [PubMed]
- Hung, C.M.; Le, D.T.T.; Hieu, N.V. On-chip growth of semiconductor metal oxide nanowires for gas sensors: A review. J. Sci. Adv. Mater. Device 2017, 2, 263–285. [Google Scholar] [CrossRef]
- Mirzaei, A.; Hashemi, B.; Janghorban, K. α-Fe2O3 based nanomaterials as gas sensors. Mater. Electron. 2015, 27, 3109–3144. [Google Scholar] [CrossRef]
- Khuspe, G.D.; Sakhare, R.D.; Navale, S.T.; Chougule, M.A.; Kolekar, Y.D.; Mulik, R.N.; Pawar, R.C.; Lee, C.S.; Patil, V.B. Nanostructuresd SnO2 thin films for NO2 gas sensing applications. Ceram. Int. 2013, 39, 8673–8679. [Google Scholar] [CrossRef]
- Yamazoe, N. Toward innovations of gas sensor technology. Sens. Actuators B Chem. 2005, 108, 2–14. [Google Scholar] [CrossRef]
- Kaushik, A.; Kumar, R.; Jayant, R.D.; Nair, M. Nanostructures gas sensors for health care: An Overview. J. Per. Nanomed. 2015, 1, 10–23. [Google Scholar]
- Morán-Lázaro, J.P.; Guillen-López, E.S.; López-Urias, F.; Muñoz-Sandoval, E.; Blanco-Alonso, O.; Guillén-Bonilla, H.; Guillén-Bonilla, A.; Rodríguez-Betancourtt, V.M.; Sanchez-Tizapa, M.; Olvera-Amador, M.L. Synthesis of ZnMn2O4 nanoparticles by a microwave-assisted colloidal method and their evaluation as a gas sensor of propane and carbon monoxide. Sensors 2018, 18, 701. [Google Scholar] [CrossRef] [PubMed]
- Barbosa, M.S.; Suman, P.H.; Kim, J.J.; Tuller, H.L.; Varela, J.A.; Orlandi, M.O. Gas sensor properties of Ag- and Pd-decorated SnO micro-disks to NO2, H2 and CO: Catalyst enhanced sensor response and selectivity. Sens. Actuators B Chem. 2017, 239, 253–261. [Google Scholar] [CrossRef]
- Casanova-Cháfer, J.; Navarrete, E.; Noirfalise, X.; Umek, P.; Bittencourt, C.; Llobet, E. Gas sensing with iridium oxide nanoparticle decorated carbon nanotubes. Sensors 2019, 19, 113. [Google Scholar] [CrossRef] [PubMed]
- Xia, Y.; Li, R.; Chen, R.; Wang, J.; Xiang, L. 3D Architectured graphene/metal oxide hybrids for gas sensors: a review. Sensors 2018, 18, 1456. [Google Scholar] [CrossRef]
- Yeh, L.-K.; Luo, J.-C.; Chen, M.-C.; Wu, C.-H.; Chen, J.-Z.; Cheng, I.-C.; Hsu, C.-C.; Tian, W.-C. A Photoactivated gas detector for toluene sensing at room temperature based on new coral-like ZnO nanostructure arrays. Sensors 2016, 16, 1820. [Google Scholar] [CrossRef]
- Jeong, S.-Y.; Yoon, J.-W.; Kim, T.-H.; Jeong, H.-M.; Lee, C.-S.; Kang, Y.-C.; Lee, J.-H. Ultra-selective detection of sub-ppm-level benzene using Pd–SnO2 yolk–shell micro-reactors with a catalytic Co3O4 overlayer for monitoring air quality. J. Mater. Chem. A 2017, 5, 1446. [Google Scholar] [CrossRef]
- Wang, C.X.; Yin, L.W.; Zhang, L.; Xiang, D.; Gao, R. Metal oxide gas sensors: Sensitivity and influencing factors. Sensors 2010, 10, 2088–2106. [Google Scholar] [CrossRef]
- Yoo, R.; Yoo, S.; Lee, D.; Kim, J.; Cho, S.; Lee, W. Highly selective detection of dimethyl methyl phosphonate (DMMP) using CuO nanoparticles/ZnO flowers heterojunction. Sens. Actuators B Chem. 2017, 240, 1099–1105. [Google Scholar] [CrossRef]
- Kwak, C.-H.; Woo, H.-S.; Abdel-Hady, F.; Wazzan, A.A.; Lee, J.-H. Vapor-phase growth of urchin-like Mg-doped ZnO networks and their application to highly sensitive and selective detection of ethanol. Sens. Actuators B Chem. 2016, 223, 527–534. [Google Scholar] [CrossRef]
- Ling, Z.; Wen, Z. Room-temperature gas sensing of ZnO-based gas sensor: A review. Sens. Actuators A Phys. 2017, 267, 242–261. [Google Scholar]
- Alsultany, F.H.; Hassan, Z.; Ahmed, N.M. Catalyst-free growth of ZnO nanowires on ITO seed layer/glass by thermal evaporation method: Effects of ITO seed layer laser annealing temperature. Superlattices Microstruct. 2016, 92, 68–79. [Google Scholar] [CrossRef]
- Lee, J.-H. Gas sensors using hierarchical and hollow oxide nanostructures: Overview. Sens. Actuators B Chem. 2009, 140, 319–336. [Google Scholar] [CrossRef]
- Navale, S.T.; Bandgar, D.K.; Nalage, S.R.; Khuspe, G.D.; Chougule, M.A.; Kolekar, Y.D.; Sen, S.; Patil, V.B. Synthesis of Fe2O3 nanoparticles for nitrogen dioxide gas sensing applications. Ceram. Int. 2013, 39, 6453–6460. [Google Scholar] [CrossRef]
- Leonardi, S.G.; Mirzaei, A.; Bonavita, A.; Santagelo, S.; Frontera, P.; Panto, F.; Antonucci, P.L.; Neri, G. A comparison of the ethanol sensing properties of α-iron oxide nanostructures prepared via the sol–gel and electrospinning techniques. Nanotechnology 2016, 27, 10–19. [Google Scholar] [CrossRef] [PubMed]
- Arafat, M.M.; Dinan, B.; Akbar, S.A.; Haseeb, A.S.M.A. Gas sensors based on one dimensional nanostructured metal-oxides: A review. Sensors 2012, 12, 7207–7258. [Google Scholar] [CrossRef] [PubMed]
- Wang, N.; Upmanyu, M.; Karma, A. Phase-field model of vapor–liquid–solid nanowire growth. Phys. Rev. Mater. 2018, 2, 33402. [Google Scholar] [CrossRef]


| Molar Concentration (M) | ZnO NWs | ZnO NW Vines | ZnO NW Vines Decorated with 0.05 M α-Fe2O3 | |
|---|---|---|---|---|
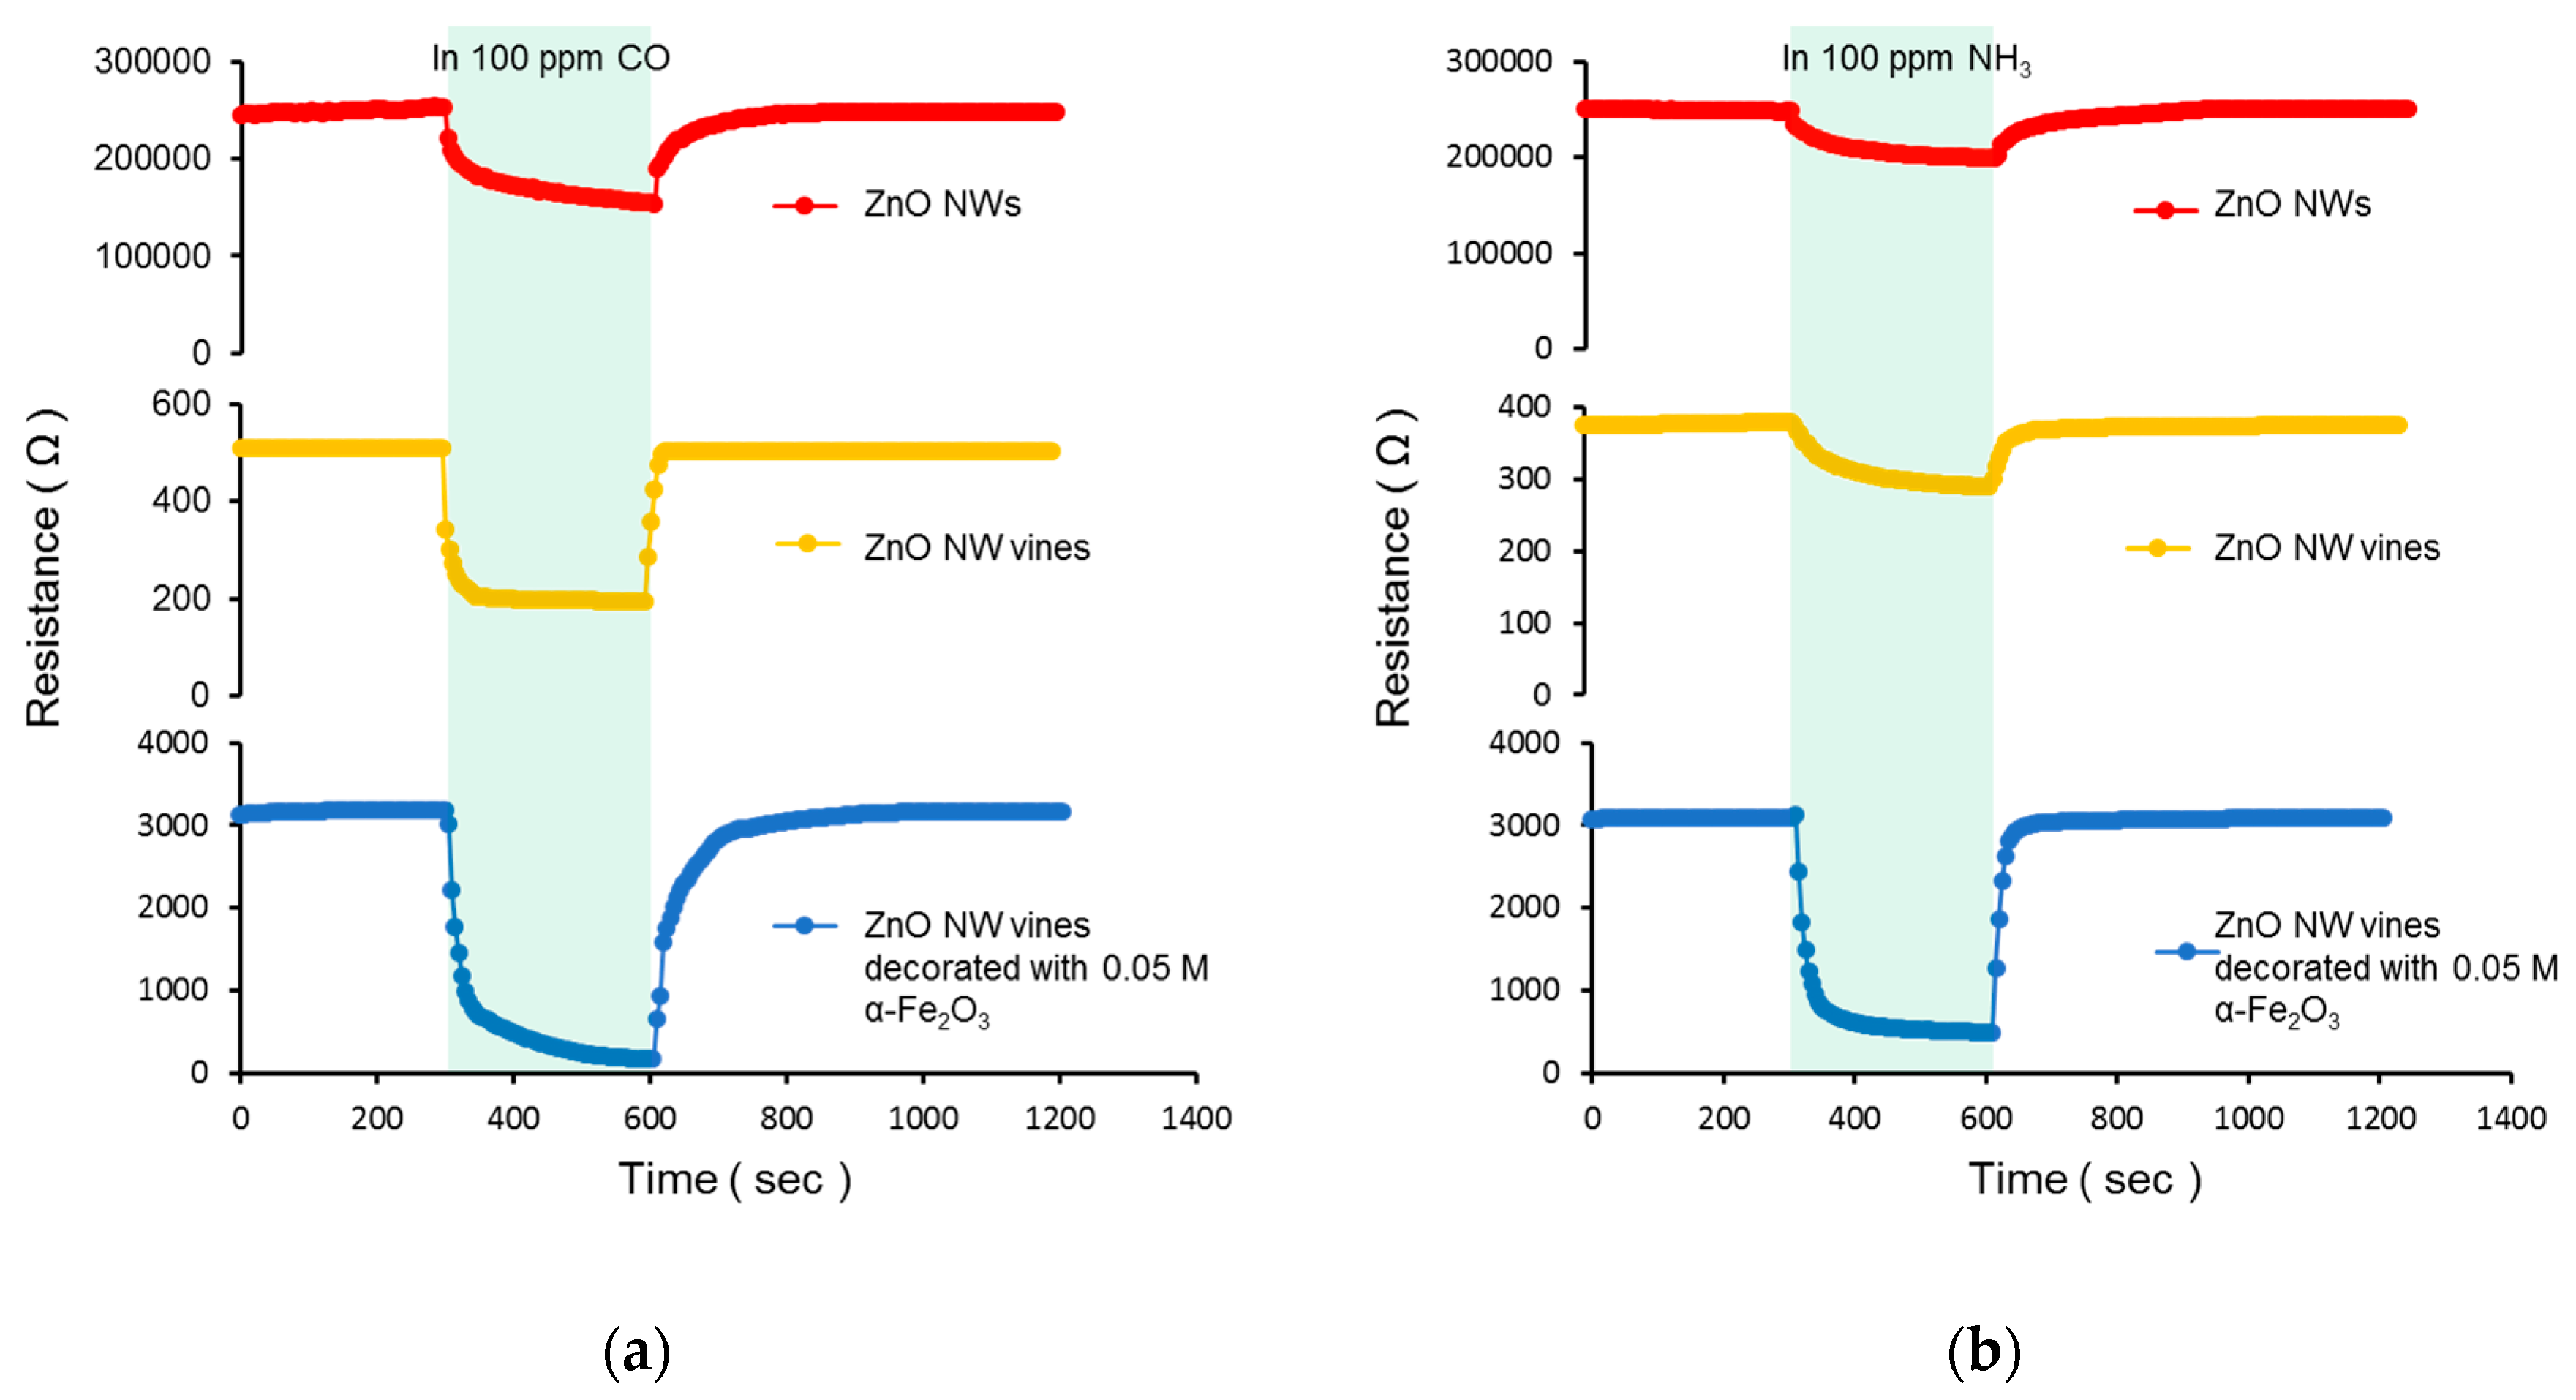
| 100 ppm CO gas | Ra (Ω) | 250,000 | 500 | 3200 |
| Rg (Ω) | 150,000 | 190 | 170 | |
| 100 ppm NH3 gas | Ra (Ω) | 250,000 | 370 | 3100 |
| Rg (Ω) | 200,000 | 290 | 480 | |
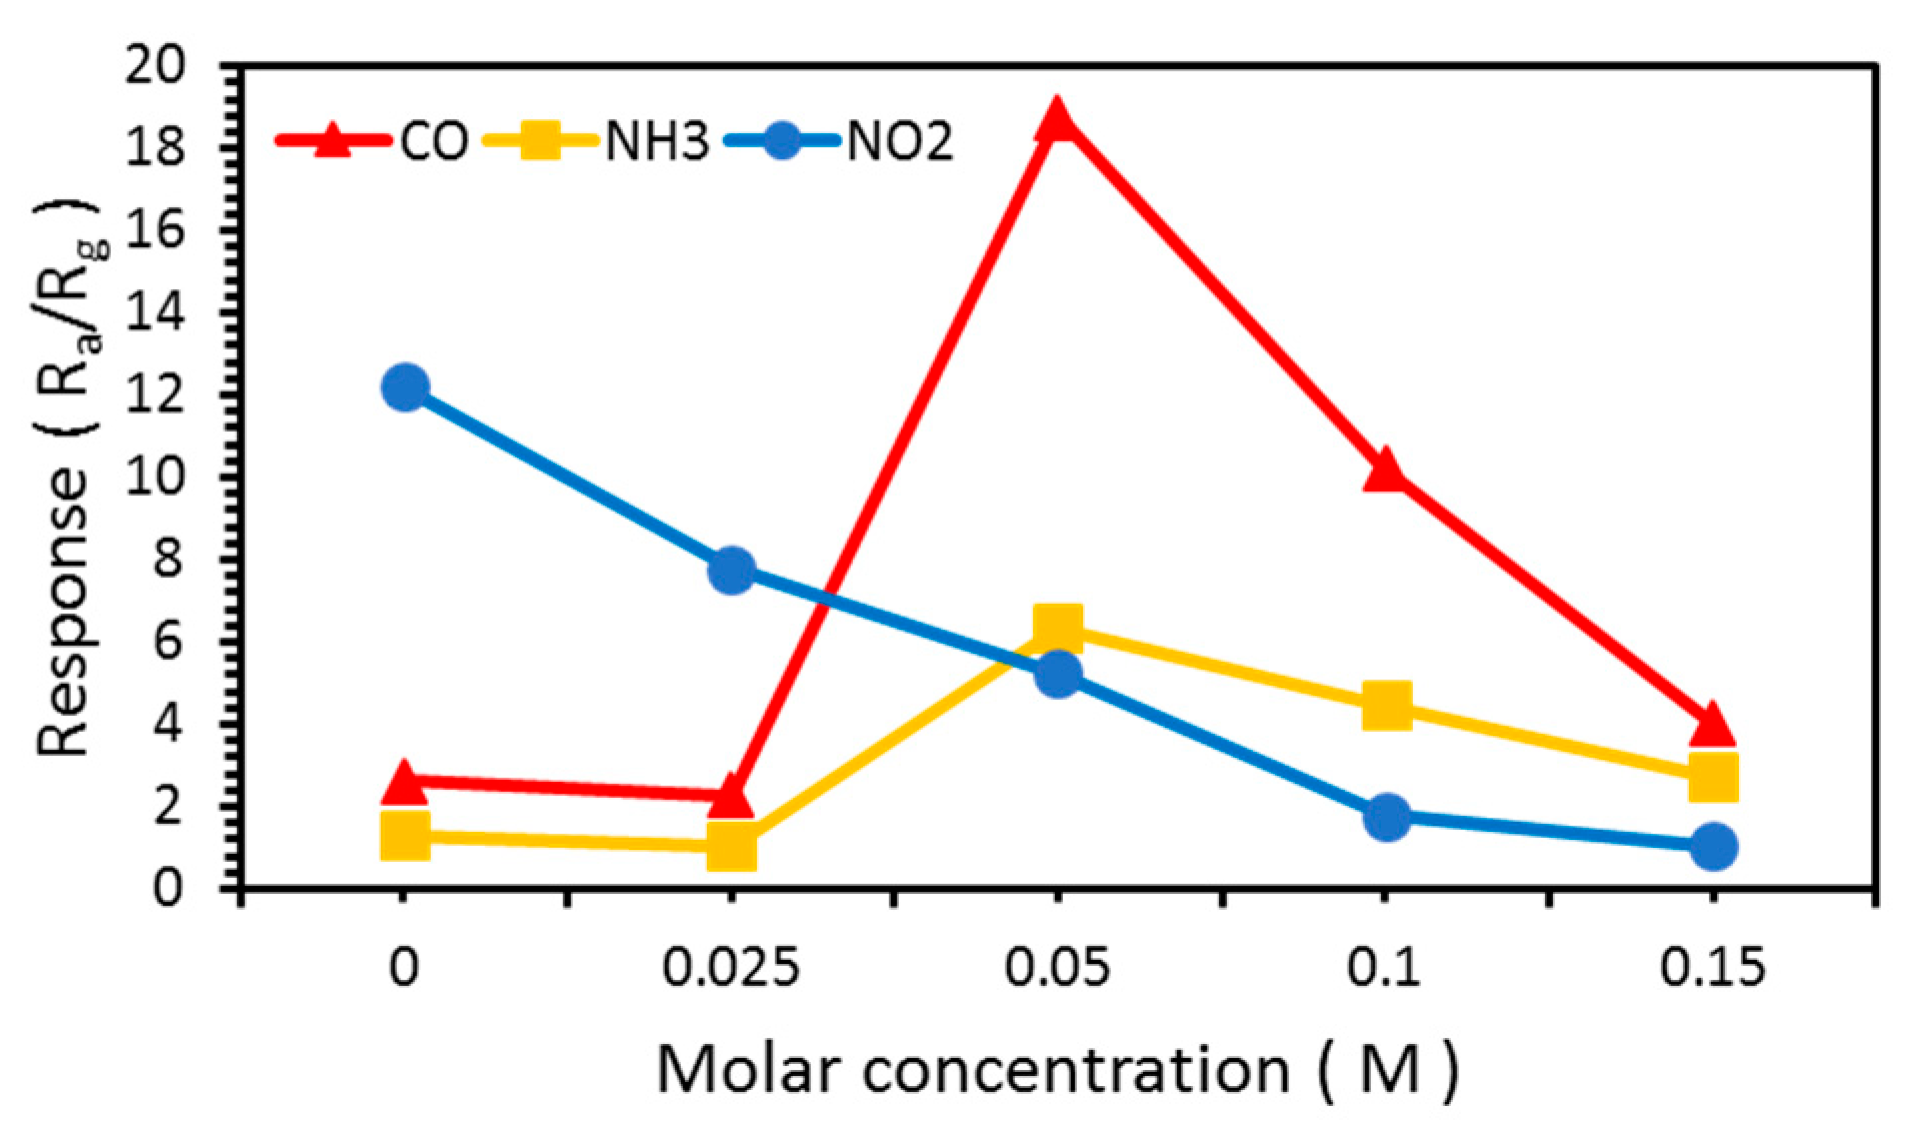
| Molar Concentration (M) | 0 | 0.025 | 0.05 | 0.1 | 0.15 |
|---|---|---|---|---|---|
| 100 ppm CO gas | 2.6 | 2.3 | 18.8 | 10.2 | 4.0 |
| 100 ppm NH3 gas | 1.3 | 1.04 | 6.3 | 4.5 | 2.7 |
| 100 ppm NO2 gas | 12.2 | 7.8 | 5.2 | 1.8 | 1.1 |
| Temperature (°C) | 100 | 150 | 200 | 250 | 300 | 350 |
|---|---|---|---|---|---|---|
| 100 ppm CO gas | 1.2 | 1.2 | 2.3 | 12.7 | 18.8 | 8.1 |
| 100 ppm NH3 gas | 1.0 | 1.1 | 2.1 | 2.1 | 6.3 | 2.1 |
| 100 ppm NO2 gas | 1.0 | 1.2 | 2.2 | 1.9 | 5.2 | 3.9 |
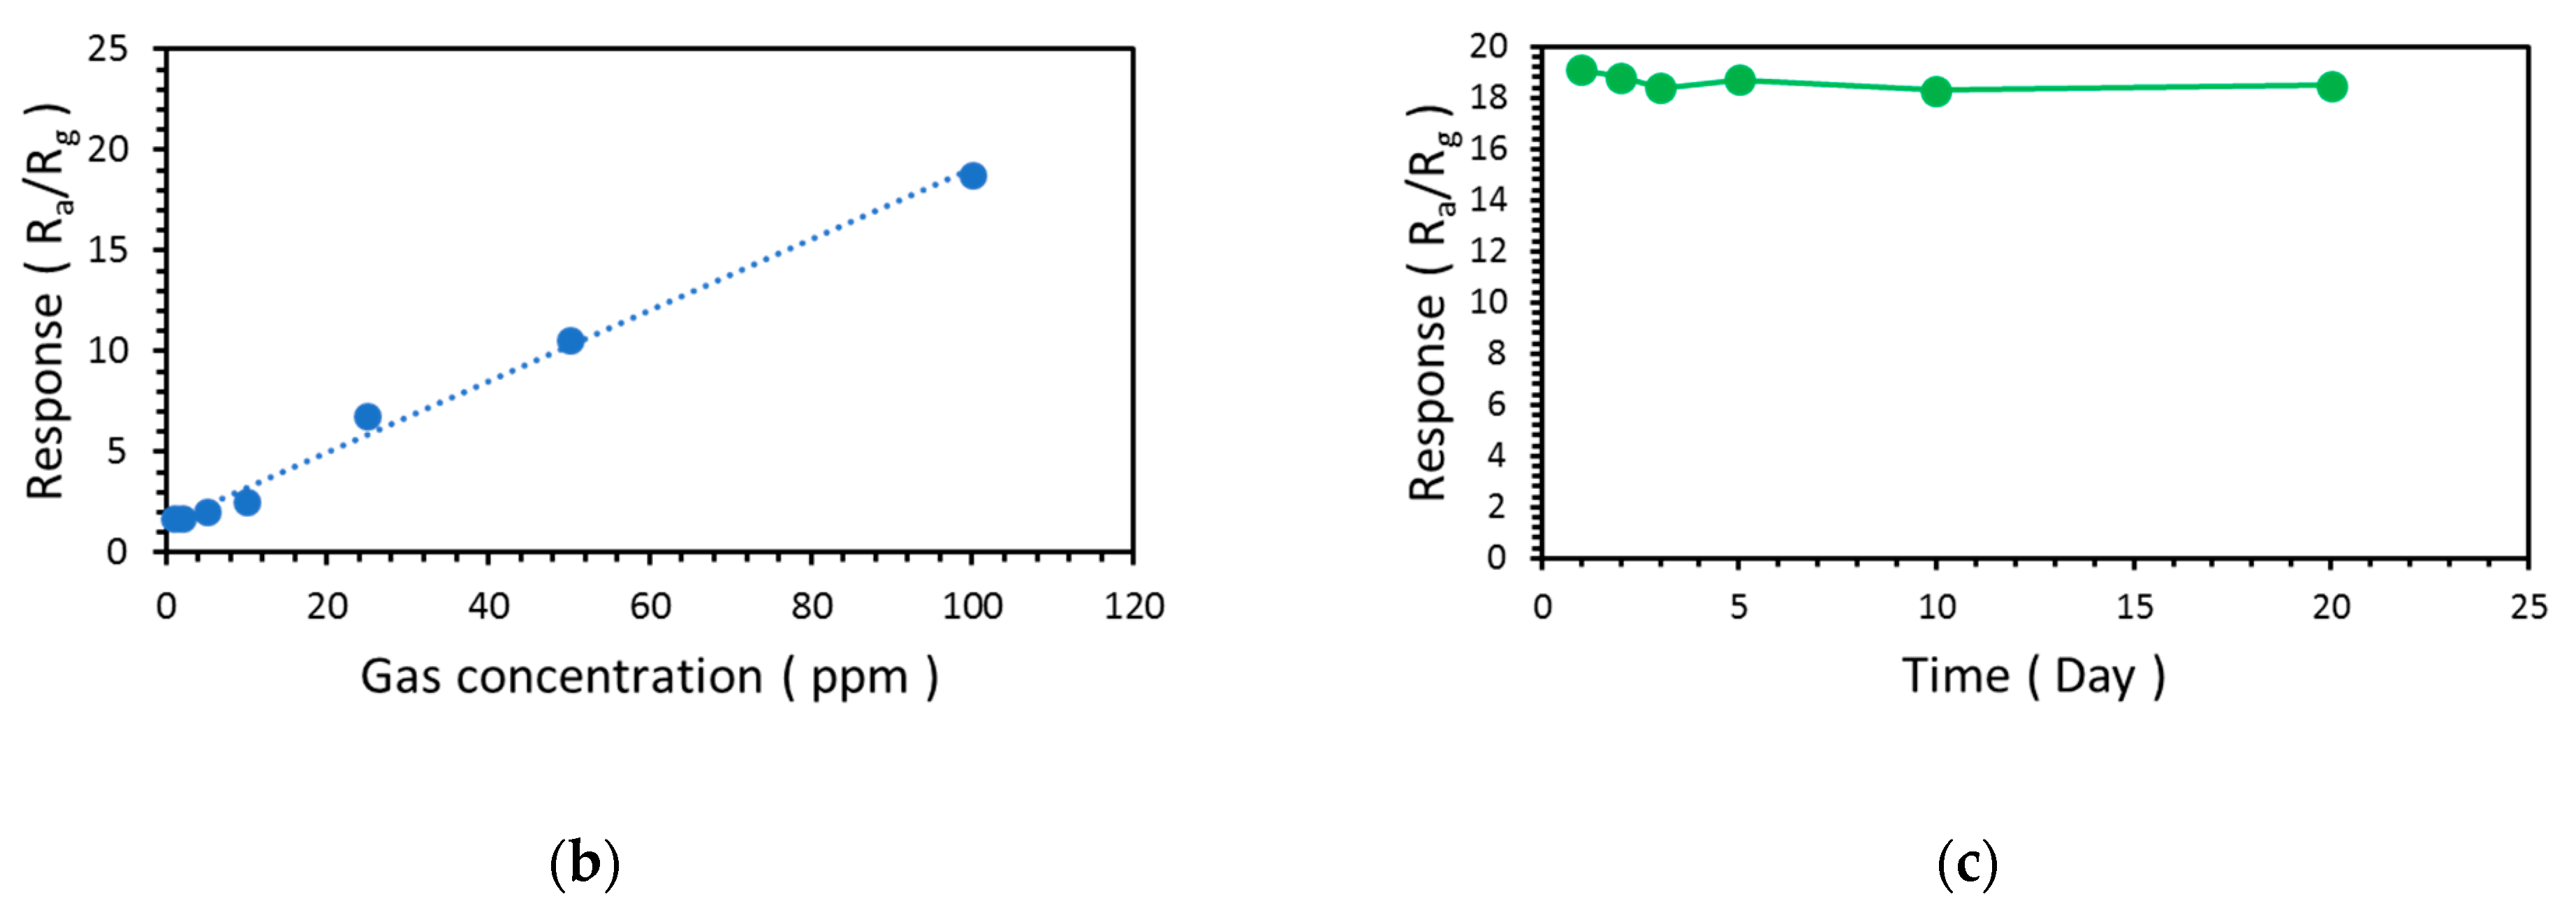
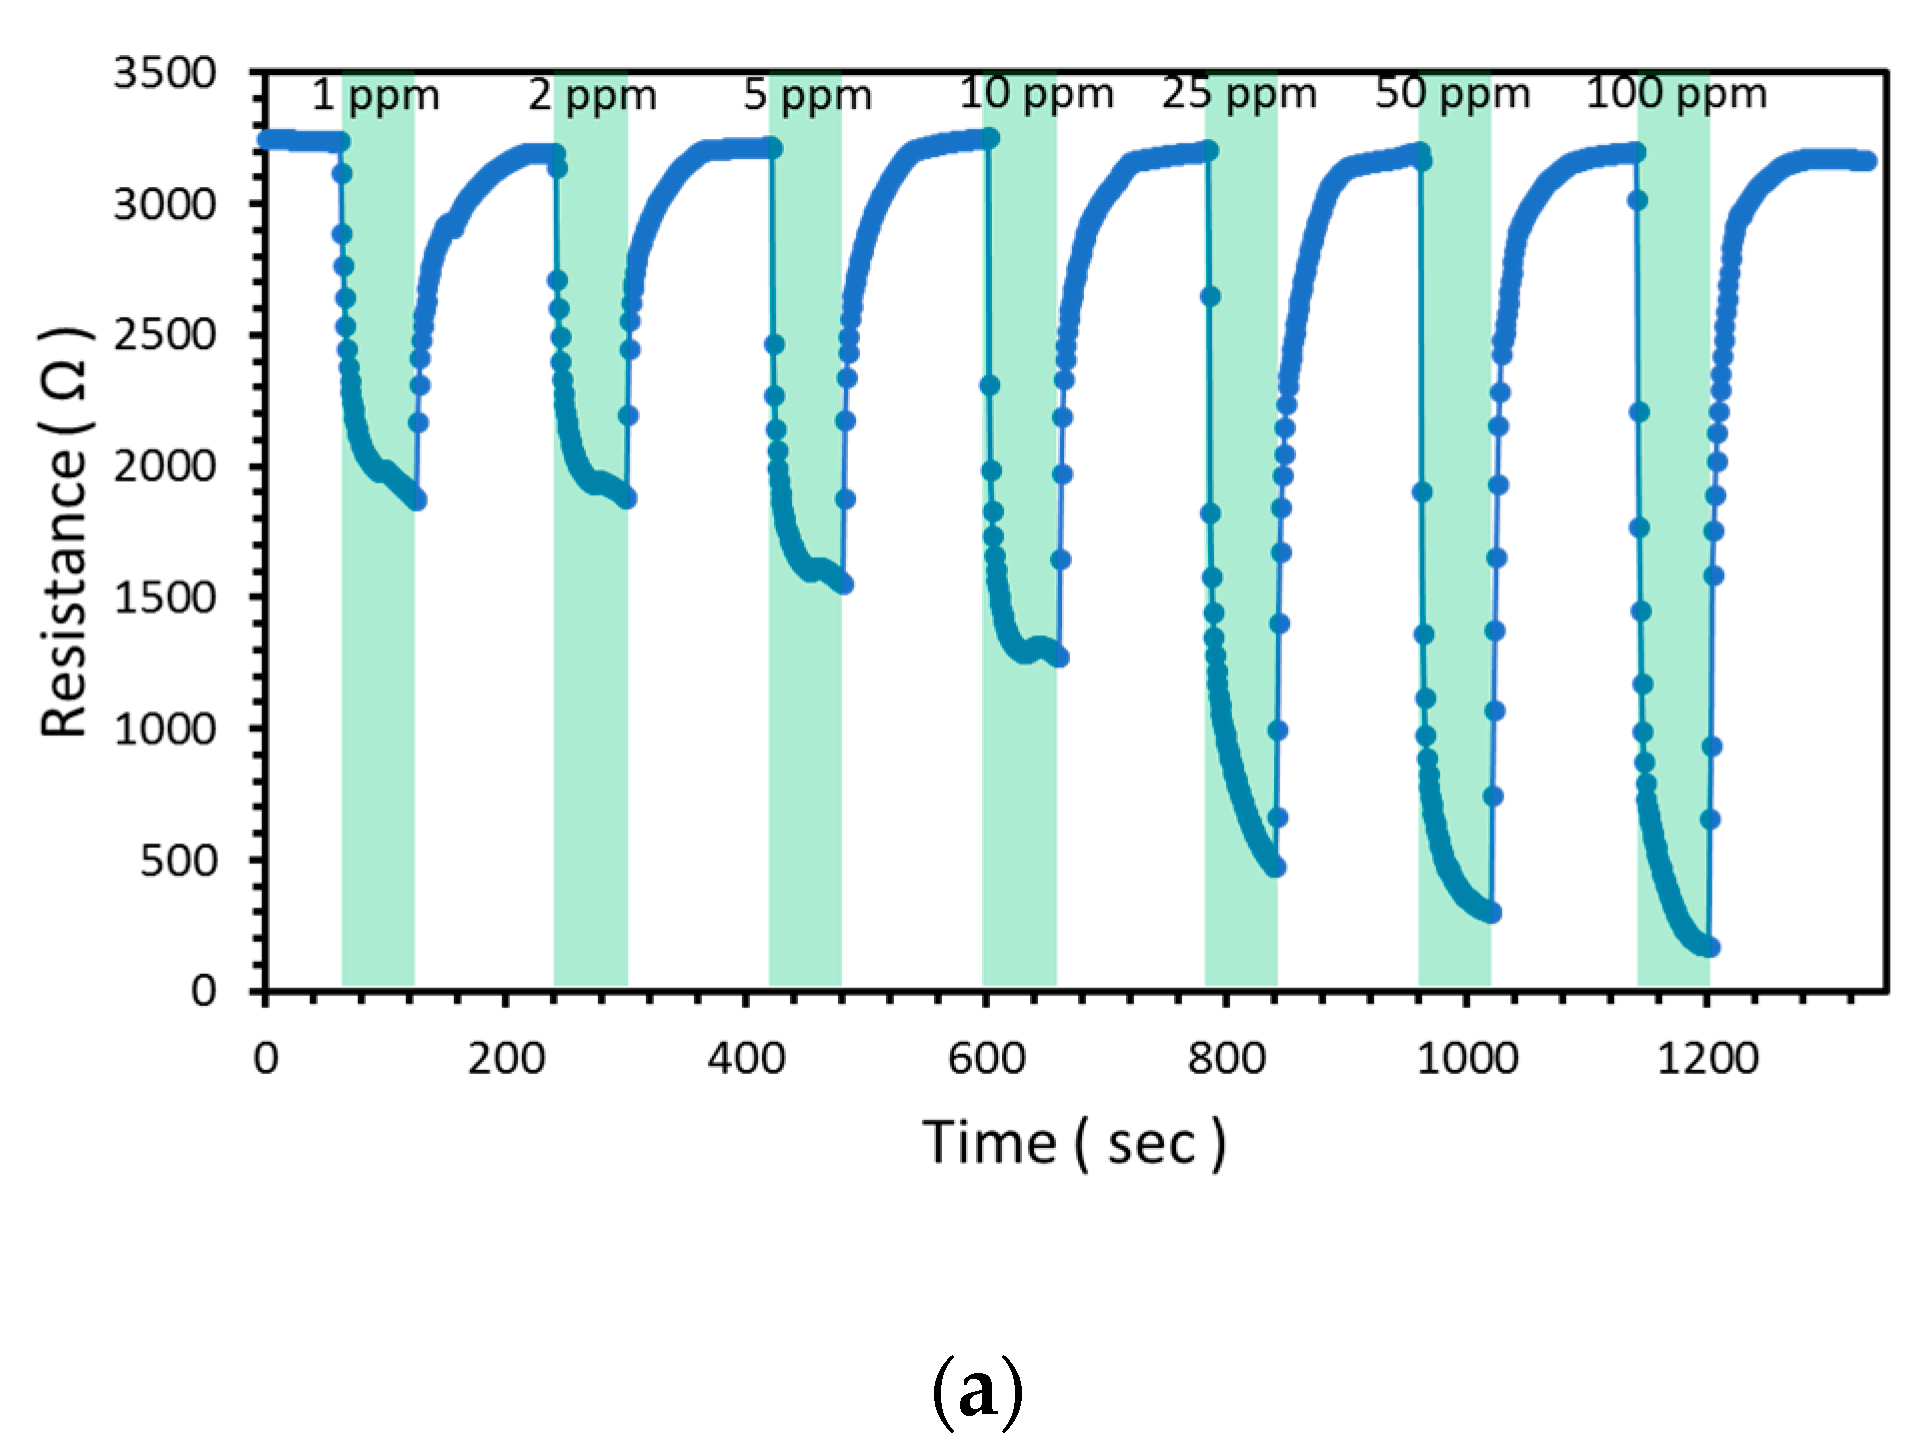
| Gas Concentration (ppm) | 1 | 2 | 5 | 10 | 25 | 50 | 100 |
|---|---|---|---|---|---|---|---|
| Ra (Ω) | 3239 | 3163 | 3208 | 3230 | 3179 | 3165 | 3176 |
| Rg (Ω) | 1870.5 | 1877.0 | 1551.7 | 1271.3 | 469.5 | 298.8 | 169.2 |
| Response | 1.7 | 1.7 | 2.1 | 2.5 | 6.8 | 10.6 | 18.8 |
© 2019 by the authors. Licensee MDPI, Basel, Switzerland. This article is an open access article distributed under the terms and conditions of the Creative Commons Attribution (CC BY) license (http://creativecommons.org/licenses/by/4.0/).
Share and Cite
Lee, J.; Lee, S.-H.; Bak, S.-Y.; Kim, Y.; Woo, K.; Lee, S.; Lim, Y.; Yi, M. Improved Sensitivity of α-Fe2O3 Nanoparticle-Decorated ZnO Nanowire Gas Sensor for CO. Sensors 2019, 19, 1903. https://doi.org/10.3390/s19081903
Lee J, Lee S-H, Bak S-Y, Kim Y, Woo K, Lee S, Lim Y, Yi M. Improved Sensitivity of α-Fe2O3 Nanoparticle-Decorated ZnO Nanowire Gas Sensor for CO. Sensors. 2019; 19(8):1903. https://doi.org/10.3390/s19081903
Chicago/Turabian StyleLee, Jeongseok, Se-Hyeong Lee, So-Young Bak, Yoojong Kim, Kyoungwan Woo, Sanghyun Lee, Yooseong Lim, and Moonsuk Yi. 2019. "Improved Sensitivity of α-Fe2O3 Nanoparticle-Decorated ZnO Nanowire Gas Sensor for CO" Sensors 19, no. 8: 1903. https://doi.org/10.3390/s19081903
APA StyleLee, J., Lee, S.-H., Bak, S.-Y., Kim, Y., Woo, K., Lee, S., Lim, Y., & Yi, M. (2019). Improved Sensitivity of α-Fe2O3 Nanoparticle-Decorated ZnO Nanowire Gas Sensor for CO. Sensors, 19(8), 1903. https://doi.org/10.3390/s19081903