Article

In-Situ Monitoring of a Filament Wound Pressure Vessel by the MWCNT Sensor under Hydraulic Fatigue Cycling and Pressurization

1
School of Mechanical and Power Engineering, East China University of Science and Technology, Shanghai 200237, China
2
School of Civil Engineering and Architecture, East China Jiaotong University, Nanchang 330013, China
3
Chinese Society for Composite Materials, Beijing 100191, China
4
Beijing Key Laboratory of Lightweight Multi-functional Composite Materials and Structures, Beijing Institute of Technology, Beijing 100081, China
*
Authors to whom correspondence should be addressed.
Sensors 2019, 19(6), 1396; https://doi.org/10.3390/s19061396
Submission received: 12 February 2019 / Revised: 13 March 2019 / Accepted: 19 March 2019 / Published: 21 March 2019
(This article belongs to the Special Issue Carbon Nanotube Based Sensors)

Abstract

:
As a result of the high specific strength/stiffness to mass ratio, filament wound composite pressure vessels are extensively used to contain gas or fluid under pressure. The ability to in-situ monitor the composite pressure vessels for possible damage is important for high-pressure medium storage industries. This paper describes an in-situ monitoring method to permanently monitor composite pressure vessels for their structural integrity. The sensor is made of a multi-walled carbon nanotube (MWCNT) that can be embedded in the composite skin of the pressure vessels. The sensing ability of the sensor is firstly evaluated in various mechanical tests, and in-situ monitoring experiments of a full-scale composite pressure vessel during hydraulic fatigue cycling and pressurization are performed. The monitoring results of the MWCNT sensor are compared with the strains measured by the strain gauges. The results show that the measured signal by the developed sensor matches the mechanical behavior of the composite laminates under various load conditions. In the hydraulic fatigue test, the relationship between the resistance and the strain is built, and could be used to quantitative monitor the filament wound pressure vessel. The bursting of the pressure vessel can be detected by the sharp increase of the MWCNT sensor resistance. Embedding the MWCNT sensor into the composite pressure vessel is successfully demonstrated as a promising method for structural health monitoring.

1. Introduction

Filament wound pressure vessels have been extensively used in many engineering fields such as in the nuclear energy, naval, petrochemical, and aero-space industries [1,2]. Because of the complex working environment, the safety of in-service filament wound pressure vessels has drawn increasing attention [3,4]. Variable pressurization occurs when the medium is being used and then replenished, and this is analogous to the fatigue loading of the pressure vessel. Damages in the composite skin are a major and frequently occurring failure that tremendously affect the strength, stiffness, and usable service life of a composite pressure vessel [5]. Studies have shown that composite pressure vessels eventually fail when damages in the laminate skin reach the maximum damage limit [6]. Hence, the detection of damages in the composite skin is critical for safe and reliable implementation in the structural integrity assessment of filament wound pressure vessels.
Because the detection of filament wound pressure vessels is of fundamental importance in order to avoid the occurrence of an abrupt and catastrophic event, studies related to the detection of damages in the pressure vessels are of notable interests [6,7,8,9,10,11]. To ensure the service safety of the pressure vessels, several non-destructive (NDT) methods have been used to monitor the initiation and development of damage in composite pressure vessels [12,13]. Generally, the NDT methods can be divided into two categories, namely: passive safety systems, such as the vibration-based structural damage detection technique and the acoustic emission (AE) [5,11,14,15,16], and active safety systems, such as the strain monitoring using bragg grating optical fiber sensors [9], guided waves [17,18], and nano-material-based sensors [19,20]. Vibration-based structural damage detection is based on the fact that damage occurred in a pressure vessel would result in changes in the structural dynamic characteristics, and the variation of the physical properties could be identified [21]. However, vibration-based methods often require special loading or handling conditions during inspection. Therefore, it is only suitable for periodic inspections rather than continuous monitoring. In the AE analysis of a filament wound pressure vessel, it is often difficult to distinguish the AE signals, because the damage events generally have similar acoustic properties [6]. Optical fibers can be employed as a monitoring system throughout manufacturing, transport, installation, and the service life of the pressure vessel, but the handling of fragile optical fibers is difficult [22,23,24]. In recent years, guided waves have gained prominence for damage detection because of their potential for in-service structural health monitoring (SHM) and inspection at inaccessible locations [25]. However, the post-processing of guided wave signals is a challenge. In our previous papers [19,20], we continually monitored the health state of glass fiber (GF)/epoxy composite laminates via coating multi-walled carbon nanotube (MWCNT) on fiber surfaces. The principle of this electrical resistance measurement is that the conductive networks can break up with the appearance of damage in composites. Compared with other NDT methods, nano-material-based sensors do not involve the attachment of external sensors or additional fibers input in the structures [26]. Zhang et al. [27] described the development of a hierarchically engineered micro-nano hybrid composite system. They used a solvent assisted dispersion or spread method to disperse the CNTs in composites, and the in-situ damage sensing of composite laminates upon loading was presented. Chowdhury et al. [28] addressed the piezoresistive sensing mechanism experimentally. Thostenson et al. [29] reported the pioneering work of self-sensing composites using CNTs in early 2000. They examined the research work reported in the literature on the structure and processing of cCNTs, as well as the characterization and property modeling of carbon nanotubes and their composites. Although the resistance-based nano sensors are verified to have a high sensitivity in SHM [19,30], research on monitoring the failure in the filament wound pressure vessels are currently limited.
Embedding a nano-material-based sensor into the filament wound pressure vessel could perform the in-situ structural health monitoring to get the damage information [31,32,33,34]. MWCNTs can provide electrical percolation at a very low concentration, because of their high aspect ratio and highly conductive properties [35]. These outstanding properties make MWCNT a promising candidate for nanoelectronic sensors [36,37]. The present study therefore proposes a new resistance-based MWCNT sensor that can in-situ measure the damages in the composite skin of the composite pressure vessel. Compared with the traditional approaches of introducing CNTs into epoxy matrices for in-situ monitoring composite materials, this technique is easier to perform and also has the potential for industrial scale-up. The sensing ability and the reliability of the developed MWCNT sensor in various load conditions are firstly investigated. In-situ monitoring of the full-scale pressure vessels under hydraulic fatigue cycling and pressurization test are performed. The monitoring results are compared with the strain measured by the strain gauges, in order to demonstrate the validity of the MWCNT sensor.

2. Materials, Manufacturing, and Test Methods

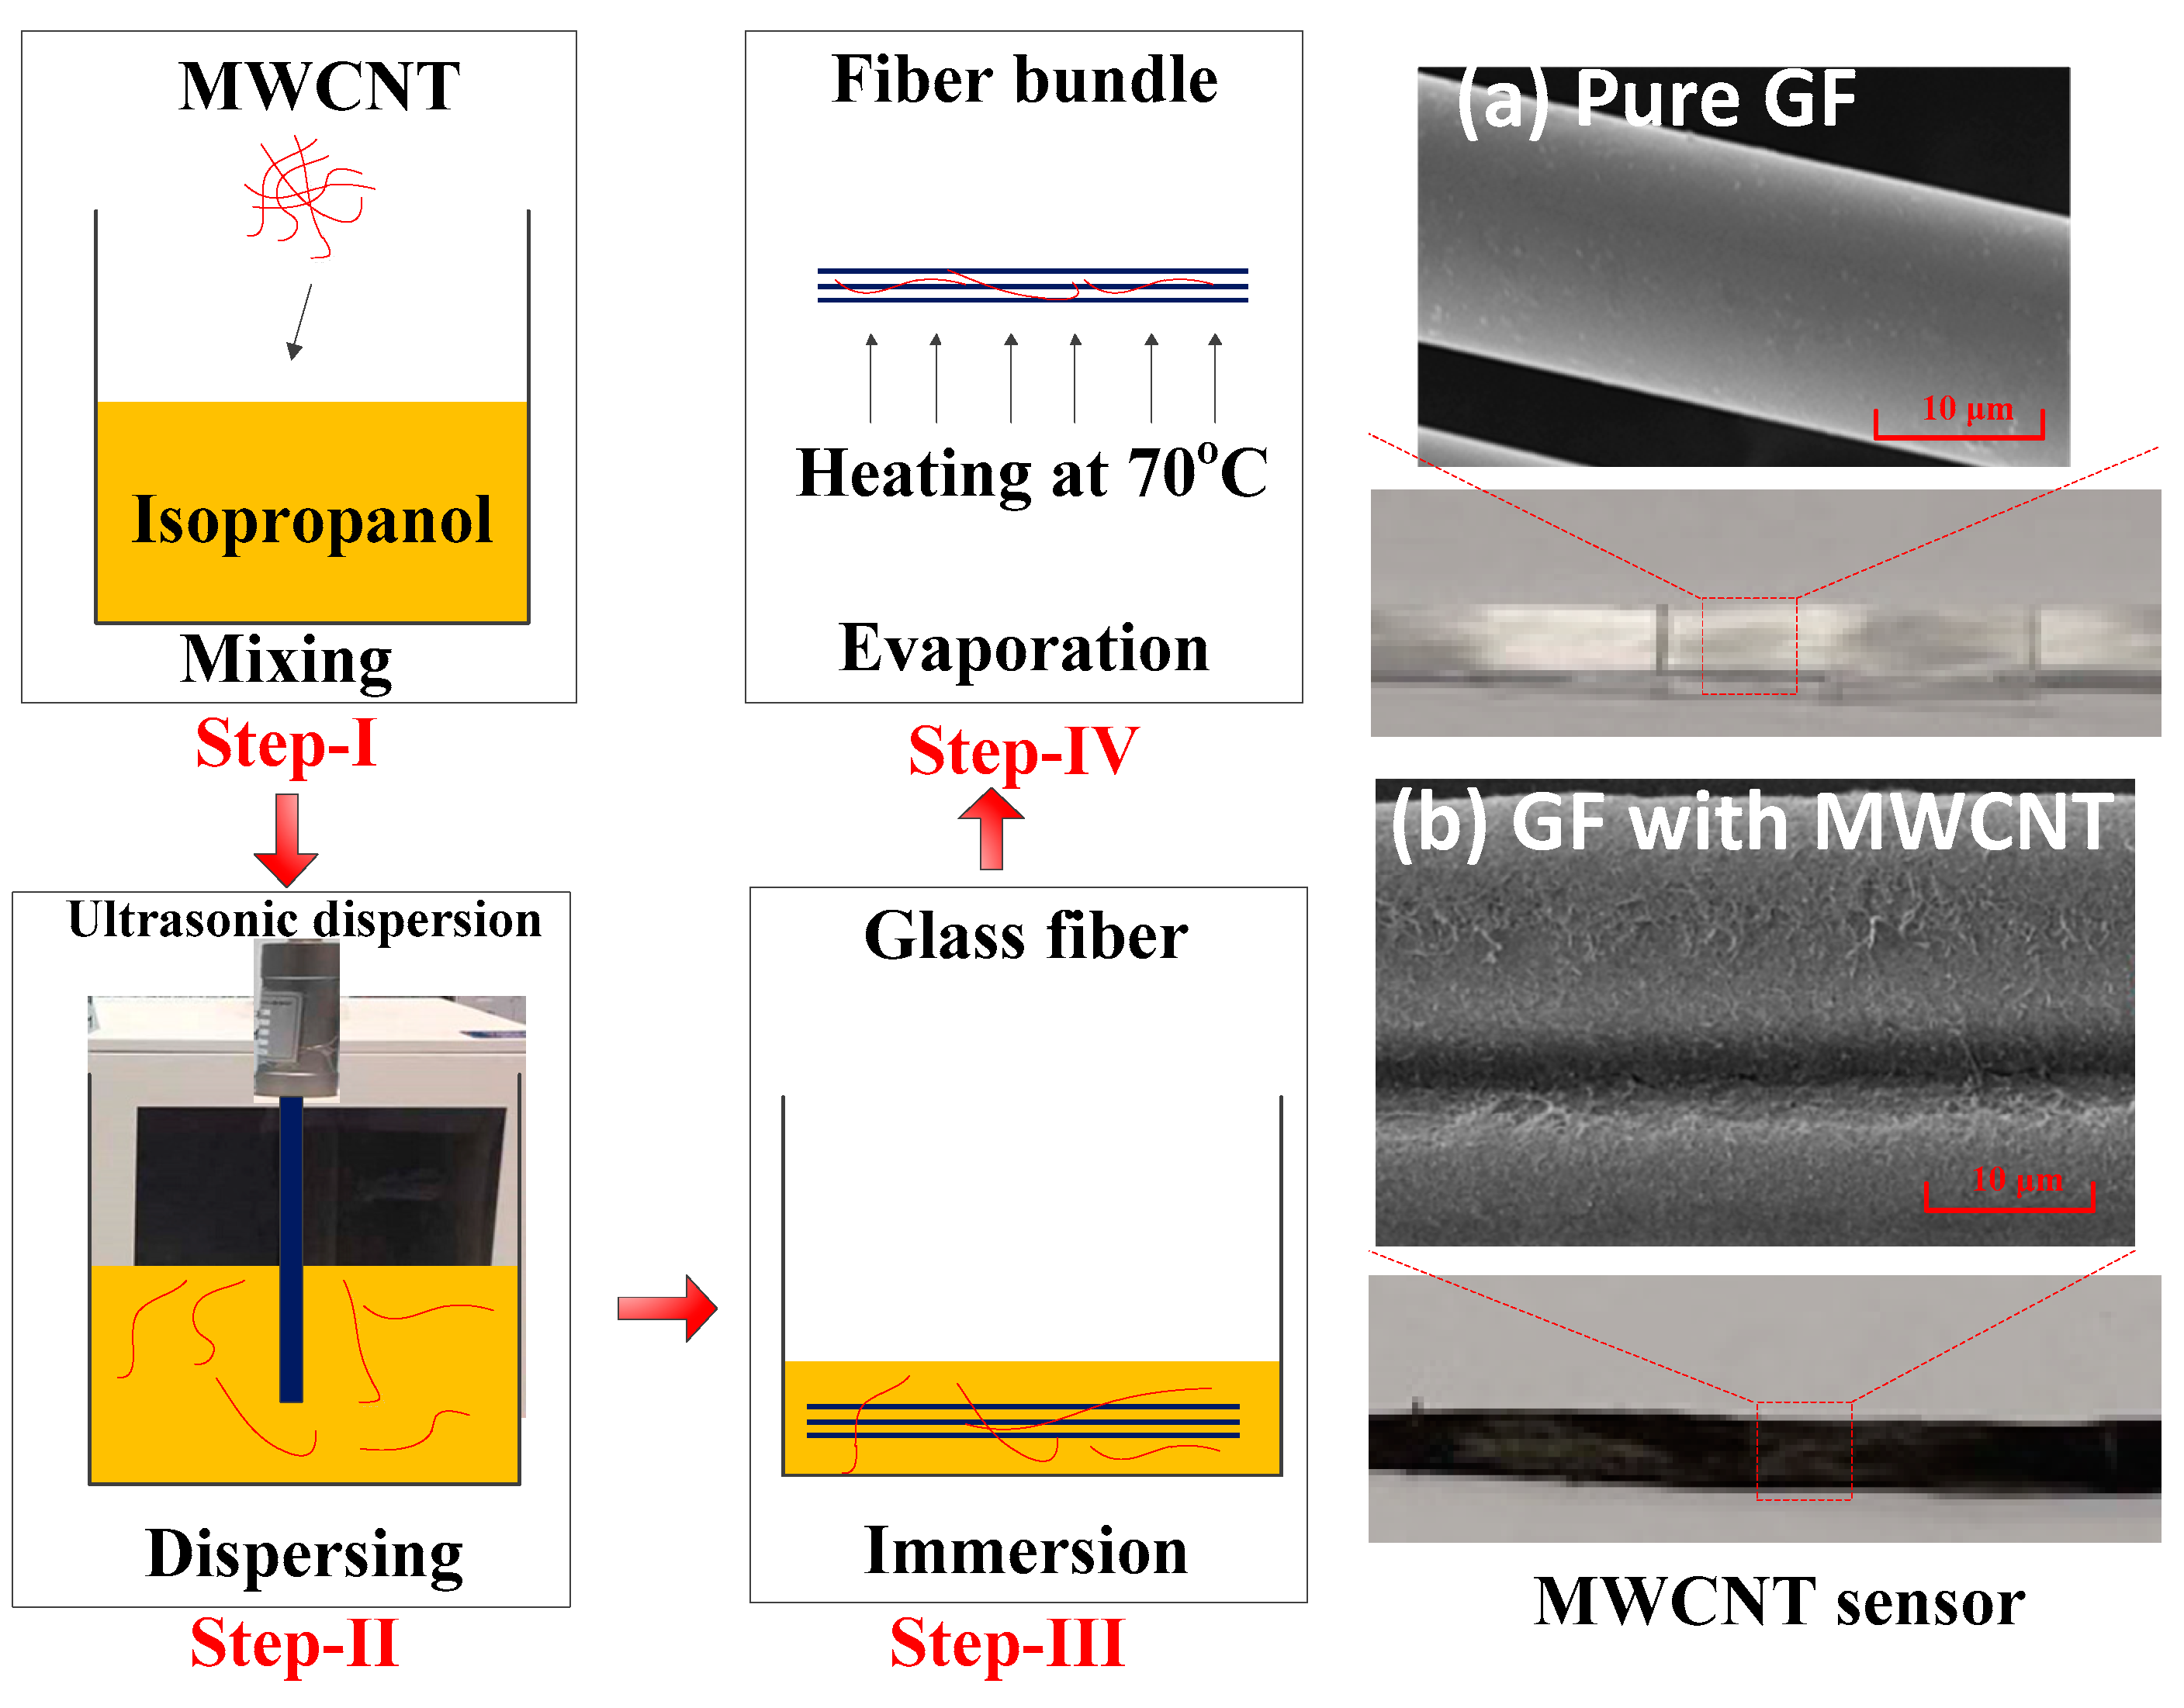
2.1. Manufacturing and Reliability Test of the MWCNT Sensor

Figure 1 shows the manufacture processing of the MWCNT sensor. In detail, the sensor is comprised of the glass fiber-bundle with coated MWCNT on the surface. The physical vapor deposition (PVD) method was adopted to deposit the MWCNT on the glass fiber surface. The first step in the PVD method is to prepare the MWCNT solution. MWCNT (-COOH functionalized, Outer diameter >50 nm, length <10 μm, and purity >98 wt %; Time Nano Technologies, Inc., Chengdu, China) was added to an aqueous surfactant solution and was treated with an ultrasonic processor at a constant output power of 300 W. The aqueous surfactant solution was prepared by dissolving sodium dodecyl sulfate (SDS; Analytical reagent >88%; General reagent Inc., Shanghai, China) in deionized water. In the second step, a glass fiber-bundle was immersed in the prepared MWCNT solution for five cycles. Each cycle requires the bundle to be in the solution for 5 s and heated at 105 °C for 5 min in order to evaporate the deionized water and deposit the MWCNT on fiber surface. The concentration of the prepared MWCNT solution was N = 6.25 mg/ml, and the content of MWCNT on the glass fiber surface was 0.0238 mg/mm. The scanning electron microscope (SEM; EVO MA 15, Zeiss, Oberkochen, Germany) observations of the MWCNT sensor are presented in Figure 1a,b. As can be seen in Figure 1b, the MWCNT was fully coated on the glass fiber-bundle. In the following monitoring work, the resistance of the manufactured MWCNT sensor was recorded by a Keithley 2700 programmable electrometer.
To verify the reliability of the MWCNT sensor, we tested the sensing ability of the sensor in the short beam shear, flexural, tensile, and fatigue test of a composite laminates, before applying it in a real filament wound pressure vessel. In the mentioned mechanical tests, the MWCNT sensor was embedded into the GF/epoxy composite laminate by vacuum-assisted resin transfer molding (VARTM) processing. The details of the VARTM processing can be found in the literature [38,39]. The mechanical tests were accomplished using INSTRON-4505 servo-electric testing machine. To evaluate the through-the-thickness properties of the sensor in the composite laminates, three cases with the sensor in the upper, middle, and bottom layer in the laminates were considered in the short beam shear and flexural test. In the tensile and fatigue tests, the MWCNT sensor was embedded in the middle layer of the laminates. During the mentioned mechanical tests, the resistance of the MWCNT sensor was recorded simultaneously [40,41].

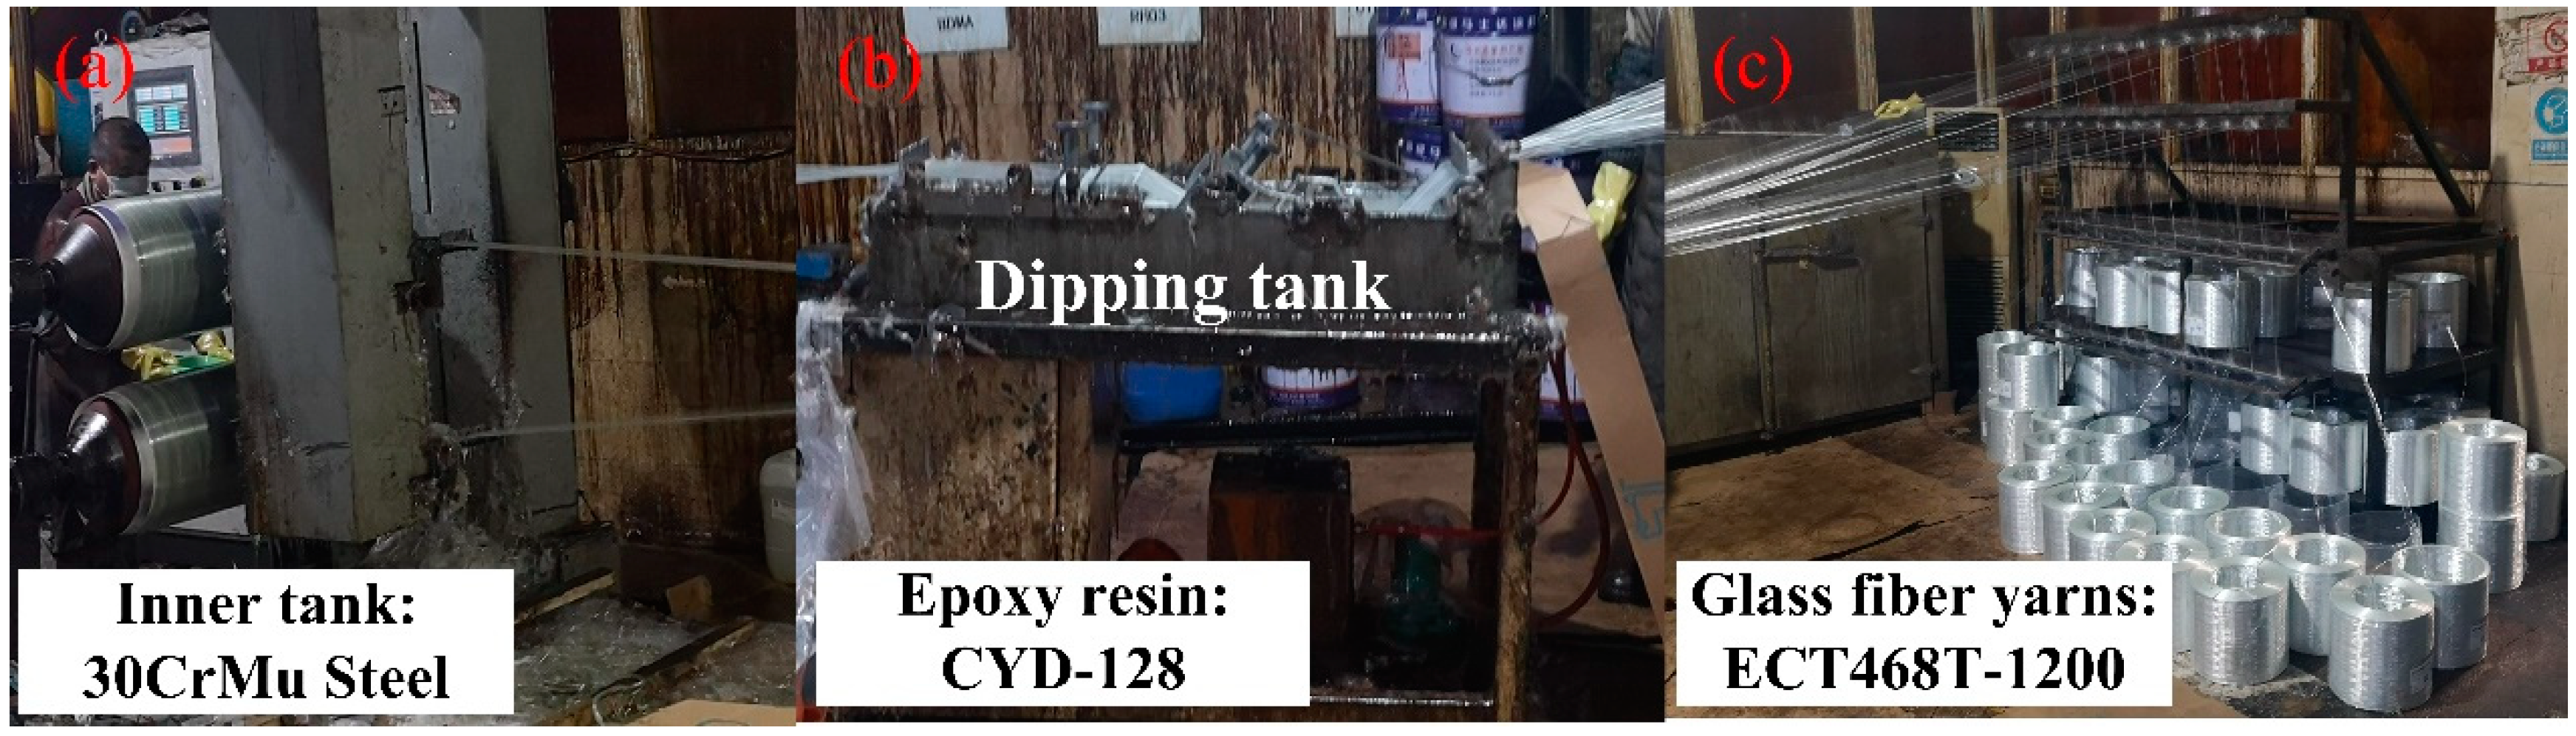
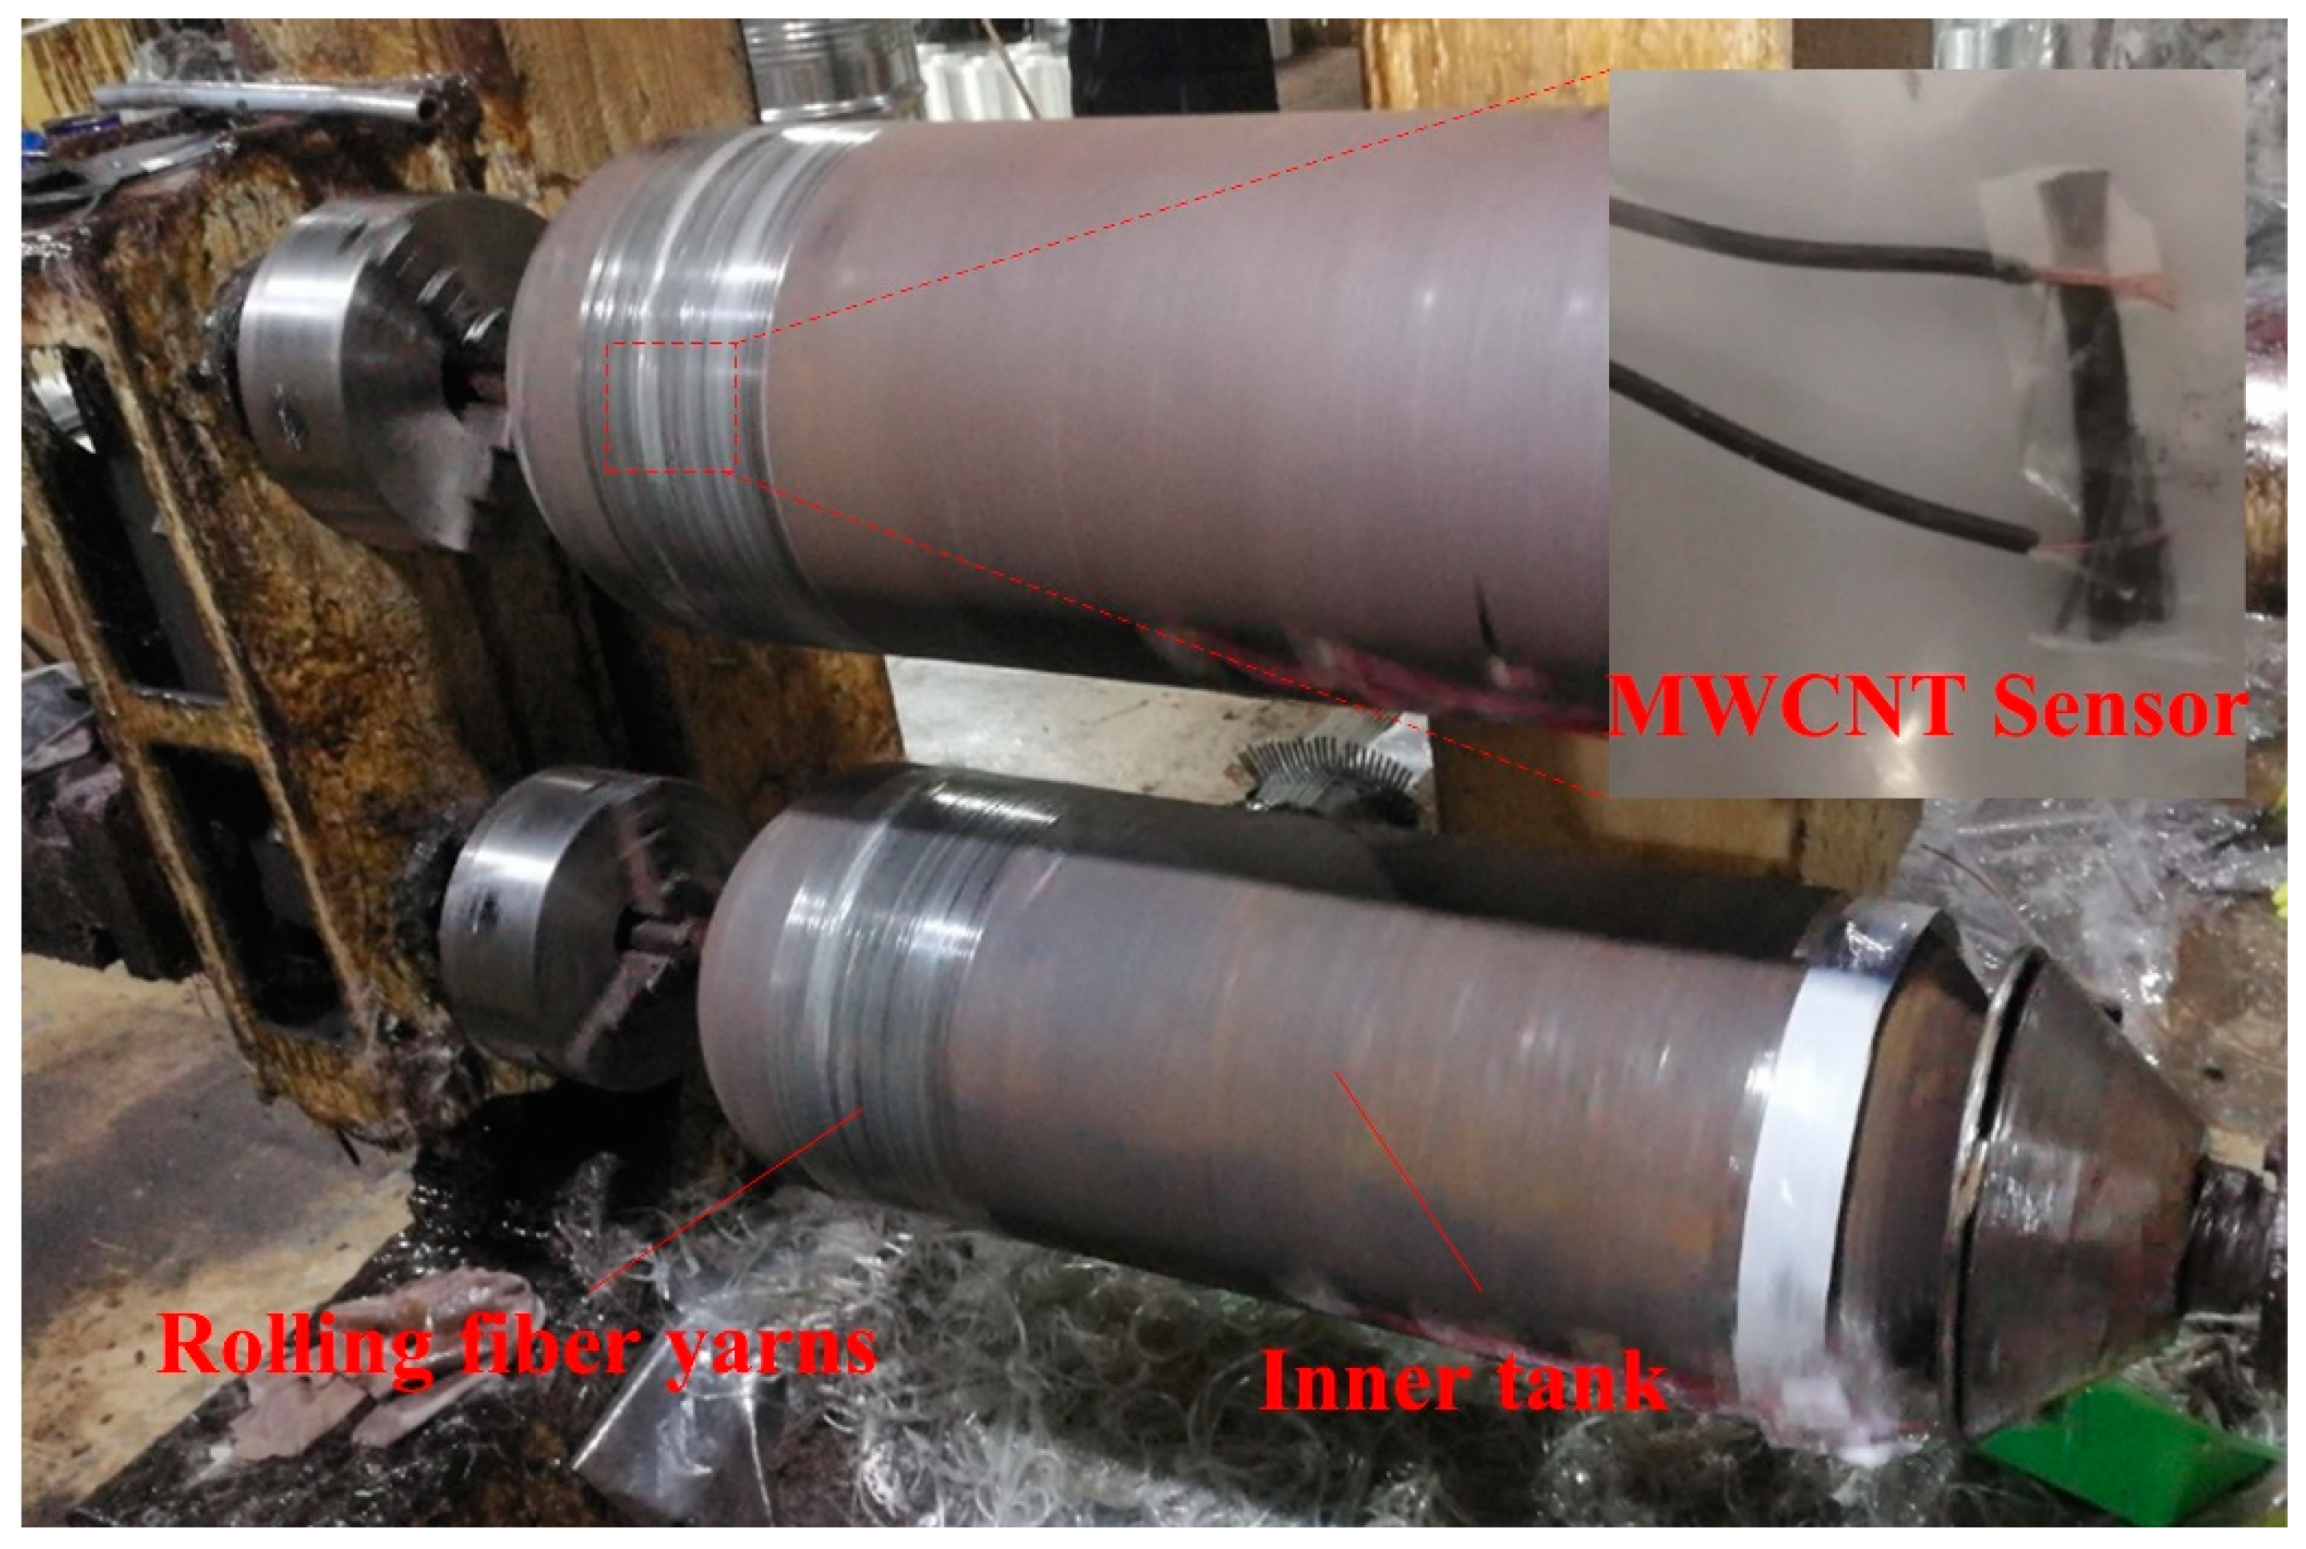
2.2. Manufacturing of the Filament Wound Pressure Vessel with an Embedded MWCNT Sensor

The filament wound pressure vessel was manufactured in Shanghai Ronghua High-Pressure Vessel Co, Ltd, Shanghai, China. It was made by filament winding around a 30CrMo steel inner tank. The manufacture processing of the filament wound composite pressure vessels is shown in Figure 2. The dimensions of the inner metal tank are as follows: the total length is 750 mm, and the diameter of the cylindrical and the hemispheric head section is 325 mm. The wall thickness of the tank is 5 mm with a design pressure of 20 MPa. The reinforced material in the composites skin is glass fiber yarn (type: ECT468T-1200, Changsheng Co., LTD, Hubei, China), with an average single fiber diameter of 20 μm. The yarns are bound on the vessel surface after going through the dipping tank. The polymer matrix in the composite skin is vinyl ester resin that can be cured at room temperature with a hardening and accelerating agent. The hardening agent is methyl ethyl ketone peroxide (MEKP), and the accelerating agent is dimethylaniline (DTLL). The amount of resin is controlled by a scraper system, to make sure the filaments are completely wetted. During winding, the excess resin is removed from the vessel surface, in order to ensure a high fiber volume ratio. The layup for the composite overwrap was [90°10/(±15°)20/90°10] during the winding process, and the pre-tension of yarn was kept constant at 40 N for all of the windings.
The developed MWCNT sensors with an active length of 20 mm were embedded in the middle thickness of the composite layer, as shown in Figure 3. Two MWCNT sensors, with the direction along the axial and the circumferential of the pressure vessel were embedded, respectively. Moreover, to verify the sensing ability of the MWCNT sensor, two strain sensors were also used in the filament wound pressure vessel. The distance between one head of the pressure vessel and the embedded MWCNT sensor was 170 mm. One strain gauge was located on the composite skin of the pressure vessel (strain gauge-1), and it had the same location as the embedded MWCNT sensor. The other strain gauge (strain gauge-2) was located on the metal cylindrical section between the head and the composite overwrap, as shown in Figure 4a.

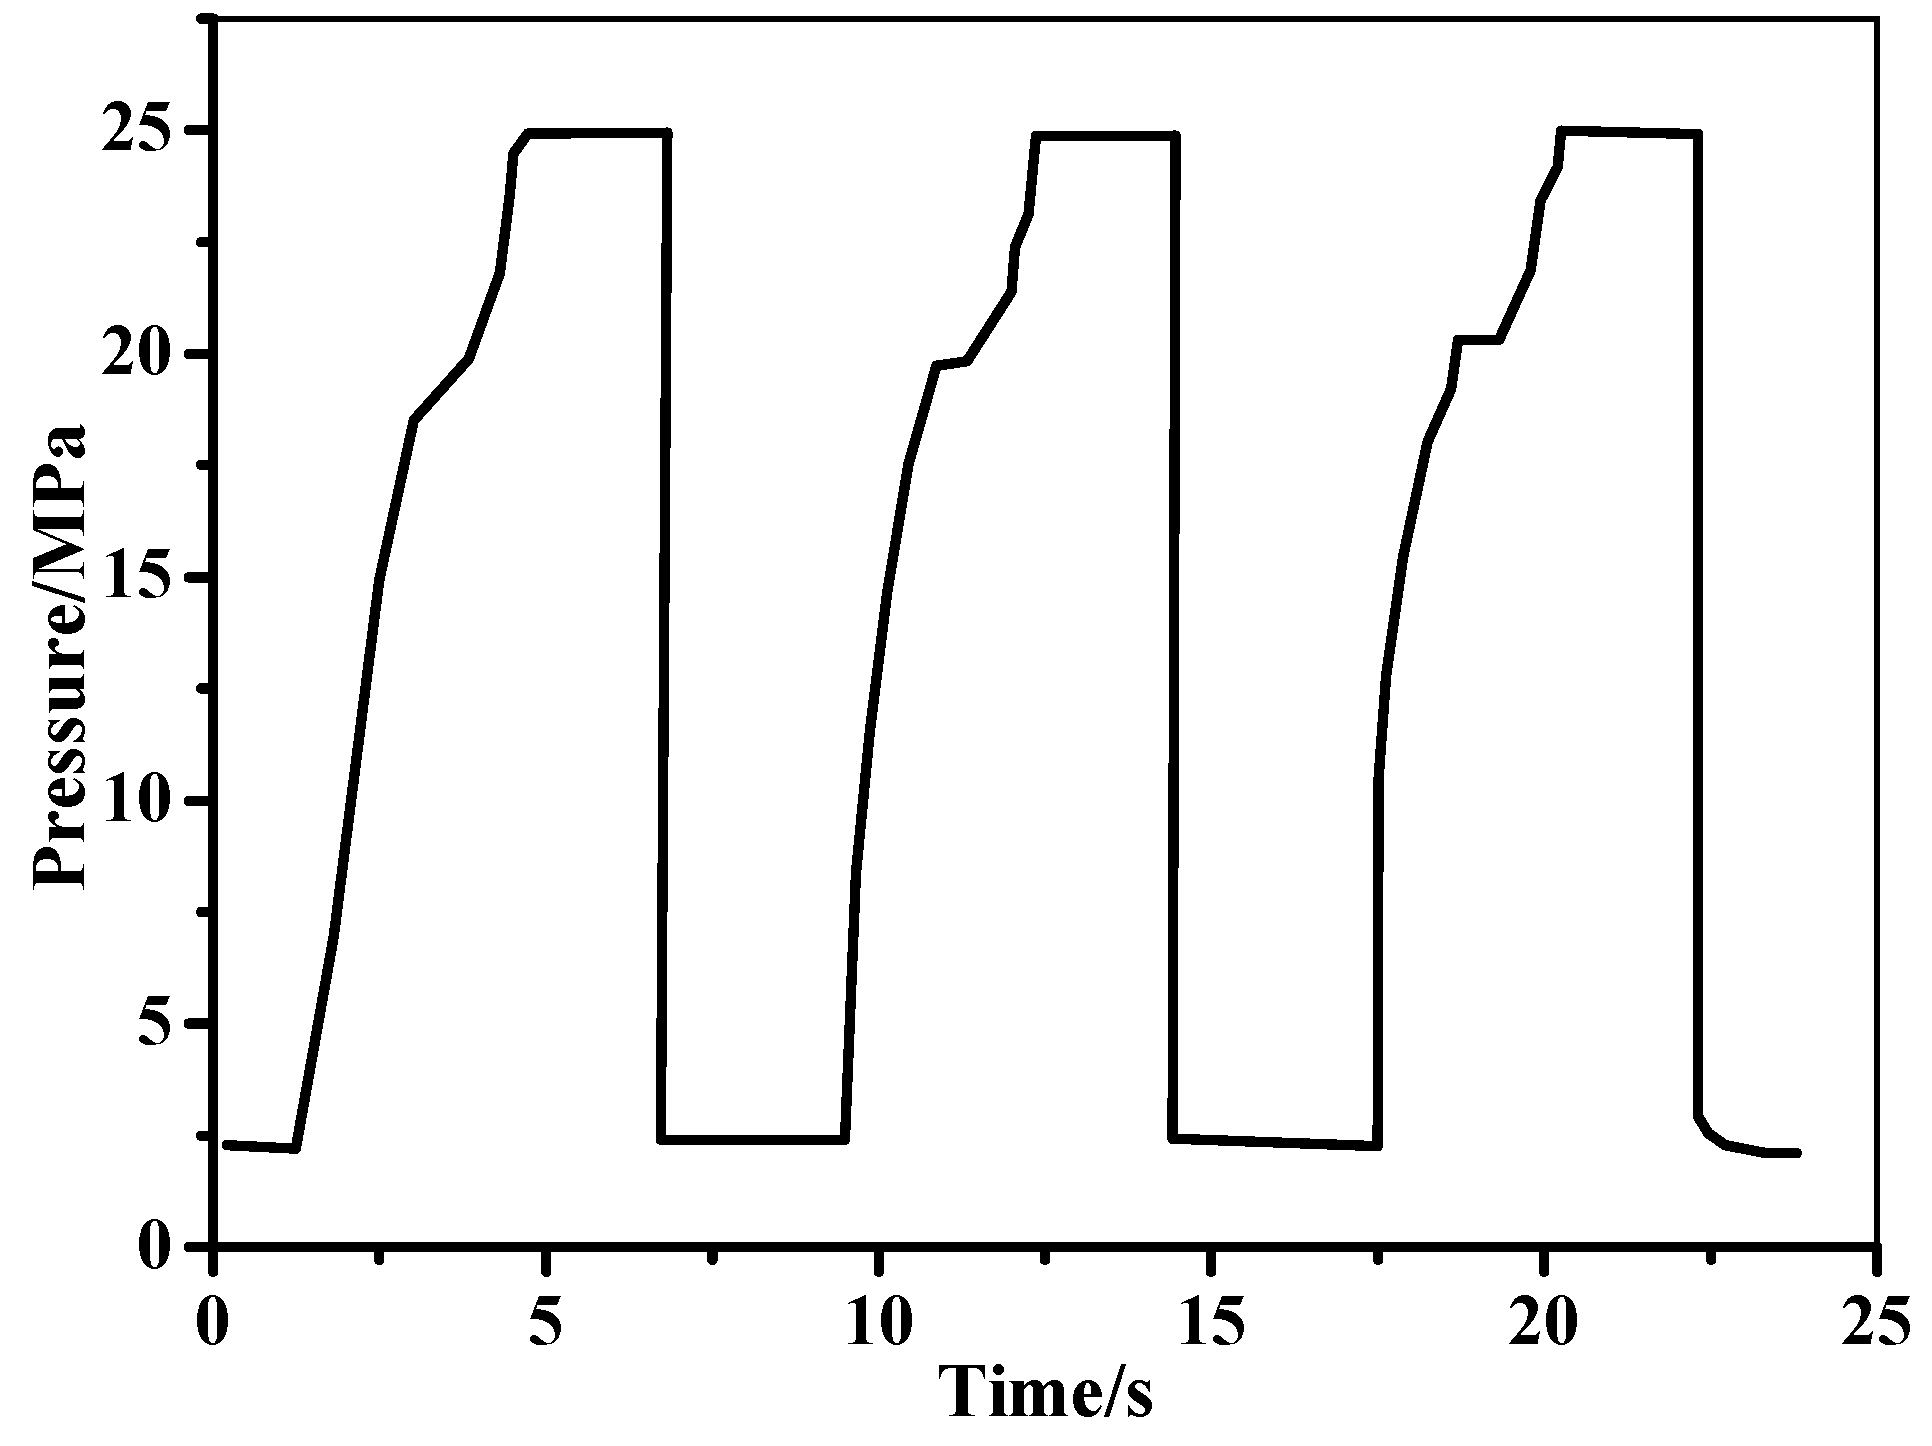
2.3. In-Situ Monitoring of Filament Wound Pressure Vessel under Hydraulic Fatigue Cycling and Pressurization

The resistance and strain of the filament wound pressure vessel hydraulic fatigue cycling and pressurization were recorded by the MWCNT and strain sensors, respectively. The hydraulic fatigue cycling parameters were set as in Figure 5, and they are detailed in Table 1. The maximum/minimum pressures in one cycle in the hydraulic fatigue pressure test ranged from 2 to 25 MPa. Pressure was applied to vessels at a rate of 7.8 cycles/min. In the pressurization, the vessel was pressurized at a rate of 0.1 MPa/s, and the experiments were interrupted until the pressure was completely blasting. An artificial defect was made on the pressure vessel to make the vessel blasting at the special location. The artificial defect was a crack that was made by a low-speed diamond saw blade cutting machine. The depth and length of the crack was 6 mm and 55 mm, respectively. The crack was located 70 mm from the head, as marked in Figure 4a. As a result of the damage morphology (shown in Figure 4b), the artificial defect on the vessel also avoided the bursting position coincidence with the sensors, thus ensuring that the sensors could sense the whole damage of the filament wound pressure vessel. Two filament wound pressure vessels were used in the experiments. One pressure vessel was firstly tested in the fatigue test for 5700 cycles, and then was tested to the burst pressure directly. The other vessel was tested in the pressurization as the reference specimen. During all of the experiments, the resistance of the MWCNT sensor and the strain were recorded by the aforementioned technologies, respectively.

3. Sensing Ability of MWCNT Sensor in Various Load Conditions

The filament wound pressure vessel generally works in a complex working environment [8,42,43]. Given the uncertainties of the MWCNT sensor in the working environment, in this section, its reliability is considered in the short beam shear, flexural, tensile, and fatigue tests, before applying the sensor in the composite skin of a pressure vessel.

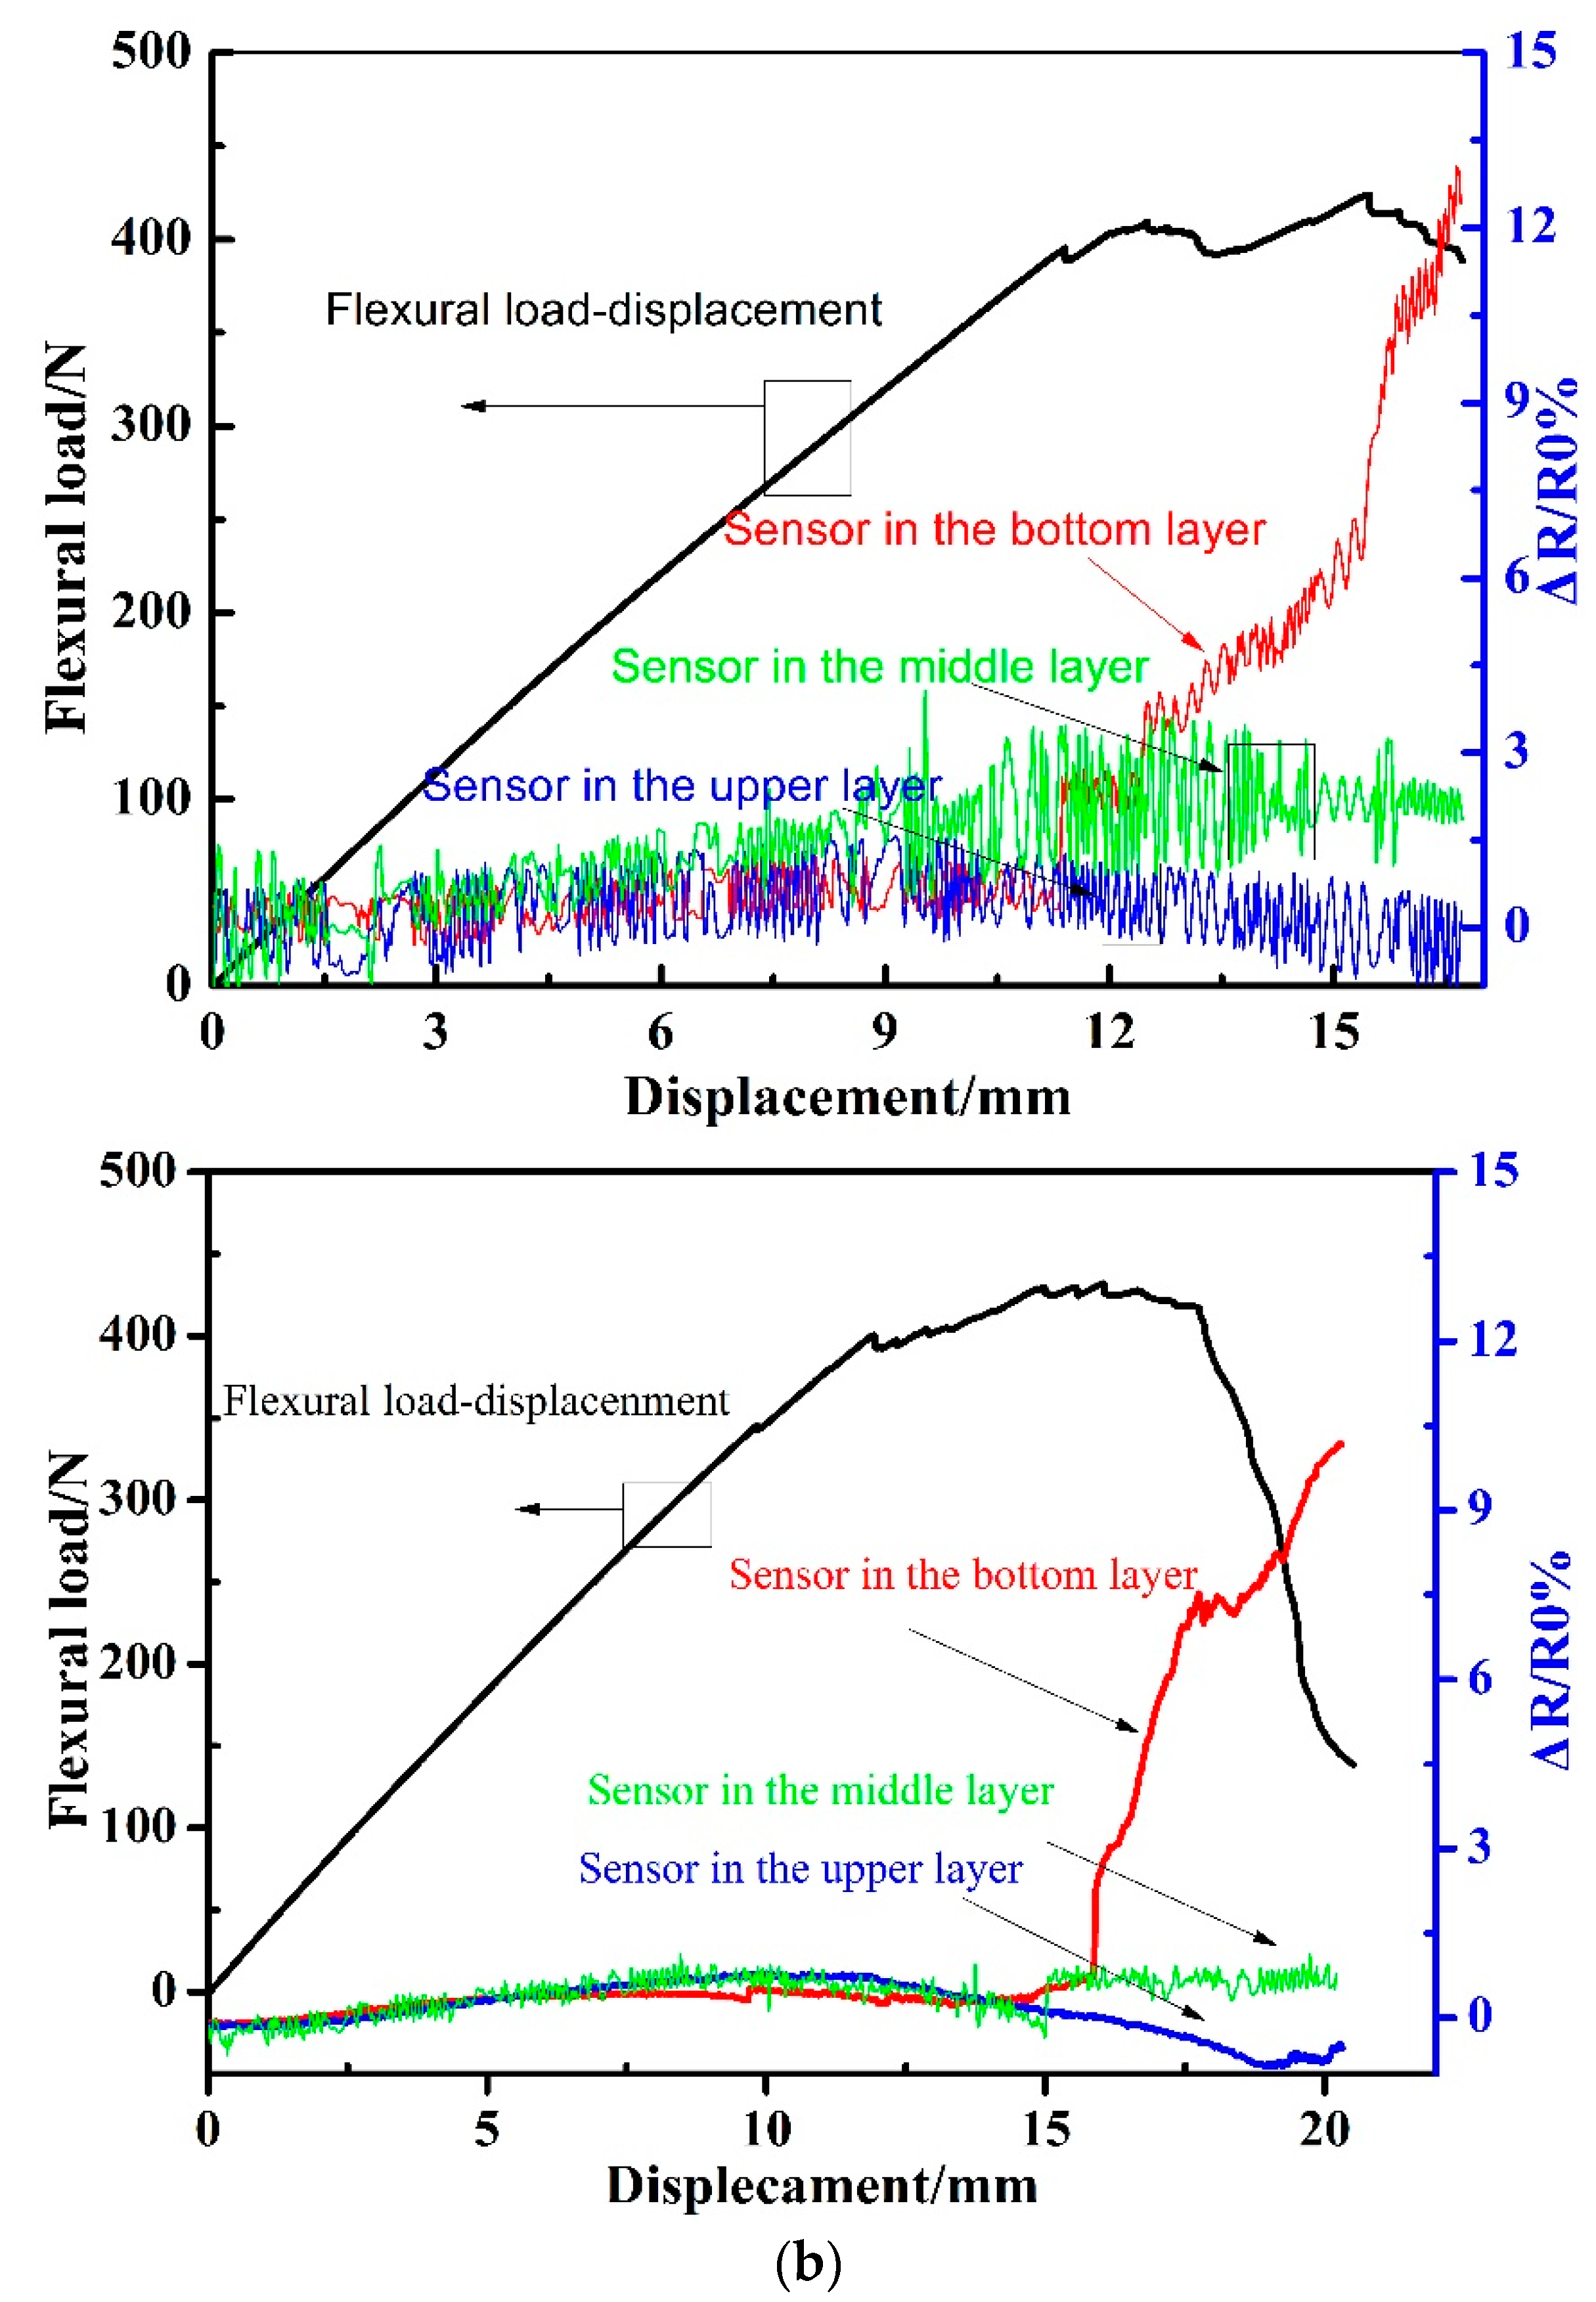
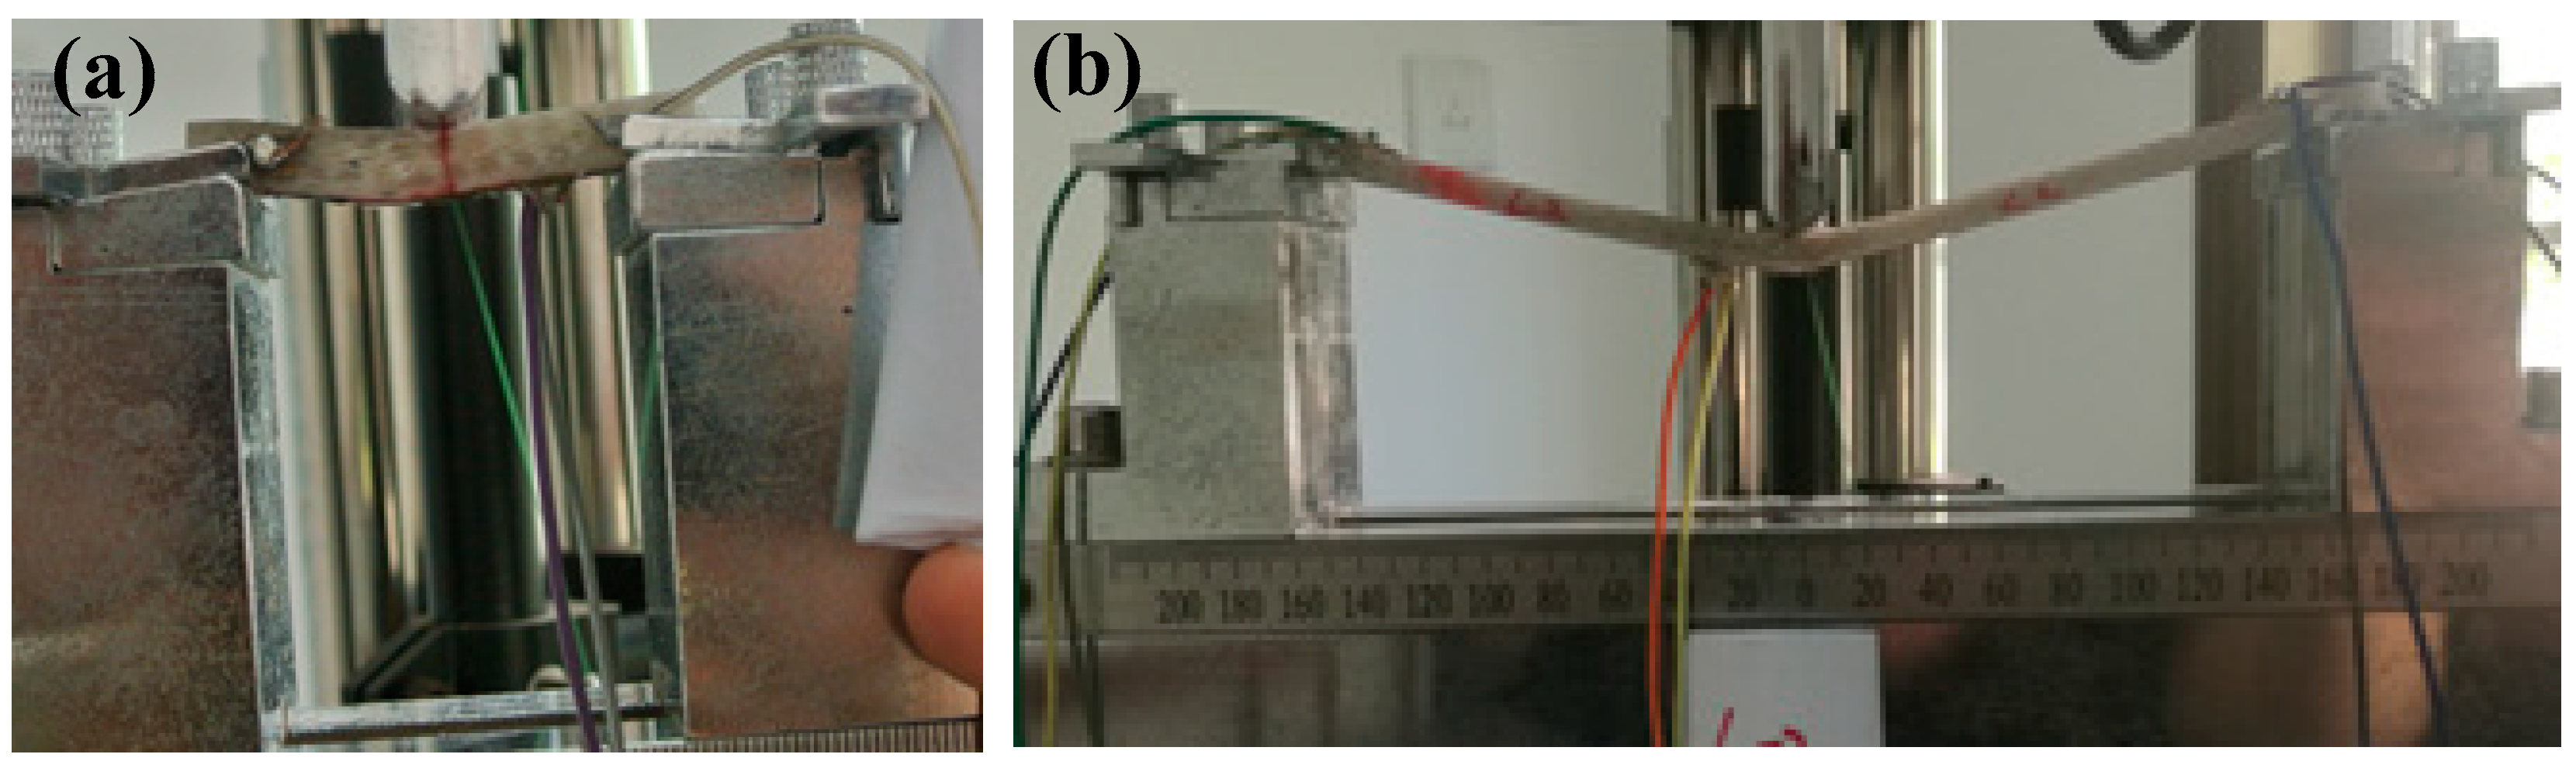
3.1. In-Situ Monitoring by the MWCNT Sensor in the Short Beam Shear and Flexural Tests

In the short beam shear test, the dimension of the specimens is 50 × 14 × 6.2 mm3 with the span of 40 mm. In the flexural test, the dimension of the specimens is 180 × 15 × 6.2 mm3 with the span of 160 mm. The experiments are carried out in the three-point-bending mode with a cross-head loading speed of 2 mm/min. The radius of the cross head is 10 mm. The composite laminates are made of a unidirectional glass fiber reinforced epoxy matrix with the stacking sequence of [0°]30. The MWCNT sensor is located between the 1/2, 15/16, and 29/30 layers in the laminates, respectively. During the test, the sensor is connected with the Keithley 2700 programmable electrometer by a conductive silver paint, as shown in the experimental setup in Figure 6. The conductive silver paint is located on both ends of the specimens with the painting width of 2 mm, to ensure full contact between the wire and the sensor in the measurement.
Figure 7 shows the load–displacement curves together with the corresponding resistances recorded by the MWCNT sensors embedded into the composite laminates. To verify the repeatable performance of the MWCNT sensor in the short beam shear and flexural test, we also give the test results of a parallel sample in Figure 7. As can be seen in the figure, all of the samples have roughly the same electrical resistance change. In the figure, the relative resistance ΔR/R0 is determined by the following:
Δ R / R 0 = R R 0 R 0 × 100 %
where R is the test resistance during loading, while R0 is the initial resistance before the mechanical tests. As can be seen in Figure 7a, the relative resistance tested by the upper/lower sensor keeps steady at 0 with the increasing of load–displacement curve, until the test finished. As a comparison, the relative resistance tested by the sensor in the middle thickness of the laminates remained at 0, before the shear load reaches to the maximum at 2.3 kN, and it starts increasing with the displacement when the shear delamination happens after the maximum shear load. It can be seen that the sensors in the upper/lower layer showed no difference in electrical resistance, while only the sensor in the middle showed a difference in resistance. This is because the damages formed in the composite laminates under a short beam shear load are the shear delamination that is located in the middle layer of the specimens. The sharp increase of relative resistance at a displacement of 2.25 mm indicates the complete delamination in the middle thickness of the laminates in the shear test. The above results indicate that the MWCNT sensor located in the middle thickness could effectively monitor the shear damage of the composite laminates. The resistance change is because of the shear deformation that severs the electrical paths, and the contact resistance is substituted by the tunnel resistance between the different MWCNTs in the sensor [30,37]. As can be seen in the flexural test in Figure 7b, the relative resistance of the MWCNT sensor in the bottom layer of the laminates could sense the flexural load–displacement well, and it shows a sharp increase when the specimen is completely damaged under the flexural load. As known, the damage region of the specimen after the flexural test can be divided into three parts, namely: compressive damage region on contact surface, fiber tensile breaking region in bottom surface, and crack region inner the specimen. As the deformation in the bottom side of the laminates in the flexural test is the largest, it causes the largest deformation, which can be easily sensed by the MWCNT sensor located in the bottom surface. The above results indicate that the developed MWCNT sensor could sense the shear load and the flexural load in the laminates well when the sensor is located in a suitable location.

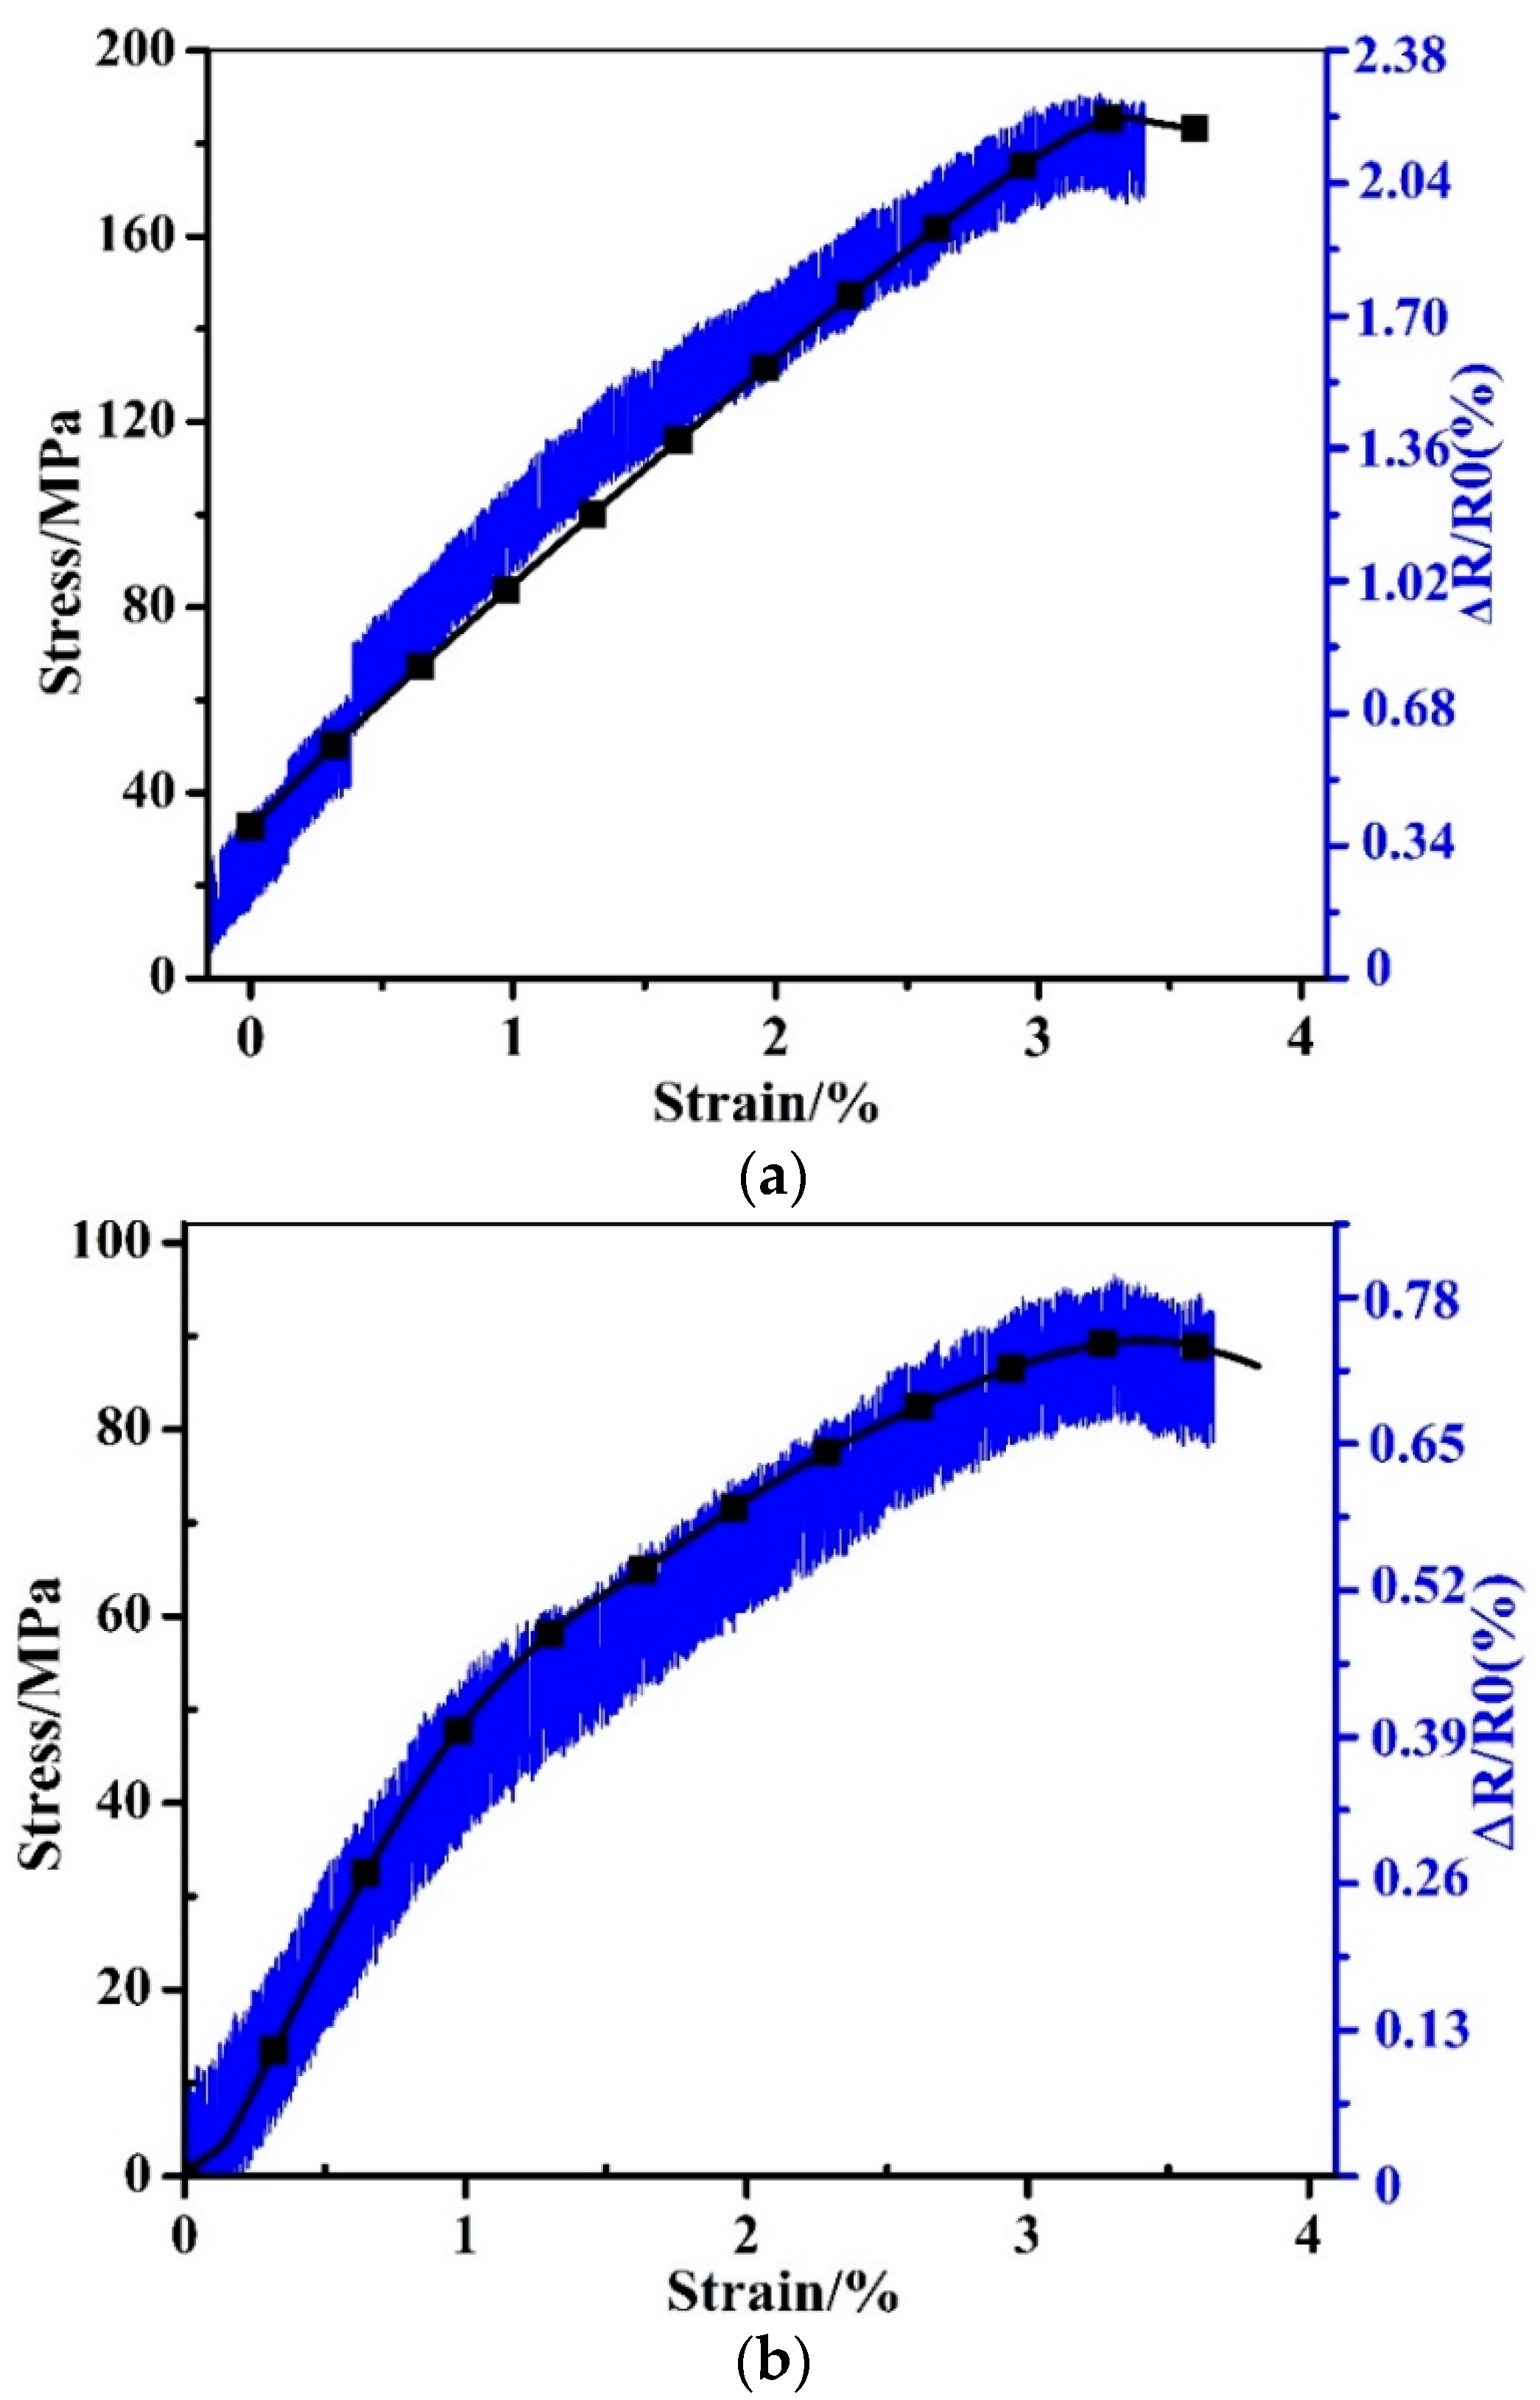
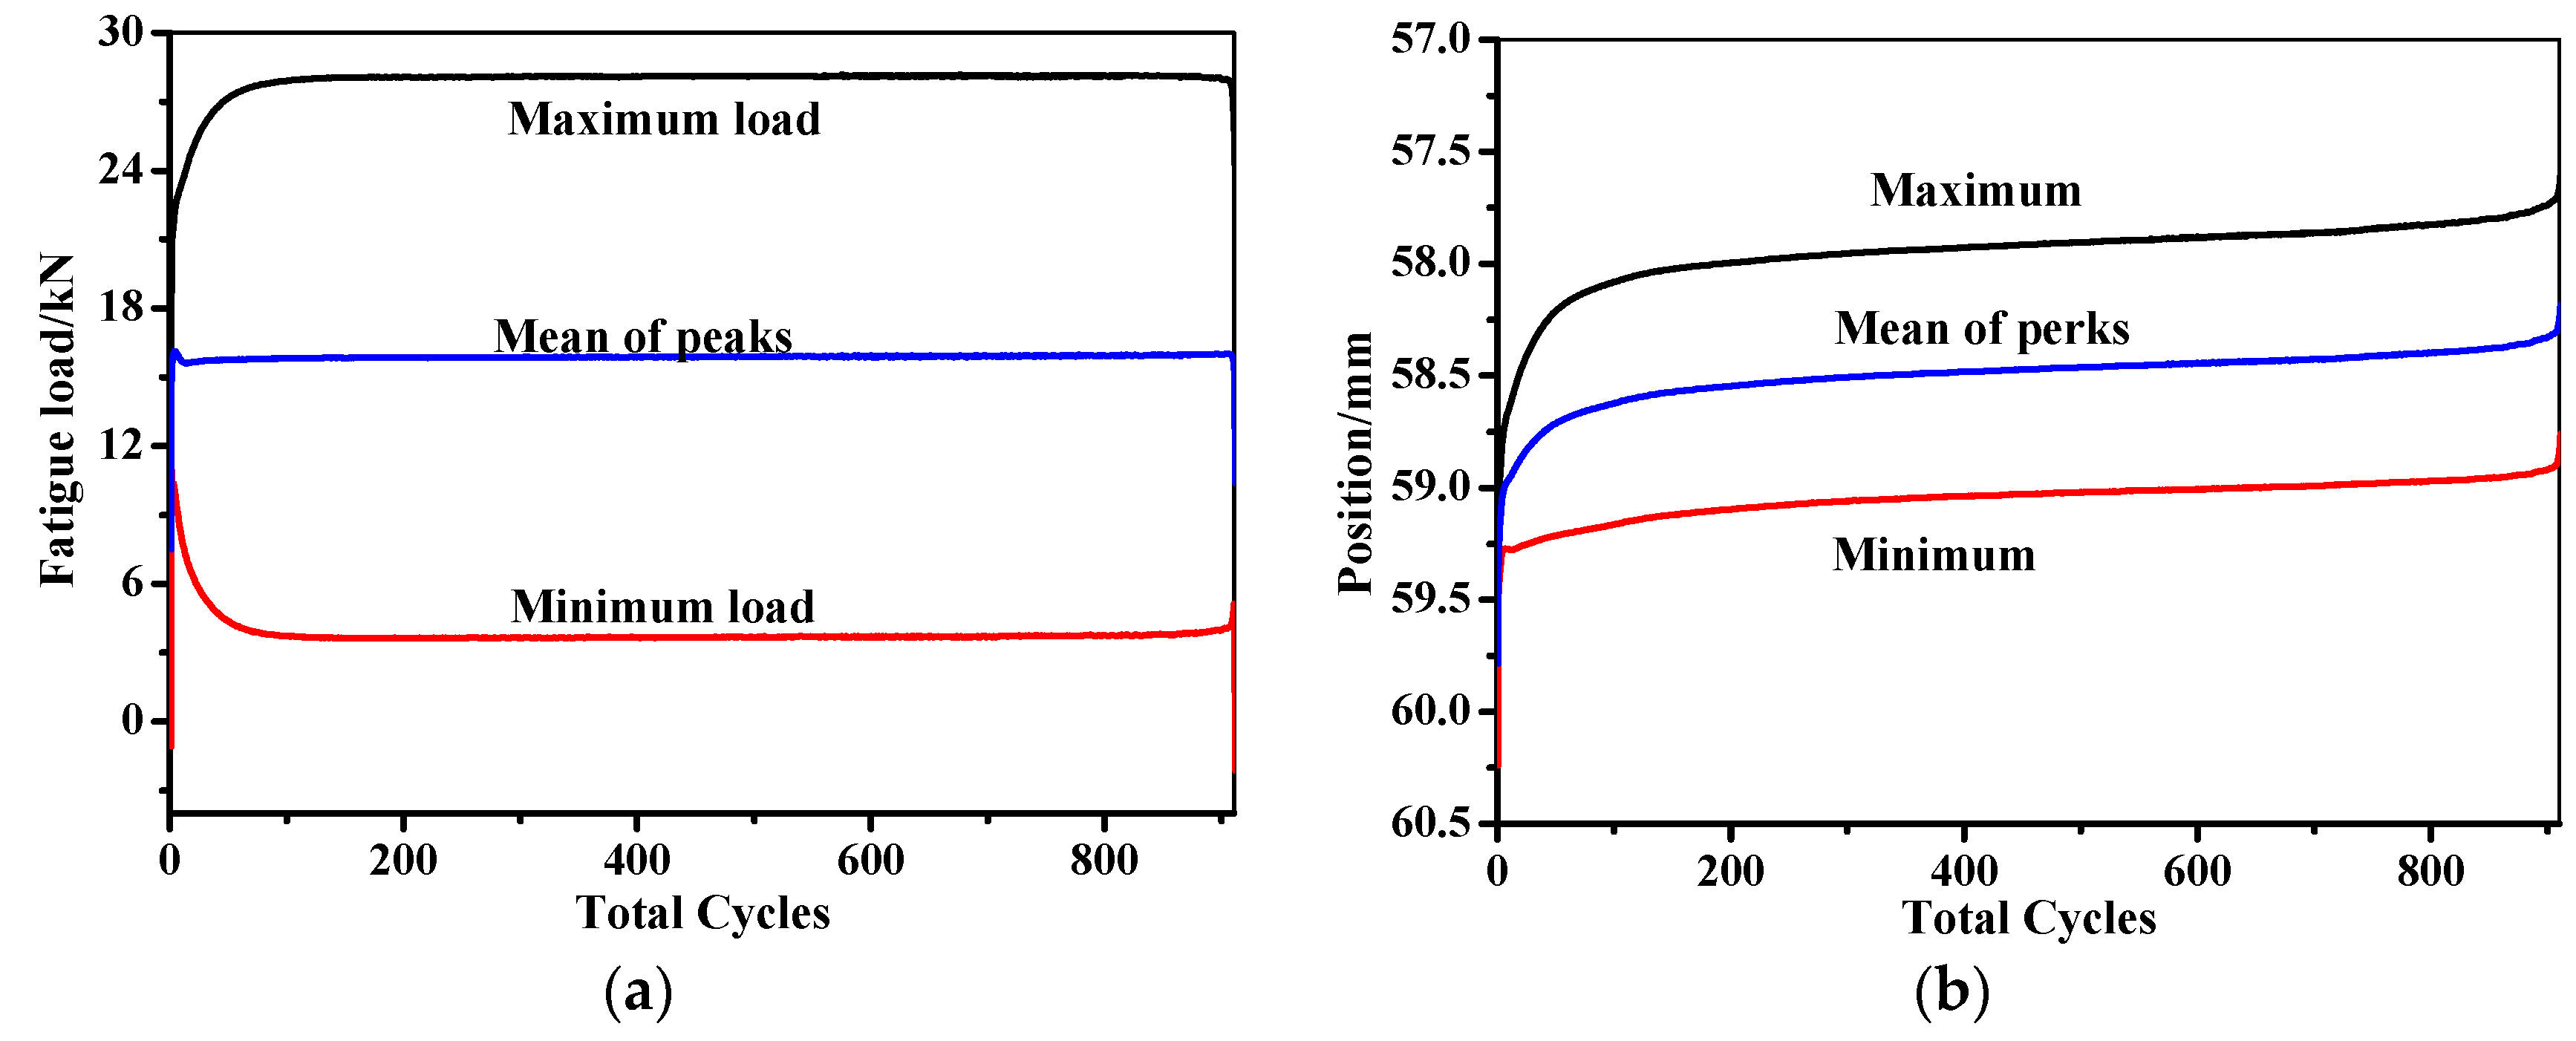
3.2. In-Situ Monitoring by the MWCNT Sensor in the Tensile and Fatigue Test of Composite Laminates

In the tensile test, the MWCNT sensor was located in the longitudinal and transverse direction of a woven glass fabric reinforced epoxy composite laminate with stacking sequence of [0°/90°]11, respectively. The sensing length in the longitudinal resistance test in Figure 8a is 200 mm, while it is 20 mm in the transverse resistance test in Figure 8b. As shown in Figure 8a, the longitudinal resistance shows an increased tendency with the increase of the tensile stress, until the test is finished at a strain of 3.5%. When the tensile stress increases from 0 to 185 MPa in the test, the relative resistance of the MWCNT sensor increases from 0% to 2.1%, simultaneously. In the case of the transverse resistance in Figure 8b, the relative resistance increases from 0% to 0.78% with the increasing tensile stress, and the tendency of the stress and the resistance as a function of the loading time matches quite well. The above results indicate that the applied MWCNT sensor could also monitor the tensile stress of the composites laminates well in both the longitudinal and transverse direction of a woven composite laminate. As discussed, the macroscopic resistance changes of the embedded MWCNT sensor are due to the fact that the conductive networks can be broken up by the appearance of damage. It should be noted that five specimens were tested in the above mechanical tests. In Figure 8, the average ΔR/R0 of the longitudinal resistance is 2.24 ± 0.13, while it is 0.70 ± 0.05 for the transverse resistance. The average test results, together with their standard deviations, of the composite laminates with and without MWCNT are listed in Table 2. As can be seen in the table, the mechanical performances of the specimens with and without MWCNT are pretty close, which means that the additional sensor did not harm the mechanical properties of the composites.
The composite laminates adopted in the fatigue test have the same dimension and stacking sequence as the specimens in the tensile test. In the fatigue test, the maximum and minimum load is set as 3 and 30 kN, respectively. The stress ratio, R, is defined as the minimum load to the maximum load in the fatigue, and is kept constant at 0.1, with a loading frequency of 5 Hz. The displacement fluctuation range in the fatigue test is 1 mm, as illustrated in Figure 9. A maximum of 1000 cycles are performed in the fatigue test. The resistance changes of the MWCNT sensor, together with the enlarged drawing curve when the loading time ranges from 182 to 183 s during the fatigue test, are shown in Figure 10. As can be seen in the figure, the recorded resistance matches the load tendency well, even when the composite laminates undergo 1000-cycle’s fatigue. The results verified that the mentioned monitoring method by the developed MWCNT sensor also has the potential for in-situ sensing the fatigue stress of the composite skins in the filament wound pressure vessels.

4. Applying the MWCNT Sensor in Composite Pressure Vessel

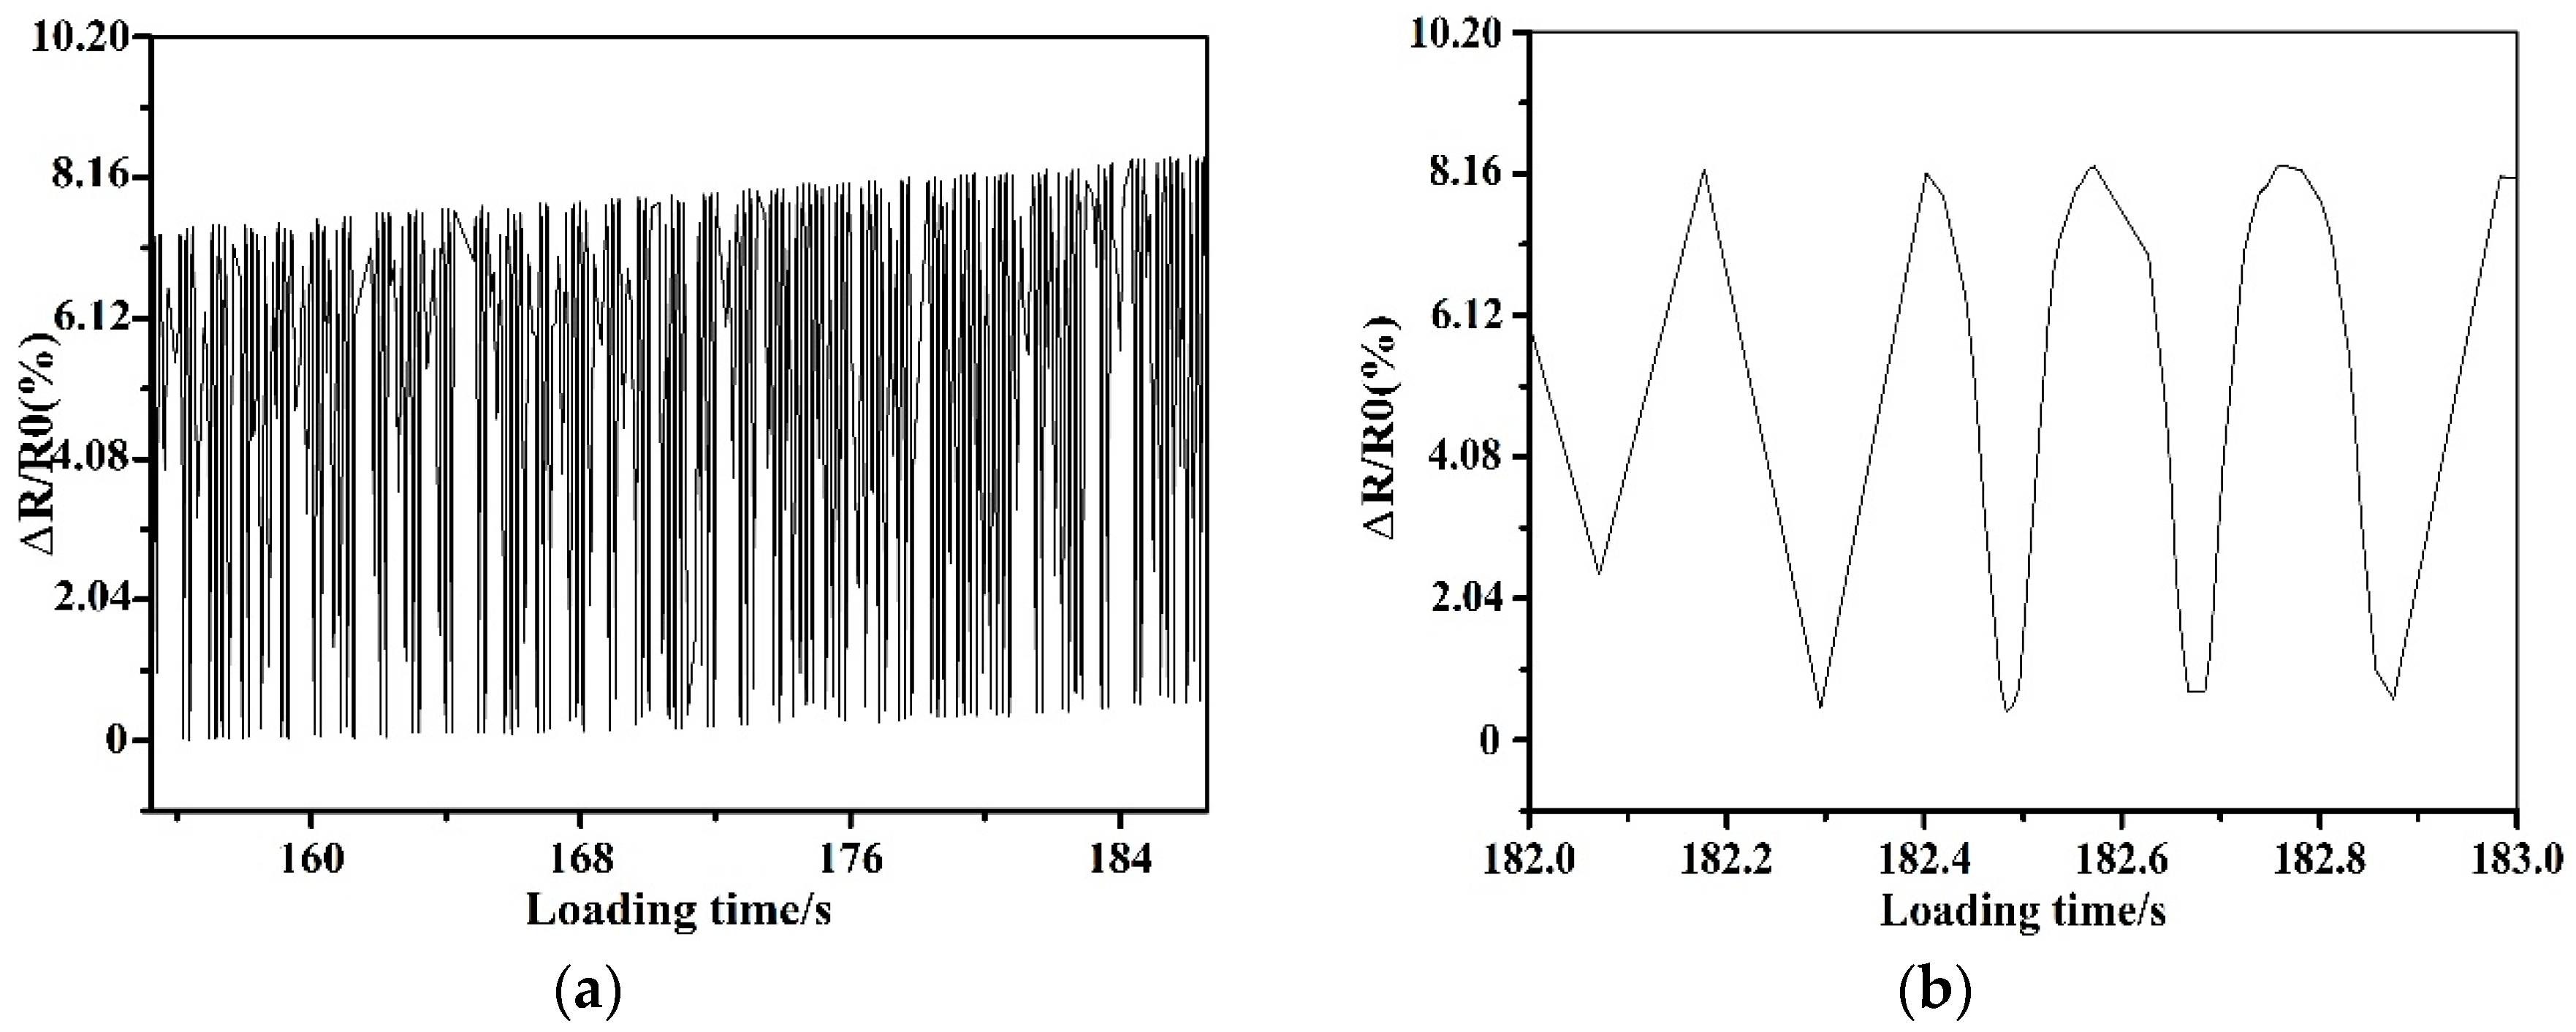
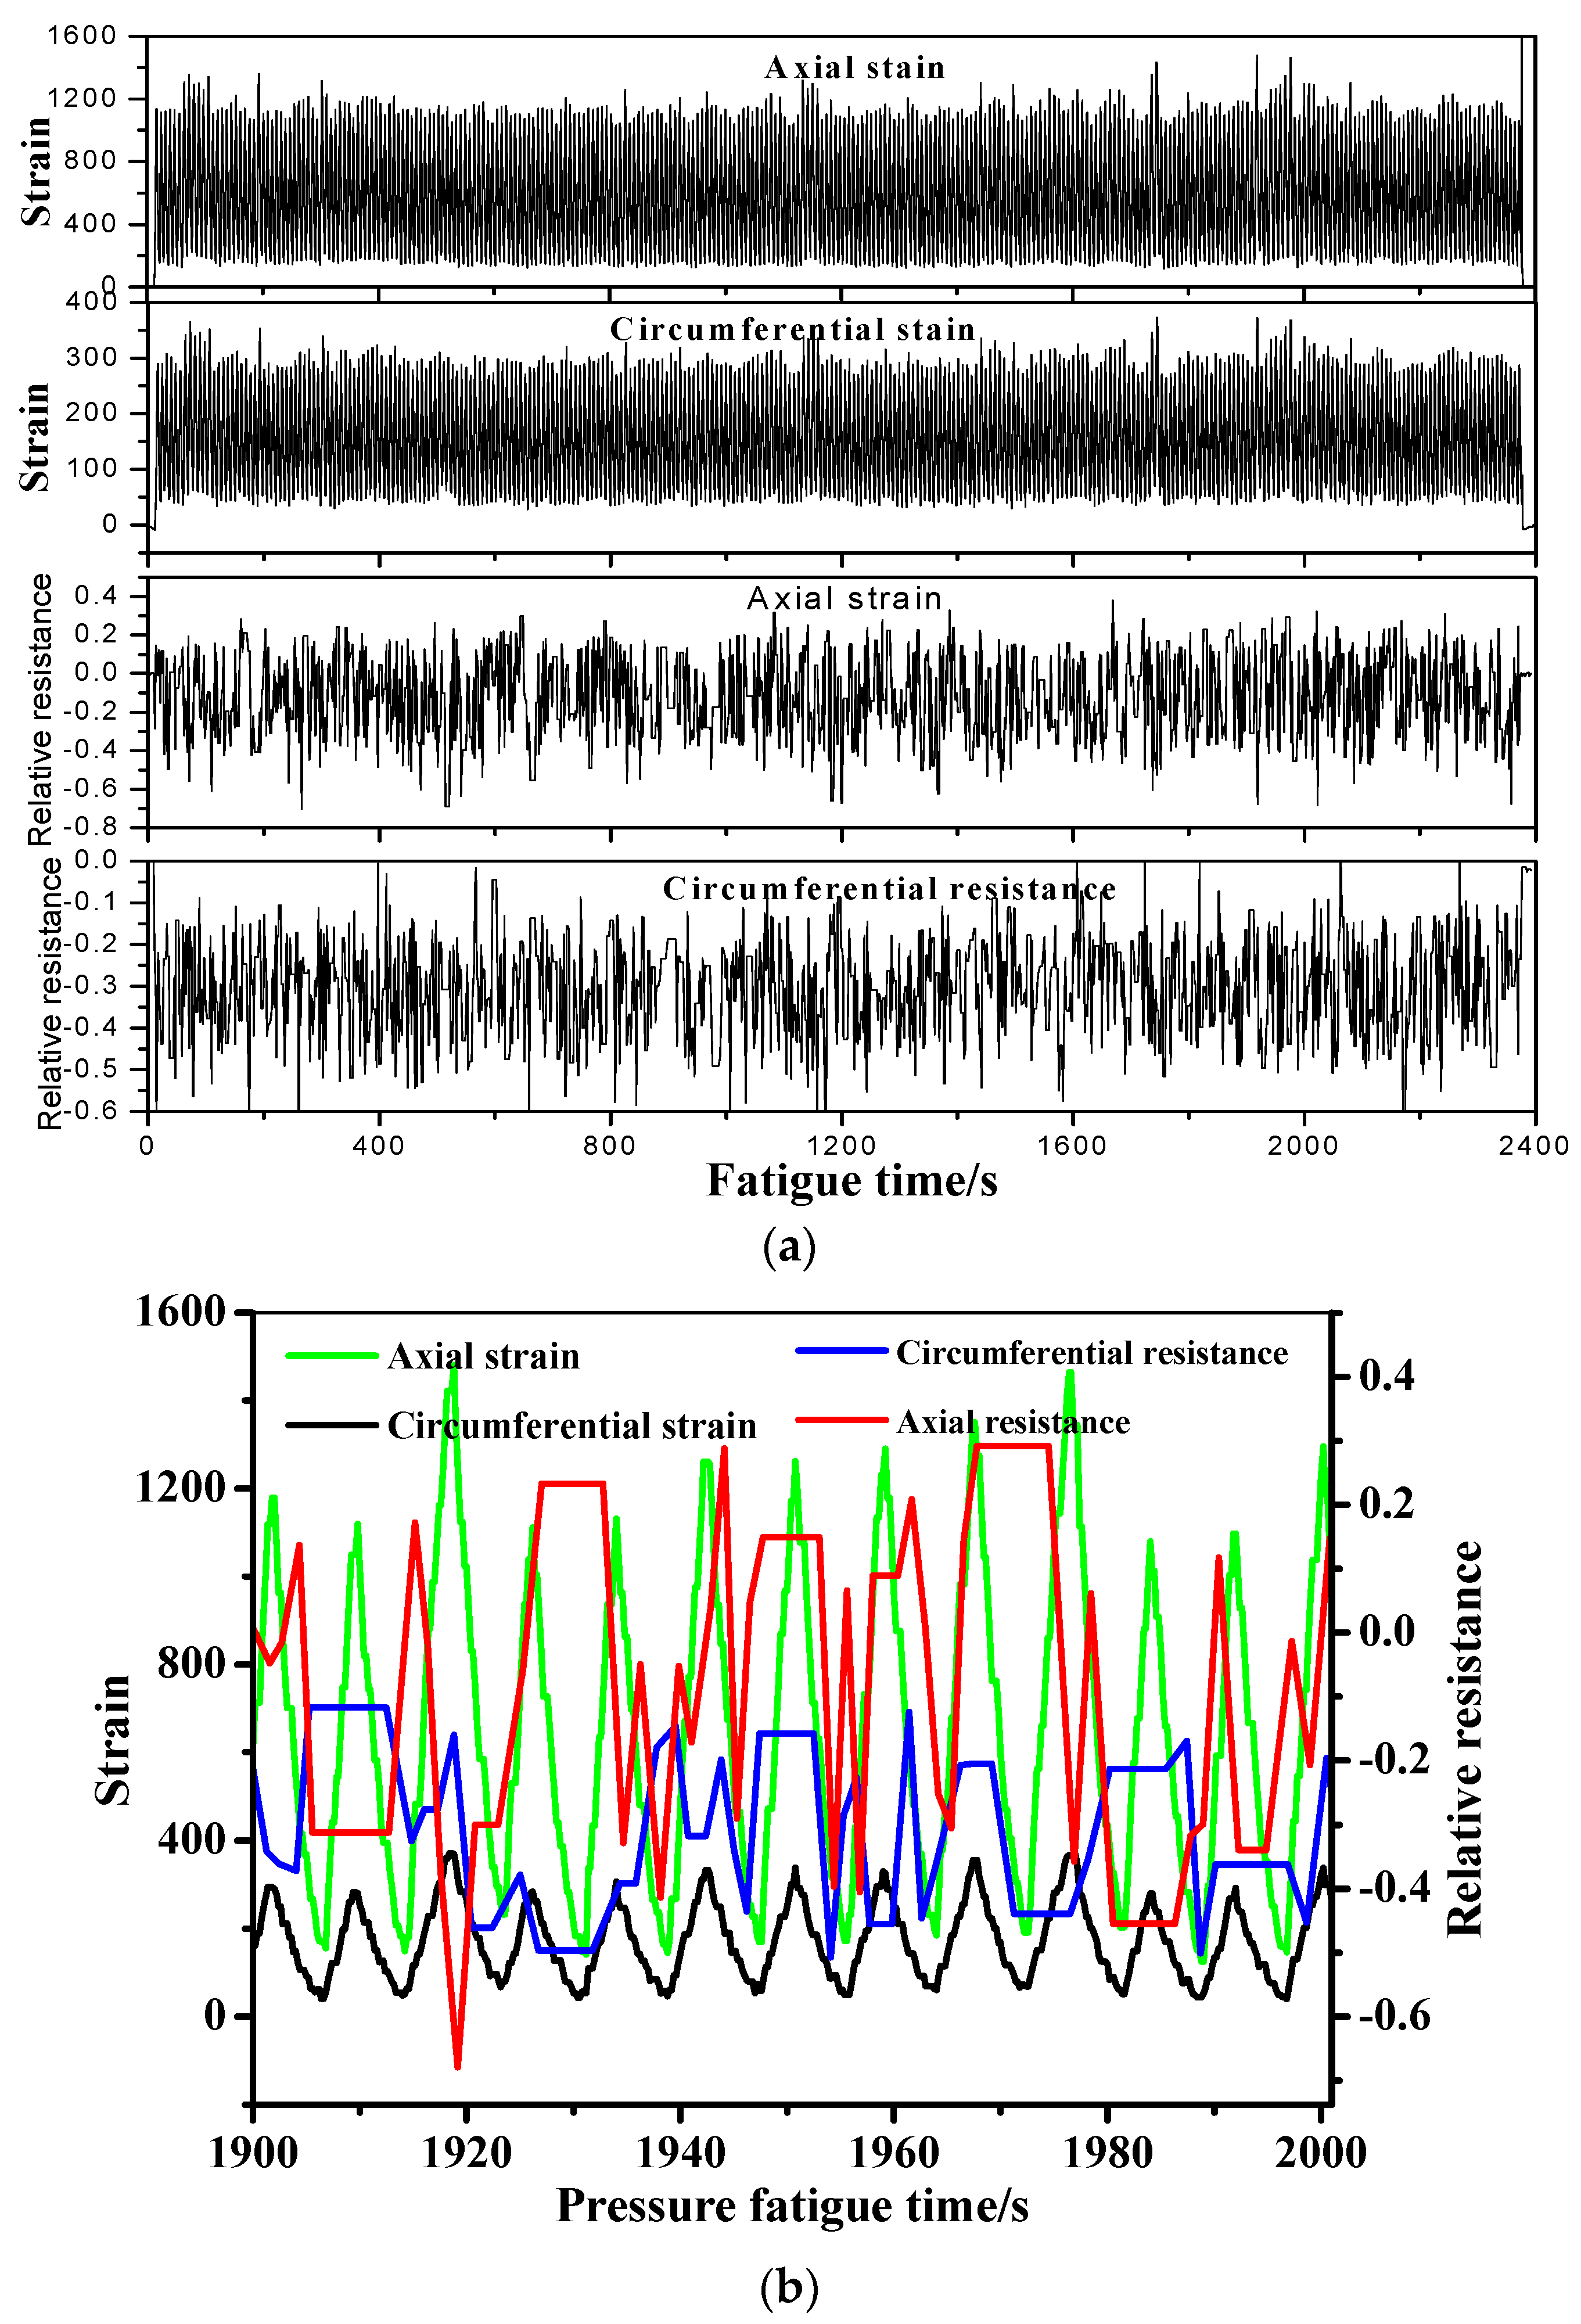
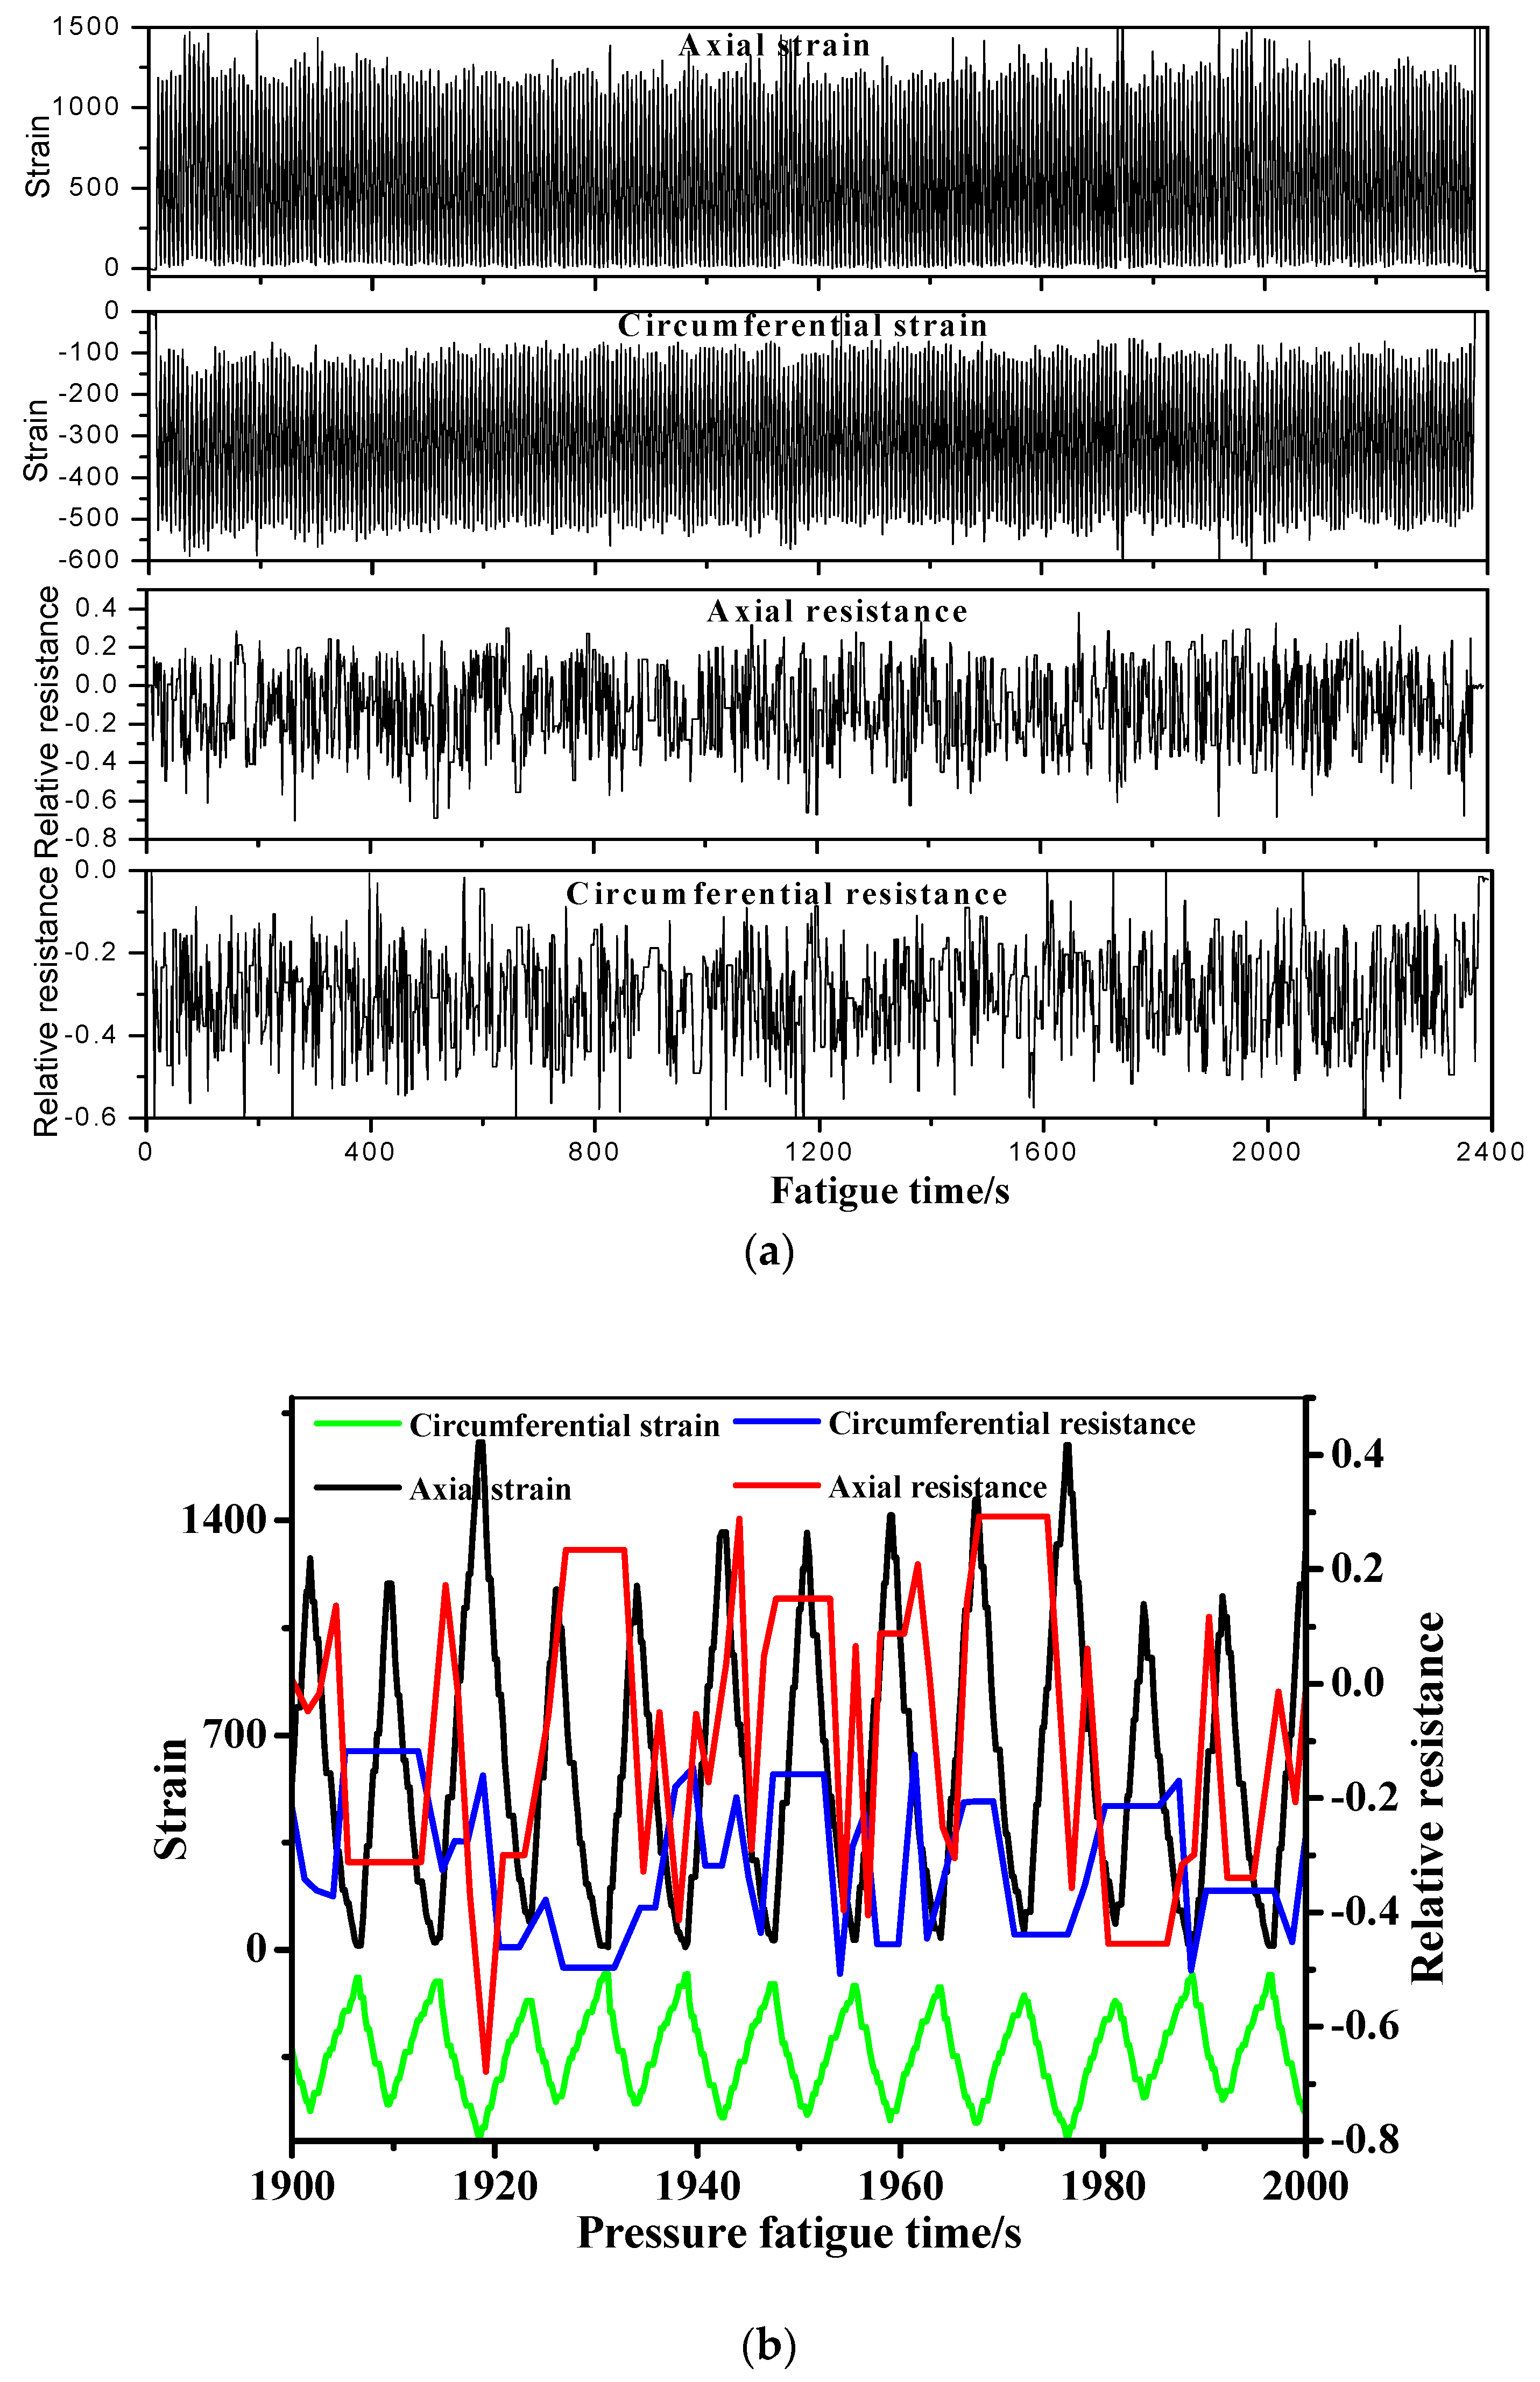
4.1. In-Situ Monitoring of the Pressure Vessel during Hydraulic Fatigue Cycling

Figure 11a shows the recorded axial and circumferential relative resistance and strain as a function of the pressure fatigue time. The hydraulic fatigue is between 2100 to 2400 cycles. To show the detailed information of the monitoring signals, the enlarged drawing curve between 1900 to 2000 s is shown in Figure 11b. For the pressure vessel in pressurization, the axial strain is generally larger than the circumferential strain [9]. The strain tendency in Figure 11b also verifies this conclusion. In the fatigue test, the minimum and maximum axial/circumferential strain fluctuate from 179 to 1295 and 48 to 334, respectively. The relative resistance of the MWCNT sensor varies from −0.31 to 0.235 and −0.435 to −0.204, in accordance with the fatigue parameters in Figure 5. It should be noted that the pressure holding time is also reflected by the small platform in the resistance–fatigue time relationship in Figure 11b. Because the MWCNT sensor is embedded in the middle thickness of the composite skin of the pressure vessel, we also compared the resistance signal with the strain measured by strain gauge-1 in Figure 4. Figure 12 illustrates the comparison of the results between the composite stain measured by strain gauge-1 and the relative resistance of the MWCNT sensor in the hydraulic fatigue cycling from 2100 to 2400 cycles. As can be seen in the figure, the axial and circumferential composite strain varies from 70 to 1468 and −546 to −105, respectively. Compared with the strain measured by strain gauge-2 on the inner tank, the axial/circumferential strain on the composite skin are larger in the same loading condition. This phenomenon is mainly due to the lower stiffness of the composite laminates. Meanwhile, the larger radius of the composite layer also leads to a larger stain than that of the inner tank under the same inner pressure. The tendency of the relative resistance matches the composite strain well, which further validates the feasibility of the developed MWCNT sensor applied in the in-situ monitoring of the filament wound pressure vessel.
The in-situ monitoring results of the MWCNT sensor in the filament wound pressure vessel during hydraulic fatigue cycling up to 5700 cycles are shown in Figure 13 and Figure 14. In the figures, the sensing resistance is also compared with the strain of the metal tank and the composite skin in the axial and the circumferential direction of the vessel, respectively. The minimum/maximum relative resistance in the circumferential direction changes from −0.443 to −0.18, while it changes from −0.4 to 0.2 with the applied pressure in the vessel in the axial direction. For the stain in the metal tank, the circumferential/axial strain changes from 20 to 240 and 120 to 993, respectively. In the case of the stain measured by strain gauge-1 on the composite skin, the circumferential/axial strain changes from −505 to −115 and 74 to 1165, respectively. It should be noted that the signals from the MWCNT sensors do not appear to match the fatigue cycles in Figure 11, Figure 12, Figure 13 and Figure 14. This is because the tank/composite interface could interfere with the deformation transfer in the composite under fatigue. Thus, the deformation inner in the middle thickness of the composite skin in each fatigue cycle does not match the fatigue loading well. The complex damage mechanism of the composite skin of the pressure vessel under fatigue leads to the resulting data in Figure 11, Figure 12, Figure 13 and Figure 14. Table 3 summarizes the equivalence relationship between the resistance tested by the embedded MWCNT sensor and the two strain gauges in different directions. The relative resistance and strain listed in the table are calculated by the difference between the maximum and the minimum value, respectively. The relationship in Table 3 can be used to quantificationally evaluate the strain status in the metal tank and the composite layer when using the developed MWCNT sensor, to monitor the health status of the filament wound pressure vessel. For example, in the fatigue cycles between 2100 to 2400, the measured relative resistance (0.545) in the axial direction by the MWCNT sensor is equal to the strain of 1100 and 1398 measured by the strain gauges, respectively. Moreover, the strain of the two strain gauges as a function of fatigue cycles is listed in Table 4. As can been seen in the table, the residual strain is found for the pressure vessel after fatigue, and the residual strain of the composite skin is generally larger than that of the metal tank. The residual strain indicates that the filament wound pressure vessel is damaged in the hydraulic fatigue cycling. Therefore, in the following work, we also investigate a health vessel as the reference experiment.

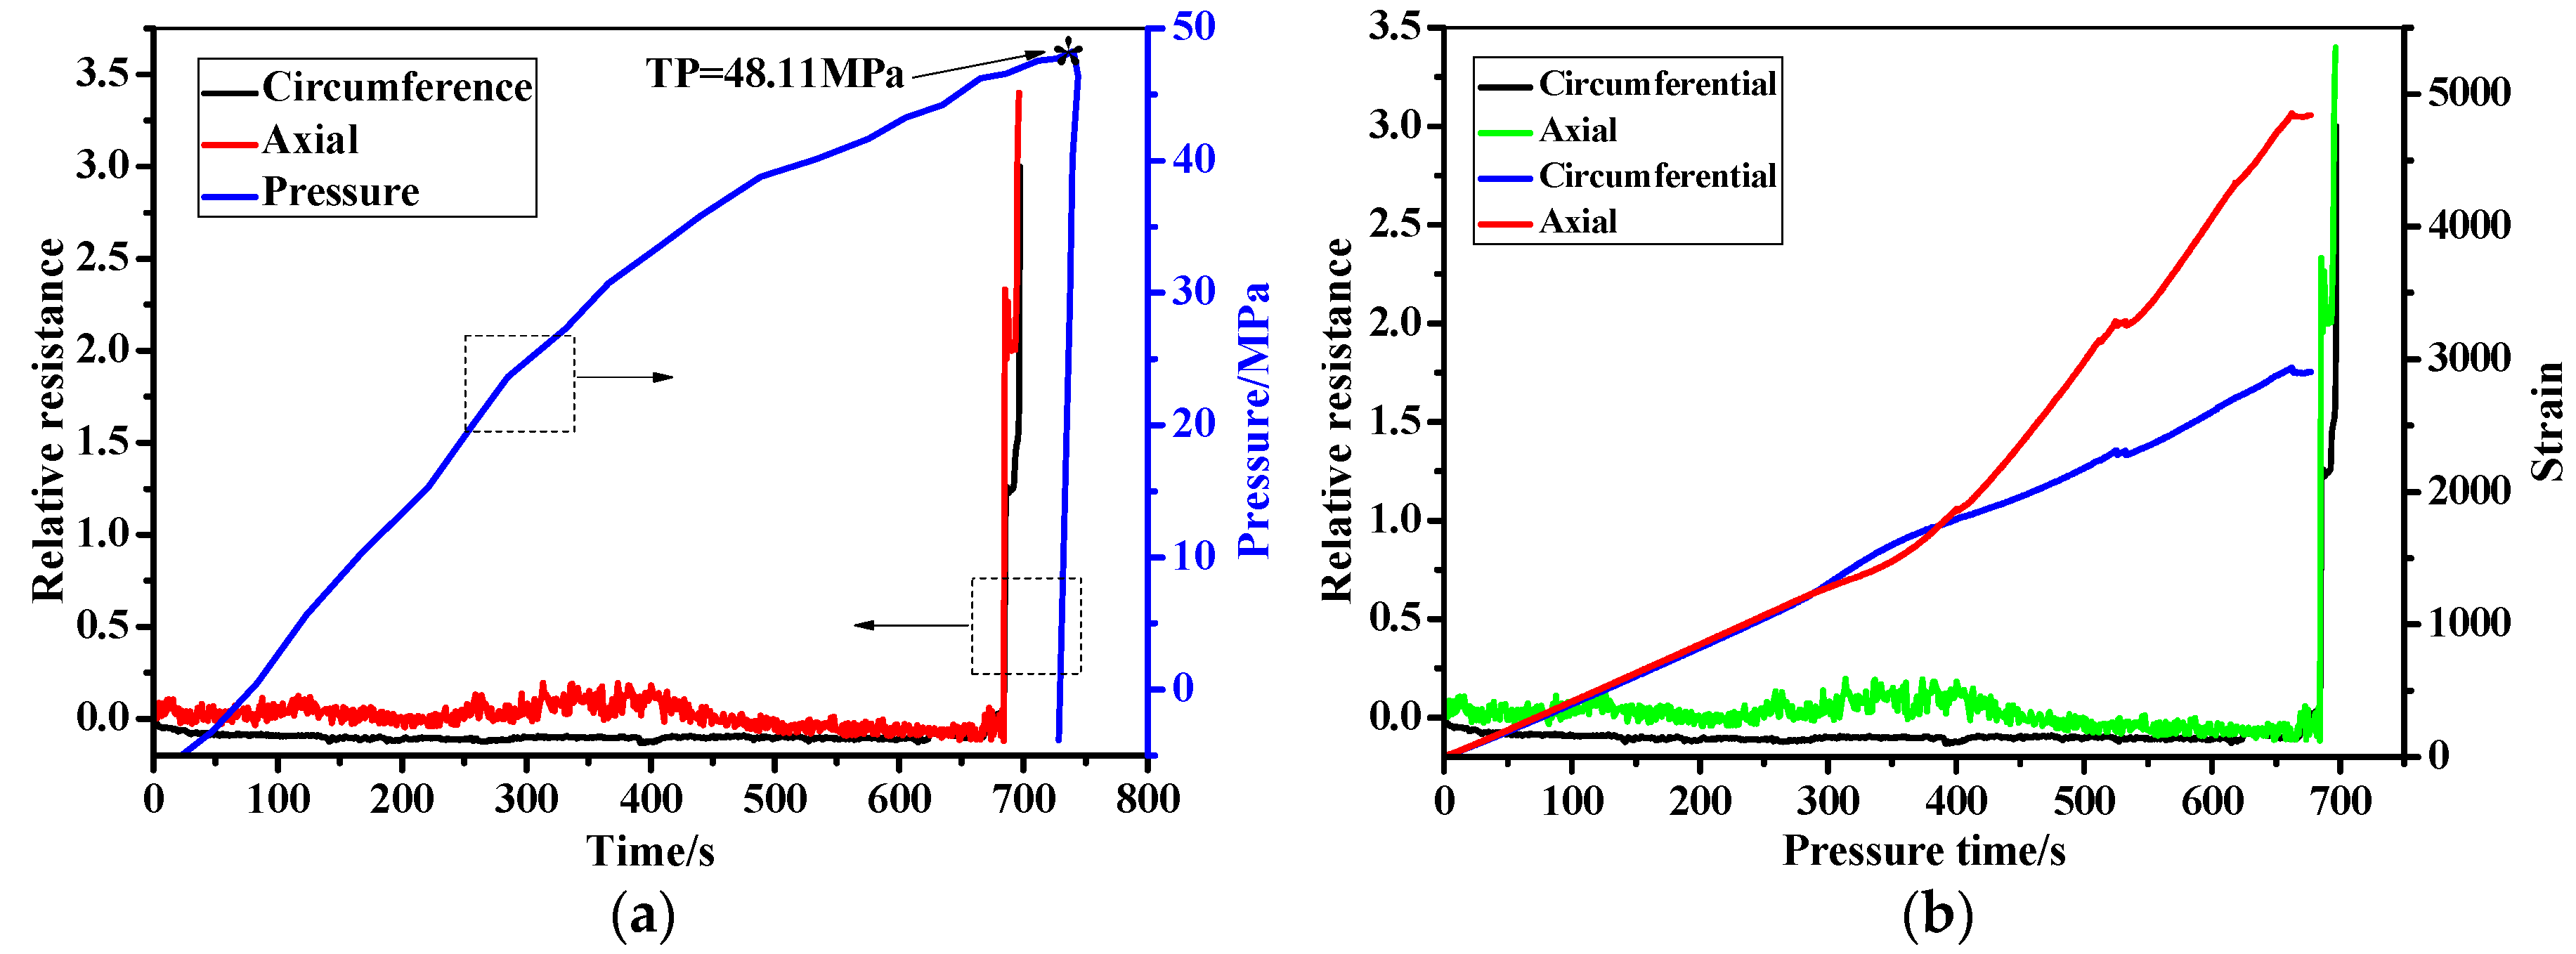
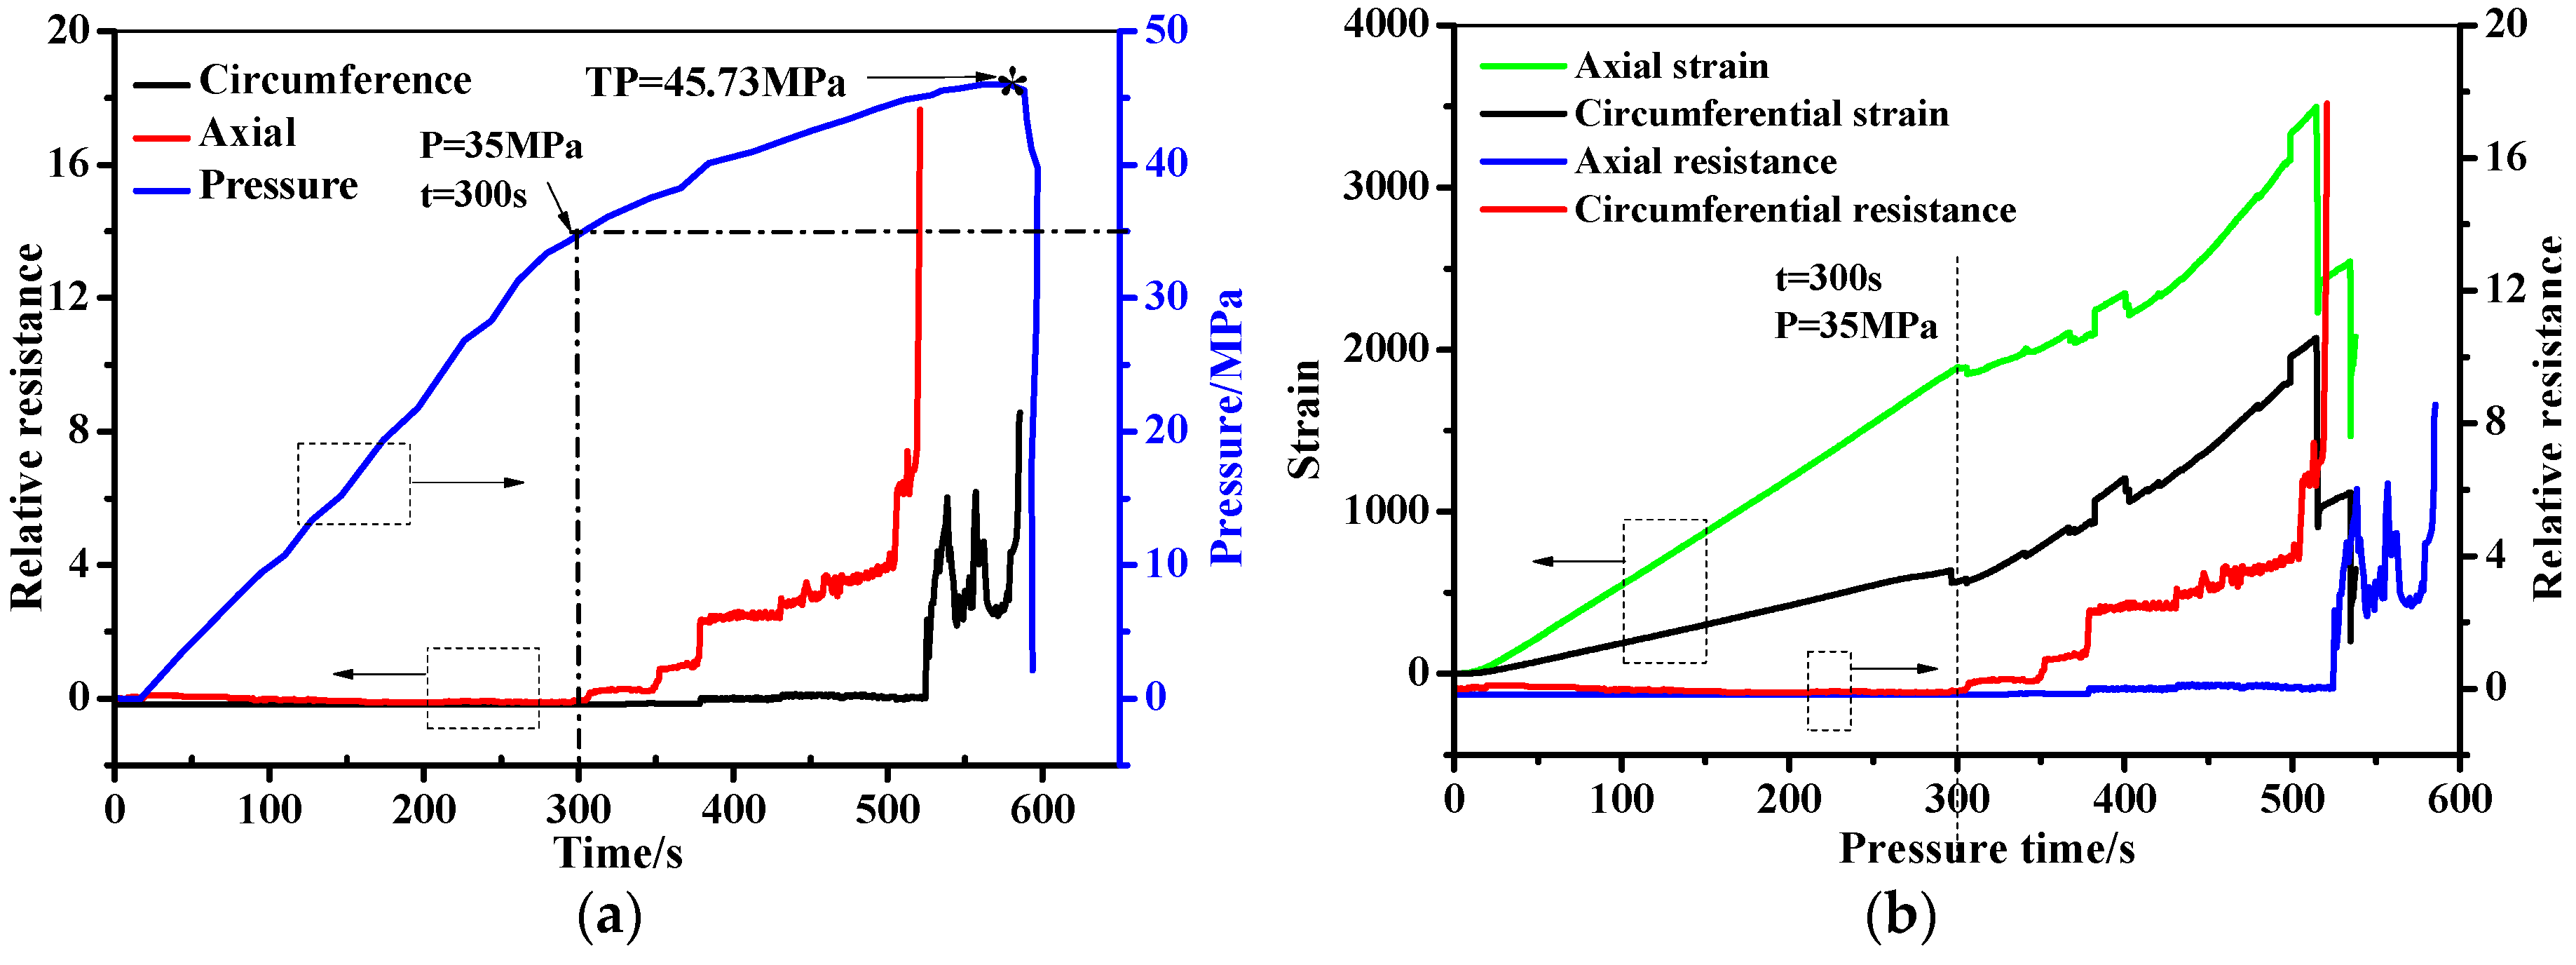
4.2. In-Situ Monitoring of the Pressure Vessel during Pressurization

The filament wound pressure vessel after hydraulic fatigue for 5700 cycles was then used in the bursting test. The relative resistance, pressure, and the stain as a function of the pressure time are shown in Figure 15. As can be seen in Figure 15a, the pressure in the filament wound pressure vessel increases from 0 to 45.73 MPa, until the wound pressure vessel is burst sharply. The pressure–time curve shows a bilinear behavior at the knee point of P = 35 MPa and t = 300 s. The relative resistance firstly shows a steady tendency at 0 with the increase of pressure, until reaching the knee point of the pressure–time curve. Then, the relative resistance shows an increasing tendency with the pressure, until the bursting of the vessel at t = 600 s. Also, it should be noted that the signals fluctuated in the minoring process when the pressure ranged from 35 to 45.73 MPa, which is mainly due to the gradual damage feature of the composite skin [44,45,46]. The relative resistance is compared with the stain measured by strain gauge-2 in Figure 15b. As can be seen in the figure, the strain and the resistance have the same tendency. The axial/circumferential strain before 35 MPa in pressurization show a linear increase from 0 to 1887 and 616, respectively. The two stains then increased to 3502 and 2082 form 35 MPa to the burst pressure, respectively. It should be noted that the increment does not follow a linear tendency, and the fluctuation of the stain is found. The relative resistance and the stain of the filament wound pressure vessel after 5700 cycles’ fatigue as a function of the pressure in the range of 0 to 30 MPa are shown in Figure 16. In Figure 16a, the measured resistance by the MWCNT sensor in the filament wound pressure vessel without defects is also drawn. The resistance of the MWCNT sensor keeps a constant value, while the strain shows an increased tendency with the inner pressure of the filament wound pressure vessel. This phenomenon indicates that damages such as the delamination and/or fiber breaking in the composite skin of the pressure vessel before 30 MPa did not happen.
Figure 17 and Figure 18 show the in-situ monitoring results of a health filament wound pressure vessel up until and before the burst pressure. The burst pressure of the health pressure vessel is 48.11 MPa, which is 2.38 MPa than that of the vessel after the fatigue for 5700 cycles. As discussed, this difference is also illustrated by the residual stain after the hydraulic fatigue listed in Table 3. The measured resistance signal shows a sharp increment when the pressure increases to the burst pressure. Unlike the test curve in Figure 15a, the resistance fluctuates before reaching the sharp increment point at 700 s. The relative resistance and the strain shown in Figure 17b illustrate the corresponding relationship between the two monitoring signals. In Figure 18, we also illustrate the in-situ monitoring result of the health filament wound pressure vessel up to 30 MPa in pressurization. The results indicate that the damage inner of the composite skin did not appear in the health pressure vessel under 30 MPa.

5. Conclusions

This paper mainly aims to study the in-situ monitoring of a filament wound pressure vessel under hydraulic fatigue cycling and pressurization, by the developed MWCNT sensor. The manufacturing and sensing performance of the MWCNT sensor are firstly discussed, and then the sensor is applied in a full-scale filament wound pressure vessel. The following conclusions can be drawn in this study:
  • The developed MWCNT sensor could in-situ sense the health status of the composite laminates under a short beam shear and flexural tests. The shear damage inner, the middle thickness, and the larger deformation of the bottom surface in the specimens could lead to the resistance change of the sensor, respectively. In the tensile and fatigue test, the measured resistance signal also matches the mechanical behavior of the structure well.
  • The MWCNT sensor could monitor the filament wound pressure vessel in the hydraulic fatigue cycling, and the equivalence relationship between the relative resistance and the strain is built in the fatigue test.
  • In the bursting test, the relative resistance remains 0 before the pressure in the vessel reaches 30 MPa, which indicates that damages do not appear in the composite skin before 30 MP for a pressure vessel with burst pressure of 48.11 MPa. The changing tendency of the resistance signal matches the strain well, and the bursting of the pressure vessel can be reflected by the sharp increase of the resistance measured by the embedded MWCNT sensor.

Author Contributions

B.X., B.Y., F.-Z.X., and H.L. conceived and designed the experiments; Y.W. and C.H. performed the experiments; P.J., Y.X., and K.Y. analyzed the data; F.-Z.X. contributed reagents/materials/analysis tools; and B.Y. and B.X. wrote the paper.

Funding

This research was funded by the National Natural Science Foundation of China (no. 11702097 and no. 51835003), the National Key Technology R&D Program of China (no. 2018YFC0808800), and the Fundamental Research Funds for the Central Universities (no. 222201714015).

Conflicts of Interest

The authors declare no conflict of interest.

References

  1. Zu, L.; Wang, J.; Li, S. Analysis of multi-layered thick-walled filament-wound hydrogen storage vessels. Int. J. Hydrog. Energy 2014, 39, 21083–21096. [Google Scholar] [CrossRef]
  2. Zhang, B.; Xu, H.; Zu, L.; Li, D.; Zi, B.; Zhang, B. Design of filament-wound composite elbows based on non-geodesic trajectories. Compos. Struct. 2018, 189, 635–640. [Google Scholar] [CrossRef]
  3. Xiao, Z.; Shi, J.; Cao, X.; Xu, Y.; Hu, Y. Failure probability analysis of pressure vessels that contain defects under the coupling of inertial force and internal pressure. Int. J. Press. Vessel. Pip. 2018, 168, 59–65. [Google Scholar] [CrossRef]
  4. Weng, Y.; Yin, S.; Cheng, B.; Wang, W.; Gu, H.; Wang, H. Study on structural response of reactor vessel under direct safety injection. Ann. Nucl. Energy 2018, 122, 270–279. [Google Scholar] [CrossRef]
  5. Khan, A.; Ko, D.-K.; Lim, S.C.; Kim, H.S. Structural vibration-based classification and prediction of delamination in smart composite laminates using deep learning neural network. Compos. Part B Eng. 2019, 161, 586–594. [Google Scholar] [CrossRef]
  6. Chou, H.Y.; Mouritz, A.P.; Bannister, M.K.; Bunsell, A.R. Acoustic emission analysis of composite pressure vessels under constant and cyclic pressure. Compos. Part A Appl. Sci. Manuf. 2015, 70, 111–120. [Google Scholar] [CrossRef]
  7. Chen, D.Y.; Wang, D.; Chen, H.; Yang, Q.; Xiang, Y.X. Research of Key Technology for Macroscopic Hydrogen Induced Injury Testing and In-Service Monitoring of Pressure Vessel in Wet Hydrogen Sulfide Environment. Procedia Eng. 2015, 130, 1665–1676. [Google Scholar] [CrossRef]
  8. Chen, R.; Li, C.; Wang, J.; Su, G.H.; Qiu, S.; Corradini, M.L. Analysis of the dynamic pressure from ex-vessel steam explosion for pressurized water reactor. Prog. Nucl. Energy 2017, 100, 266–275. [Google Scholar] [CrossRef]
  9. Gąsior, P.; Malesa, M.; Kaleta, J.; Kujawińska, M.; Malowany, K.; Rybczyński, R. Application of complementary optical methods for strain investigation in composite high pressure vessel. Compos. Struct. 2018, 203, 718–724. [Google Scholar] [CrossRef]
  10. Hwang, T.-K.; Park, J.-B.; Kim, H.-G. Evaluation of fiber material properties in filament-wound composite pressure vessels. Compos. Part A Appl. Sci. Manuf. 2012, 43, 1467–1475. [Google Scholar] [CrossRef]
  11. Ozevin, D.; Harding, J. Novel leak localization in pressurized pipeline networks using acoustic emission and geometric connectivity. Int. J. Press. Vessel. Pip. 2012, 92, 63–69. [Google Scholar] [CrossRef]
  12. Lugovtsova, Y.; Prager, J. Structural health monitoring of composite pressure vessels using guided ultrasonic waves. Insight Non-Destr. Test. Cond. Monit. 2018, 60, 139–144. [Google Scholar] [CrossRef]
  13. Wu, Z.; Zhou, W.; Li, H. Modal analysis for filament wound pressure vessels filled with fluid. Compos. Struct. 2010, 92, 1994–1998. [Google Scholar] [CrossRef]
  14. Chen, X.; Kopsaftopoulos, F.; Wu, Q.; Ren, H.; Chang, F.K. Flight State Identification of a Self-Sensing Wing via an Improved Feature Selection Method and Machine Learning Approaches. Sensors 2018, 18, 1379. [Google Scholar] [CrossRef] [PubMed]
  15. Huang, T.; Chaves-Vargas, M.; Yang, J.; Schröder, K.-U. A baseline-free structural damage indicator based on node displacement of structural mode shapes. J. Sound Vib. 2018, 433, 366–384. [Google Scholar] [CrossRef]
  16. Yan, Y.J.; Cheng, L.; Wu, Z.Y.; Yam, L.H. Development in vibration-based structural damage detection technique. Mech. Syst. Signal Process. 2007, 21, 2198–2211. [Google Scholar] [CrossRef]
  17. Yang, B.; Xuan, F.Z.; Xiang, Y.; Li, D.; Zhu, W.; Tang, X.; Xu, J.; Yang, K.; Luo, C. Lamb Wave-Based Structural Health Monitoring on Composite Bolted Joints under Tensile Load. Materials 2017, 10, 652. [Google Scholar] [CrossRef] [PubMed]
  18. Yang, B.; Xuan, F.-Z.; Chen, S.; Zhou, S.; Gao, Y.; Xiao, B. Damage localization and identification in WGF/epoxy composite laminates by using Lamb waves: Experiment and simulation. Compos. Struct. 2017, 165, 138–147. [Google Scholar] [CrossRef]
  19. Yang, B.; Xuan, F.-Z.; Lei, H.; Wang, Z.; Xiang, Y.; Yang, K.; Tang, X.; Liang, W. Simultaneously enhancing the IFSS and monitoring the interfacial stress state of GF/epoxy composites via building in the MWCNT interface sensor. Compos. Part A Appl. Sci. Manuf. 2018, 112, 161–167. [Google Scholar] [CrossRef]
  20. Yang, B.; Xuan, F.-Z.; Wang, Z.; Chen, L.; Lei, H.; Liang, W.; Xiang, Y.; Yang, K. Multi-functional interface sensor with targeted IFSS enhancing, interface monitoring and self-healing of GF/EVA thermoplastic composites. Compos. Sci. Technol. 2018, 167, 86–95. [Google Scholar] [CrossRef]
  21. Gomes, G.F.; Mendéz, Y.A.D.; da Silva Lopes Alexandrino, P.; da Cunha, S.S.; Ancelotti, A.C. The use of intelligent computational tools for damage detection and identification with an emphasis on compositesA review. Compos. Struct. 2018, 196, 44–54. [Google Scholar] [CrossRef]
  22. Lammens, N.; Luyckx, G.; Van Paepegem, W.; Degrieck, J. Finite element prediction of resin pocket geometries around arbitrary inclusions in composites: Case study for an embedded optical fiber interrogator. Compos. Struct. 2016, 146, 95–107. [Google Scholar] [CrossRef]
  23. Saeter, E.; Lasn, K.; Nony, F.; Echtermeyer, A.T. Embedded optical fibres for monitoring pressurization and impact of filament wound cylinders. Compos. Struct. 2019, 210, 608–617. [Google Scholar] [CrossRef]
  24. Salvetti, M.; Sbarufatti, C.; Gilioli, A.; Dziendzikowski, M.; Dragan, K.; Manes, A.; Giglio, M. On the mechanical response of CFRP composite with embedded optical fibre when subjected to low velocity impact and CAI tests. Compos. Struct. 2017, 179, 21–34. [Google Scholar] [CrossRef]
  25. Yang, B.; Xiang, Y.; Xuan, F.-Z.; Hu, C.; Xiao, B.; Zhou, S.; Luo, C. Damage localization in hydrogen storage vessel by guided waves based on a real-time monitoring system. Int. J. Hydrog. Energy 2019. [Google Scholar] [CrossRef]
  26. Hasanzadeh, M.; Mottaghitalab, V.; Babaei, H.; Rezaei, M. The influence of carbon nanotubes on quasi-static puncture resistance and yarn pull-out behavior of shear-thickening fluids (STFs) impregnated woven fabrics. Compos. Part A Appl. Sci. Manuf. 2016, 88, 263–271. [Google Scholar] [CrossRef]
  27. Zhang, H.; Liu, Y.; Kuwata, M.; Bilotti, E.; Peijs, T. Improved fracture toughness and integrated damage sensing capability by spray coated CNTs on carbon fibre prepreg. Compos. Part A Appl. Sci. Manuf. 2015, 70, 102–110. [Google Scholar] [CrossRef]
  28. Chowdhury, S.; Saha, M.; Patterson, S.; Thomas, R.; Liu, Y. Highly conductive polydimethylsiloxane/carbon nanofiber composites for flexible sensor applications. Adv. Mater. Technol. 2019, 4, 1800398. [Google Scholar] [CrossRef]
  29. Thostenson, E.; Ren, Z.; Chou, T. Advances in the science and technology of carbon nanotubes and their composites: A review. Compos. Sci. Technol. 2001, 61, 1899–1912. [Google Scholar] [CrossRef]
  30. Lu, S.; Zhao, C.; Zhang, L.; Ma, K.; Bai, Y.; Wang, X.; Du, K. In situ monitoring the manufacturing process of polymer composites with highly flexible and sensitive GNP/ MWCNT film sensors. Sens. Actuators A Phys. 2019, 285, 127–133. [Google Scholar] [CrossRef]
  31. Anni, J.S.; Sangaiah, A.K. Wireless Integrated Sensor Network: Boundary Intellect system for elephant detection via cognitive theory and Fuzzy Cognitive Maps. Future Gener. Comput. Syst. 2018, 83, 522–534. [Google Scholar] [CrossRef]
  32. Lampani, L.; Gaudenzi, P. Innovative composite material component with embedded self-powered wireless sensor device for structural monitoring. Compos. Struct. 2018, 202, 136–141. [Google Scholar] [CrossRef]
  33. Shukla, A.; Liu, S.; Gaterell, M.; Wood, G.; Day, R.; Iweka, O.; Hussain, A.; Van der Horst, D.; Petridis, P. Implementing an integrated meter and sensor system (IMSS) in existing social housing stock. Energy Build. 2019, 182, 274–286. [Google Scholar] [CrossRef]
  34. Yang, B.; Xuan, F.-Z.; Jin, P.; Hu, C.; Xiao, B.; Li, D.; Xiang, Y.; Lei, H. Damage Localization in Composite Laminates by Building in PZT Wafer Transducers: A Comparative Study with Surface-Bonded PZT Strategy. Adv. Eng. Mater. 2018, 1801040. [Google Scholar] [CrossRef]
  35. Wang, F.; Zhang, K.; Liang, W.; Wang, Z.; Yang, B. Experimental and analytical studies on the flexible, low-voltage electrothermal film based on the multi-walled carbon nanotube/polymer nanocomposite. Nanotechnology 2019, 30, 065704. [Google Scholar] [CrossRef] [PubMed]
  36. Jeong, Y.G.; Jeon, G.W. Microstructure and performance of multiwalled carbon nanotube/m-aramid composite films as electric heating elements. ACS Appl. Mater. Interfaces 2013, 5, 6527–6534. [Google Scholar] [CrossRef] [PubMed]
  37. Leemets, K.; Mäeorg, U.; Aabloo, A.; Tamm, T. Effect of contact material and ambient humidity on the performance of MWCNT/PDMS multimodal deformation sensors. Sens. Actuators A Phys. 2018, 283, 1–8. [Google Scholar] [CrossRef]
  38. Yang, B.; Wang, Z.; Zhou, L.; Zhang, J.; Liang, W. Experimental and numerical investigation of interply hybrid composites based on woven fabrics and PCBT resin subjected to low-velocity impact. Compos. Struct. 2015, 132, 464–476. [Google Scholar] [CrossRef]
  39. Yang, B.; Wang, Z.; Zhou, L.; Zhang, J.; Tong, L.; Liang, W. Study on the low-velocity impact response and CAI behavior of foam-filled sandwich panels with hybrid facesheet. Compos. Struct. 2015, 132, 1129–1140. [Google Scholar] [CrossRef]
  40. Yang, B.; Zhang, J.; Zhou, L.; Lu, M.; Liang, W.; Wang, Z. Effect of fiber surface modification on water absorption and hydrothermal aging behaviors of GF/pCBT composites. Compos. Part B Eng. 2015, 82, 84–91. [Google Scholar] [CrossRef]
  41. Yang, B.; Zhang, J.; Zhou, L.; Wang, Z.; Liang, W. Effect of fiber surface modification on the lifetime of glass fiber reinforced polymerized cyclic butylene terephthalate composites in hygrothermal conditions. Mater. Des. 2015, 85, 14–23. [Google Scholar] [CrossRef]
  42. Humeau, C.; Davies, P.; Jacquemin, F. Moisture diffusion under hydrostatic pressure in composites. Mater. Des. 2016, 96, 90–98. [Google Scholar] [CrossRef]
  43. Lee, J.; Jo, C.; Chang, D.; Chung, H. New methodology for estimating the minimum design vapor pressure of prismatic pressure vessel for on-ship application. Ocean Eng. 2018, 158, 367–377. [Google Scholar] [CrossRef]
  44. Wan, Y.; Diao, C.; Yang, B.; Zhang, L.; Chen, S. GF/epoxy laminates embedded with wire nets: A way to improve the low-velocity impact resistance and energy absorption ability. Compos. Struct. 2018, 202, 818–835. [Google Scholar] [CrossRef]
  45. Tessema, A.; Ravindran, S.; Kidane, A. Gradual damage evolution and propagation in quasi-isotropic CFRC under quasi-static loading. Compos. Struct. 2018, 185, 186–192. [Google Scholar] [CrossRef]
  46. Fakoor, M.; Ghoreishi, S.M.N. Experimental and numerical investigation of progressive damage in composite laminates based on continuum damage mechanics. Polym. Test. 2018, 70, 533–543. [Google Scholar] [CrossRef]
Figure 1. The manufacture processing of multi-walled carbon nanotube (MWCNT) sensor and its microcosmic appearance on a glass fiber (GF) bundle surface: (a) is the pure GF surface, while (b) is the GF fiber with MWCNT.
Sensors 19 01396 g001
Figure 2. The manufacture processing of the filament wound composite pressure vessel: (a) is the rolling tank, (b) is the dipping tank, and (c) is the glass fiber yarns.
Sensors 19 01396 g002
Figure 3. The MWCNT sensor is embedded in the middle thickness of the composite skin during the filament winding process.
Sensors 19 01396 g003
Figure 4. Pressure vessels before and after bursting: (a) before bursting, (b) after bursting.
Sensors 19 01396 g004
Figure 5. Parameters in hydraulic fatigue cycling.
Sensors 19 01396 g005
Figure 6. Experimental setup of the experiments with simultaneously resistance recording: (a) short beam shear test; (b) three-point-bending test.
Sensors 19 01396 g006
Figure 7. Resistance change of the MWCNT sensor in short beam shear and flexural tests of the unidirectional composite laminates. The repeat curve is also given in the figure. (a) Short beam shear and the parallel sample. (b) Flexural and the parallel sample.
Sensors 19 01396 g007aSensors 19 01396 g007b
Figure 8. Resistance–loading time in the tensile tests. (a) Longitudinal resistance vs. loading strain. (b) Transverse resistance vs. loading strain.
Sensors 19 01396 g008
Figure 9. Parameters in the fatigue test. (a) Fatigue load–cycles. (b) Fatigue position–cycles.
Sensors 19 01396 g009
Figure 10. Resistance change of the MWCNT sensor during fatigue. (a) Resistance–loading time. (b) The enlarged drawing curves.
Sensors 19 01396 g010
Figure 11. Monitoring results by the MWCNT sensor and the stain gauge when the filament wound pressure vessel is in 2100- to 2400-fatigue cycling. The strain is measured by strain gauge-2 in Figure 4. (a) Resistance, the stain as a function of the fatigue time. (b) The enlarged drawing curves.
Sensors 19 01396 g011
Figure 12. The monitoring results of the developed MWCNT sensor and the stain when the filament wound pressure vessel is in 2100- to 2400-cycles loading. The strain is measured by strain gauge-1 in Figure 4. (a) Resistance, the stain as the function of fatigue time. (b) The enlarged drawing curves.
Sensors 19 01396 g012
Figure 13. Monitoring results by the MWCNT sensor and the stain gauge when the filament wound pressure vessel is in 5100- to 5700-fatigue cycles. The strain was measured by strain gauge-2 in Figure 4. (a) Resistance, the stain as the function of fatigue time. (b) The enlarged drawing curves.
Sensors 19 01396 g013aSensors 19 01396 g013b
Figure 14. Monitoring results of the MWCNT sensor and the stain gauge when the filament wound pressure vessel is in 5100- to 5700-fatigue cycles. The strain was measured by strain gauge-1 in Figure 4. (a) Resistance, the stain as the function of fatigue time. (b) The enlarged drawing curves.
Sensors 19 01396 g014aSensors 19 01396 g014b
Figure 15. The in-situ monitoring of the filament wound pressure vessel (after hydraulic fatigue for 5700 cycles) during the blasting test. (a) Resistance, pressure–pressure time. (b) Resistance, strain–pressure time.
Sensors 19 01396 g015
Figure 16. The in-situ monitoring of the filament wound pressure vessel (after hydraulic fatigue for 5700 cycles) before bursting. (a) Resistance change as a function of pressure. (b) Strain change as a function of pressure.
Sensors 19 01396 g016
Figure 17. The in-situ monitoring of the health filament wound pressure vessel during pressurization. (a) Resistance, pressure–pressure time. (b) Resistance, strain–pressure time.
Sensors 19 01396 g017
Figure 18. The in-situ monitoring of the health filament wound pressure vessel before bursting. (a) Resistance change as a function of pressure. (b) Strain change as a function of pressure.
Sensors 19 01396 g018
Table 1. Parameters of the hydraulic fatigue cycling.
ItemParameterItemParameter
Cycle times5700Rising pressure time3.1 s
Maximum pressure25 MpaMax pressure holding time2 s
Pressure drop time0.6 sMinimum pressure2 s
Min pressure holding time2 sCycling rate7.8
Temperature 11.2 °CMediawater
Table 2. The mechanical performance of the composites laminates before and after embedding the multi-walled carbon nanotube (MWCNT) sensors in different mechanical tests.
SpecimensFailure Load in Short Beam Shear/NFailure Load in Flexural/NTensile Strength/Mpa
Without sensor2318 ± 10.26421.52 ± 0.86186.43 ± 8.29
With sensor2330 ± 7.68424.22 ± 0.86185.66 ± 5.23
Table 3. The equivalence relationship between the resistances tested by the embedded MWCNT sensor and the strain gauges.
Fatigue CycleTest DirectionStrain Gauge-2Strain Gauge-1Relative Resistance
2100–2400axial110013980.545
circumferential2864410.639
5100–5700axial87310910.466
circumferential2203900.263
Table 4. The residual strain as a function of pressure fatigue cycles.
Pressure Fatigue CyclesStrain Gauge-1Strain Gauge-2
AxialCircumferentialAxialCircumferential
30042.414.58.23
150025.67.87.86.4
180023.36.18.26.4
210025.98.94.88.8
240014.214.76.66
270015.311.9810.4
300020.68.92.33.3
330027.411.513.512
510036.26.46.56.5
570013.131.77115.8

