A Deep Learning Framework for Driving Behavior Identification on In-Vehicle CAN-BUS Sensor Data

 ,
, 
Abstract
:
1. Introduction
2. Materials and Methods
2.1. Related Works
2.2. Problem Formulation
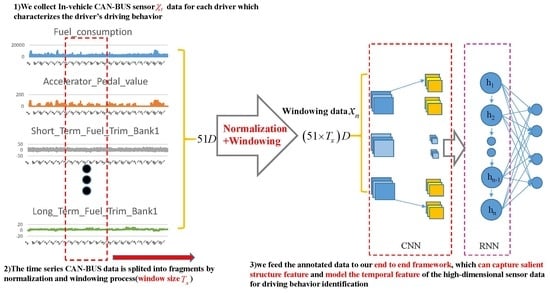
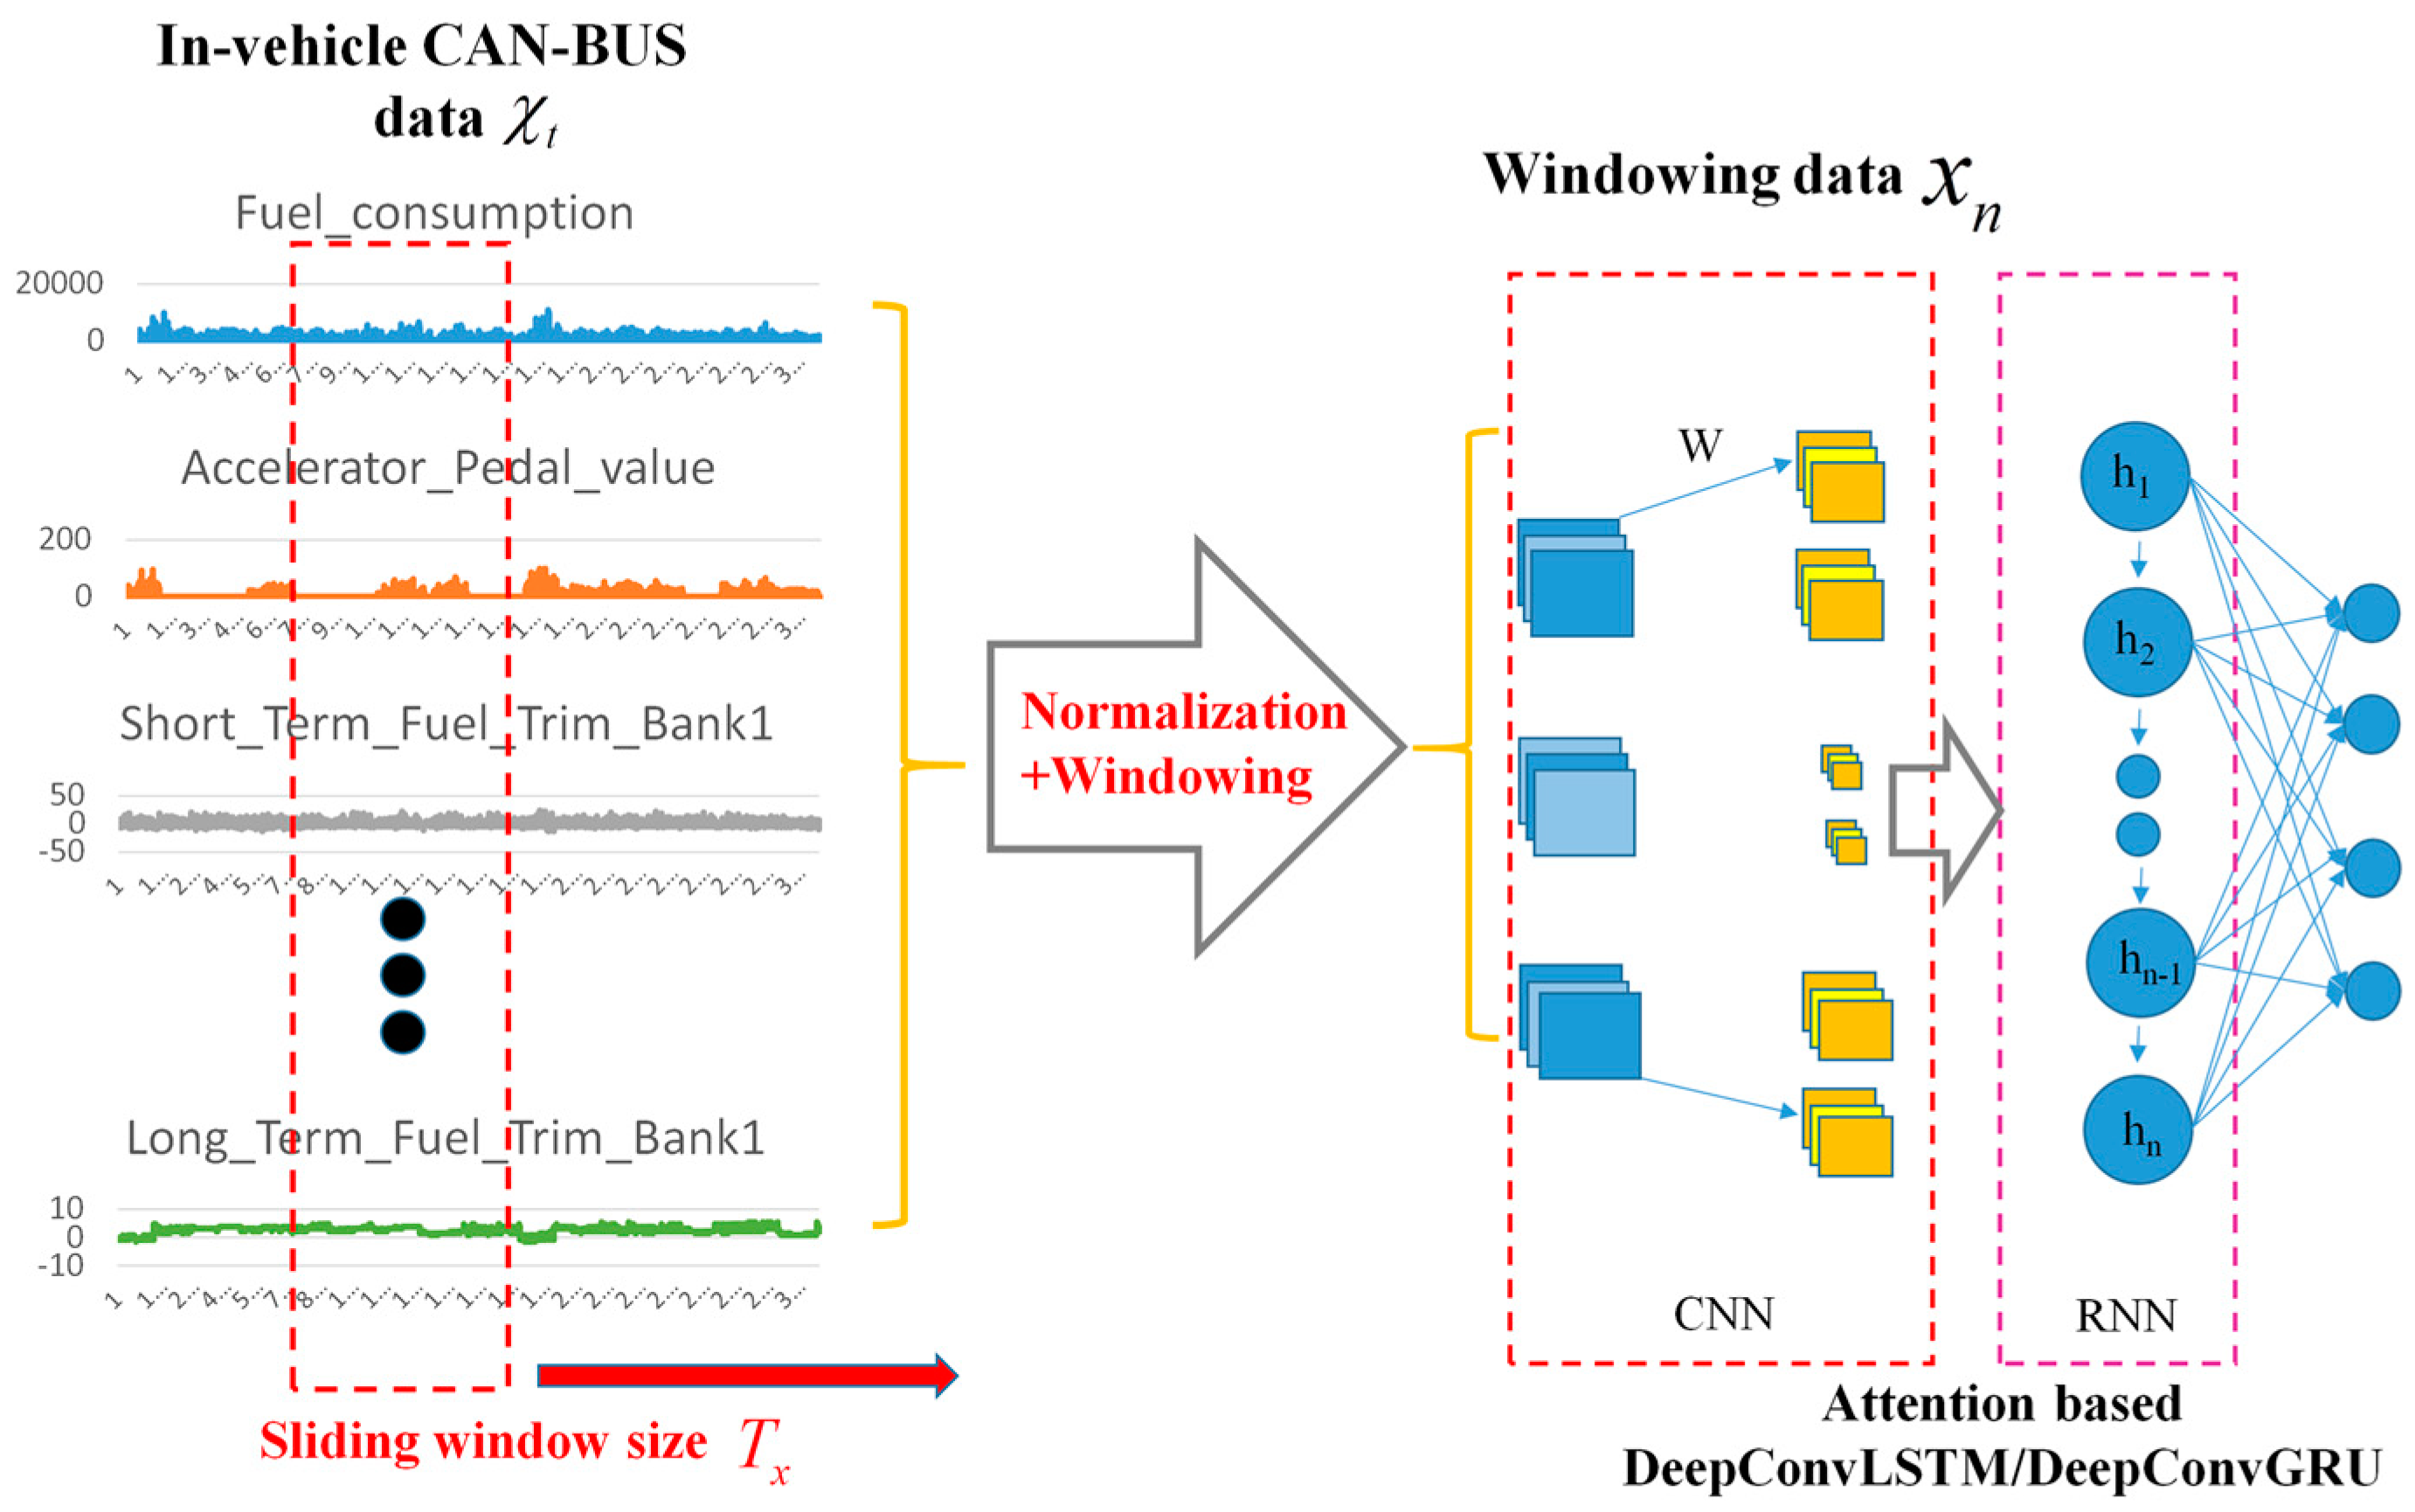
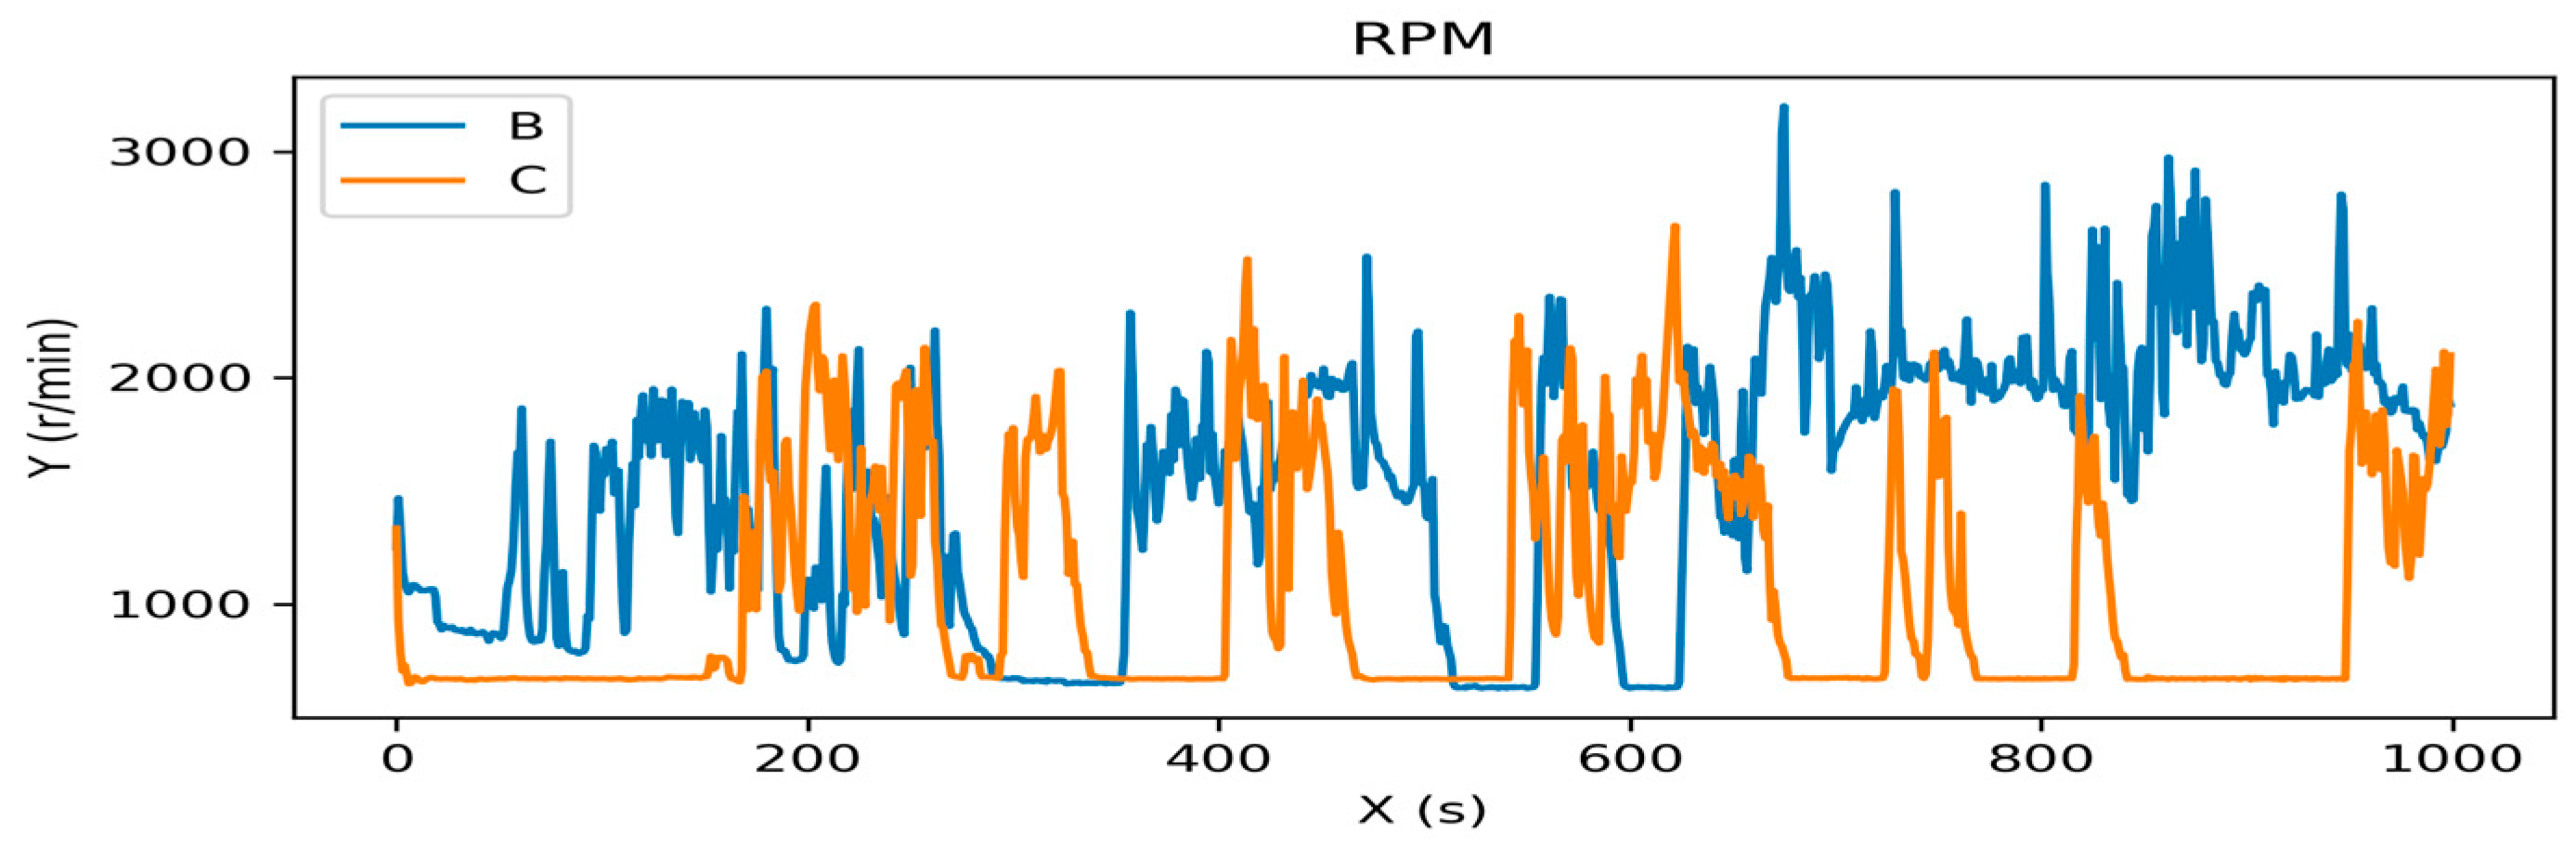
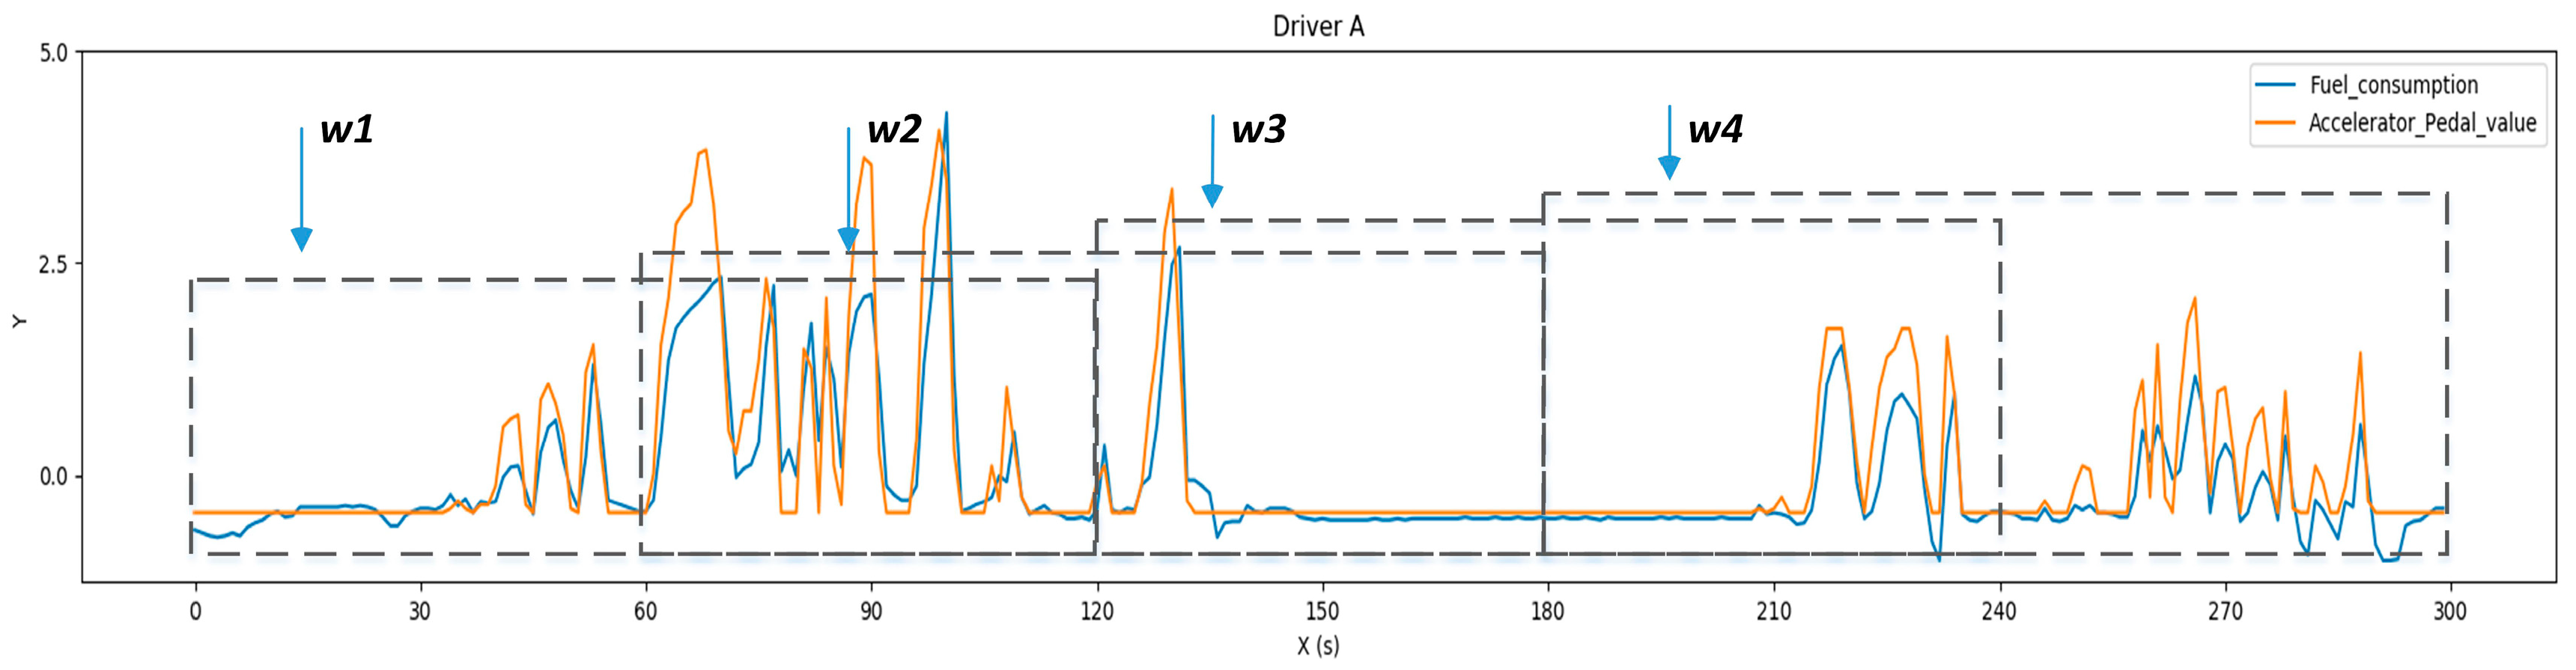
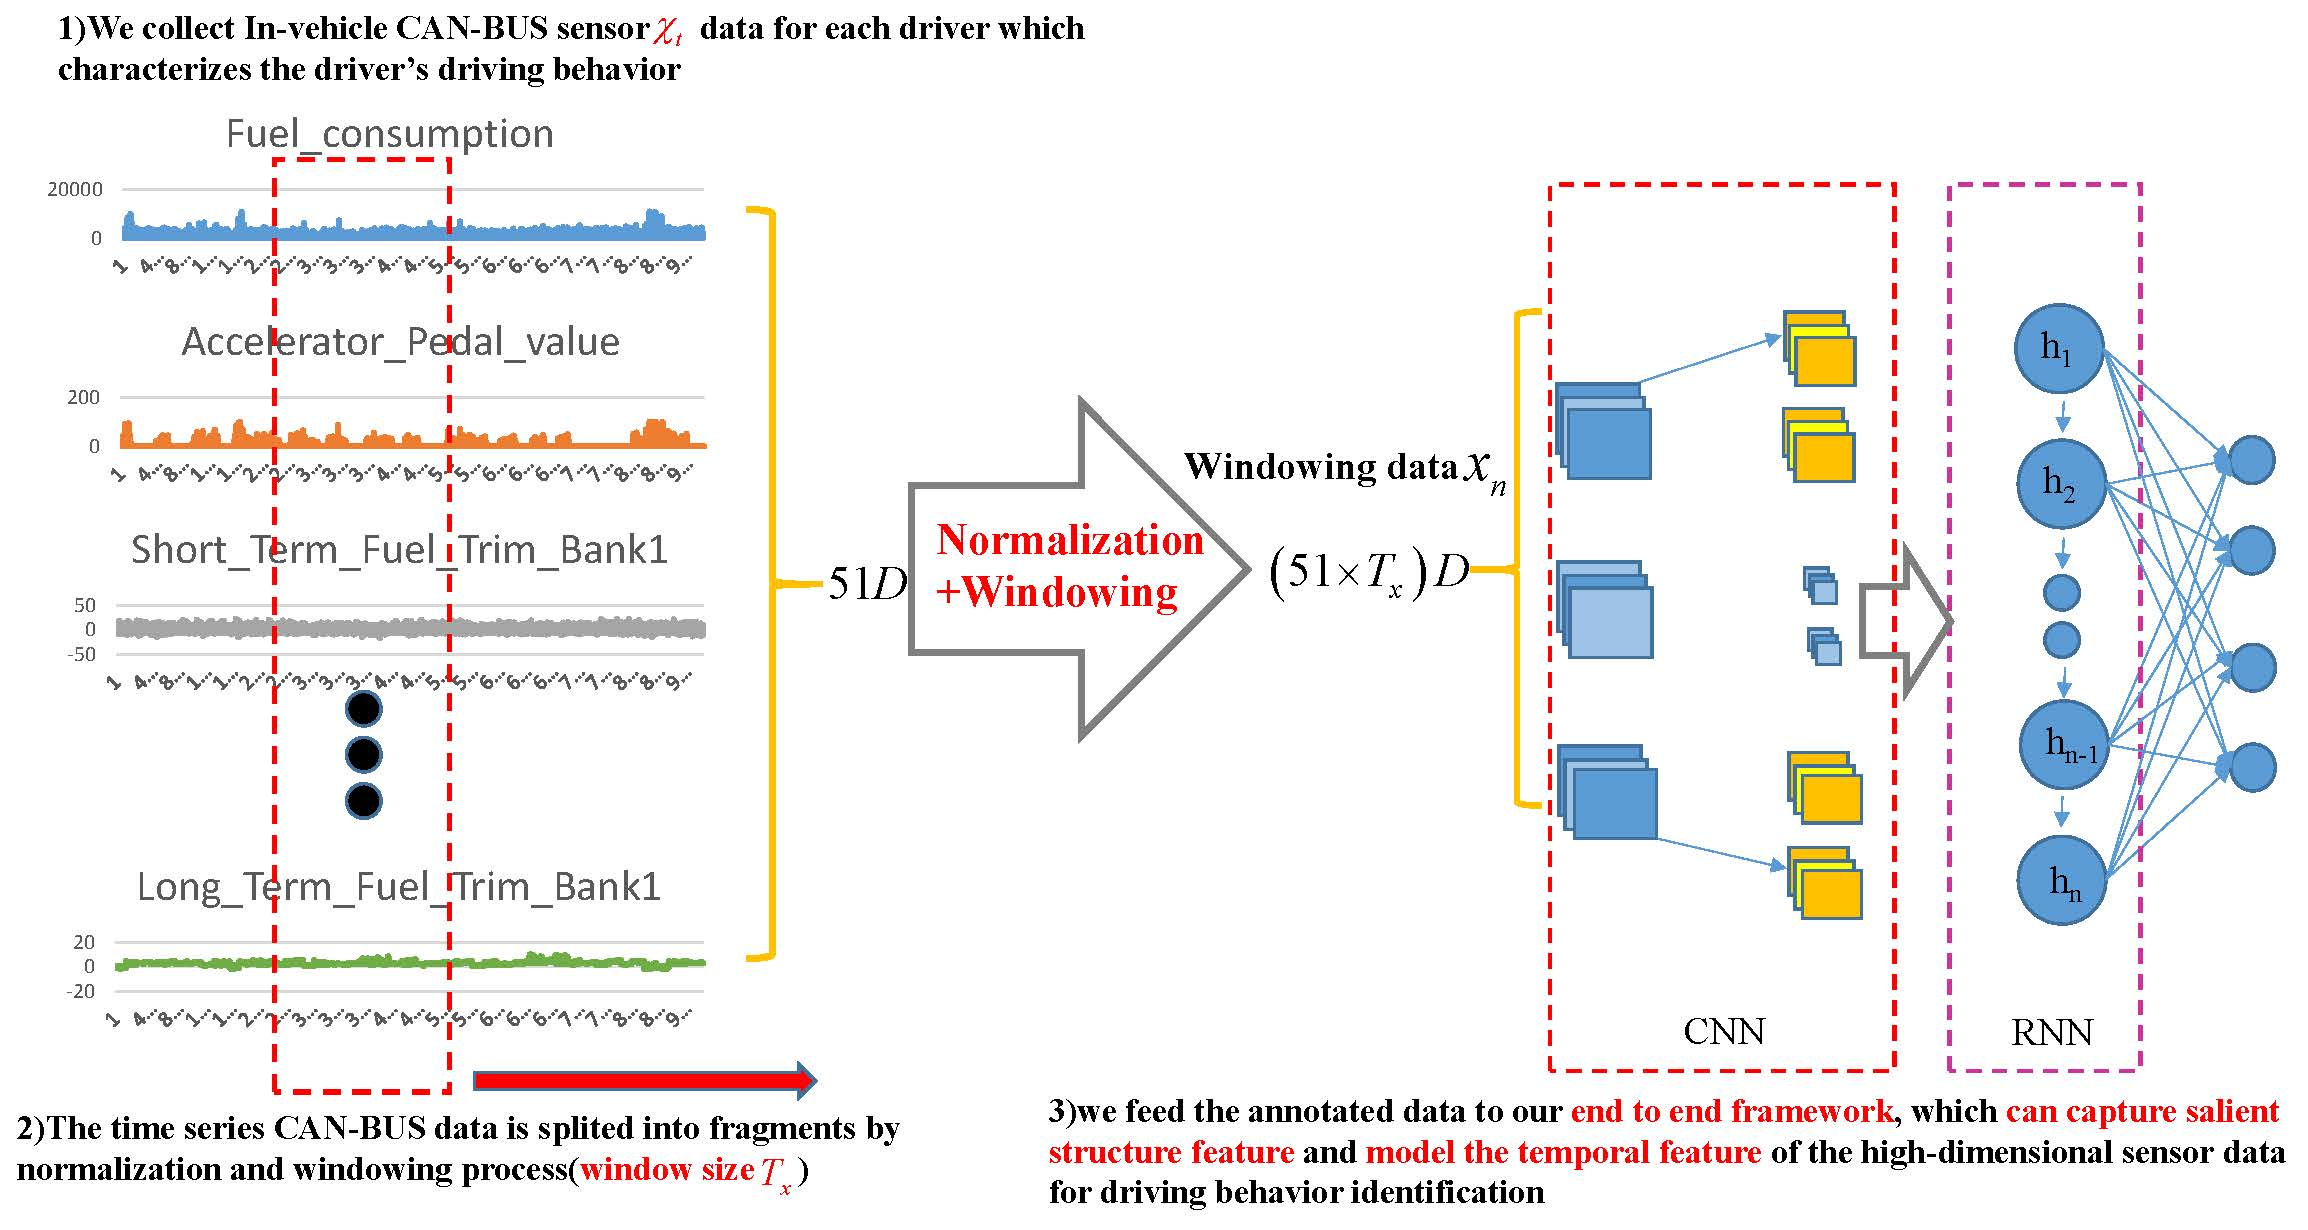
2.2.1. In-Vehicle CAN-BUS Sensor Data Preparation and Analysis
2.2.2. Data Processing
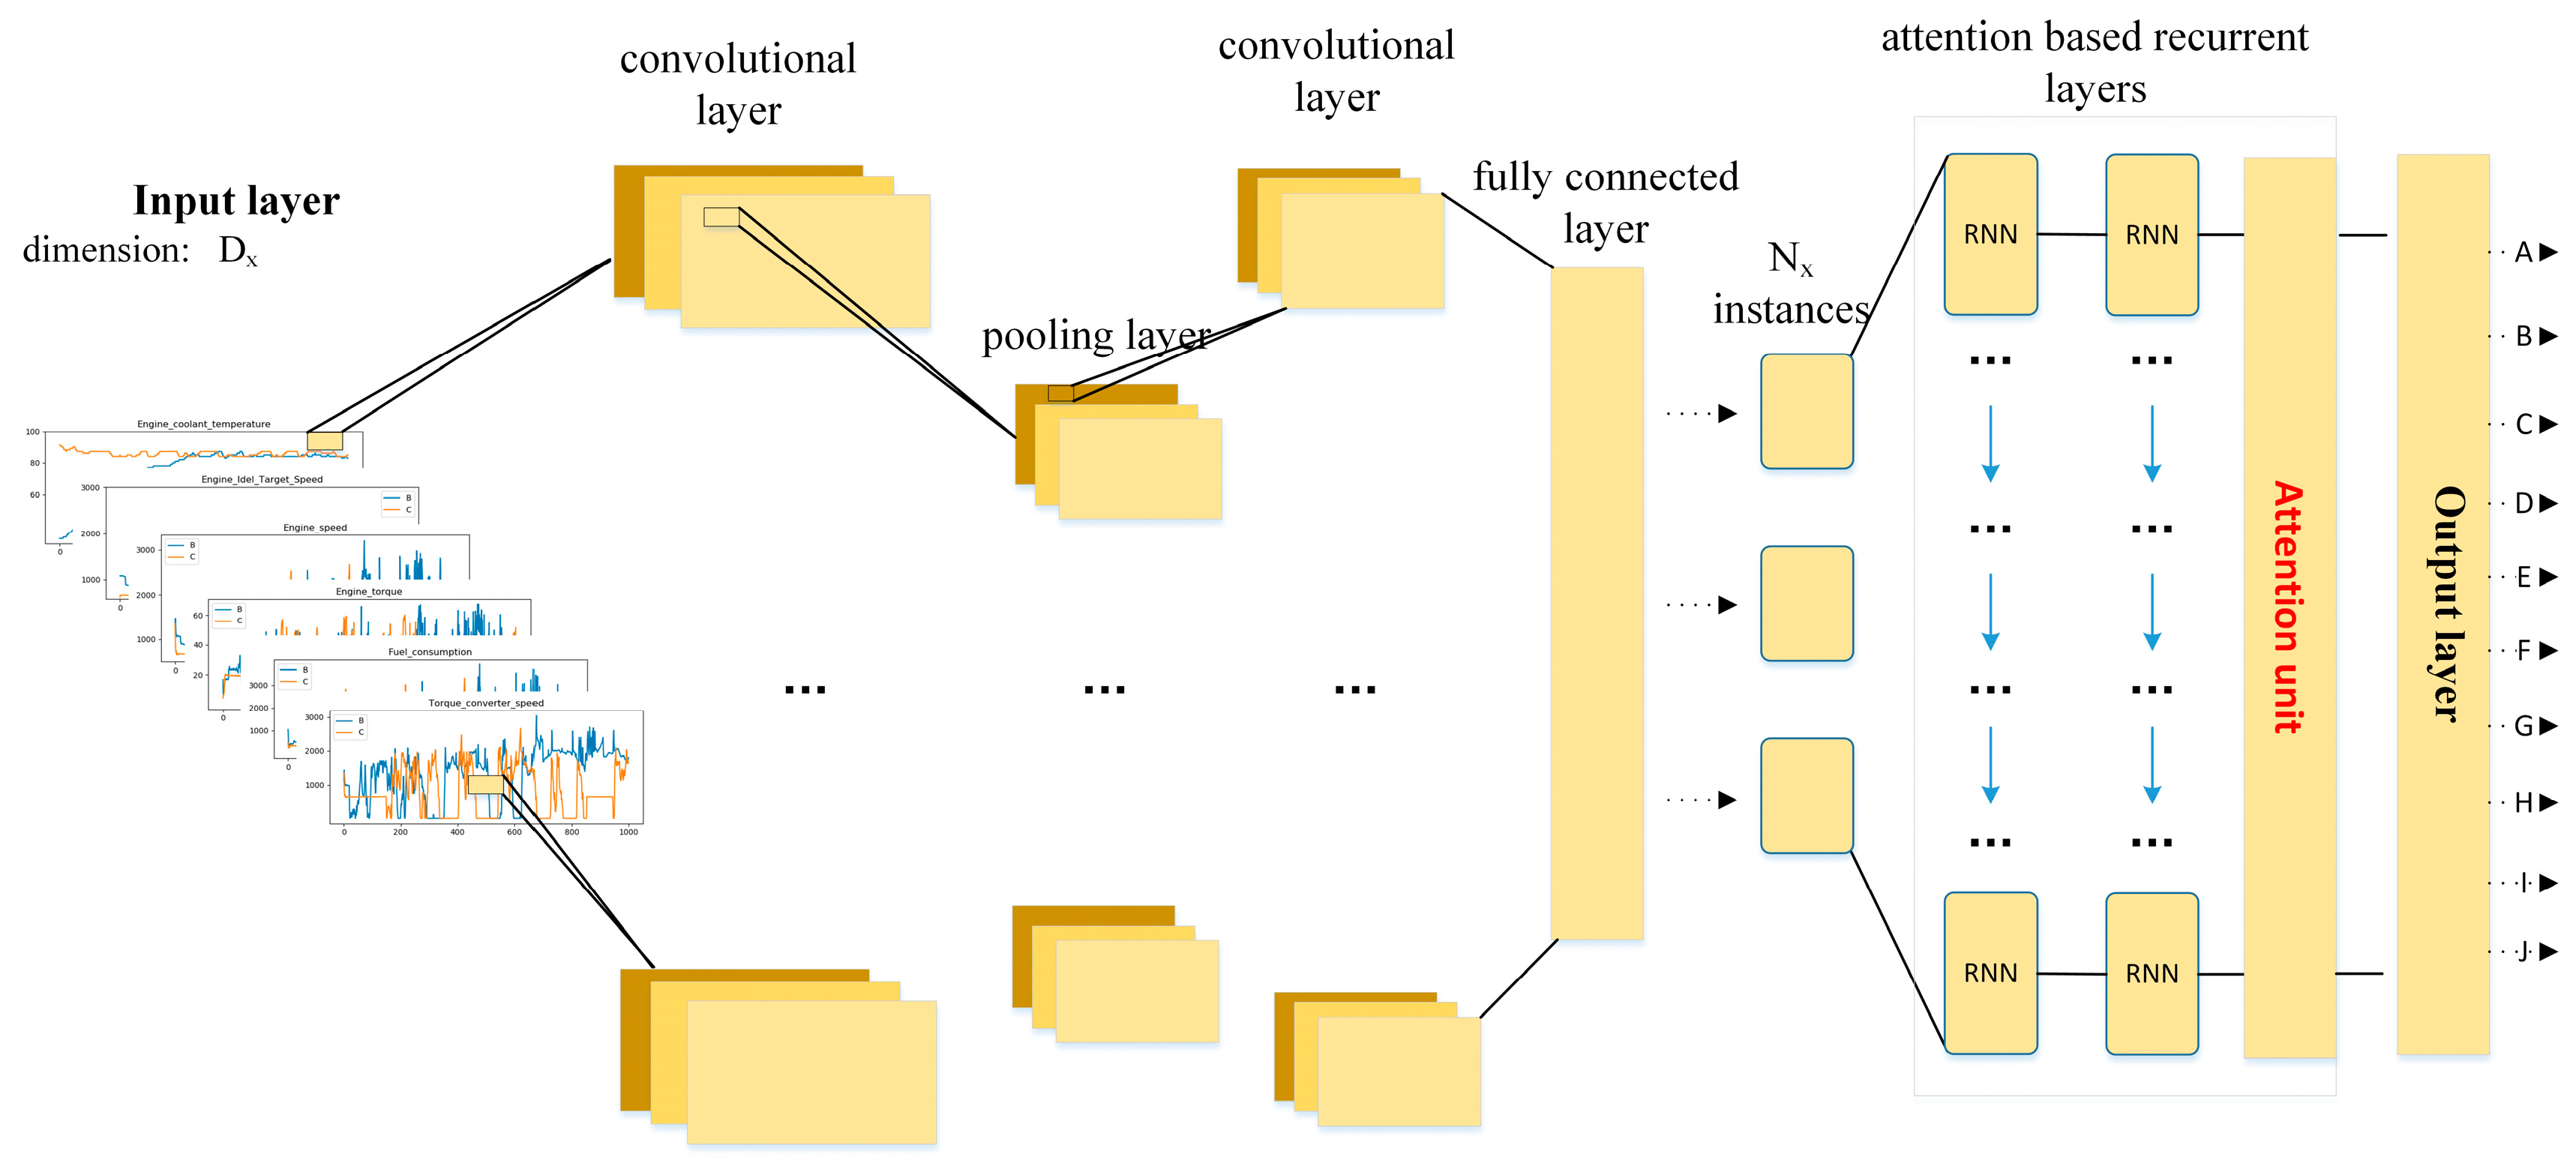
2.3. Our Proposed Framework
2.3.1. Main Procedure of Our Proposed Architecture
2.3.2. Convolutional and Pooling Layers for Feature Extraction
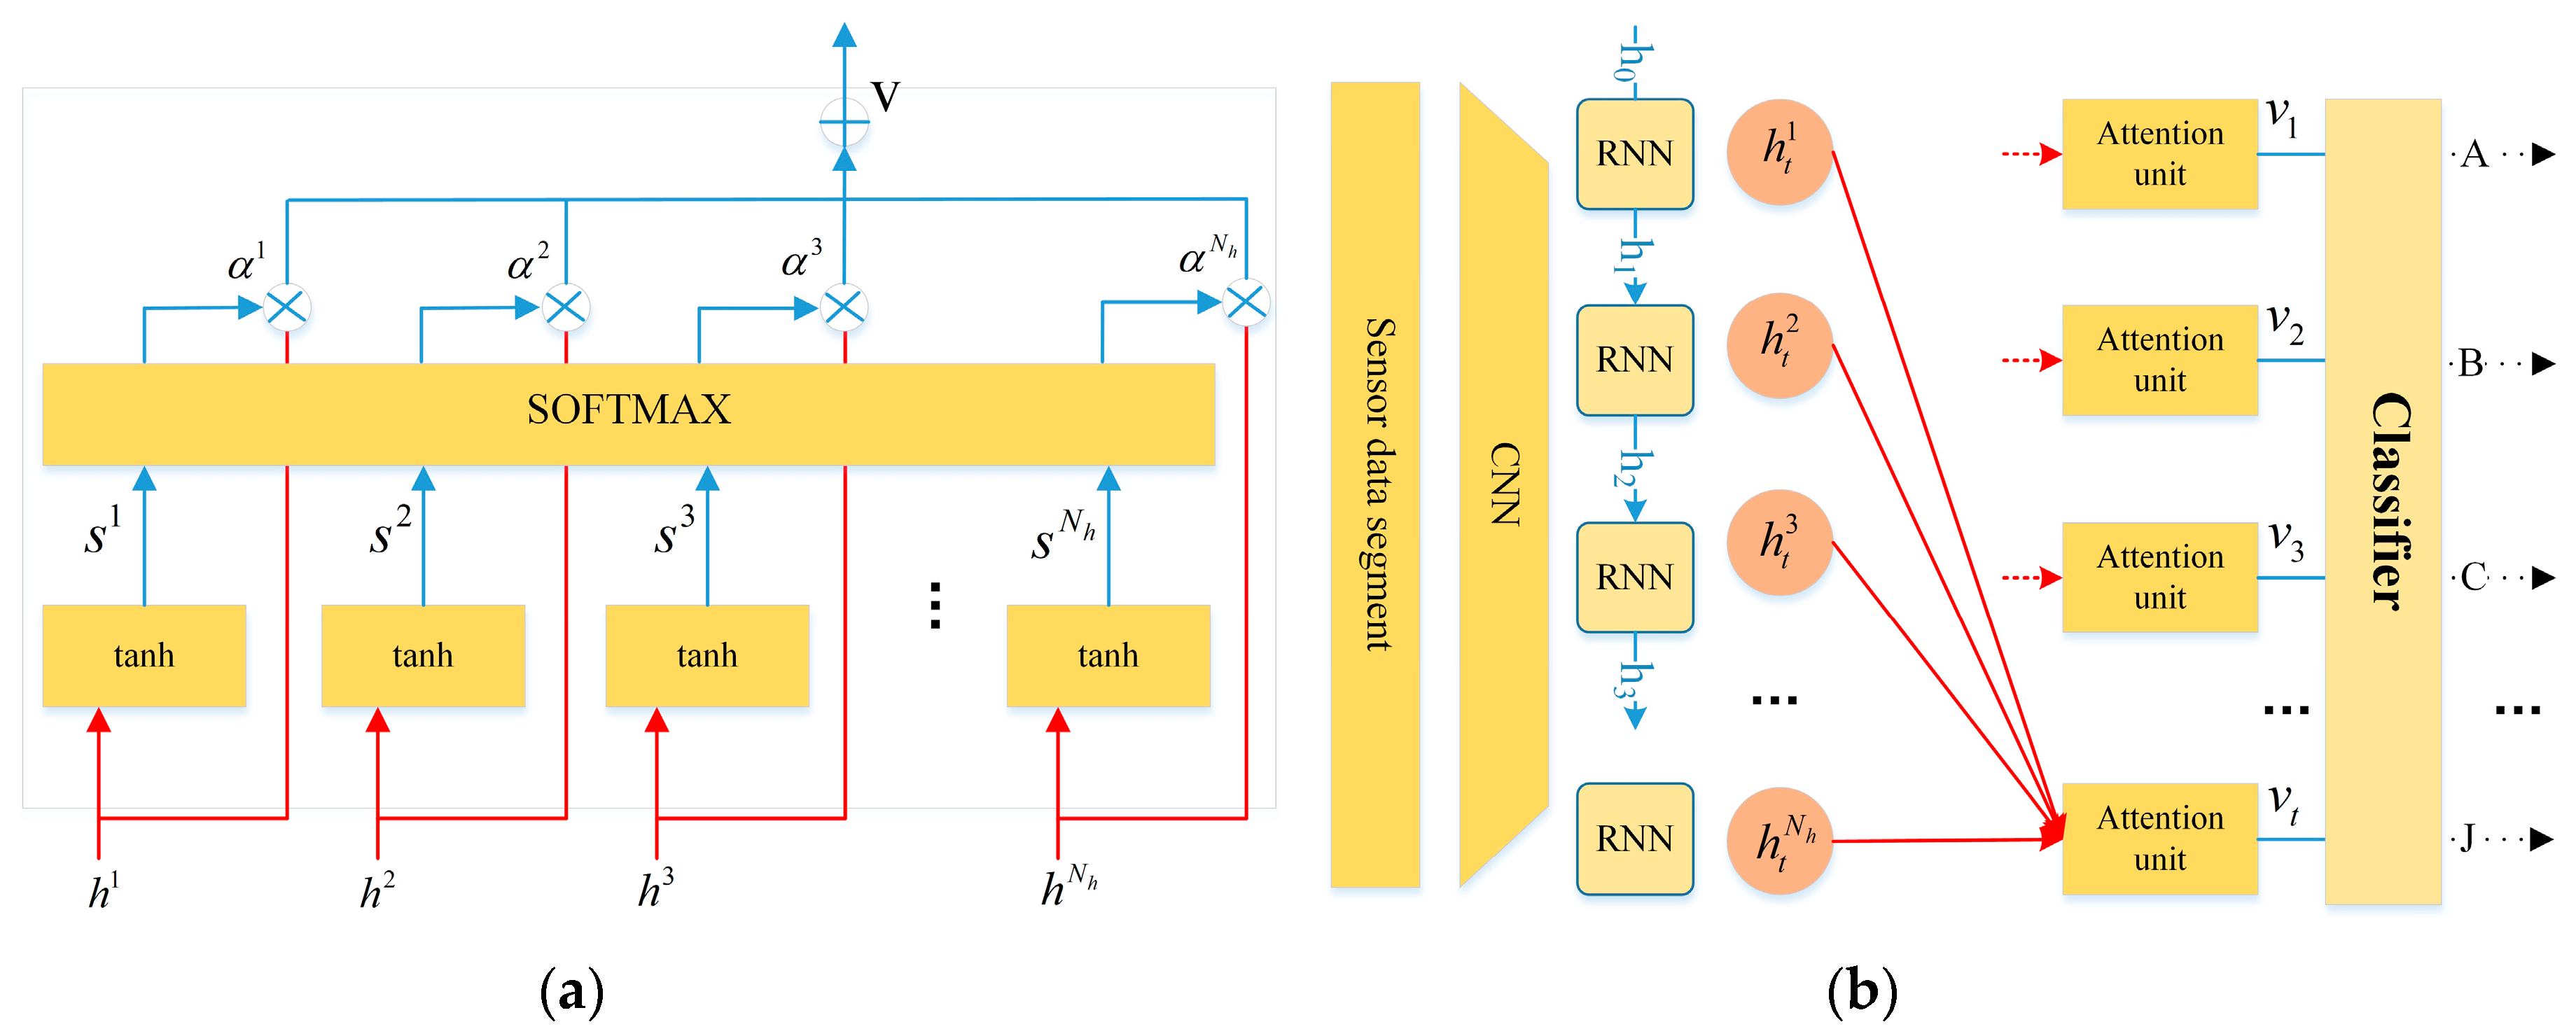
2.3.3. Attention Based Recurrent Layer
2.3.4. Classifier Layer for Driving Behavior Identification
2.4. Model Training
2.5. Model Evaluation
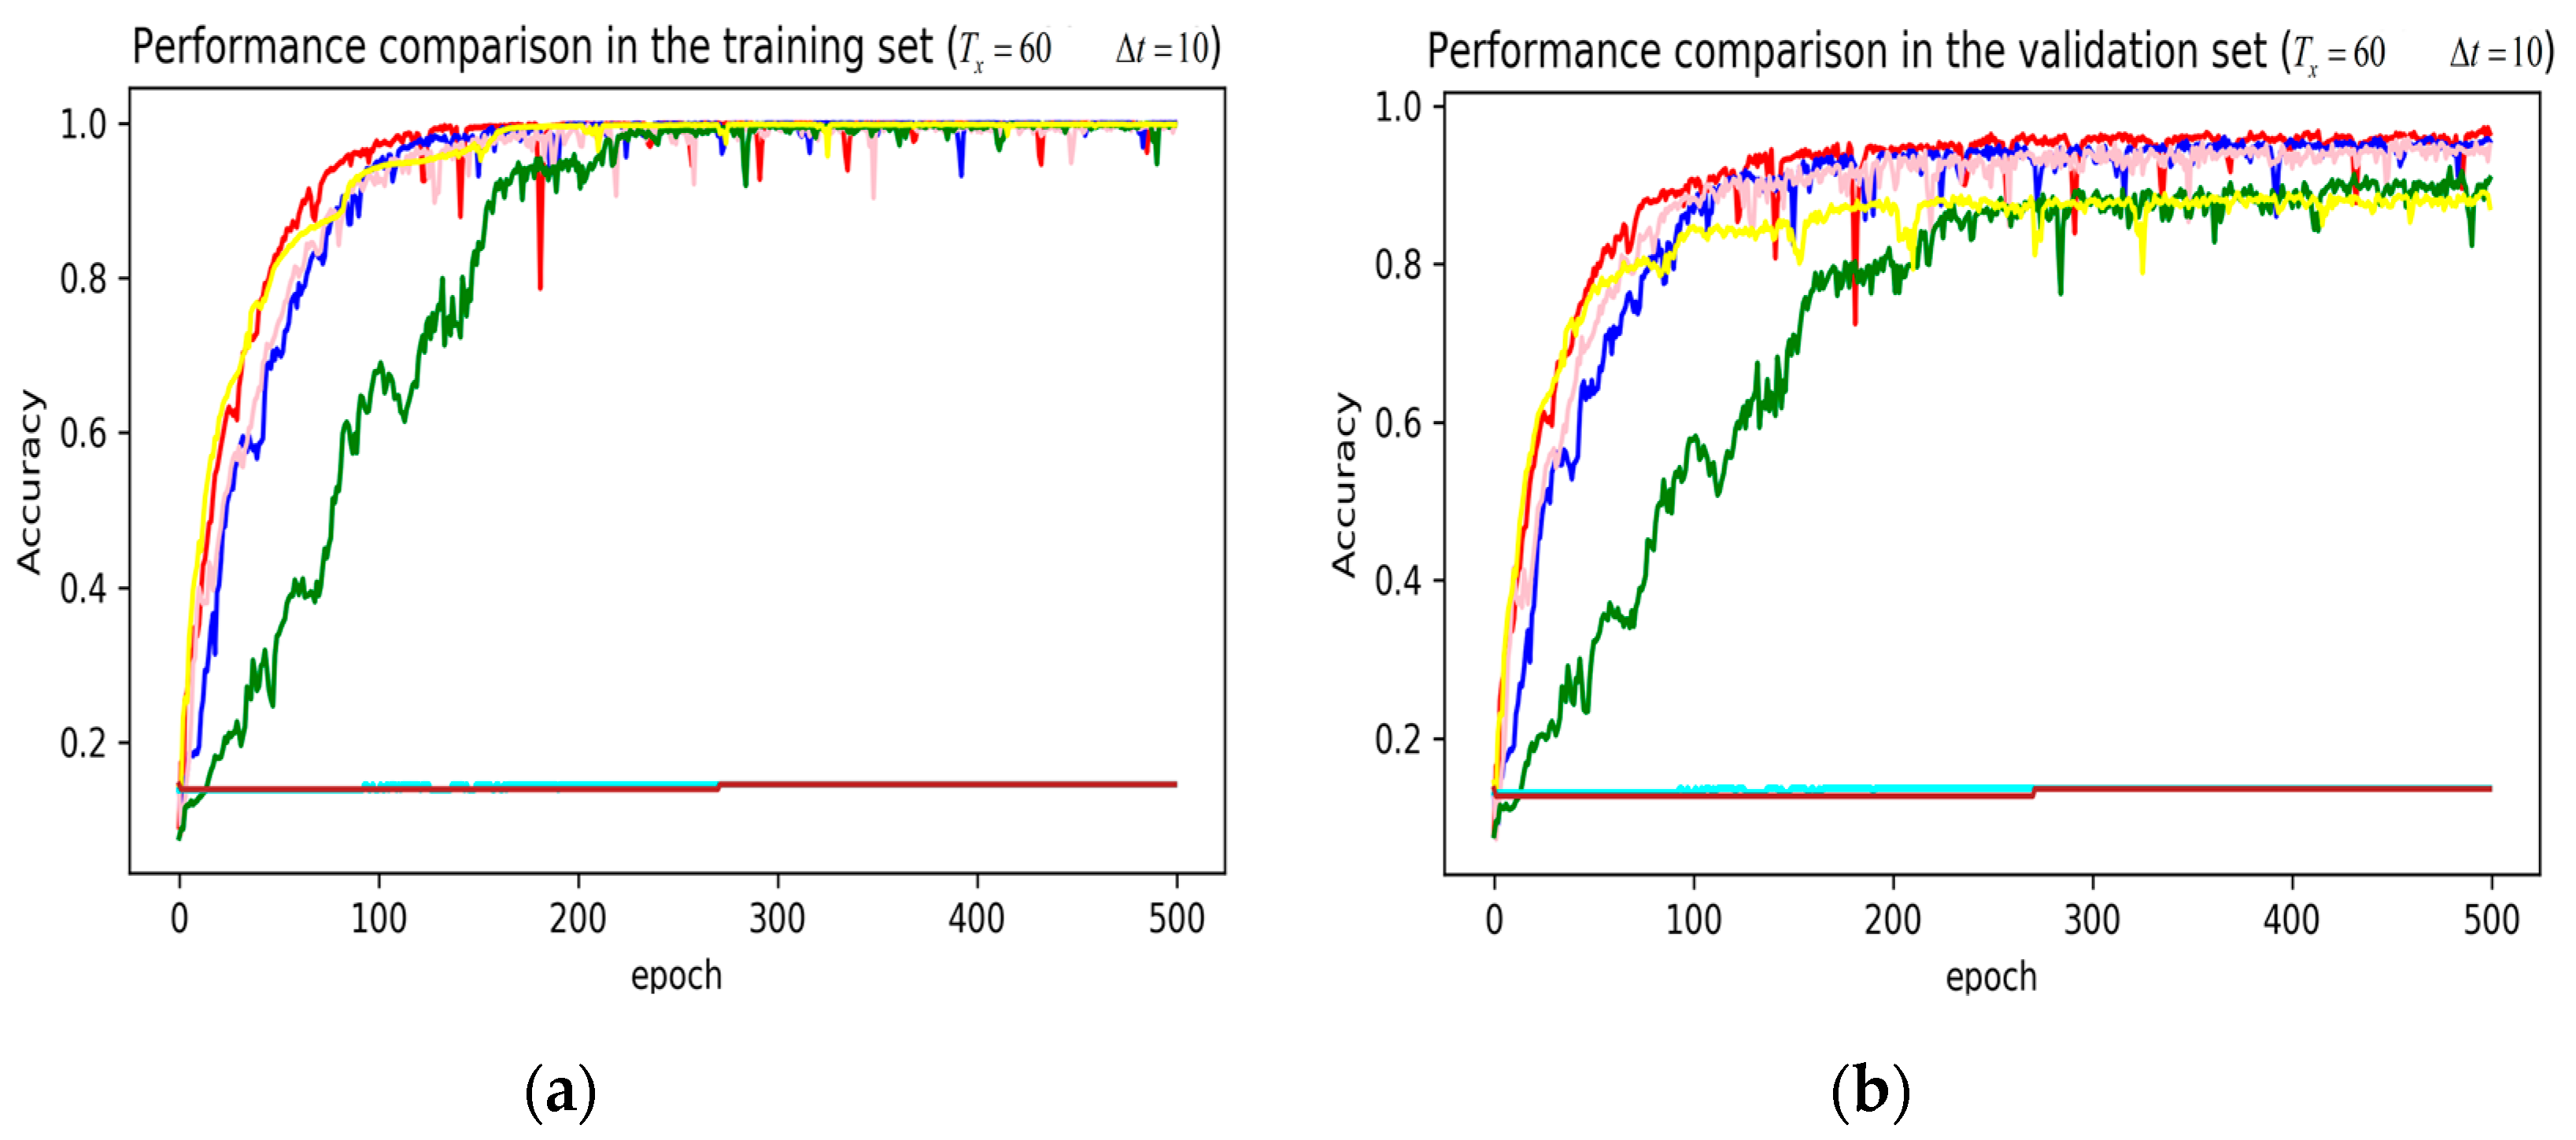
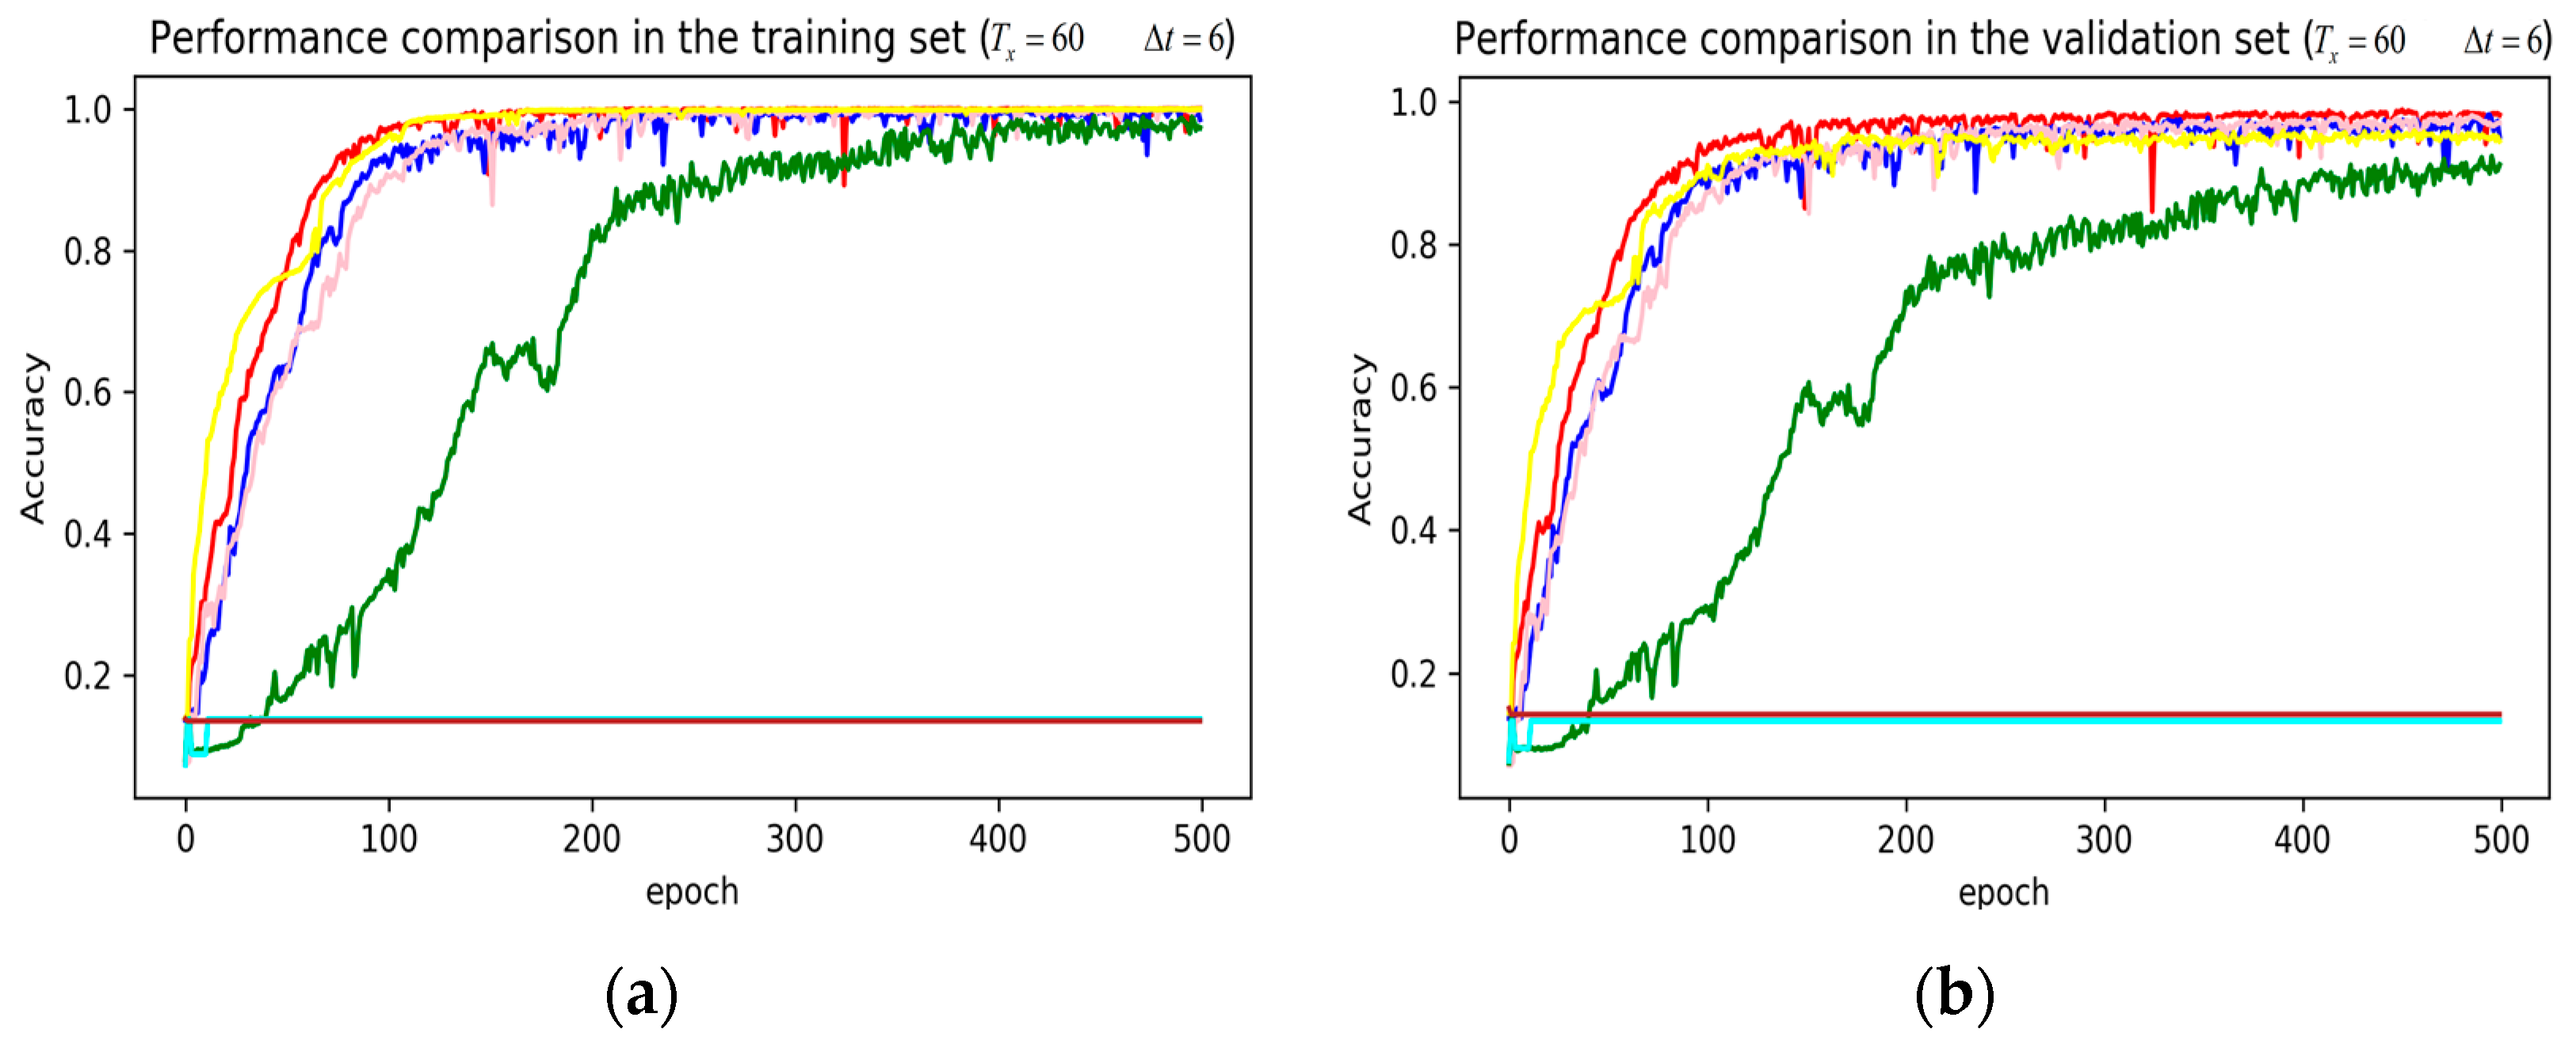
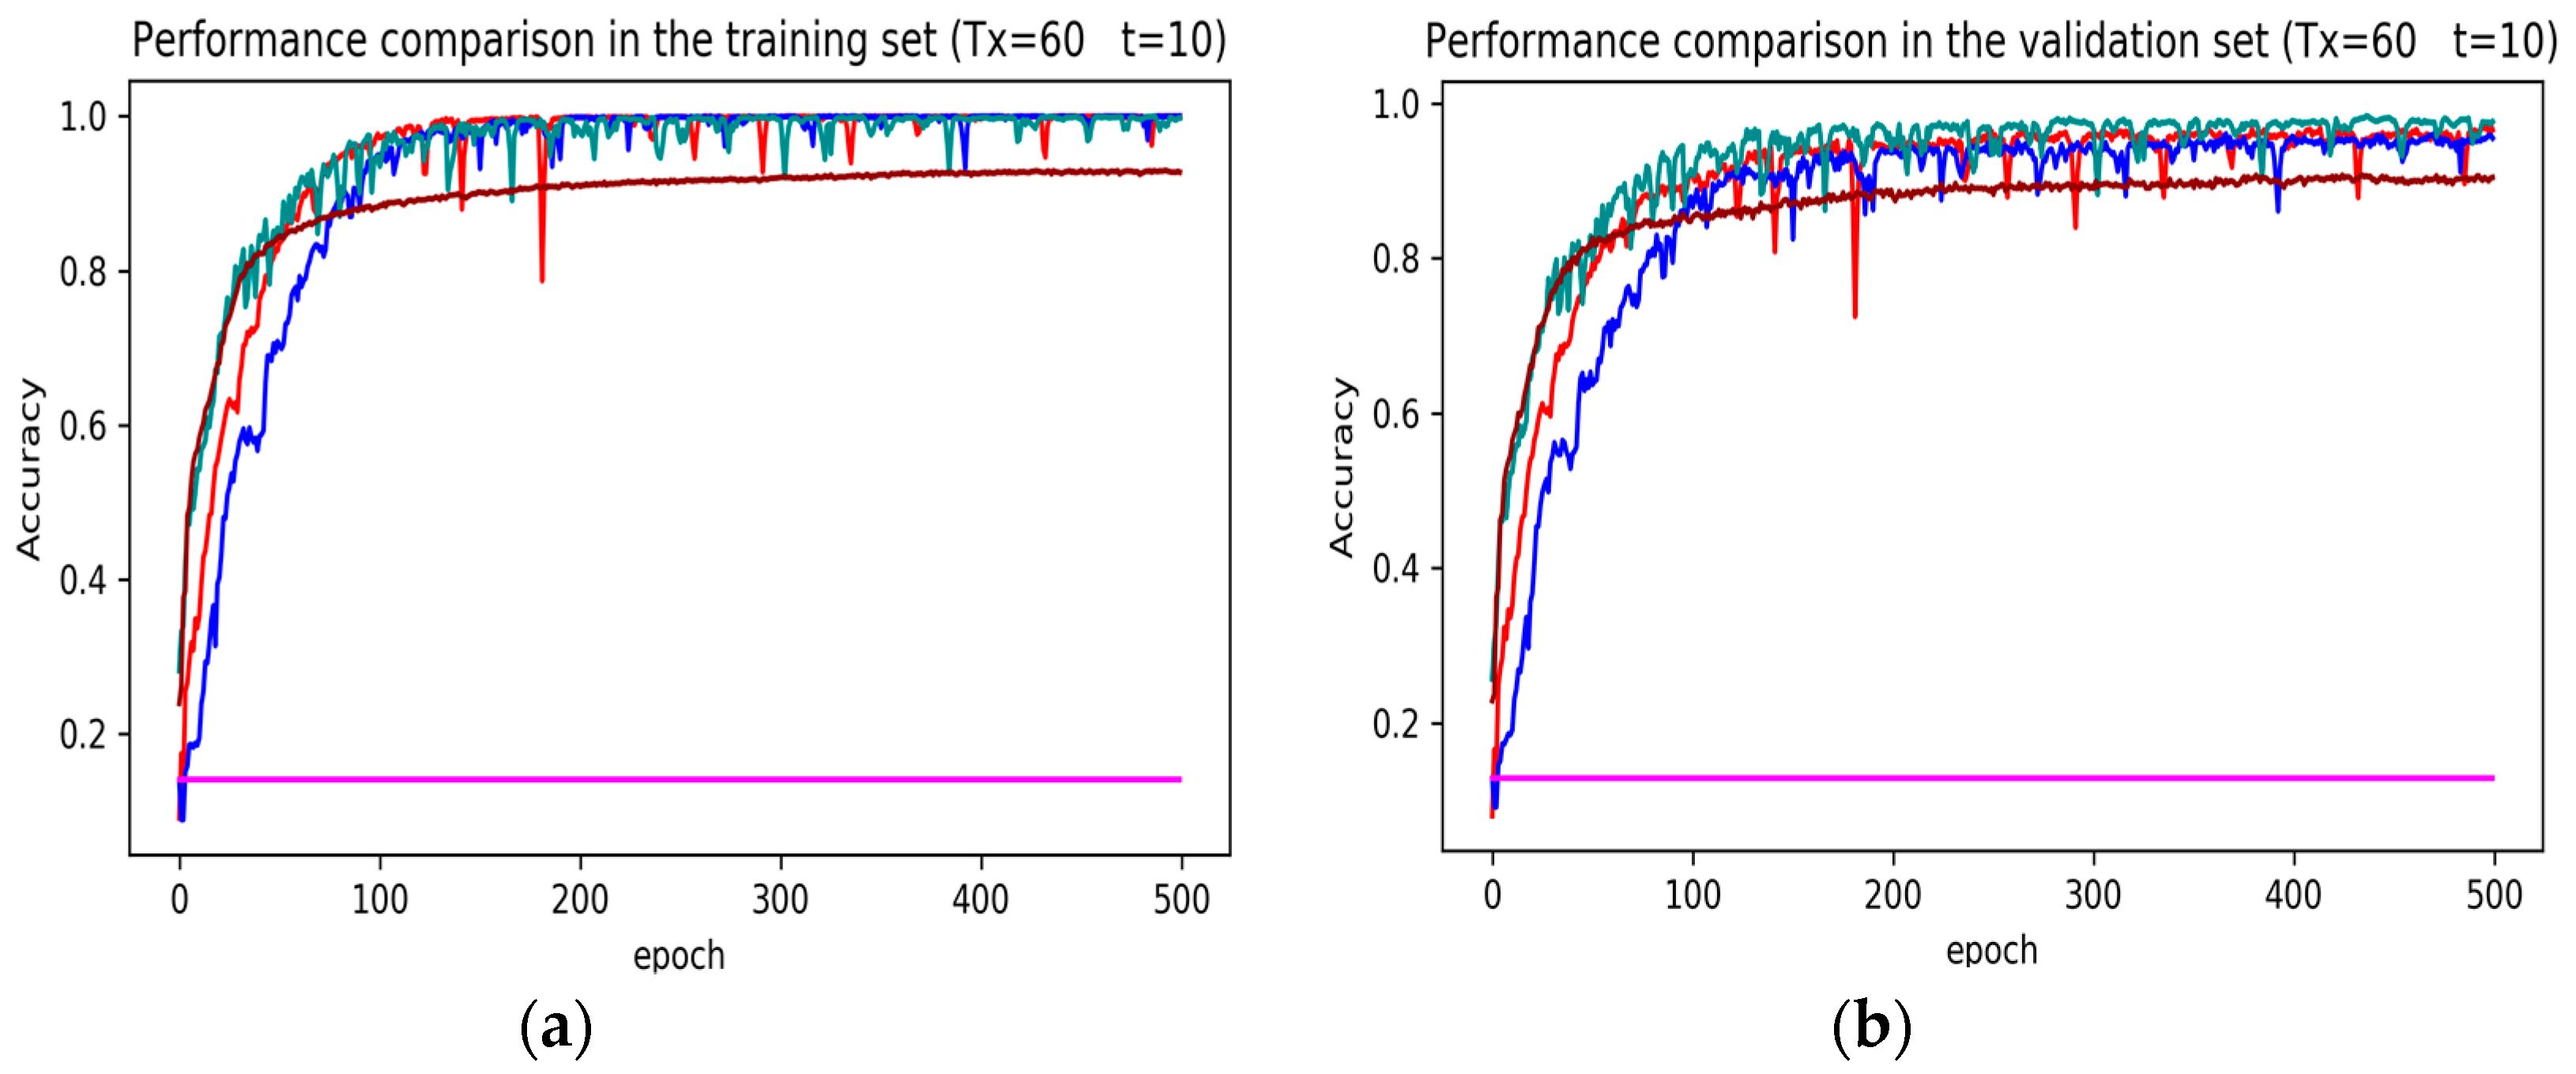
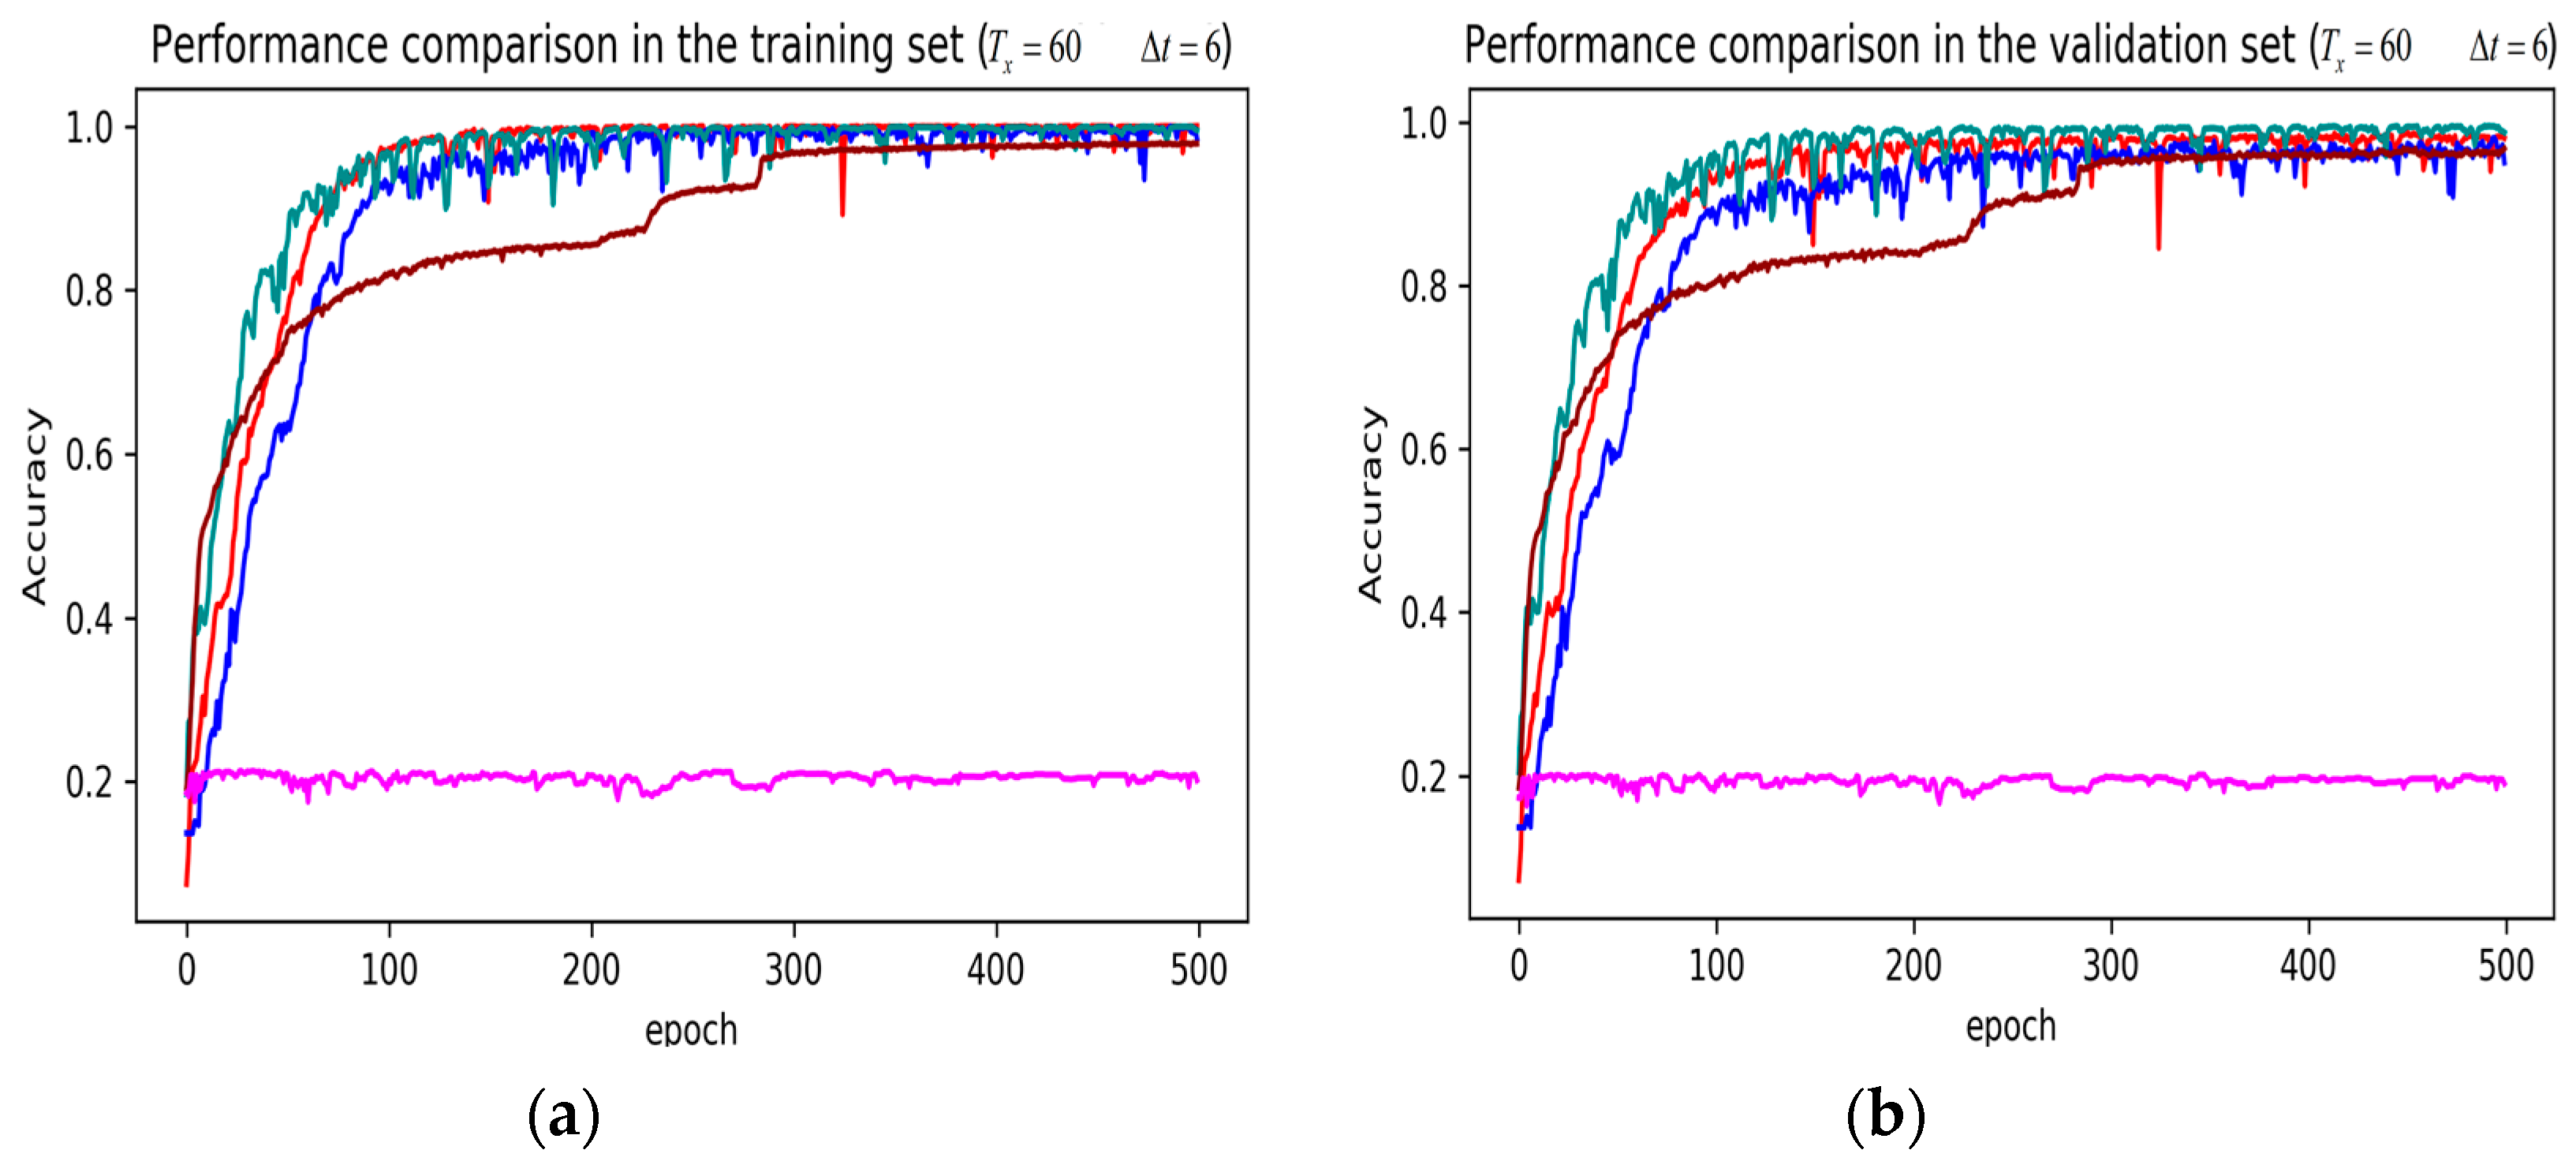
3. Results
4. Discussion
5. Conclusions
Author Contributions
Funding
Acknowledgments
Conflicts of Interest
References
- Enev, M.; Takakuwa, A.; Koscher, K.; Kohno, T. Automobile Driver Fingerprinting. Proc. Priv. Enhanc. Technol. 2016, 2016, 34–50. [Google Scholar] [CrossRef]
- Nishiwaki, Y.; Ozawa, K.; Wakita, T.; Miyajima, C.; Itou, K.; Takeda, K. Driver identification based on spectral analysis of driving behavioral signals. In Advances for in-Vehicle and Mobile Systems; Springer: Berlin/Heidelberg, Germany, 2007; pp. 25–34. [Google Scholar]
- Wahab, A.; Quek, C.; Tan, C.K.; Takeda, K. Driving profile modeling and recognition based on soft computing approach. IEEE Trans. Neural Netw. 2009, 20, 563–582. [Google Scholar] [CrossRef]
- Zhang, X.; Zhao, X.; Rong, J. A study of individual characteristics of driving behavior based on hidden markov model. Sens. Transducers 2014, 167, 194. [Google Scholar]
- Kaplan, S.; Guvensan, M.A.; Yavuz, A.G.; Karalurt, Y. Driver Behavior Analysis for Safe Driving: A Survey. IEEE Trans. Intell. Transp. Syst. 2015, 16, 3017–3032. [Google Scholar] [CrossRef]
- Choi, S.; Kim, J.; Kwak, D.; Angkititrakul, P.; Hansen, J.H. Analysis and classification of driver behavior using in-vehicle can-bus information. In Proceedings of the ITS World Congress 2012, Vienna, Austria, 22–26 October 2012. [Google Scholar]
- Kedar-Dongarkar, G.; Das, M. Driver classification for optimization of energy usage in a vehicle. Procedia Comput. Sci. 2012, 8, 388–393. [Google Scholar] [CrossRef]
- Van Ly, M.; Martin, S.; Trivedi, M.M. Driver classification and driving style recognition using inertial sensors. In Proceedings of the Intelligent Vehicles Symposium IEEE, Gold Coast City, Australia, 23–26 June 2013; pp. 1040–1045. [Google Scholar]
- Liu, H.; Taniguchi, T.; Tanaka, Y.; Takenaka, K.; Bando, T. Visualization of Driving Behavior Based on Hidden Feature Extraction by Using Deep Learning. IEEE Trans. Intell. Transp. Syst. 2017, 18, 2477–2489. [Google Scholar] [CrossRef]
- Liu, H.L.; Taniguchi, T.; Takano, T.; Tanaka, Y. Visualization of driving behavior using deep sparse autoencoder. In Proceedings of the Intelligent Vehicles Symposium IEEE, Ypsilanti, MI, USA, 8–11 June 2014; pp. 1427–1434. [Google Scholar]
- Fazeen, M.; Gozick, B.; Dantu, R.; Bhukhiya, M.; González, M.C. Safe Driving Using Mobile Phones. IEEE Trans. Intell. Transp. Syst. 2012, 13, 1462–1468. [Google Scholar] [CrossRef]
- Dai, J.; Teng, J.; Bai, X.; Shen, Z.; Xuan, D. Mobile phone based drunk driving detection. In Proceedings of the 4th International Conference on Pervasive Computing Technologies for Healthcare, Munich, Germany, 22–25 March 2010; pp. 1–8. [Google Scholar]
- Zaldivar, J.; Calafate, C.T.; Cano, J.C.; Manzoni, P. Providing accident detection in vehicular networks through OBD-II devices and Android-based smartphones. In Proceedings of the IEEE Conference on Local Computer Networks, Bonn, Germany, 4–7 October 2011; pp. 813–819. [Google Scholar]
- Ordóñez, F.J.; Roggen, D. Deep convolutional and lstm recurrent neural networks for multimodal wearable activity recognition. Sensors 2016, 16, 115. [Google Scholar] [CrossRef] [PubMed]
- Miyajima, C.; Nishiwaki, Y.; Ozawa, K.; Wakita, T.; Itou, K.; Takeda, K.; Itakura, F. Driver modeling based on driving behavior and its evaluation in driver identification. Proc. IEEE 2007, 95, 427–437. [Google Scholar] [CrossRef]
- Wakita, T.; Ozawa, K.; Miyajima, C.; Igarashi, K.; Itou, K.; Takeda, K.; Itakura, F. Driver identification using driving behavior signals. In Proceedings of the IEEE Intelligent Transportation Systems Conference, Toronto, ON, Canada, 17–20 September 2006; pp. 396–401. [Google Scholar]
- Meng, X.; Lee, K.K.; Xu, Y. Human Driving Behavior Recognition Based on Hidden Markov Models. In Proceedings of the IEEE International Conference on Robotics & Biomimetics, Sanya, China, 15–28 December 2007. [Google Scholar]
- Krizhevsky, A.; Sutskever, I.; Hinton, G.E. ImageNet classification with deep convolutional neural networks. In Proceedings of the International Conference on Neural Information Processing Systems, Lake Tahoe, NV, USA, 3–6 December 2012; pp. 1097–1105. [Google Scholar]
- Foland, W.; Martin, J.H. CU-NLP at SemEval-2016 Task 8: AMR Parsing using LSTM-based Recurrent Neural Networks. In Proceedings of the International Workshop on Semantic Evaluation, San Diego, CA, USA, 16–17 June 2016; pp. 1197–1201. [Google Scholar]
- Ha, S.; Choi, S. Convolutional neural networks for human activity recognition using multiple accelerometer and gyroscope sensors. In Proceedings of the International Joint Conference on Neural Networks, Vancouver, BC, Canada, 24–29 July 2016. [Google Scholar]
- Duffner, S.; Berlemont, S.; Lefebvre, G.; Garcia, C. 3D gesture classification with convolutional neural networks. In Proceedings of the IEEE International Conference on Acoustics, Speech and Signal Processing, Florence, Italy, 4–9 May 2014. [Google Scholar]
- Zeng, M.; Nguyen, L.T.; Yu, B.; Mengshoel, O.J.; Zhu, J.; Wu, P.; Zhang, J. Convolutional Neural Networks for Human Activity Recognition using Mobile Sensors. In Proceedings of the International Conference on Mobile Computing, Applications and Services, Berlin, Germany, 12–13 November 2015. [Google Scholar]
- Sainath, T.N.; Vinyals, O.; Senior, A.; Sak, H. Convolutional, long short-term memory, fully connected deep neural networks. In Proceedings of the IEEE International Conference on Acoustics, South Brisbane, Australia, 19–24 April 2015; pp. 4580–4584. [Google Scholar]
- Bilgera, C.; Yamamoto, A.; Sawano, M.; Matsukura, H.; Ishida, H. Application of Convolutional Long Short-Term Memory Neural Networks to Signals Collected from a Sensor Network for Autonomous Gas Source Localization in Outdoor Environments. Sensors 2018, 18, 4484. [Google Scholar] [CrossRef] [PubMed]
- Liu, T.; Bao, J.; Wang, J.; Zhang, Y. A Hybrid CNN–LSTM Algorithm for Online Defect Recognition of CO2 Welding. Sensors 2018, 18, 4369. [Google Scholar] [CrossRef] [PubMed]
- Nguyen, V.; Nguyen, M.; Choi, J.; Kim, Y. NLOS Identification in WLANs Using Deep LSTM with CNN Features. Sensors 2018, 18, 4057. [Google Scholar] [CrossRef] [PubMed]
- Kwak, B.I.; Woo, J.; Kim, H.K.; Huy, K. Know your master: Driver profiling-based anti-theft method. In Proceedings of the 14th Annual Conference on Privacy, Security and Trust, Auckland, New Zealand, 12–14 December 2016. [Google Scholar]
- Driving Dataset. Available online: http://ocslab.hksecurity.net/Datasets/driving-dataset (accessed on 19 November 2018).
- AI/ML Based Driver Classification Challenge Track. Available online: http://datachallenge.kr/challenge18/vehicle/introduction/ (accessed on 22 February 2019).
- Attention Mechanism. Available online: https://blog.heuritech.com/2016/01/20/attention-mechanism/ (accessed on 19 November 2018).
- Li, X. cnnPlusLSTM. Available online: https://github.com/lixiaoyu0575/cnnPlusLSTM (accessed on 19 September 2018).
- Saeed, A. Implementing a CNN for Human Activity Recognition in Tensorflow. Available online: http://aqibsaeed.github.io/2016-11-04-human-activity-recognition-cnn/ (accessed on 19 September 2018).
- Chollet, F. Xception: Deep Learning with Depthwise Separable Convolutions. In Proceedings of the 2017 IEEE Conference on Computer Vision and Pattern Recognition, Honolulu, HI, USA, 21–26 July 2017; pp. 1800–1807. [Google Scholar]
- Graves, A. Generating sequences with recurrent neural networks. arXiv, 2013; arXiv:1308.0850. [Google Scholar]
- Chung, J.; Gulcehre, C.; Cho, K.H.; Bengio, Y. Empirical evaluation of gated recurrent neural networks on sequence modeling. arXiv, 2014; arXiv:1412.3555. [Google Scholar]
- Fawcett, T. An introduction to ROC analysis. Pattern Recogn. Lett. 2005, 27, 861–874. [Google Scholar] [CrossRef]
- Jiménez, D.; Hernández, S.; Fraile-Ardanuy, J.; Serrano, J.; Fernández, R.; Álvarez, F. Modelling the Effect of Driving Events on Electrical Vehicle Energy Consumption Using Inertial Sensors in Smartphones. Energies 2018, 11, 412. [Google Scholar] [CrossRef]
- Wang, Y.; Ho, I.W. Joint Deep Neural Network Modelling and Statistical Analysis on Characterizing Driving Behaviors. In Proceedings of the 2018 IEEE Intelligent Vehicles Symposium (IV), Changshu, China, 26–30 June 2018; pp. 1–6. [Google Scholar]
- Carvalho, E.; Ferreira, B.V.; Ferreira, J.; De Souza, C.; Carvalho, H.V.; Suhara, Y.; Pentland, A.S.; Pessin, G. Exploiting the use of recurrent neural networks for driver behavior profiling. In Proceedings of the 2017 International Joint Conference on Neural Networks (IJCNN), Anchorage, AK, USA, 14–19 May 2017. [Google Scholar]
- Guo, F.; Fang, Y. Individual driver risk assessment using naturalistic driving data. Accid. Anal. Prev. 2013, 61, 3–9. [Google Scholar] [CrossRef] [PubMed]
- Antin, J.; Lee, S.; Hankey, J.; Dingus, T. Design of the In-Vehicle Driving Behavior and Crash Risk Study: In Support of the SHRP 2 Naturalistic Driving Study; SHRP Report; Transportation Research Board: Washington, DC, USA, 2011. [Google Scholar]
- Bärgman, J.; Lisovskaja, V.; Victor, T.; Flannagan, C.; Dozza, M. How does glance behavior influence crash and injury risk? A ‘what-if’ counterfactual simulation using crashes and near-crashes from SHRP2. Transp. Res. F 2015, 35, 152–169. [Google Scholar] [CrossRef]


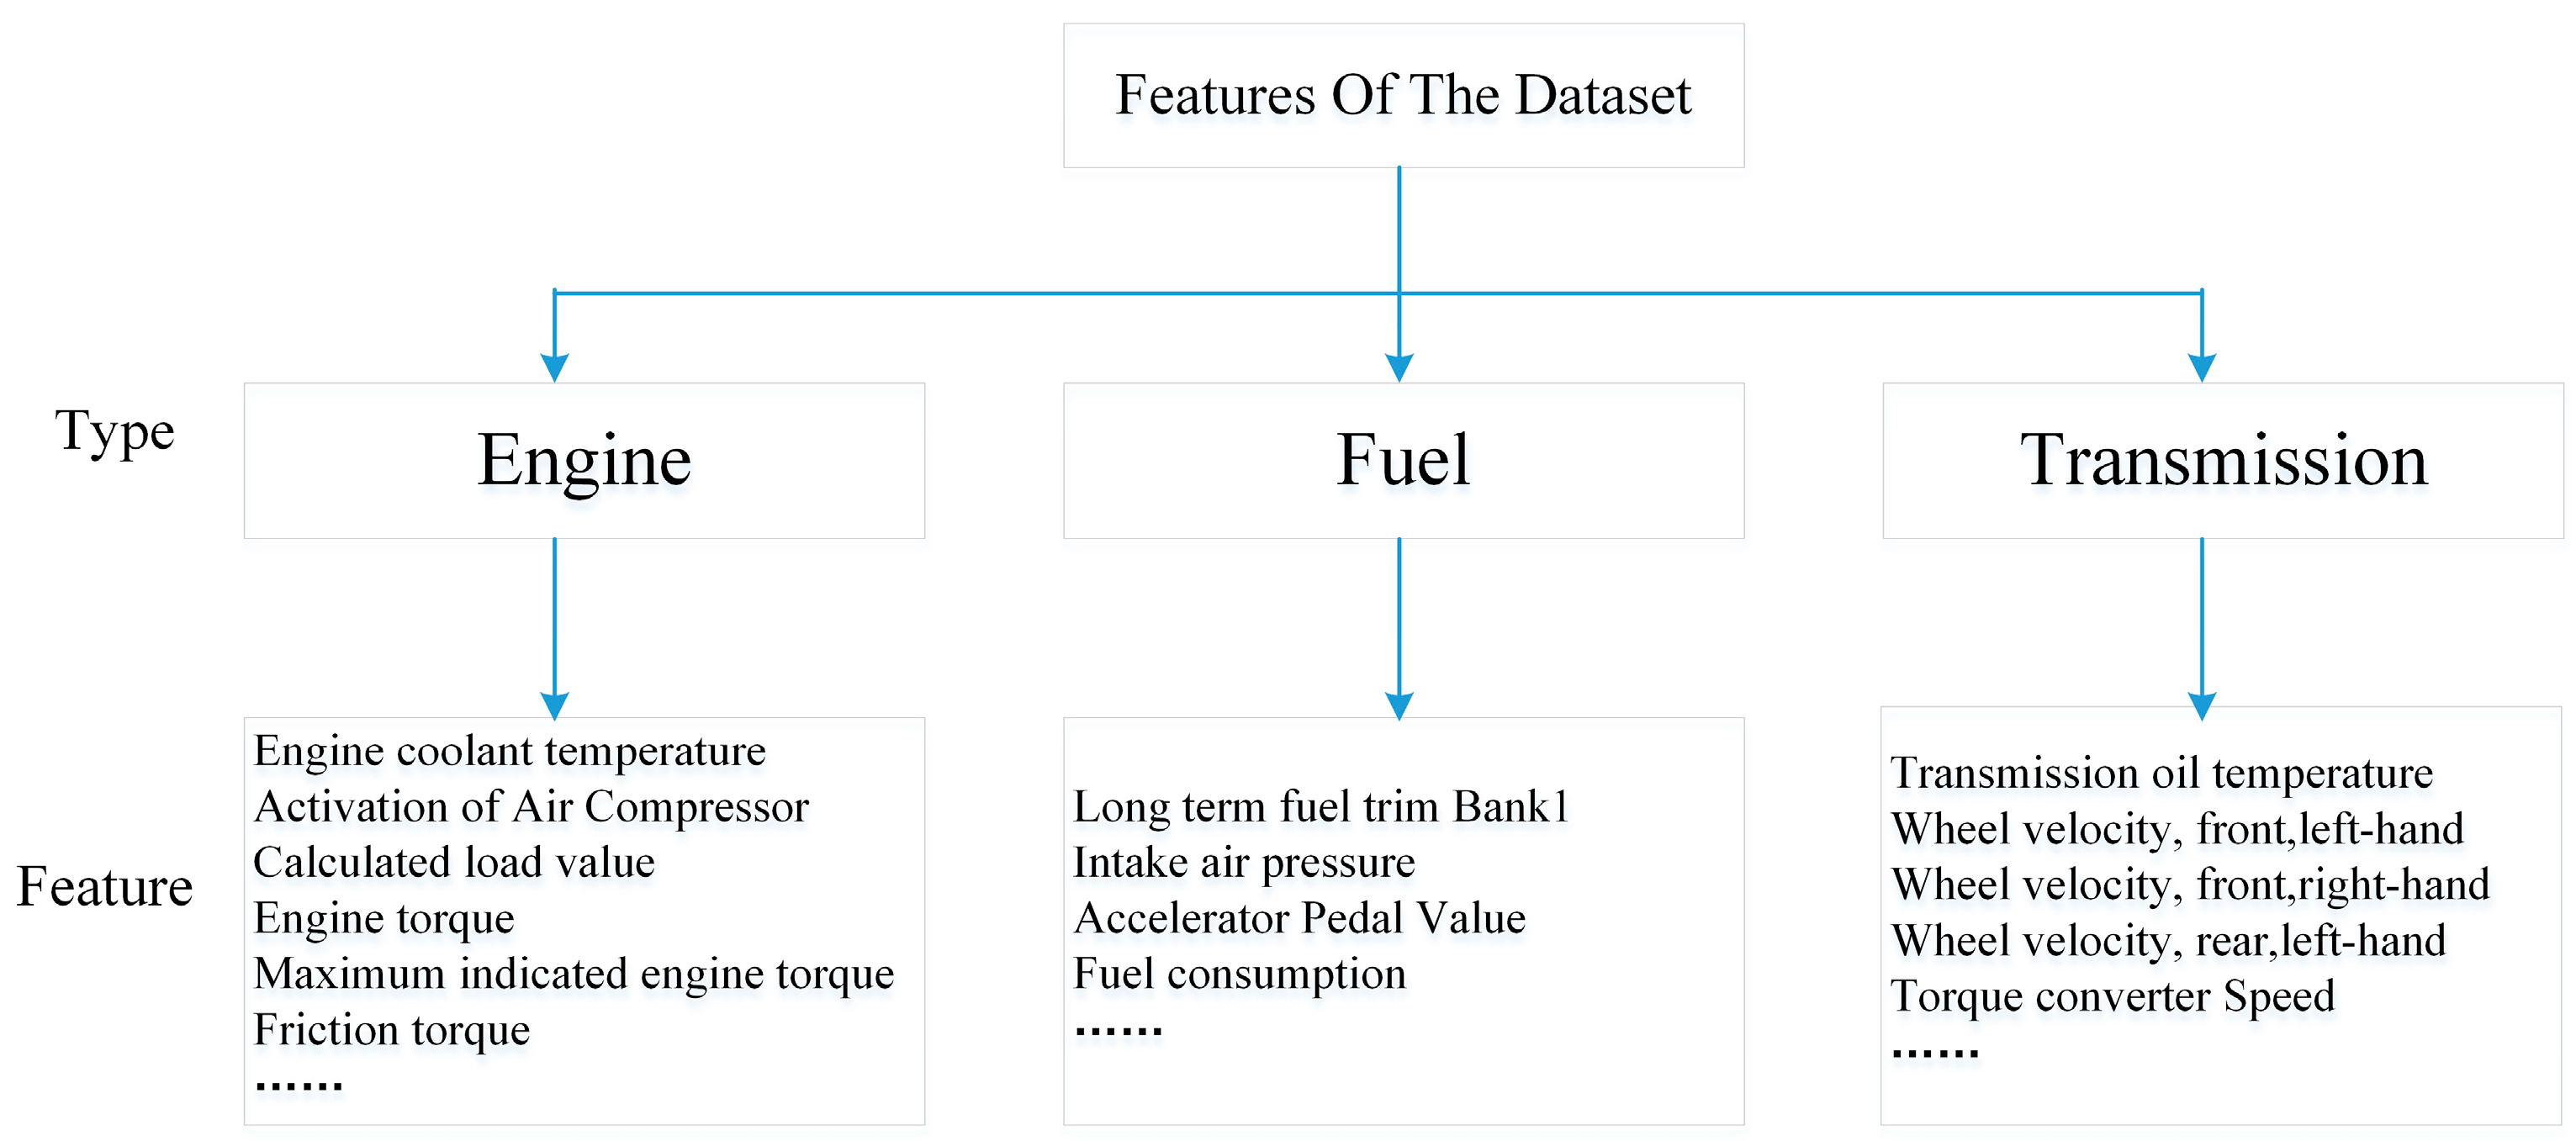
| Selected 15D Features | Statistical 45D Features |
|---|---|
| ‘Long term fuel trim bank’, ’Intake air pressure’, ‘Accelerator pedal value’, ‘Fuel consumption’, ‘Friction torque’, ‘Maximum indicated engine torque’, ‘Engine torque’, ‘Calculated load value’, ‘Activation of air compressor’, ‘Engine coolant temperature’, ‘Transmission oil temperature’, ‘Wheel velocity front left-hand’, ‘Wheel velocity front right-hand’, ‘Wheel velocity rear left-hand’, ‘Torque converter speed’ | Mean Median Standard deviation |
| Model | 1 | Dropout | Activation Function | Optimizer |
|---|---|---|---|---|
| DeepConvGRU–Attention | (1 × 60) − 1 × 20 − 1 × 6 − 128 − 128 − 10 | 0.5 | ReLU | Adam |
| DeepConvLSTM–Attention | (1 × 60) − 1 × 20 − 1 × 6 − 128 − 128 − 10 | 0.5 | ReLU | Adam |
| DeepConvGRU | (1 × 60) − 1 × 20 − 1 × 6 − 128 − 128 | 0.5 | ReLU | Adam |
| DeepConvLSTM | (1 × 60) − 1 × 20 − 1 × 6 − 128 − 128 | 0.5 | ReLU | Adam |
| CNN | (1 × 60) − 1 × 20 − 1 × 6 | 0.5 | ReLU | Adam |
| LSTM | 128 − 128 | 0.5 | ReLU | Adam |
| DNN | 1000 − 1000 | 0.5 | ReLU | Adam |
| Model | Selected Features | ||
|---|---|---|---|
| DeepConvGRU-Attention | 90/60/60 | 45/10/6 | original 51D features |
| DeepConvLSTM-Attention | 90/60/60 | 45/10/6 | original 51D features |
| DeepConvGRU | 90/60/60 | 45/10/6 | original 51D features |
| DeepConvLSTM | 90/60/60 | 45/10/6 | original 51D features |
| CNN | 90/60/60 | 45/10/6 | original 51D features |
| LSTM-51 | 90/60/60 | 45/10/6 | original 51D features |
| LSTM-15 | 90/60/60 | 45/10/6 | selected 15D features |
| DNN-51 | 90/60/60 | 45/10/6 | original 51D features |
| DNN-15 | 90/60/60 | 45/10/6 | selected 15D features |
| DNN-45 | 90/60/60 | 45/10/6 | statistical 45D features |
| KNN | 90/60/60 | 45/10/6 | statistical 45D features |
| Decision Tree | 90/60/60 | 45/10/6 | statistical 45D features |
| Random Forest | 90/60/60 | 45/10/6 | statistical 45D features |
| Model | ||||||
|---|---|---|---|---|---|---|
| Accuracy | AUC | F1 Score | ||||
| Mean | Std | Mean | Std | Mean | Std | |
| KNN | 0.812 | 0 | 0.8986 | 0 | 0.8157 | 0 |
| DecisionTree | 0.7432 | 0.0966 | 0.8638 | 0.0502 | 0.7402 | 0.1002 |
| RandomForest | 0.7049 | 0.0589 | 0.8541 | 0.0275 | 0.7565 | 0.0485 |
| DeepConvGRU-Attention | 0.9701 | 0.0052 | 0.9959 | 0.0007 | 0.9702 | 0.0052 |
| DeepConvLSTM-Attention | 0.9524 | 0.0138 | 0.9946 | 0.0015 | 0.9526 | 0.0137 |
| DeepConvGRU | 0.9565 | 0.0091 | 0.9959 | 0.0011 | 0.9563 | 0.0093 |
| DeepConvLSTM | 0.905 | 0.0062 | 0.9887 | 0.0008 | 0.9047 | 0.0064 |
| CNN | 0.9081 | 0.0096 | 0.993 | 0.0013 | 0.908 | 0.0096 |
| LSTM-15 | 0.9774 | 0.012 | 0.9982 | 0.0008 | 0.9771 | 0.0124 |
| DNN-45 | 0.9188 | 0.0301 | 0.9731 | 0.0164 | 0.9145 | 0.0337 |
| Model | ||||||
|---|---|---|---|---|---|---|
| Accuracy | AUC | F1 Score | ||||
| Mean | Std | Mean | Std | Mean | Std | |
| KNN | 0.9033 | 0 | 0.947 | 0 | 0.9045 | 0 |
| DecisionTree | 0.8543 | 0.0062 | 0.9213 | 0.004 | 0.8537 | 0.0069 |
| RandomForest | 0.8739 | 0.0044 | 0.9359 | 0.0025 | 0.8934 | 0.0034 |
| DeepConvGRU-Attention | 0.9836 | 0.0015 | 0.9978 | 0.001 | 0.9836 | 0.0015 |
| DeepConvLSTM-Attention | 0.9786 | 0.0068 | 0.9978 | 0.0006 | 0.9787 | 0.0068 |
| DeepConvGRU | 0.9772 | 0.0062 | 0.9968 | 0.0008 | 0.9772 | 0.0062 |
| DeepConvLSTM | 0.9519 | 0.0186 | 0.9944 | 0.0013 | 0.9497 | 0.019 |
| CNN | 0.9568 | 0.0072 | 0.9984 | 0.0002 | 0.9567 | 0.0073 |
| LSTM-15 | 0.993 | 0.0015 | 0.9996 | 0.0001 | 0.9929 | 0.0015 |
| DNN-45 | 0.9395 | 0.0358 | 0.9682 | 0.0281 | 0.9315 | 0.0493 |
© 2019 by the authors. Licensee MDPI, Basel, Switzerland. This article is an open access article distributed under the terms and conditions of the Creative Commons Attribution (CC BY) license (http://creativecommons.org/licenses/by/4.0/).
Share and Cite
Zhang, J.; Wu, Z.; Li, F.; Xie, C.; Ren, T.; Chen, J.; Liu, L. A Deep Learning Framework for Driving Behavior Identification on In-Vehicle CAN-BUS Sensor Data. Sensors 2019, 19, 1356. https://doi.org/10.3390/s19061356
Zhang J, Wu Z, Li F, Xie C, Ren T, Chen J, Liu L. A Deep Learning Framework for Driving Behavior Identification on In-Vehicle CAN-BUS Sensor Data. Sensors. 2019; 19(6):1356. https://doi.org/10.3390/s19061356
Chicago/Turabian StyleZhang, Jun, ZhongCheng Wu, Fang Li, Chengjun Xie, Tingting Ren, Jie Chen, and Liu Liu. 2019. "A Deep Learning Framework for Driving Behavior Identification on In-Vehicle CAN-BUS Sensor Data" Sensors 19, no. 6: 1356. https://doi.org/10.3390/s19061356
APA StyleZhang, J., Wu, Z., Li, F., Xie, C., Ren, T., Chen, J., & Liu, L. (2019). A Deep Learning Framework for Driving Behavior Identification on In-Vehicle CAN-BUS Sensor Data. Sensors, 19(6), 1356. https://doi.org/10.3390/s19061356