Dynamic Assessment of Masonry Towers Based on Terrestrial Radar Interferometer and Accelerometers


Abstract
1. Introduction
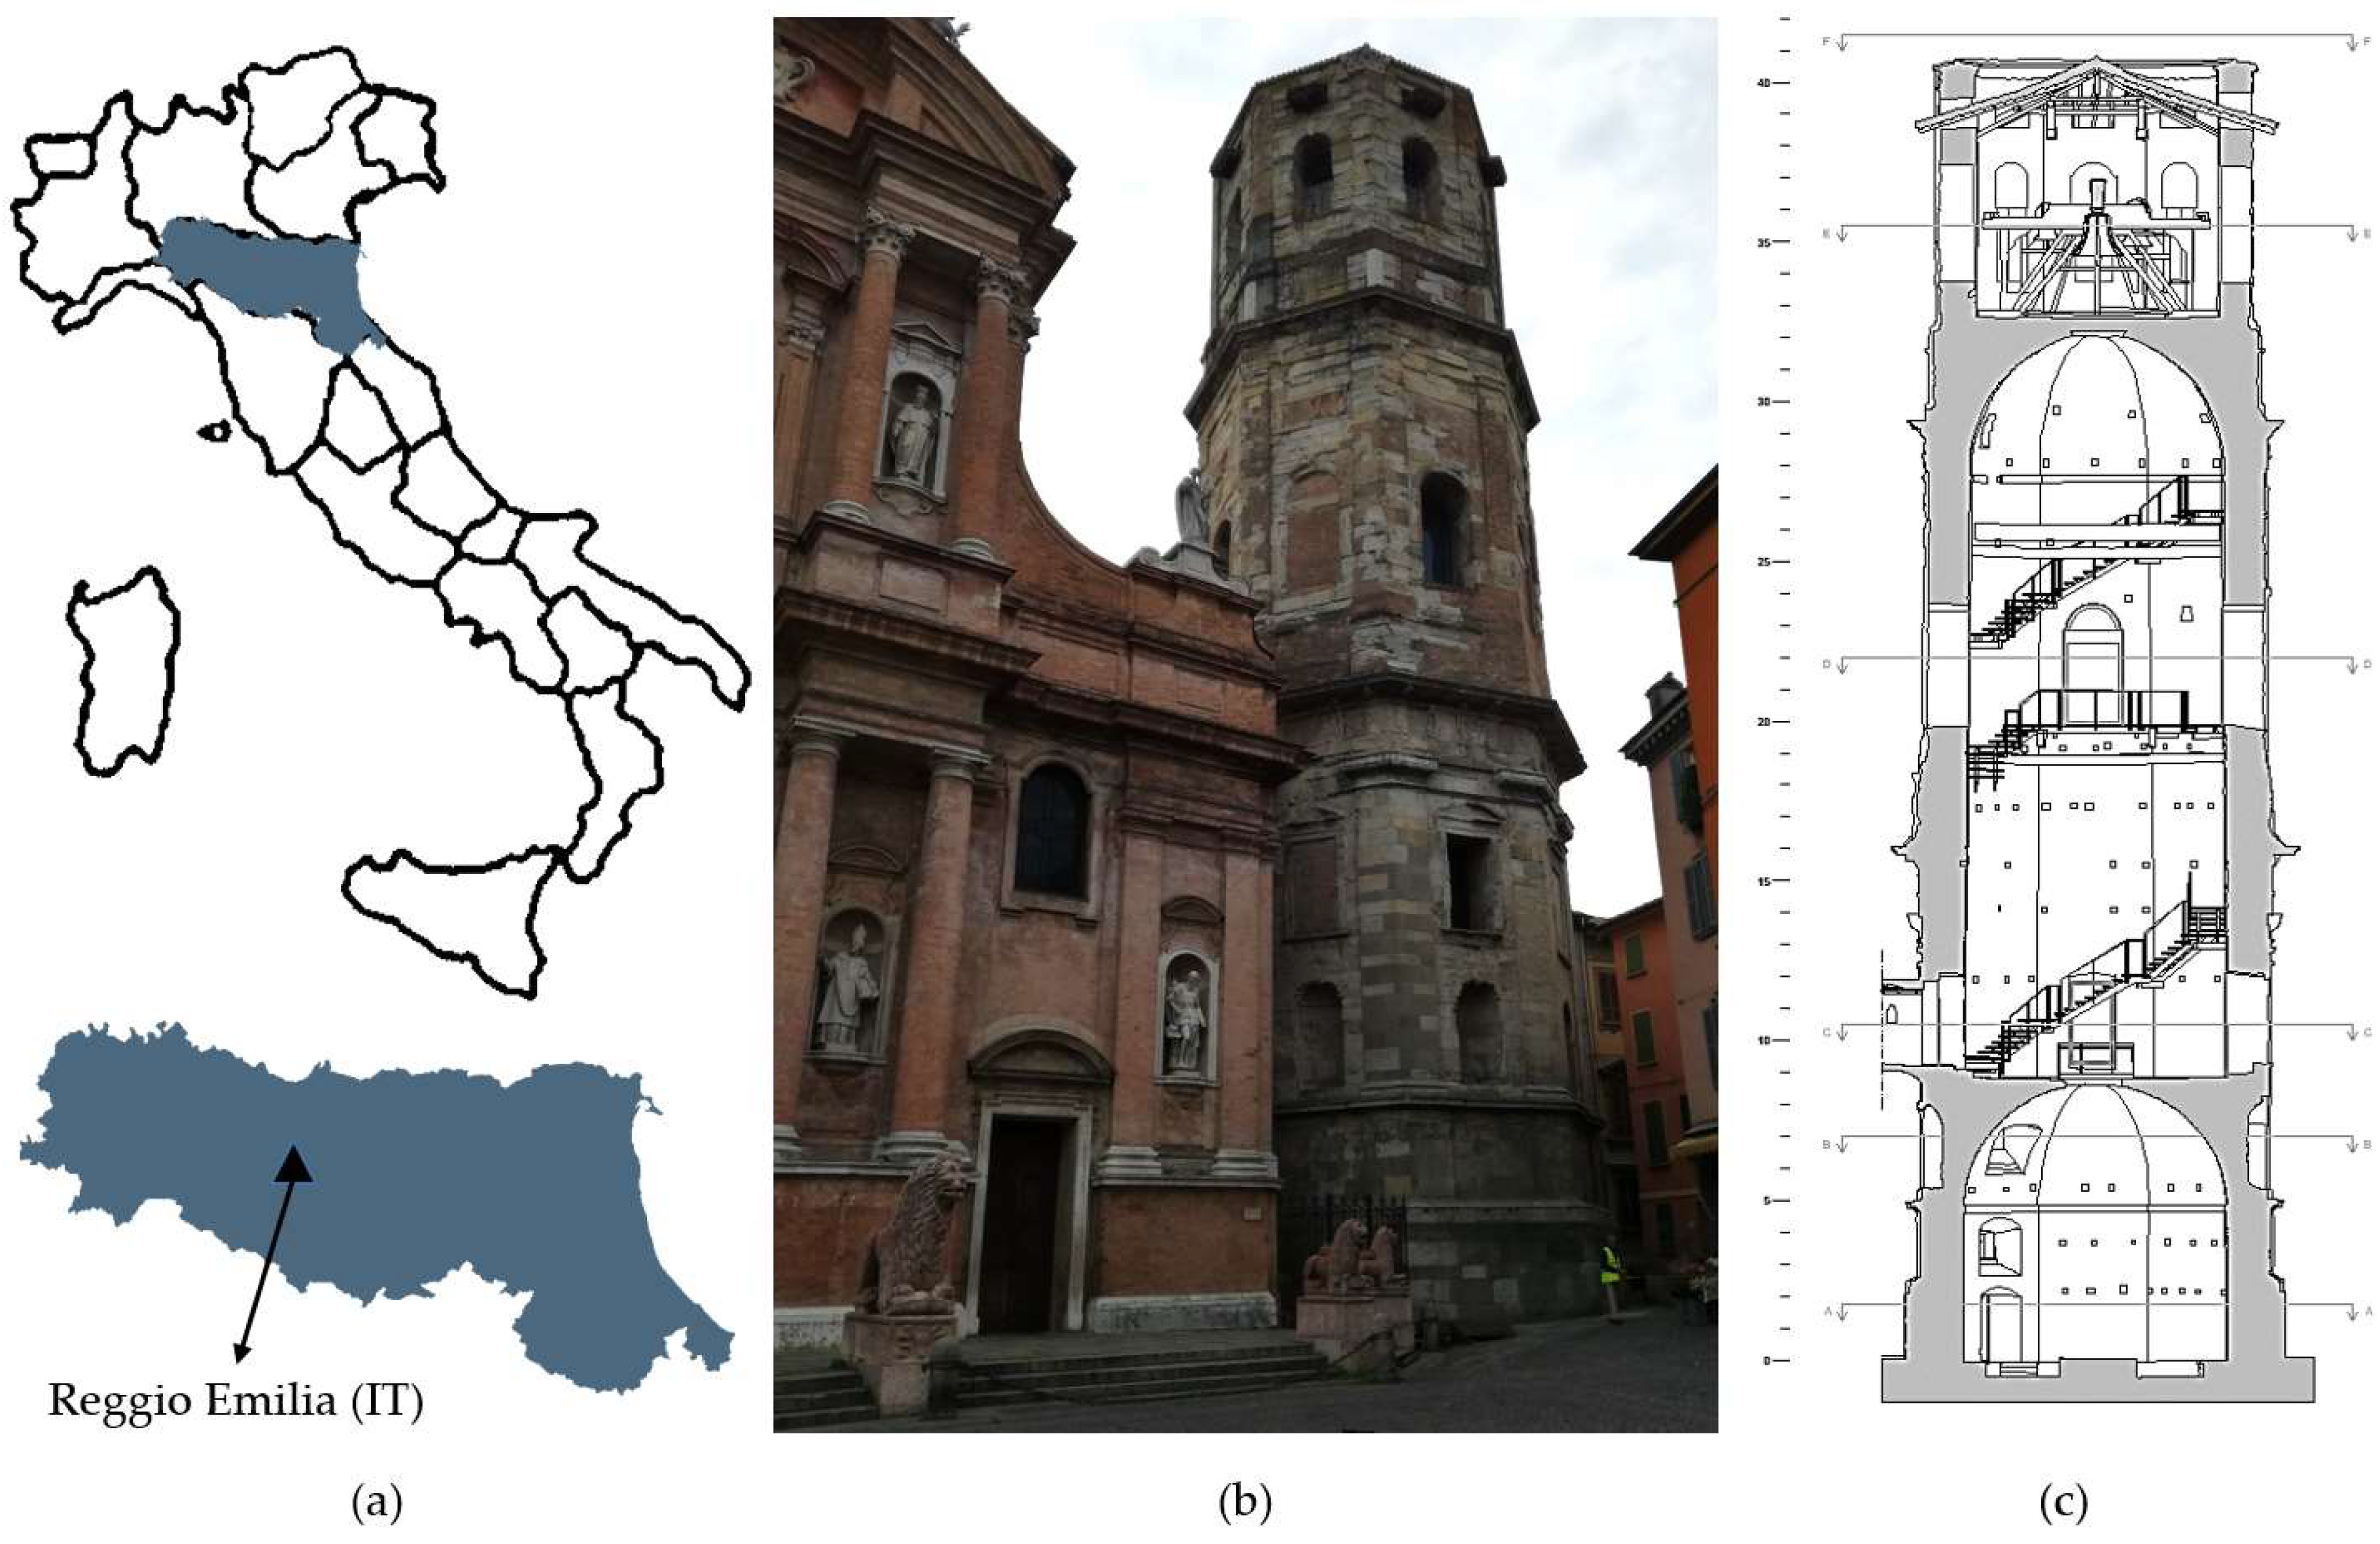
2. The Case Study
2.1. The Tower
2.2. The Bell Ring Forcing
3. Sensors
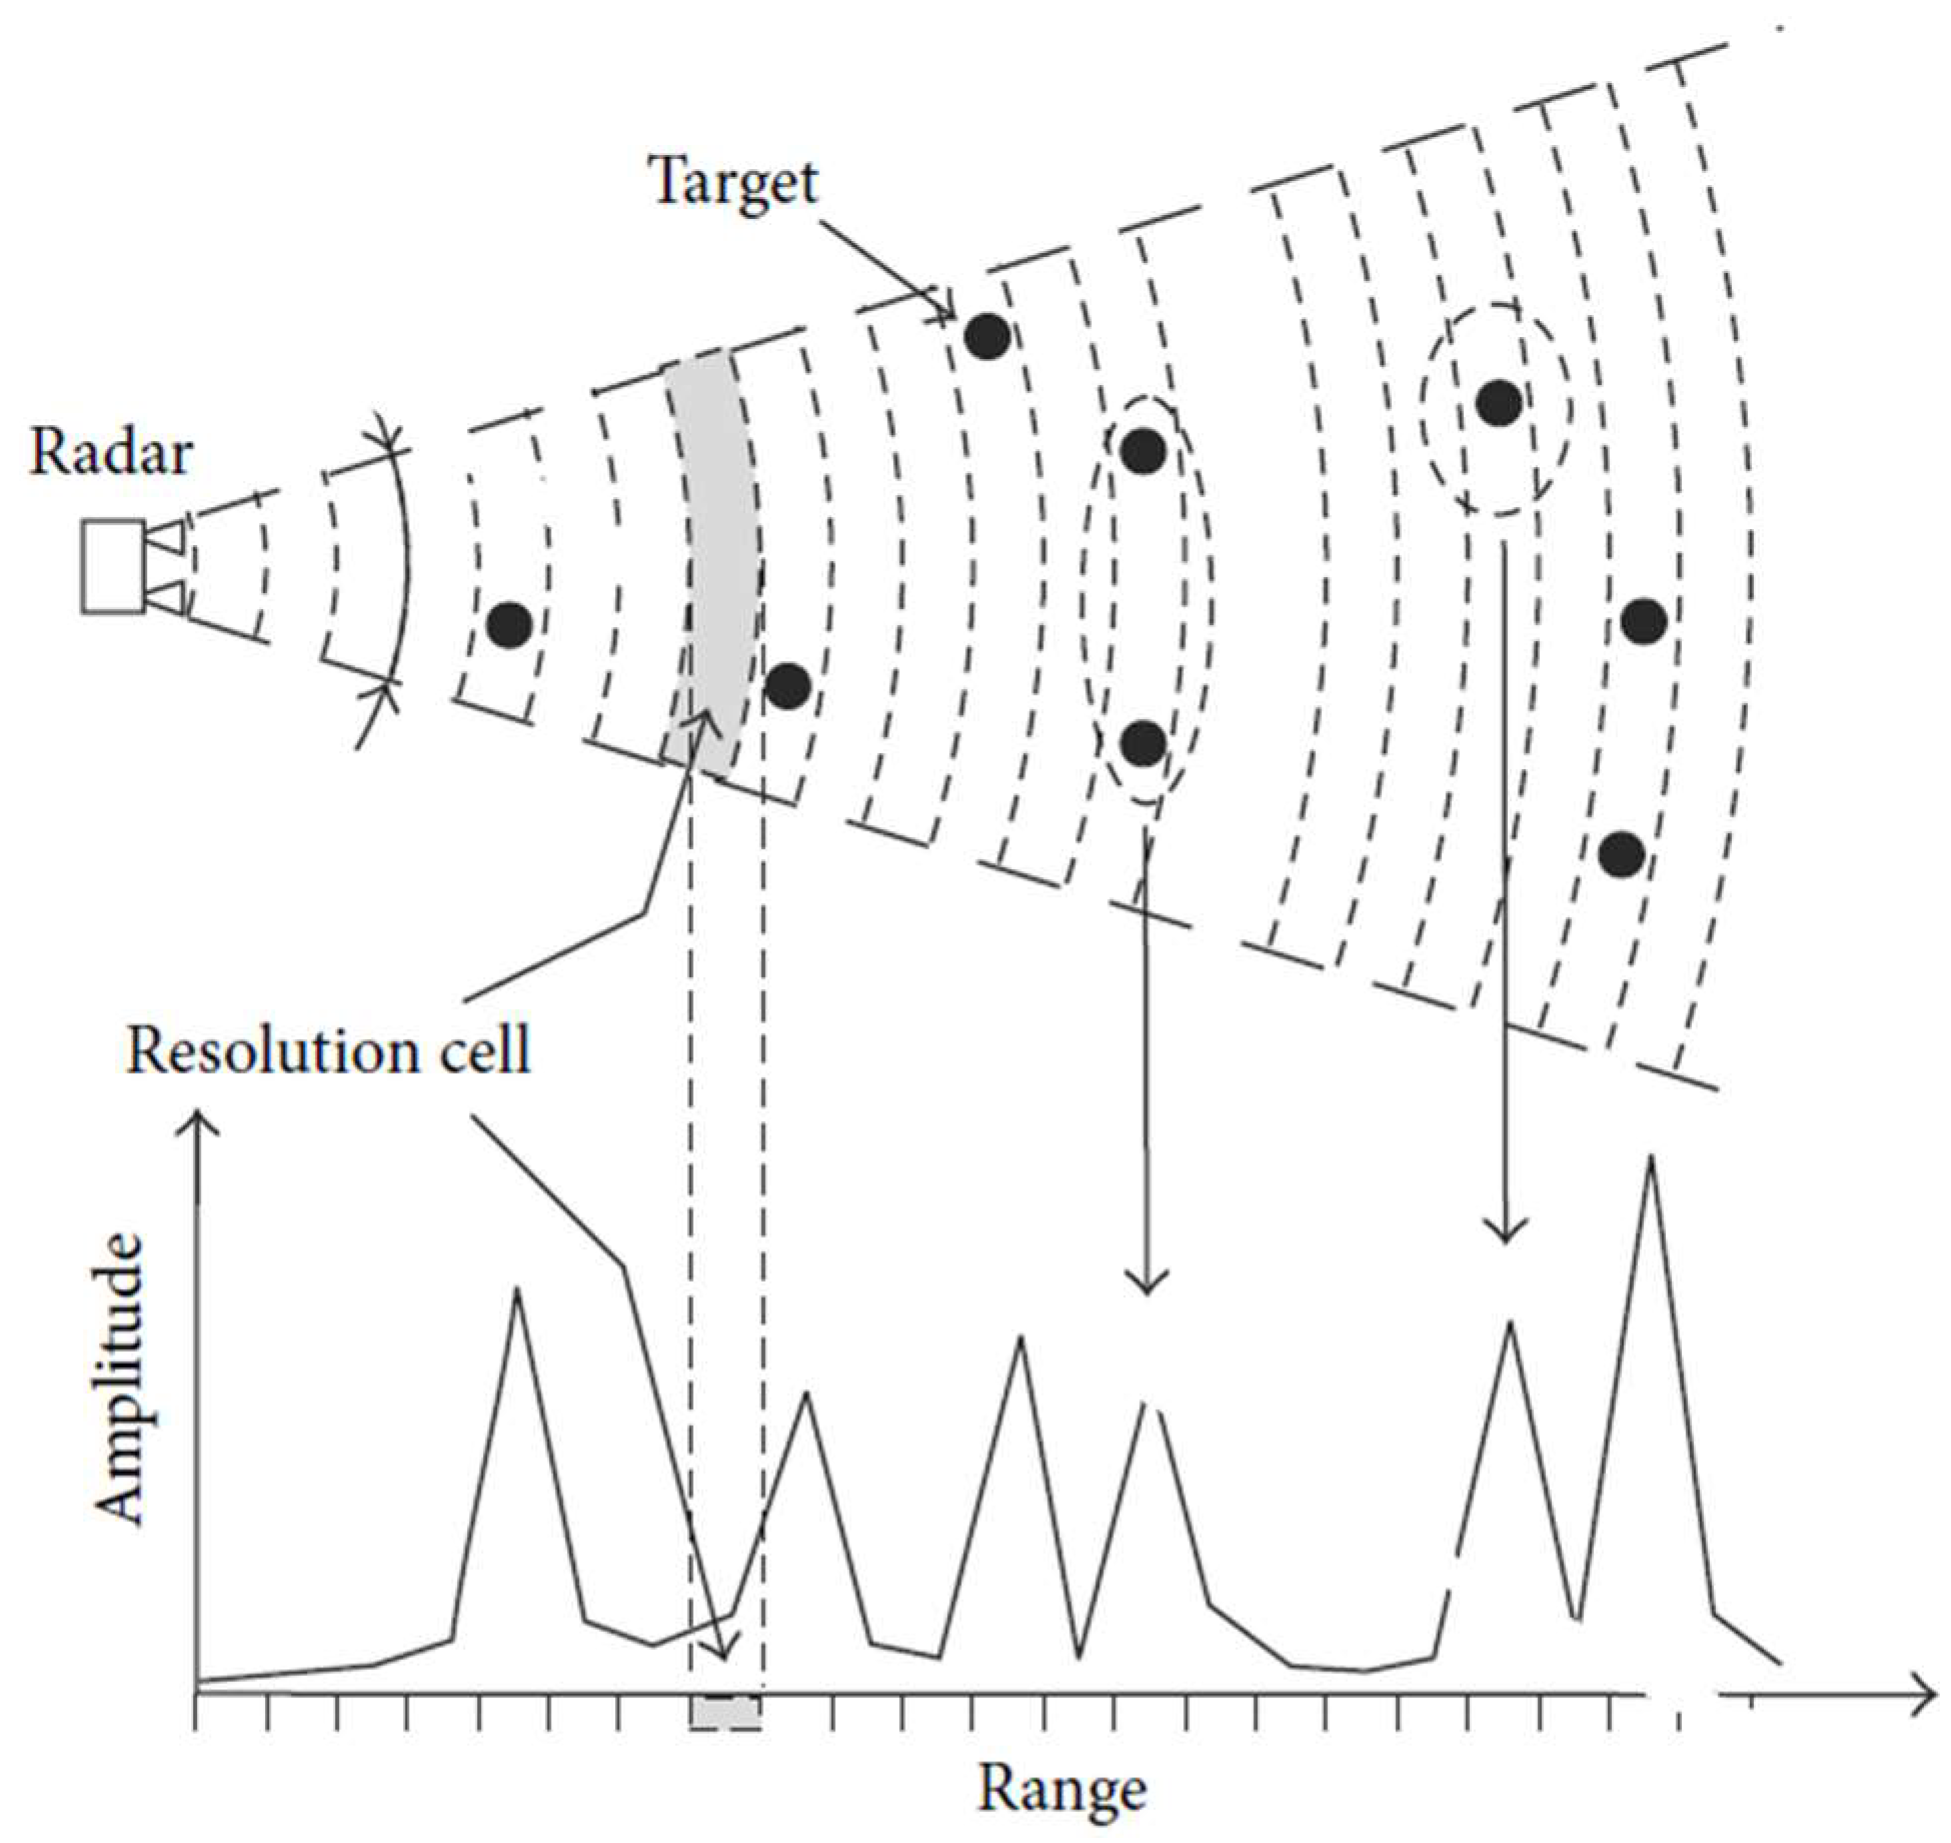
3.1. The Real Aperture Radar (RAR) Terrestrial Interferometer
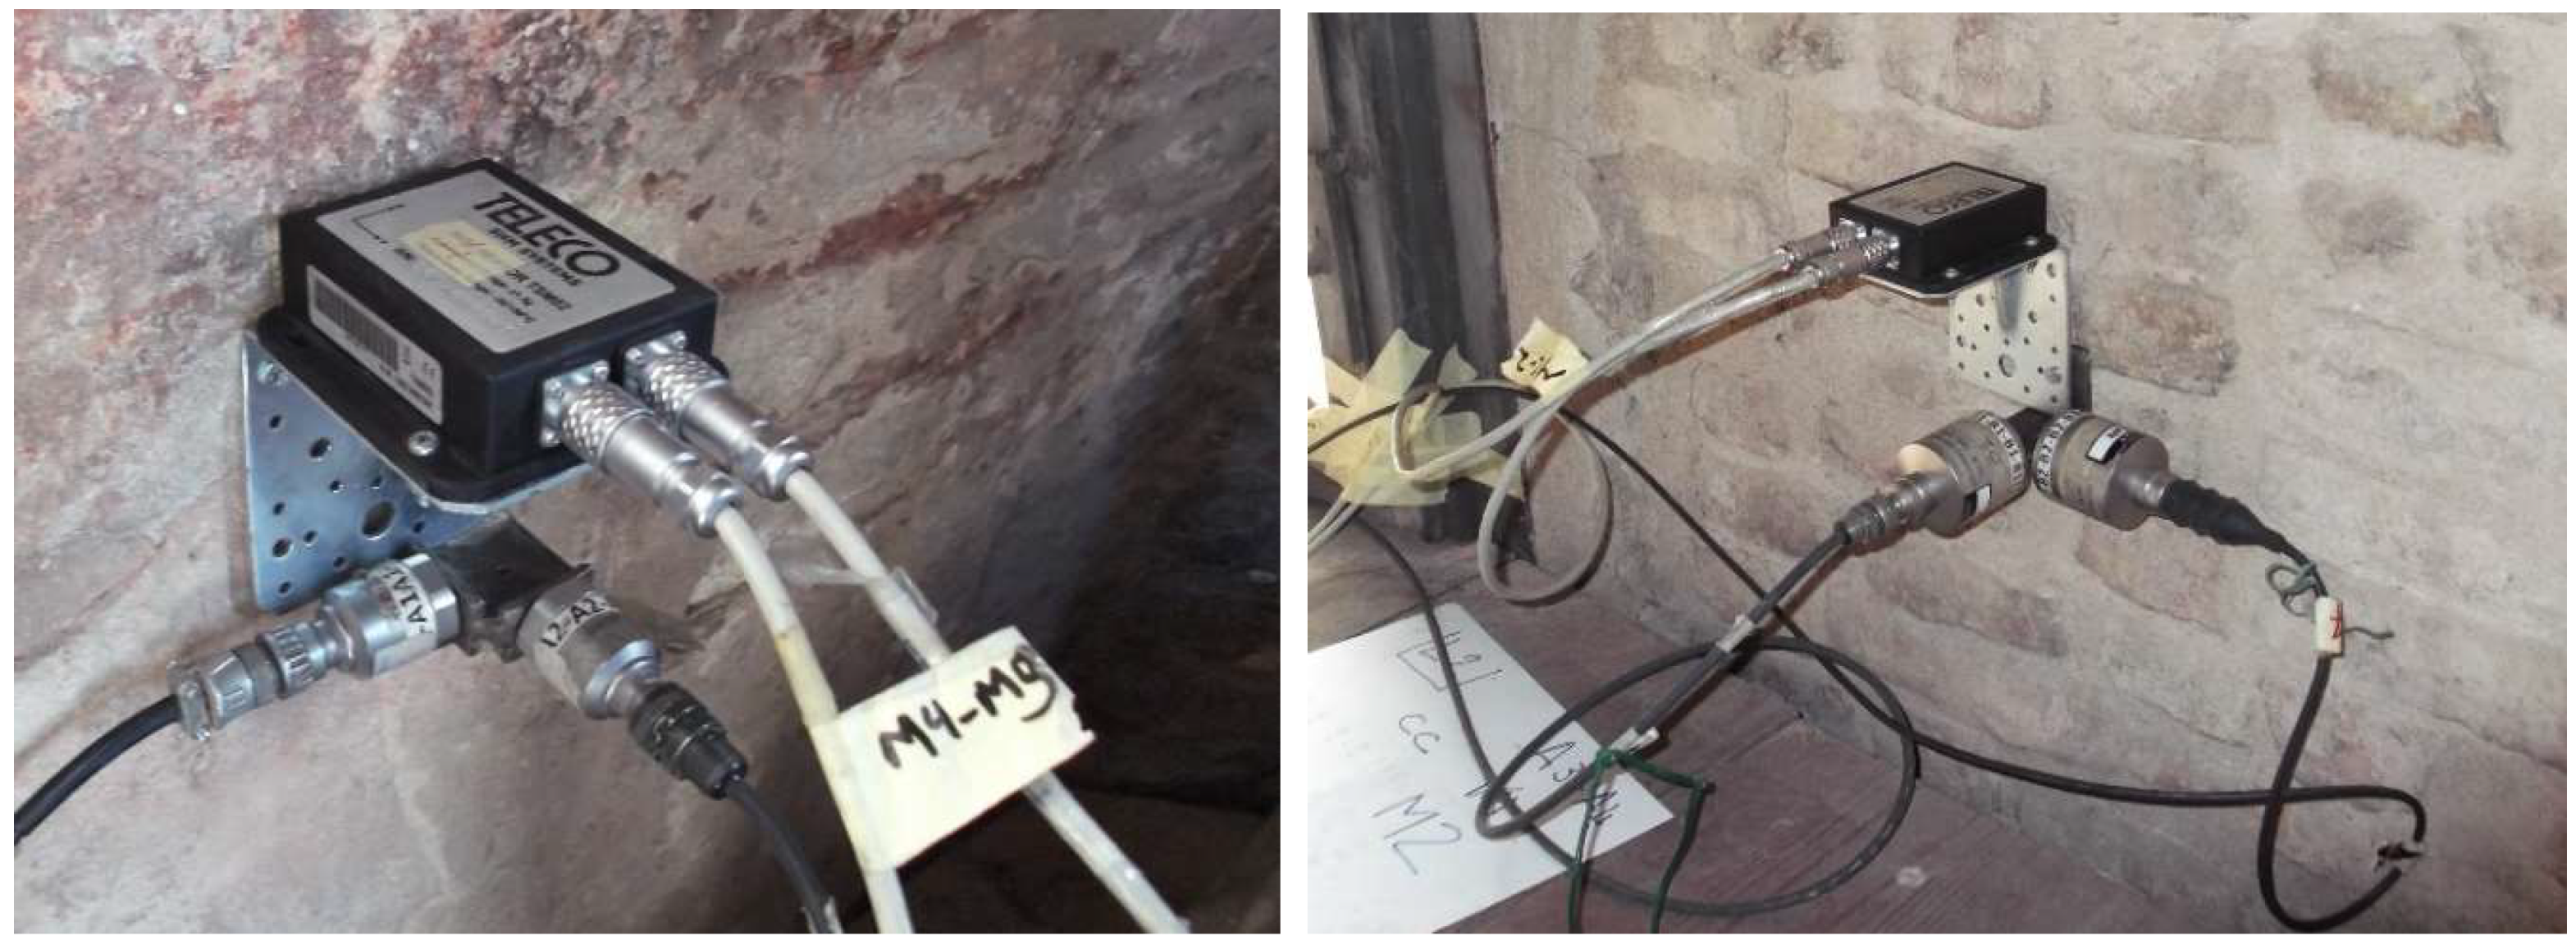
3.2. Accelerometers
4. Data Collection and Processing
4.1. Monitoring with TInRAR
4.2. Monitoring with Accelerometers
4.3. Modal Parameter Estimate
5. Results
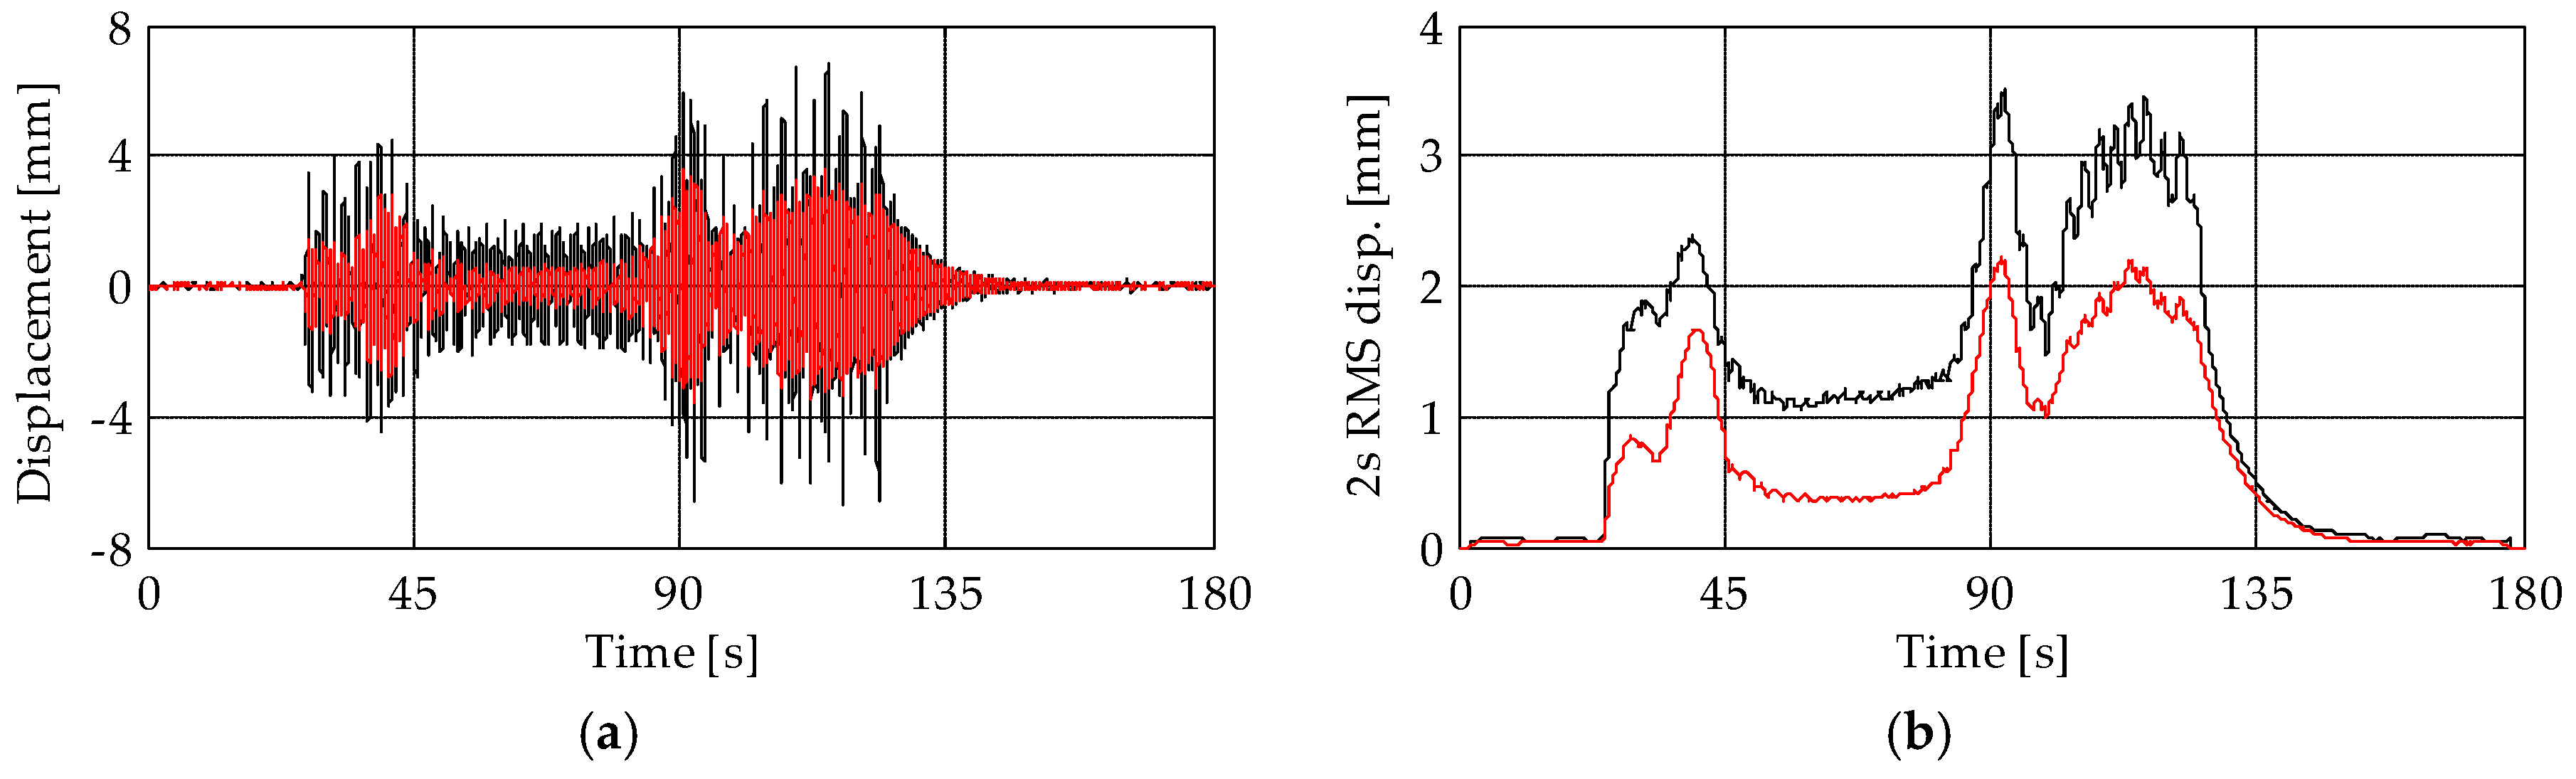
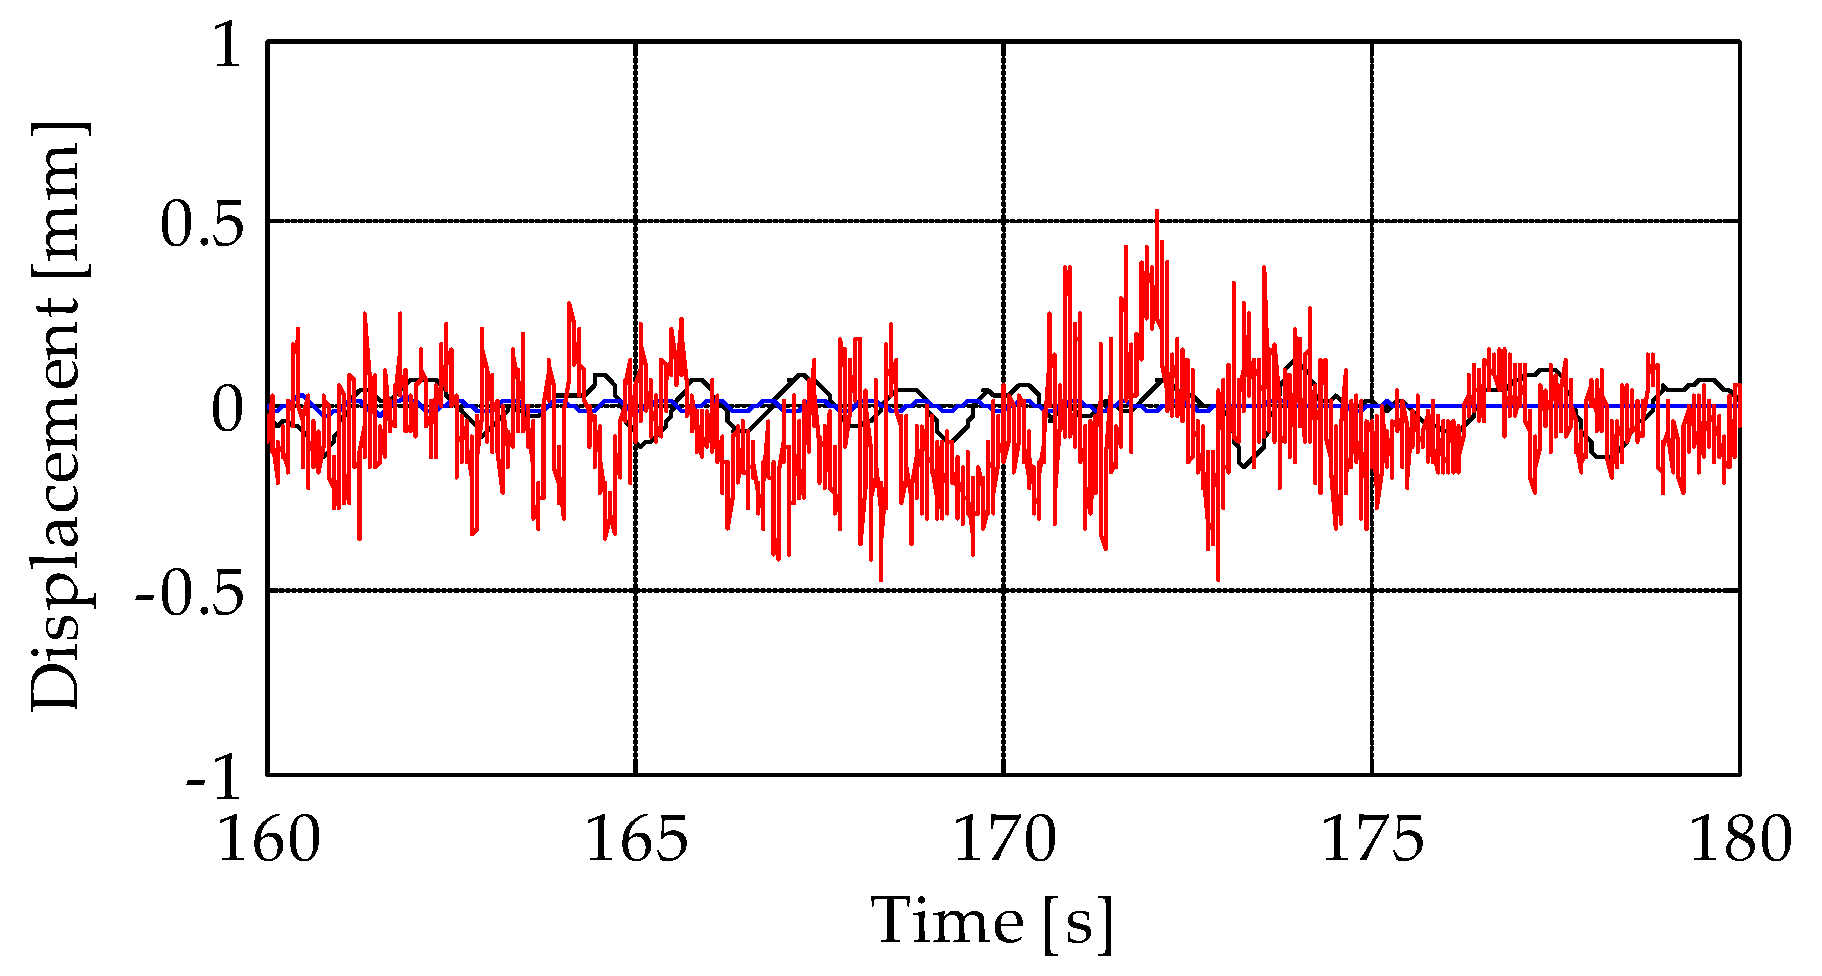
5.1. Comparison among Time-Series during the Bell Ring Forcing
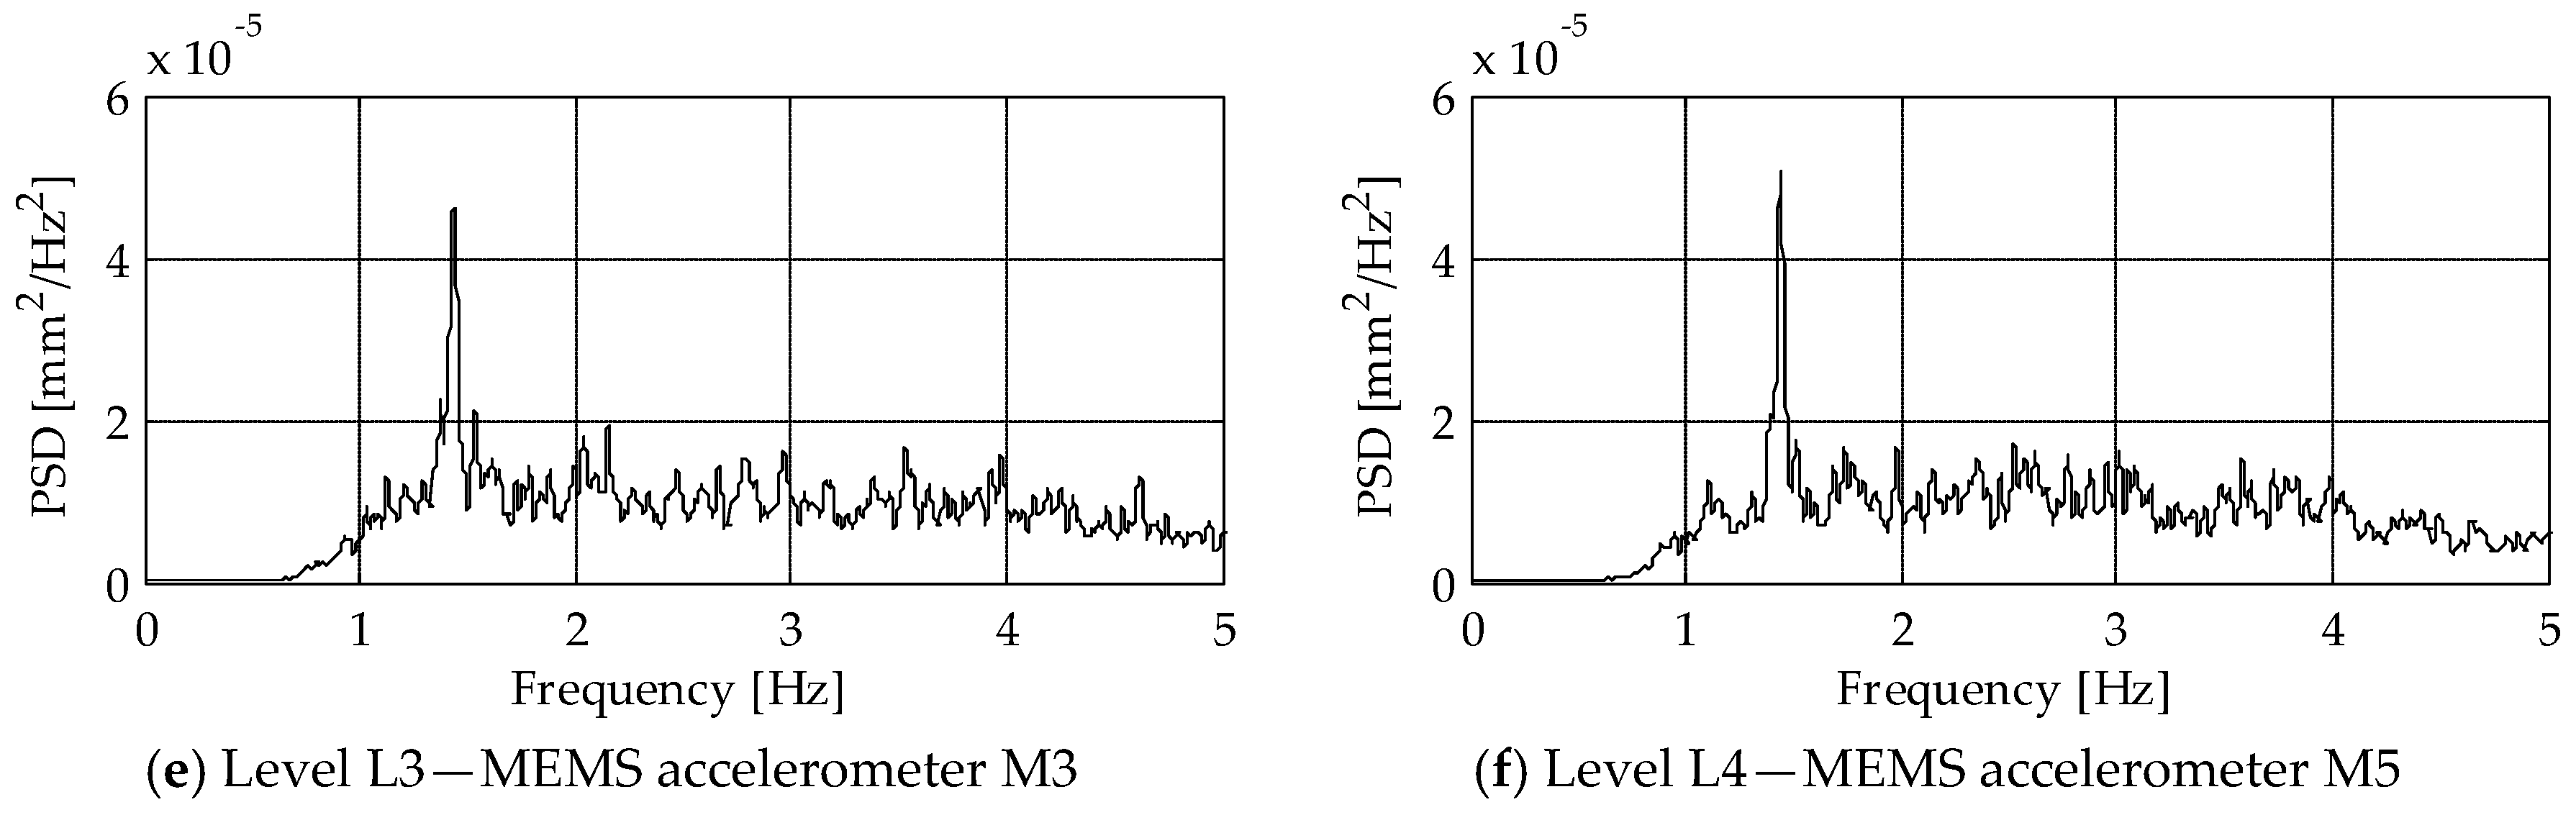
5.2. Comparison of the Frequency Content
6. Discussion
7. Conclusions
Author Contributions
Funding
Acknowledgments
Conflicts of Interest
References
- Atzeni, C.; Bicci, A.; Dei, D.; Fratini, M.; Pieraccini, M. Remote survey of the leaning tower of Pisa by interferometric sensing. IEEE Geosci. Remote Sens. Lett. 2010, 7, 185–189. [Google Scholar] [CrossRef]
- Gentile, C.; Saisi, A. Ambient vibration testing of historic masonry towers for structural identification and damage assessment. Constr. Build. Mater. 2007, 21, 1311–1321. [Google Scholar] [CrossRef]
- Bassoli, E.; Gambarelli, P.; Vincenzi, L. Human-induced vibrations of a curved cable-stayed footbridge. J. Constr. Steel Res. 2018, 146, 84–96. [Google Scholar] [CrossRef]
- Bassoli, E.; Vincenzi, L.; D’Altri, A.M.; De Miranda, S.; Forghieri, M.; Castellazzi, G. Ambient vibration-based finite element model updating of an earthquake-damaged masonry tower. Struct. Control Health Monit. 2018, 25, e2150. [Google Scholar] [CrossRef]
- Vincenzi, L.; Simonini, L. Influence of model errors in optimal sensor placement. J. Sound Vib. 2017, 389, 119–133. [Google Scholar] [CrossRef]
- Papadimitriou, C. Optimal sensor placement methodology for parametric identification of structural systems. J. Sound Vib. 2004, 278, 923–947. [Google Scholar] [CrossRef]
- Sony, S.; Laventure, S.; Sadhu, A. A literature review of next-generation smart sensing technology in structural health monitoring. Struct. Control Health Monit. 2019, 26, e2321. [Google Scholar] [CrossRef]
- Talich, M. Using Ground Radar Interferometry for Precise Determining of Deformation and Vertical Deflection of Structures. IOP Conf. Ser. Earth Environ. Sci. 2017, 95, 032021. [Google Scholar] [CrossRef]
- Strozzi, T.; Werner, C.; Wiesmann, A.; Wegmuller, U. Topography mapping with a portable real-aperture radar interferometer. IEEE Geosci. Remote Sens. Lett. 2012, 9, 277–281. [Google Scholar] [CrossRef]
- Kuras, P.; Ortyl, L. Selected Geometric Aspects of Planning and Analysis of Measurement Results of Tall Building Structures Using Interferometric Radar. Geomat. Environ. Eng. 2014, 8, 77–91. [Google Scholar] [CrossRef]
- Diaferio, M.; Fraddosio, A.; Piccioni, M.D.; Castellano, A.; Mangialardi, L.; Soria, L. Some issues in the Structural Health Monitoring of a railway viaduct by ground based radar interferometry. In Proceedings of the 2017 IEEE Workshop on Environmental, Energy, and Structural Monitoring Systems, Milan, Italy, 24–25 July 2017; pp. 1–6. [Google Scholar]
- Di Pasquale, A.; Nico, G.; Pitullo, A.; Prezioso, G. Monitoring Strategies of Earth Dams by Ground-Based Radar Interferometry: How to Extract Useful Information for Seismic Risk Assessment. Sensors 2018, 18, 244. [Google Scholar] [CrossRef]
- Beninati, L.; Brunetti, A.; Caruso, C.; Mazzanti, P. Structural Health Characterization of an Old Riveted Iron Bridge by Remote Sensing Techniques. In Proceedings of the 7th International Conference on Structural Health Monitoring of Intelligent Infrastructure, Torino, Italy, 1–3 July 2015. [Google Scholar]
- Sofi, M.; Lumantarna, E.; Mendis, P.A.; Duffield, C.; Rajabifard, A. Assessment of a pedestrian bridge dynamics using interferometric radar system IBIS-FS. Procedia Eng. 2017, 188, 33–40. [Google Scholar] [CrossRef]
- Stabile, T.A.; Perrone, A.; Gallipoli, M.R.; Ditommaso, R.; Ponzo, F.C. Dynamic survey of the Musmeci bridge by joint application of ground-based microwave radar interferometry and ambient noise standard spectral ratio techniques. IEEE Geosci. Remote Sens. Lett. 2013, 10, 870–874. [Google Scholar] [CrossRef]
- Neitzel, F.; Niemeier, W.; Weisbrich, S.; Lehmann, M. Investigation of low-cost accelerometer, terrestrial laser scanner and ground-based radar interferometer for vibration monitoring of bridges. In Proceedings of the 6th European Workshop on Structural Health Monitoring, Dresden, Germany, 3–6 July 2012; pp. 542–551. [Google Scholar]
- Gentile, C.; Bernardini, G. Output-only modal identification of a reinforced concrete bridge from radar-based measurements. NDT E Int. 2008, 41, 544–553. [Google Scholar] [CrossRef]
- Pieraccini, M.; Fratini, M.; Dei, D.; Atzeni, C. Structural testing of historical heritage site towers by microwave remote sensing. J. Cult. Herit. 2009, 10, 174–182. [Google Scholar] [CrossRef]
- Pieraccini, M.; Dei, D.; Betti, M.; Bartoli, G.; Tucci, G.; Guardini, N. Dynamic identification of historic masonry towers through an expeditious and no-contact approach: Application to the “Torre del Mangia” in Siena (Italy). J. Cult. Herit. 2014, 15, 275–282. [Google Scholar] [CrossRef]
- Luzi, G.; Crosetto, M.; Cuevas-González, M. A radar-based monitoring of the Collserola tower (Barcelona). Mech. Syst. Signal Process. 2014, 49, 234–248. [Google Scholar] [CrossRef]
- Saisi, A.; Gentile, C.; Ruccolo, A. Pre-diagnostic prompt investigation and static monitoring of a historic bell-tower. Constr. Build. Mater. 2016, 122, 833–844. [Google Scholar] [CrossRef]
- Alvandi, A.; Cremona, C. Assessment of vibration-based damage identification techniques. J. Sound Vib. 2006, 292, 179–202. [Google Scholar] [CrossRef]
- Bennati, S.; Nardini, L.; Salvatore, W. Dynamic behavior of a medieval masonry bell tower. Part I: Experimental measurements and modeling of bell’s dynamic actions. J. Struct. Eng. 2005, 131, 1647–1655. [Google Scholar] [CrossRef]
- Ditommaso, R.; Mucciarelli, M.; Parolai, S.; Picozzi, M. Monitoring the structural dynamic response of a masonry tower: Comparing classical and time-frequency analyses. Bull. Earthq. Eng. 2012, 10, 1221–1235. [Google Scholar] [CrossRef]
- Nobili, U.; Codazzi, G.M.; Squarza, N. Nel Cuore Della Città: Momenti di Storia Dell’arte a Reggio Emilia tra Umanesimo e Manierismo; Musei Civici Reggio Emilia Collana Fotografia: Reggio Emilia, Italy, 1997; p. 120. (In Italian) [Google Scholar]
- Monducci, E. San Prospero la Torre di Giulio Romano a Reggio Emilia; Motta Editore: Milano, Italy, 2006; pp. 13–75. (In Italian) [Google Scholar]
- Pieraccini, M. Monitoring of civil infrastructures by interferometric radar: A review. Sci. World J. 2013. [Google Scholar] [CrossRef]
- IDS GeoRadar Srl. IBIS-FS Datasheet. Available online: https://idsgeoradar.com/products/interferometric-radar/ibis-fs (accessed on 20 January 2019).
- Gocal, J.; Ortyl, L.; Owerko, T.; Kuras, P.; Kocierz, R.; Cwiąkala, P.; Puniach, E.; Sukta, O.; Balut, A. Determination of Displacement and Vibrations of Engineering Structures Using Ground-Based Radar Interferometry; AGH University of Science and Technology Press: Krakow, Poland, 2013; pp. 78–115. ISBN 978-83-7464-645-1. [Google Scholar]
- Guidorzi, R.; Diversi, R.; Vincenzi, L.; Mazzotti, C.; Simioli, V. Structural monitoring of a tower by means of MEMS-based sensing and enhanced autoregressive models. Eur. J. Control 2014, 20, 4–13. [Google Scholar] [CrossRef]
- Bassoli, E.; Vincenzi, L.; Bovo, M.; Mazzotti, C. Dynamic identification of an ancient masonry bell tower using a MEMS-based acquisition system. In Proceedings of the IEEE Workshop on Environmental, Energy, and Structural Monitoring Systems, Trento, Italy, 9–10 July 2015; pp. 226–231. [Google Scholar] [CrossRef]
- Smyth, A.; Wu, M. Multi-rate Kalman filtering for the data fusion of displacement and acceleration response measurements in dynamic system monitoring. Mech. Syst. Signal Process. 2006, 21, 706–723. [Google Scholar] [CrossRef]
- Huang, N.E.; Shen, Z.; Long, S.R.; Wu, M.L.; Shih, H.H.; Zengh, Q.; Yen, N.C.; Tung, C.C.; Liu, H.H. The empirical mode decomposition and Hilbert spectrum for nonlinear and non-stationary time series analysis. Proc. R. Soc. Lond. A 1998, 454, 903–995. [Google Scholar] [CrossRef]
- Mukhopadhyay, S.; Betti, R.; Galli, E.; Savoia, M.; Vincenzi, L. A new denoising procedure based on empirical mode decomposition for SHM purpose Safety, Reliability, Risk and Life-Cycle Performance of Structures and Infrastructures. In Proceedings of the 11th International Conference on Structural Safety and Reliability, New York, NY, USA, 16–20 June 2013; pp. 4547–4554. [Google Scholar]
- Peng, Z.K.; Chu, F.L. Application of the wavelet transform in machine condition monitoring and fault diagnostics: A review with bibliography. Mech. Syst. Signal Process. 2004, 18, 199–221. [Google Scholar] [CrossRef]
- Brincker, R.; Zhang, L.; Andersen, P. Modal identification of output-only systems using frequency domain decomposition. Smart Mater. Struct. 2001, 10, 441–445. [Google Scholar]
- Brincker, R.; Ventura, C.; Andersen, P. Damping estimation by frequency domain decomposition. In Proceedings of the 19th International Modal Analysis Conference, Orlando, FL, USA, 5–8 February 2001; pp. 698–703. [Google Scholar]


| Parameter | Technical Specifications |
|---|---|
| Displacement accuracy | 0.01 mm/0.1 mm (depending on range) |
| Operating range | Up to 1000 m |
| Range resolution * | 0.5 m |
| Acquisition frequency | Up to 200 Hz |
| Power supply | 110/220 Vac or 12 Vdc (Battery) |
| Battery autonomy | 4 h |
| Weight | 32 kg (full configuration with tripod) |
| Operating temperature | −20 °C to +55 °C |
© 2019 by the authors. Licensee MDPI, Basel, Switzerland. This article is an open access article distributed under the terms and conditions of the Creative Commons Attribution (CC BY) license (http://creativecommons.org/licenses/by/4.0/).
Share and Cite
Castagnetti, C.; Bassoli, E.; Vincenzi, L.; Mancini, F. Dynamic Assessment of Masonry Towers Based on Terrestrial Radar Interferometer and Accelerometers. Sensors 2019, 19, 1319. https://doi.org/10.3390/s19061319
Castagnetti C, Bassoli E, Vincenzi L, Mancini F. Dynamic Assessment of Masonry Towers Based on Terrestrial Radar Interferometer and Accelerometers. Sensors. 2019; 19(6):1319. https://doi.org/10.3390/s19061319
Chicago/Turabian StyleCastagnetti, Cristina, Elisa Bassoli, Loris Vincenzi, and Francesco Mancini. 2019. "Dynamic Assessment of Masonry Towers Based on Terrestrial Radar Interferometer and Accelerometers" Sensors 19, no. 6: 1319. https://doi.org/10.3390/s19061319
APA StyleCastagnetti, C., Bassoli, E., Vincenzi, L., & Mancini, F. (2019). Dynamic Assessment of Masonry Towers Based on Terrestrial Radar Interferometer and Accelerometers. Sensors, 19(6), 1319. https://doi.org/10.3390/s19061319