Article

Machine Learning Classification for Assessing the Degree of Stenosis and Blood Flow Volume at Arteriovenous Fistulas of Hemodialysis Patients Using a New Photoplethysmography Sensor Device

1
Institute of Electrical Control Engineering, National Chiao Tung University, Hsinchu 300, Taiwan
2
Department of Electrical Engineering, National Chiao Tung University, Hsinchu 300, Taiwan
3
Division of Nephrology in Taipei Veterans General Hospital, Taipei 11217, Taiwan
*
Author to whom correspondence should be addressed.
Sensors 2019, 19(15), 3422; https://doi.org/10.3390/s19153422
Submission received: 31 May 2019 / Revised: 27 July 2019 / Accepted: 2 August 2019 / Published: 4 August 2019
(This article belongs to the Special Issue Non-Invasive Biomedical Sensors)

Abstract

:
The classifier of support vector machine (SVM) learning for assessing the quality of arteriovenous fistulae (AVFs) in hemodialysis (HD) patients using a new photoplethysmography (PPG) sensor device is presented in this work. In clinical practice, there are two important indices for assessing the quality of AVF: the blood flow volume (BFV) and the degree of stenosis (DOS). In hospitals, the BFV and DOS of AVFs are nowadays assessed using an ultrasound Doppler machine, which is bulky, expensive, hard to use, and time consuming. In this study, a newly-developed PPG sensor device was utilized to provide patients and doctors with an inexpensive and small-sized solution for ubiquitous AVF assessment. The readout in this sensor was custom-designed to increase the signal-to-noise ratio (SNR) and reduce the environment interference via maximizing successfully the full dynamic range of measured PPG entering an analog–digital converter (ADC) and effective filtering techniques. With quality PPG measurements obtained, machine learning classifiers including SVM were adopted to assess AVF quality, where the input features are determined based on optical Beer–Lambert’s law and hemodynamic model, to ensure all the necessary features are considered. Finally, the clinical experiment results showed that the proposed PPG sensor device successfully achieved an accuracy of 87.84% based on SVM analysis in assessing DOS at AVF, while an accuracy of 88.61% was achieved for assessing BFV at AVF.

1. Introduction

The arteriovenous fistula (AVF), which refers to the surgical connection between an artery and a vein at the forearm, is the lifeline of chronic kidney disease (CKD) patients for performing hemodialysis (HD) treatment. It is well known that after long-term HD treatments, the endothelia cell at the AVF may suffer from various lesions, such as thrombosis, inflammation, hyperplasia or calcification, etc., which may lead to failures of H.
D treatment [1]. According to the National Kidney Foundation [1], AVF can be assessed by evaluating the degree of stenosis (DOS) and blood flow volume (BFV) flowing inside. In hospitals, the DOS at AVF is assessed by a non-invasive Doppler machine or invasive angiography. On the other hand, BFV at AVF is measured also by a non-invasive Doppler machine or invasive concentration dilution methods. However, all conventional methods need well-trained operators as well as expensive and bulky instruments. Therefore, neither of them are possible of becoming popular in the home-care market as small-sized sensors. Toward inexpensive, convenient measurements, there were some published works devoted to developing small-sized sensors for evaluating DOS and/or BVF non-invasively.
As for measuring DOS, different researchers have dedicated efforts to smaller-sized sensors based on acoustic phonocardiograms (PCGs), optical photoplethysmography (PPG), and ultra-sound Doppler. Wang et al. [2] presented a small-sized stethoscope auscultation sensor with a radial basis neural network, which shows an accuracy of 87.84% in detecting the DOS of AVF. Chen et al. [3] published a PCG sensor system for evaluating DOS at AVF using a fuzzy Petri net, which reached a 95% accuracy. Yieh et al. [4] proposed an SVM algorithm using a conventional stethoscope auscultation to assess DOS. Although the acoustic sensors show promising results, the high-sensitivity acoustic sensors used for stethoscope auscultation may easily be influenced by unavoidable environmental sound noise, especially in public spaces such as hospitals [5], significantly limiting usability. On the other hand, Wu et al. [6] presented a bilateral PPG sensor system to evaluate DOS at AVF by a cooperative game algorithm, which results in a correlation greater than 0.9. Du and Stephanus [7,8] published works assessing DOS at AVF using bilateral PPG sensors and achieved 94.82% in accuracy. However, the size of the bilateral PPG sensor was too large to transform into a portable or wearable device for homecare, not to mention only 11 subjects were tested [8]. Wu et al. [9] developed a small-sized ultra-sound Doppler module to assess DOS, which suffers, as opposed to the bulky ultra-sound Doppler machine, from the variations induced by environmental interference, different operators, and techniques of digital post-signal processing. In this work, a single, small-sized, hand-held PPG sensor [10] was utilized for assessing DOS at AVF based on measured PPG waveforms. The sensor system was successfully designed to minimize the environmental lighting interference for high accuracy.
As for measuring BFV non-invasively using small-sized and inexpensive sensors, recently, Webb et al. [11] proposed a patch-type thermal sensor for measuring BFV by sensing the heat transportation of microcirculation. The results showed a correlation of 0.75. Lee et al. [12] published a magneto-plethysmographic sensor for measuring blood flow, resulting in a correlation of 0.9355. However, thermal sensors and magnetic sensors radiate heat and an electromagnetic field to patients, which may lead to high-power consumption and, thus, they are not suitable for development as portable devices for long-term monitoring. Zhu et al. [13] used a digital camera and accompanying digital image processing techniques to extract visual pulsation at a patient’s wrist to assess BFV. The resulting accuracy was only 71%, possibly due to the complexity involved in the digital image processing. Chiang et al. [10] presented a single, newly-developed PPG sensor system to monitor and quantify the BFV in AVF with a resulting correlation of 71.76%. The experimental result showed that overestimations occurred for insufficient BFV, which may result in a very high (>50%) type II error (false-negative rate).
Based on the current medical standards of the National Kidney Foundation (NKF) [1], both DOS and BFV are critical in assessing the functionality of AVF. Thus, this study was devoted to developing new algorithms of machine learning classifiers to successfully determine if both DOS and BFV satisfy the NKF’s standards, after which subsequent medical treatments can be undertaken. In terms of accuracy and ubiquitous usage of the new hand-held PPG module developed, the work presented herein well demonstrates favorable performance as opposed to all the aforementioned prior studies. This work is organized as follow: In Section 2, the theories and principles of the PPG sensor and hemodynamics are proposed. Section 3 describes the PPG sensor system and the assessing algorithms. In Section 4, the clinical experiments and the results are presented. Section 5 concludes the work with a discussion.

2. Theories and Principles

Theories and principles assessing DOS and BFV at AVF are reviewed in this section to determine the input features for classifier algorithms to later develop.

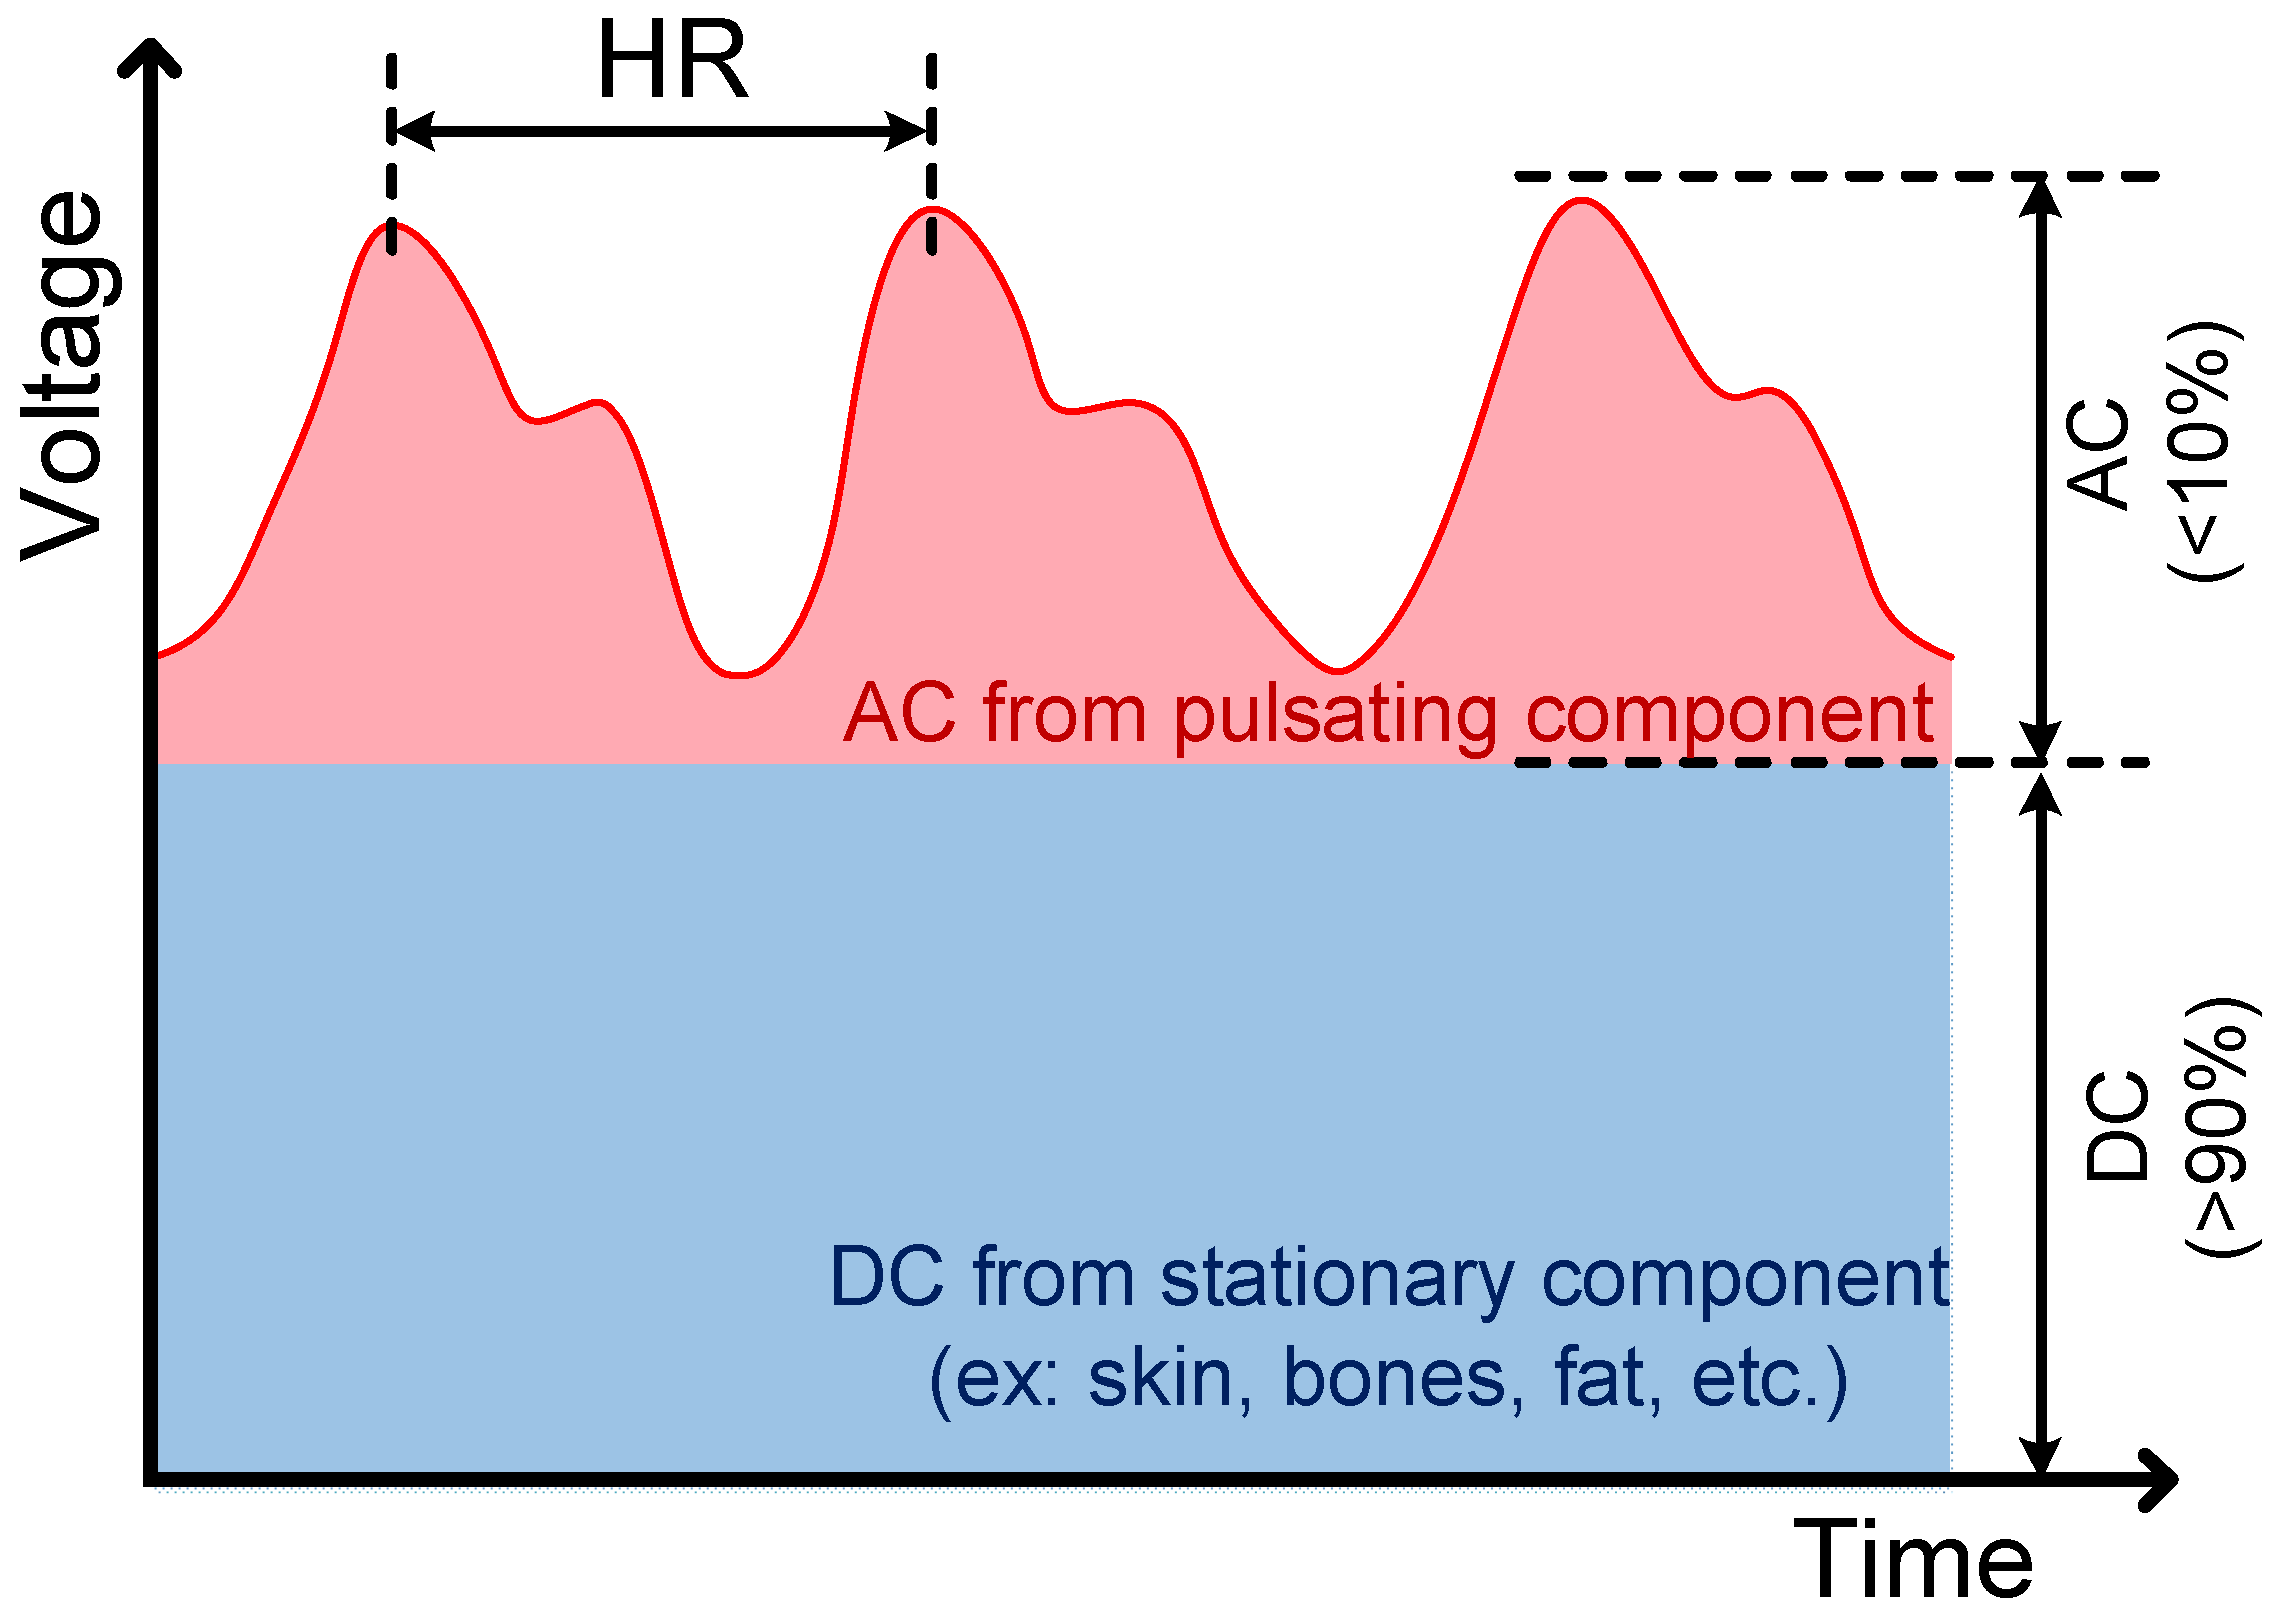
2.1. Beer–Lambert’s Law

Photoplethysmography (PPG) is a non-invasive measuring method aimed at sensing the pulsation of the blood vessel by acquiring the reflective lights from a light-emitted diode (LED) toward a photodiode (PD). Photoplethysmography sensors are known for their non-invasive, small-sized, inexpensive, easy-to-use measurements, and it is widely used in hospitals for monitoring heart rate [14], heart rate variability [15], blood pressure [16], blood oxygen level [17], etc. A typical PPG signal is shown in Figure 1, where the PPG signal is composed of a very large direct component (DC) and a very small alternating component (AC). The DC results from stationary tissues, such as veins, skins, and bones, etc., while the AC from the pulsation of the measured vessel. The mathematical equation of a PPG signal can be described using the known physical theory, Beer–Lambert’s law, as:
I r = I 0 · e x p ( ε t C t S t ) · e x p ( ε b C b S b ) ,
where Ir denotes the received light intensity from the PD; I0 denotes the intensity of the incident light; εb and εt denote the light absorption coefficients of blood and tissues, respectively; cb and ct denote the Mohr concentrations of blood and tissues, respectively; sb and st denote the transmission paths of light of blood and tissues, respectively. Note that sb is time-varying due to the diameter changes of the measured blood vessel. Moreover, by applying the Taylor approximation to the exponential function in Equation (1), one can obtain:
I r = I 0 · e x p ( ε t c t s t ) · ( 1 + ε b c b s b ) , = I 0 · e x p ( ε t c t s t ) + I 0 · e x p ( ε t c t s t ) ε b c b s b , = D C + A C .
To derive the length of the light transmission path with the aim to reduce the interference from other tissue, the 2nd term in Equation (2), AC, is normalized by DC, yielding:
s b = 1 ε b c b A C D C ,
where the effects of other tissue (εt, ct, and st) are normalized. Note that the AC/DC is generally defined as perfusion index (PI) [18,19]. Moreover, considering the blood oxygen level, the term εbcb in Equation (3) can be expanded to [20]:
ε b c b = S p O 2 · ε H b O + ( 1 S p O 2 ) ε H b ,
where SpO2 denotes the blood oxygen saturation level; εHbO and εHb denote the light absorption coefficients of oxy-hemoglobin and hemoglobin, respectively. Combining Equations (3) and (4) yields:
P I A C D C = s b [ S p O 2 · ε H b O + ( 1 S p O 2 ) ε H b ] ,
where PI denotes the perfusion index. In Equation (5), the light transmission path sb is, in fact, proportional to the time-varying diameter of the measured blood vessel in pulsation. This equation is important for deriving BFV and DOS in the following sections.

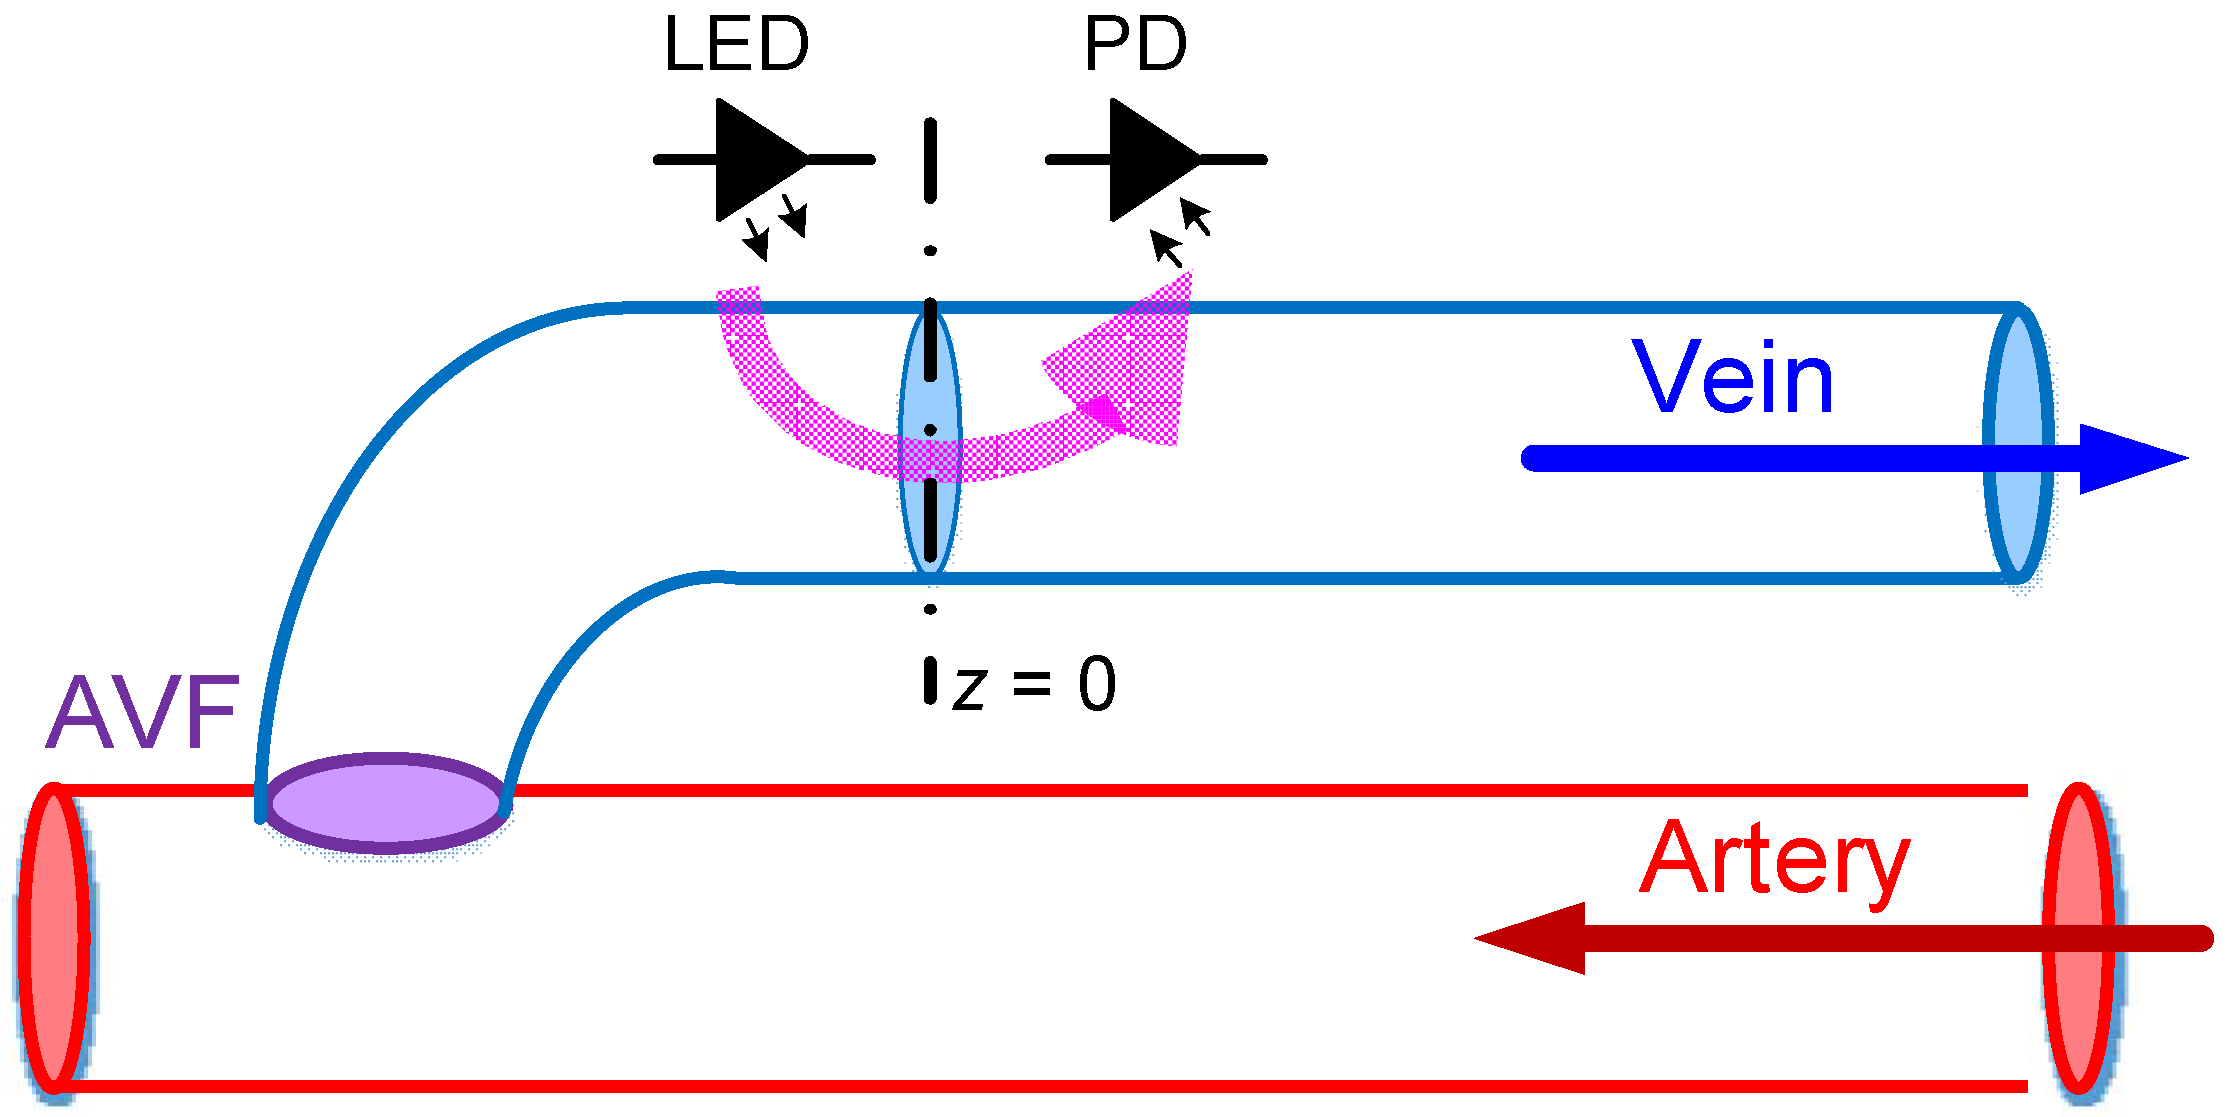
2.2. Hemodynamic Models

To derive the input features for assessing BFV, the hemodynamic model of AVF is derived herein. In this work, the telegrapher equations were introduced to solve the hemodynamic model of AVF. At first, the momentum and mass conservation equations of AVF can be prescribed by [21]:
p ( z ,   t ) z = R q ( z , t ) + L q ( z ,   t ) t ,
q ( z ,   t ) z = G p ( z , t ) + C p ( z ,   t ) t ,
where q(z,t) and p(z,t) denote the instantaneous BFV and blood pressure (BP) at location z and at time t, respectively; z denotes the axis along the AVF, as shown in Figure 2. Also, in Equations (6) and (7),
R = c 1 128 η d 0 4 ;   L = c 2 4 ρ π d 0 2 ;   G = 0 ;   C = ( 1 σ 2 ) π d 0 3 4 h E ,
R denotes the blood vessel resistance; L denotes the blood vessel inertance; G denotes the influence of vascular branch, which is assumed to be zero; C denotes the blood vessel compliance; η denotes the dynamic viscosity of blood (about 0.035 g/cm∙s); ρ denotes the blood density (about 1.056 g/cm3); σ denotes the Poisson’s ratio of blood vessel; d0 denotes the blood vessel diameter at the measuring spot; h denotes the thickness of the vessel wall; E denotes the Young’s elastic modulus of blood vessel; and c1 and c2 are the parameters describing the influence from pulsation of heart rate, which can be approximated by [22]:
c 1 = 0.18 W + 0.45 ,   c 2 = 0.018 W + 1.39 ,
where W denotes the Womersley number. This number is defined as [23]:
W = d 0 ω ρ 4 η ,
where ω denotes the heart rate frequency. It is assumed that R, L, and C are independent from t and z. Also, it is assumed that blood vessels are in finite lengths. Therefore, Equations (6) and (7) can be solved with solutions analogized to the well-known telegrapher equation (see Appendix A for details), yielding:
p ( z , t ) = P 0 + e α z cos ( β z + ω t ) ,
q ( z , t ) = Q 0 + e α z cos ( β z + ω t ) ,
where P0+ denotes the BP wave along the positive direction, while Q0+ denotes the BFV along the positive direction. Check Appendix A for the definitions of other parameters in Equations (11) and (12). In fact, Equations (11) and (12) are the solutions of the hemodynamic model’s analogy to the telegrapher equation, and they serve well as the essential equations to decide the input features for assessing DOS and BFV at AVF Section 2.3 and Section 2.4

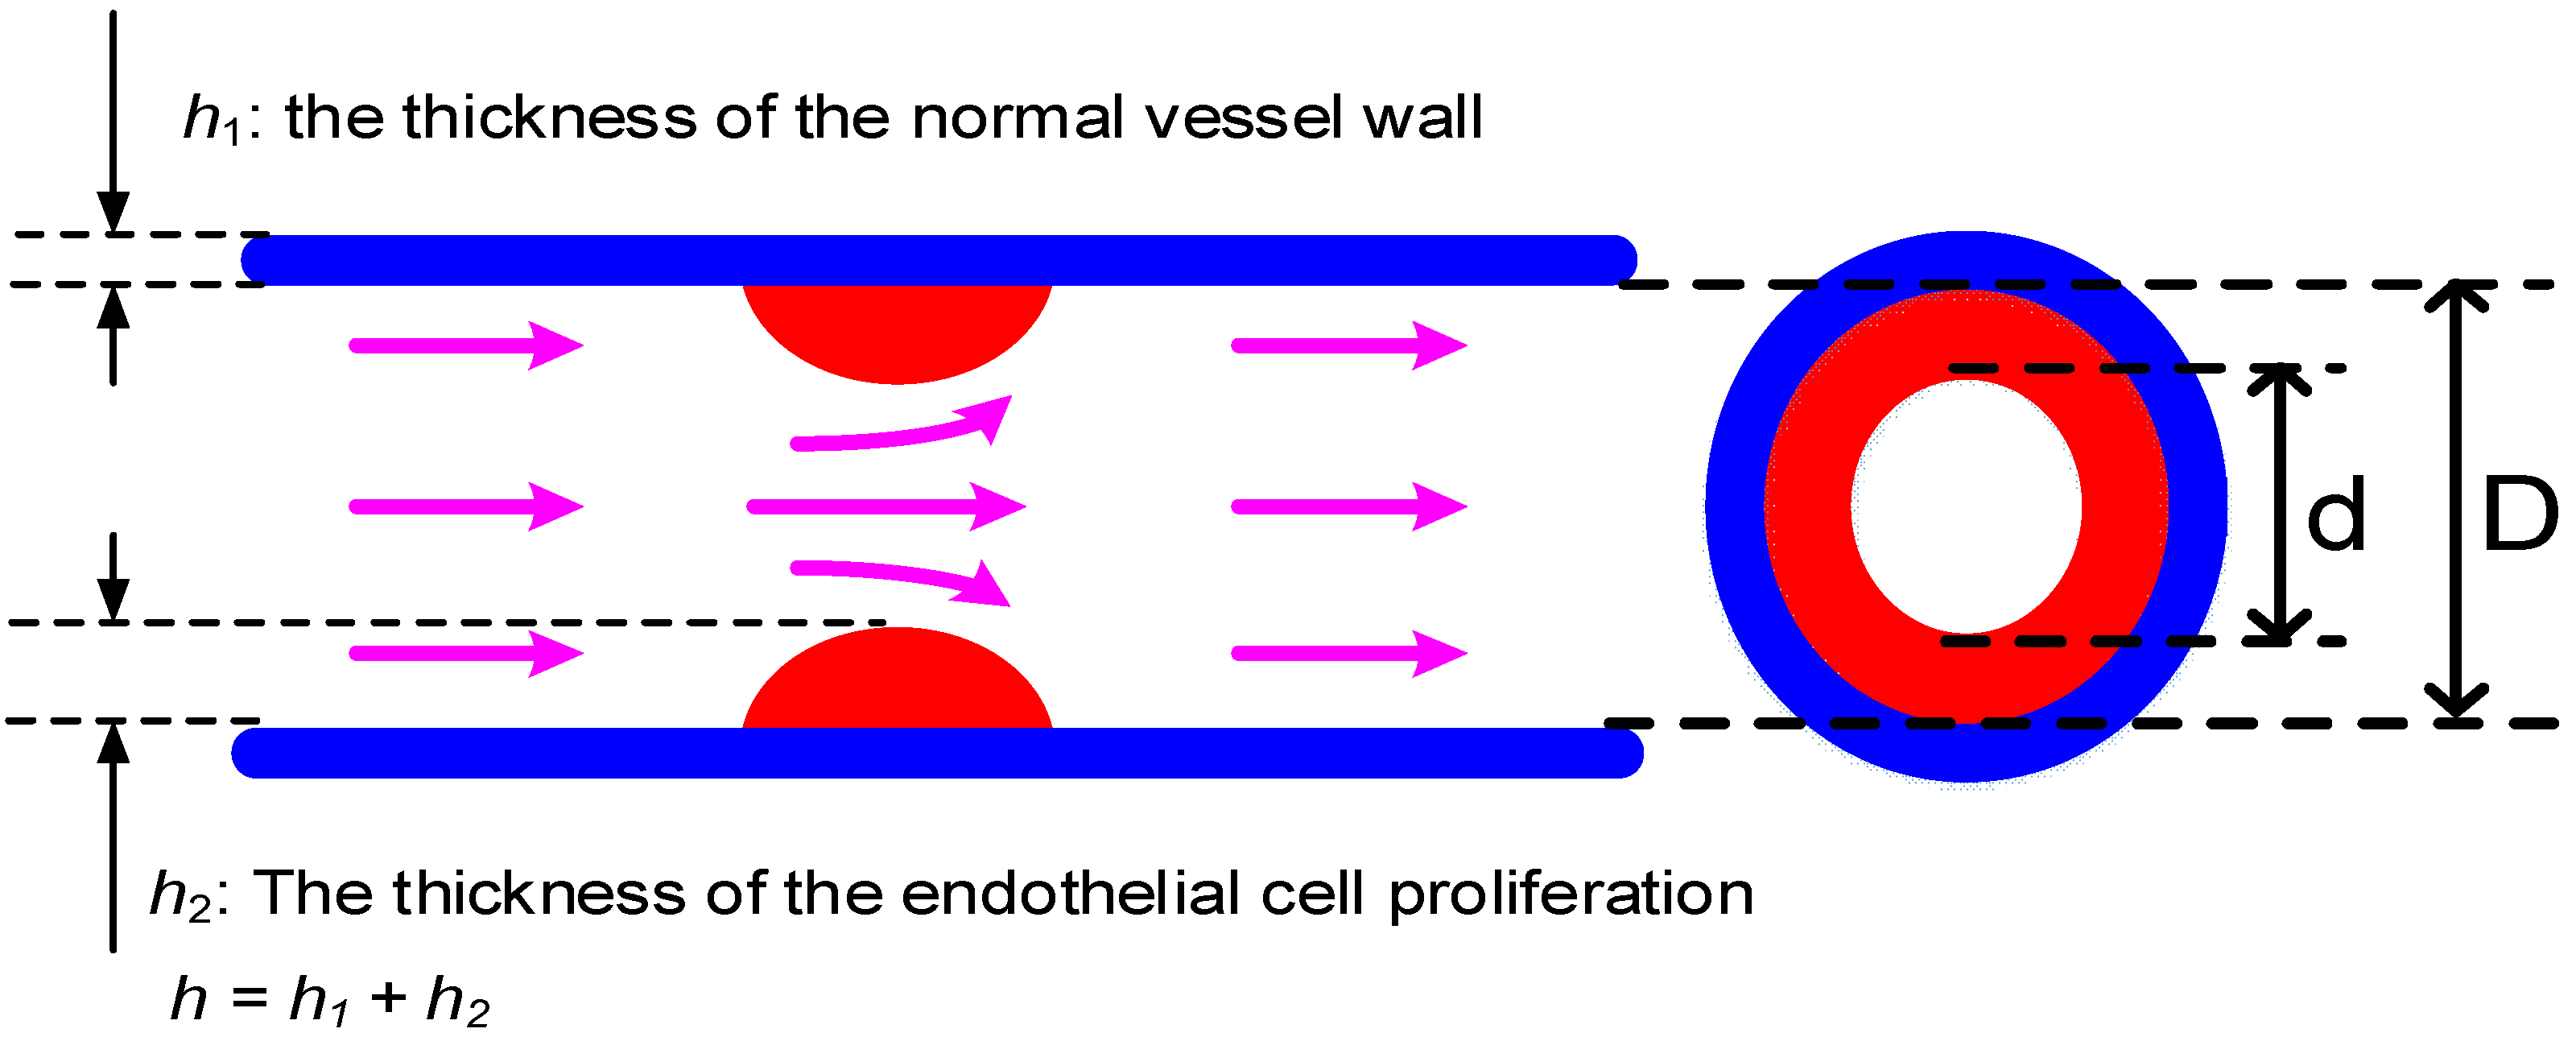
2.3. Degree of Stenosis (DOS)

According to the National Kidney Foundation [1], DOS is defined as the ratio of the cross-sectional area between normal AVF and stenosis AVF, which can be expressed as:
D O S = 1 d 2 D 2 × 100 % ,
where d and D denote the diameters of the stenosis blood vessel and the normal vessel, respectively, as show in Figure 3. From Figure 3, Equation (13) can be also re-expressed as:
D O S = 1 d 2 ( d + 2 h 2 ) 2 × 100 % = 1 d 2 ( d + 2 h 2 h 1 ) 2 × 100 % ,
where h1 denotes the basic thickness of the blood vessel, which is typically assumed to be a constant; h2 denotes the thickness of the endothelial hyperplasia. To obtain the vessel thickness h, the average blood vessel compliance is introduced [22], which is:
C A m a x A m i n S B P D B P ,
where Amax and Amin denote the maximum and minimum cross-sectional areas of the blood vessel; and SBP and DBP denote the systolic blood pressure (SBP) and diastolic blood pressure (DBP), respectively. Combining Equation (15) and the definition of C in Equation (8) leads to a blood-vessel thickness as:
h = ( 1 σ 2 ) π d 0 3 E S B P D B P d m a x 2 d m i n 2 ,
where dmax and dmin denote the maximum and minimum diameters of the blood vessel, respectively. Actually, in Equation (16), dmax and dmin can be expressed in terms of the length of the light transmission path sb as seen in Equations (3) and (5), and then substituting Equation (16) into Equation (14) yields:
D O S = f 1 ( P I m a x ,   P I m i n ,   S p O 2 ,   S B P , D B P ) ,
where PImax and PImin denote the maximum and minimum perfusion indices corresponding to sb,max and sb,min, respectively, based on Equation (5). Note further that, based on Equation (5) where AC and DC can be measured by the PPG sensor, PImax and PImin in Equation (17) can be obtained. Also, based on the analysis presented in this section, sb,max, sb,min, and SpO2 are all important factors to DOS, and furthermore, they are independent of each other, not only in the mathematical sense, but also physiologically. In short, five independent input features affecting DOS are derived, as shown in Equation (17), to assess DOS at AVF by the classifier algorithms to develop in Section 3.2.

2.4. Blood Flow Volume (BFV)

To derive the BFV at AVF, the characteristic impedances of AVF is introduced herein as:
Z 0 P ( z ) Q ( z ) = P 0 + Q 0 + = R + j ω L G + j ω C ,
where Z0 denotes the characteristic impedances of AVF. Therefore, Equation (12) can be rearranged as:
q ( z , t ) = P 0 + Z 0 e α z cos ( β z + ω t ) .
Furthermore, it is assumed that the measuring spot of the PPG sensor is placed at z = 0, as shown in Figure 2. Hence, Equation (19) becomes:
q ( 0 , t ) = P 0 + cos ( ω t ) G + j ω C R + j ω L .
To obtain the average BFV, P0+ can be approximated using average mean blood pressure (MBP) as:
P 0 + M B P = 1 3 S B P + 2 3 D B P .
The average BFV at AVF can then be obtained by combining Equations (20) and (21), that is:
q a v g = | M B P G + j ω C R + j ω L | ,
where qavg denotes the average BFV at AVF, and the absolute symbol is added to obtain the magnitude of complex signals. Combining Equations (8), (15), and (22), all the dependence of the average BFV can be prescribed by:
q a v g = f 2 ( P I m a x ,   P I m i n ,   S p O 2 ,   S B P , D B P ,   ω ) .
As seen in Equation (23), six input features were successfully derived for assessing BFV at AVF via algorithms to develop in Section 3.2.

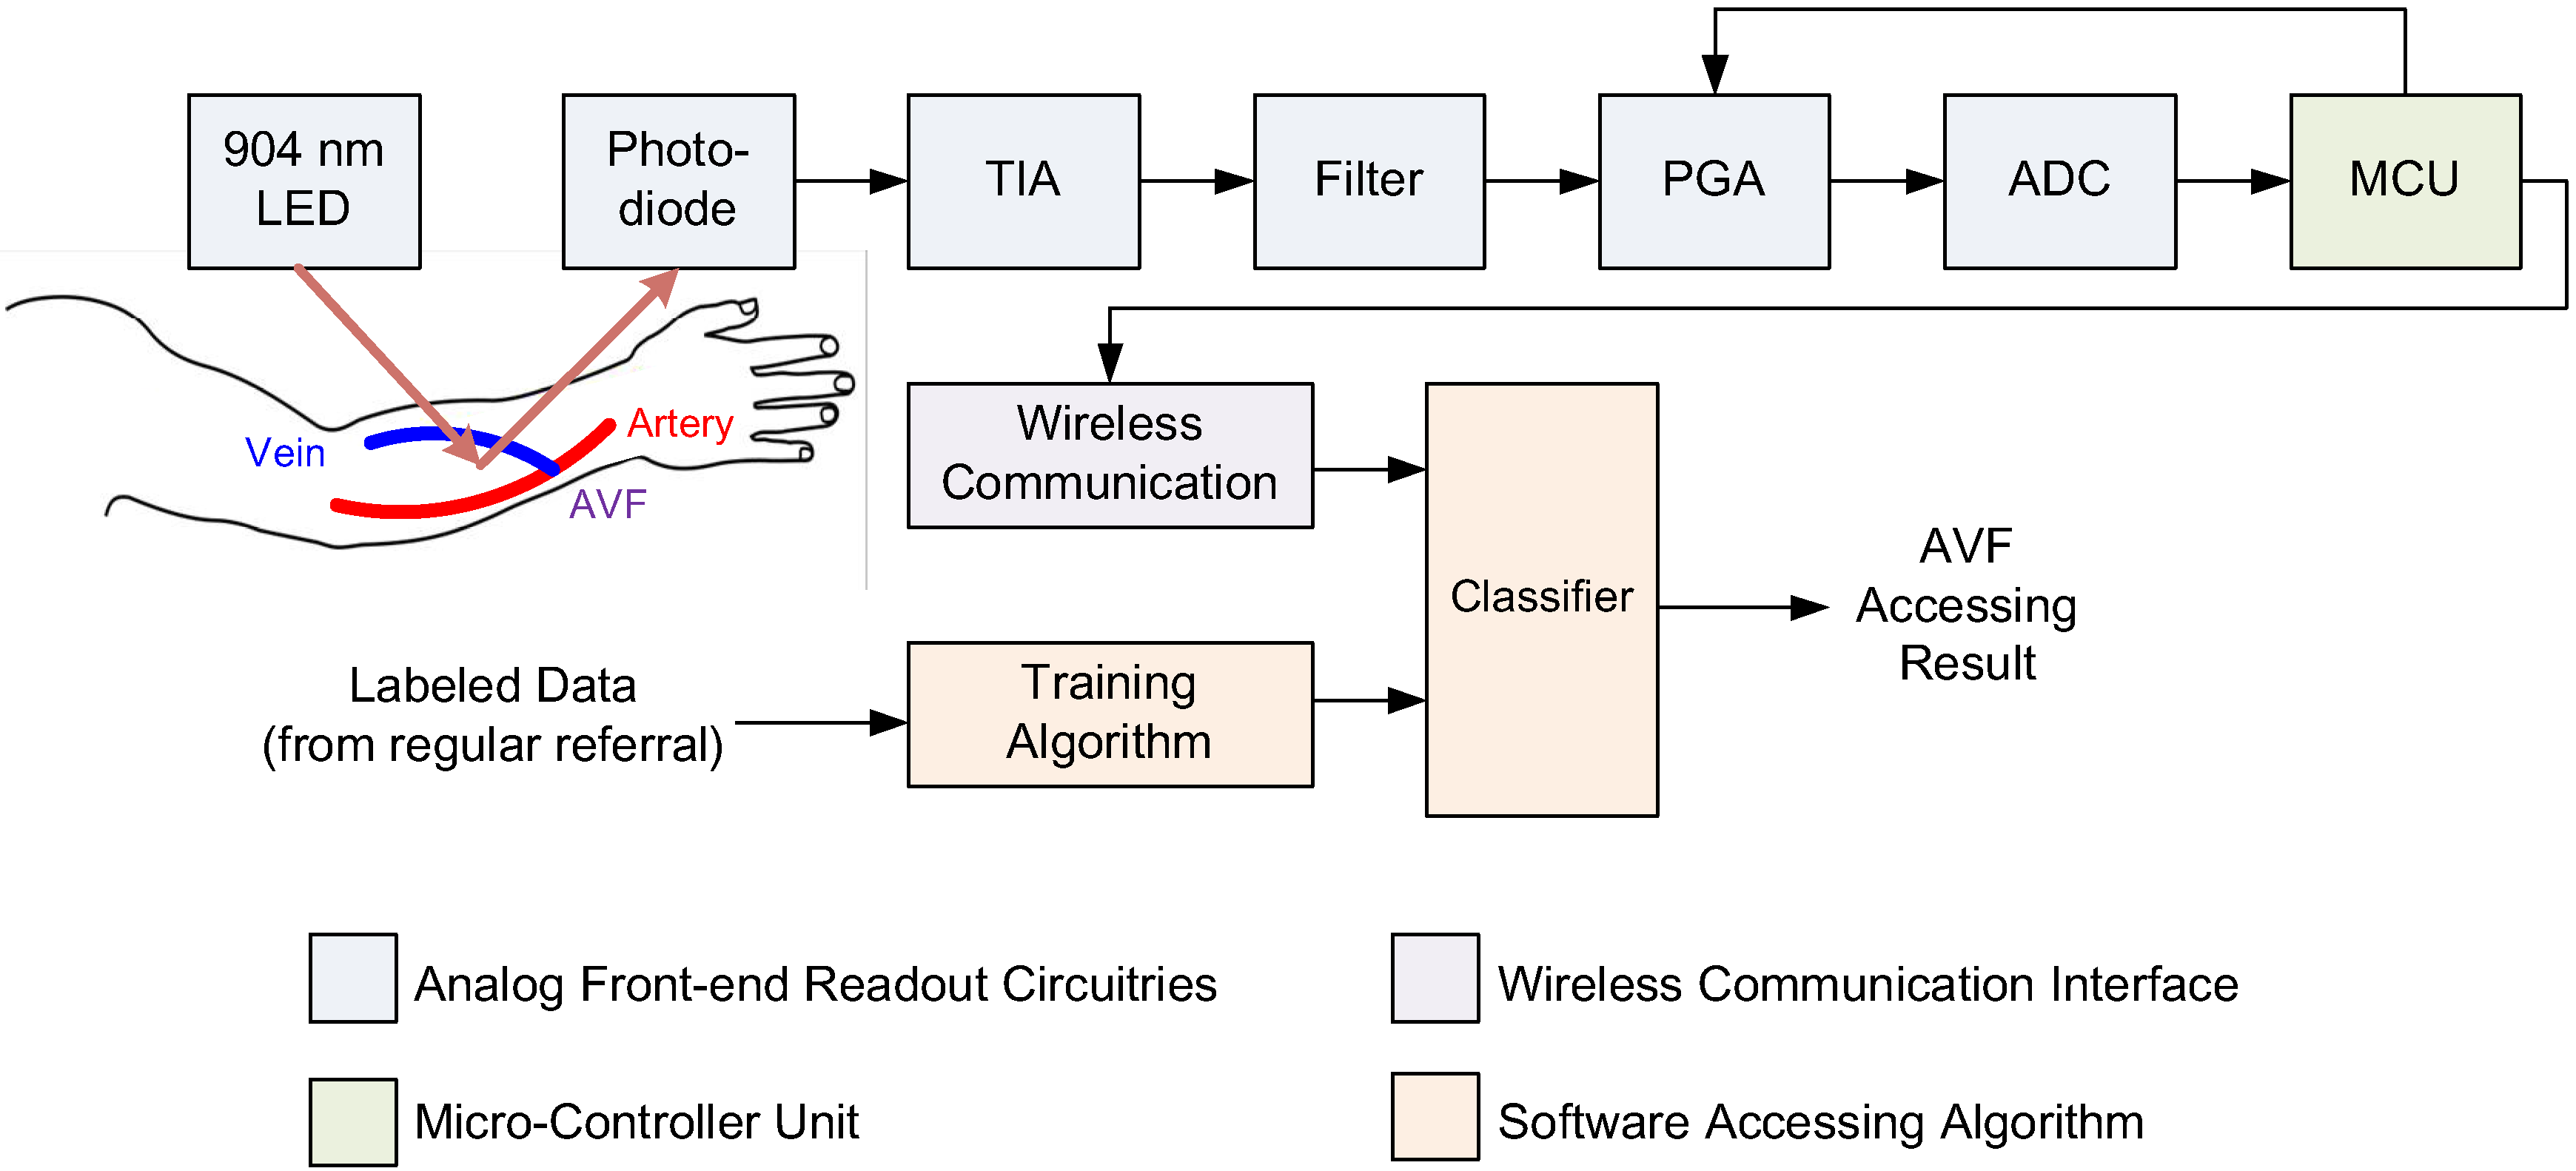
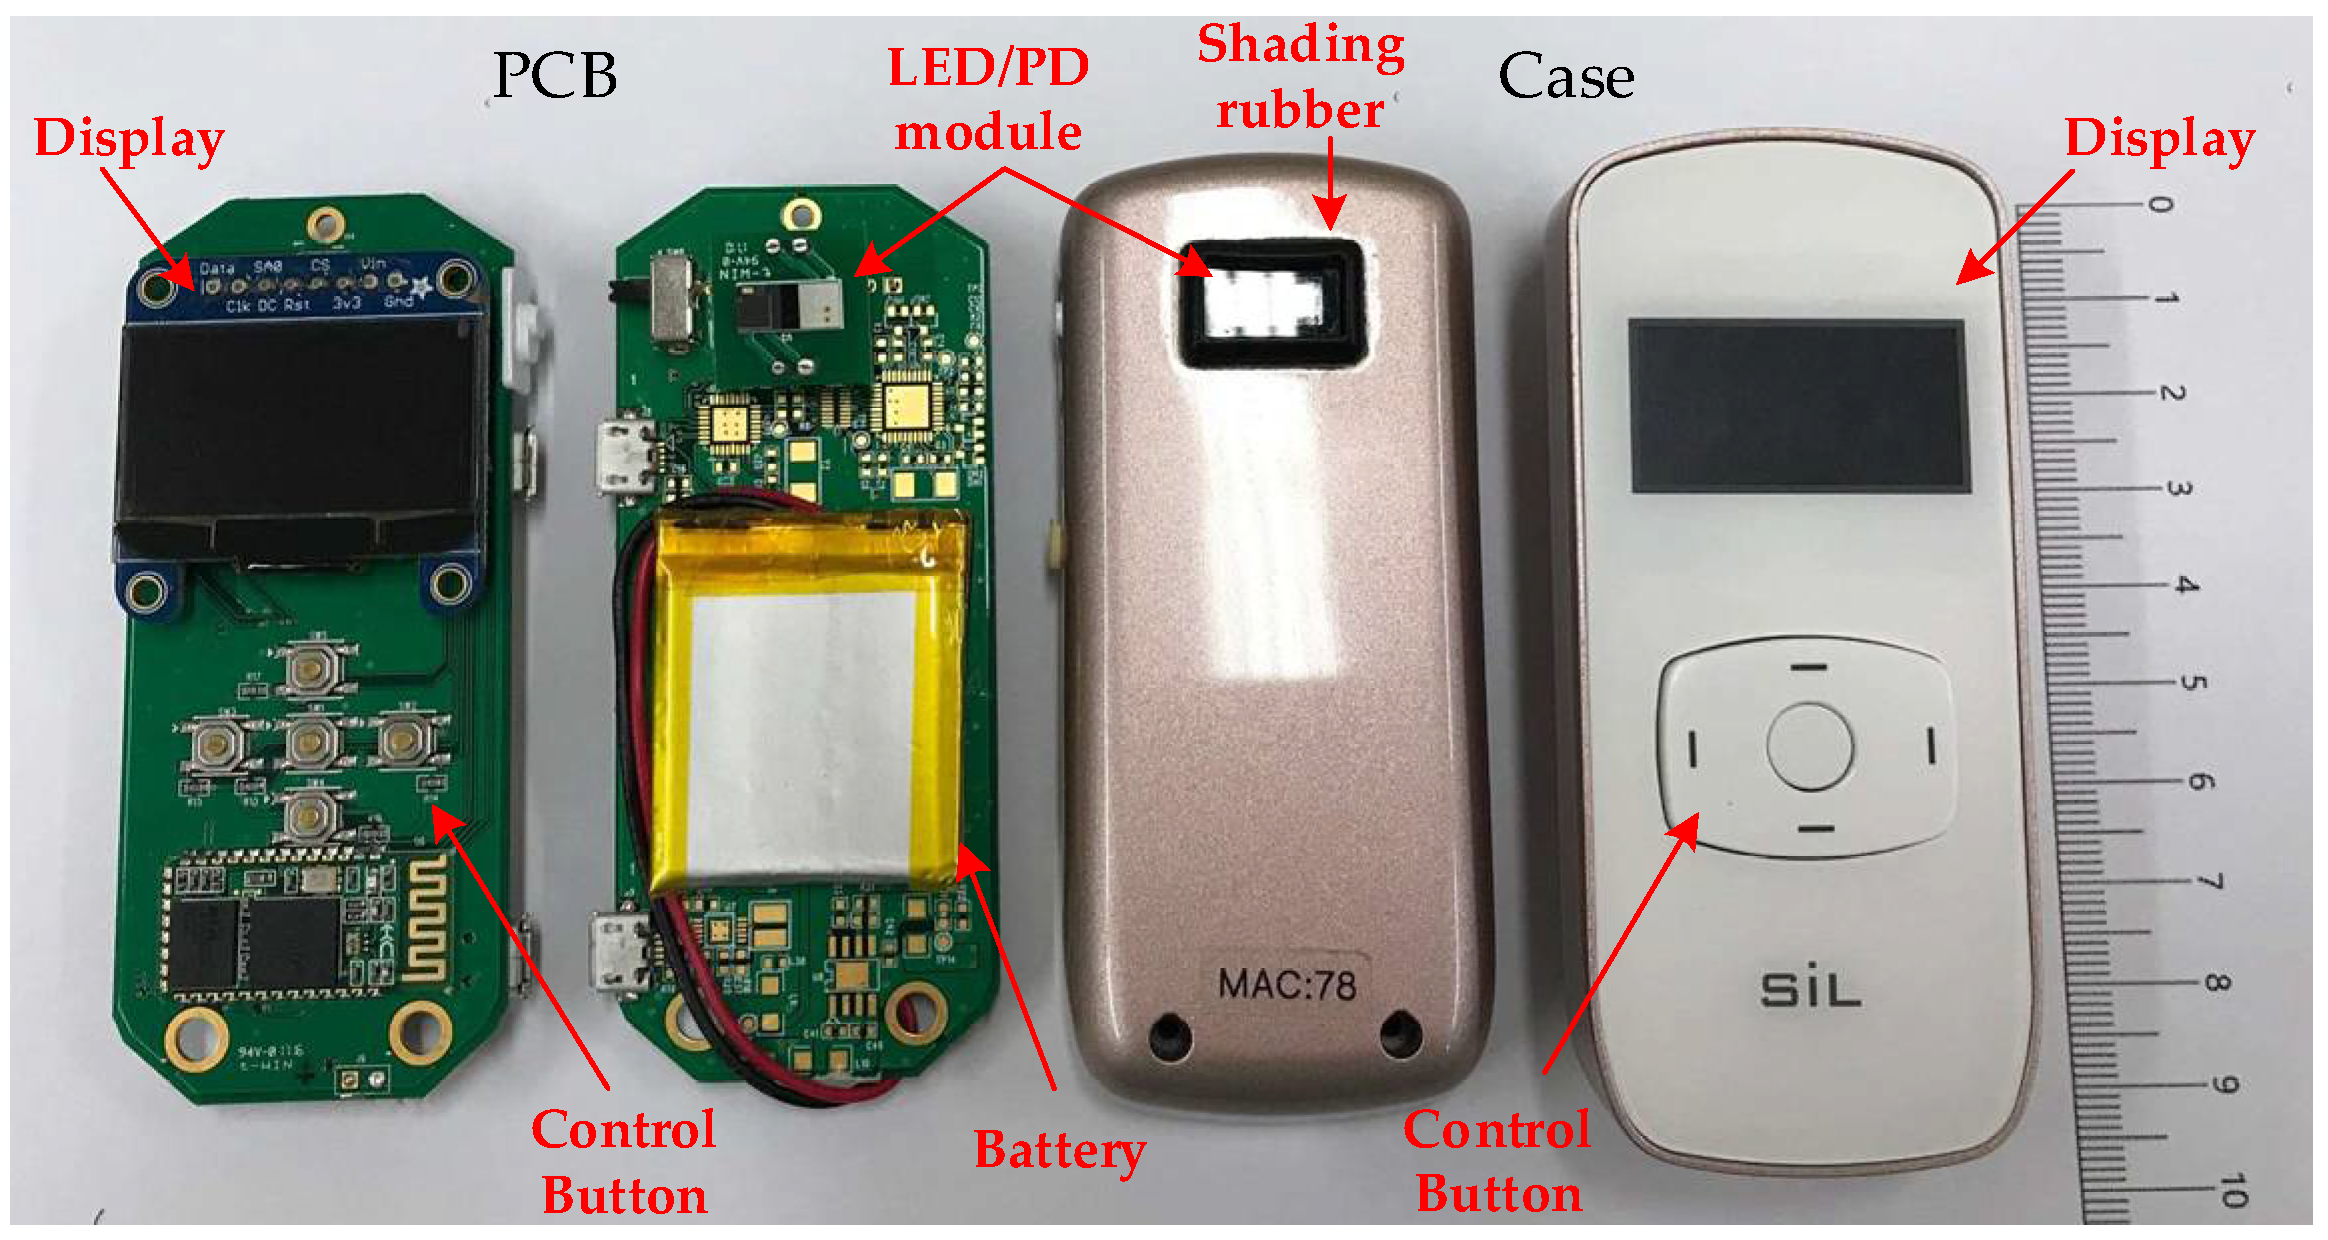
3. Sensor System Design

With input features determined for classifiers, a readout circuitry was designed and realized, as shown Figure 4. This readout consisted of the front-end analog readout circuitries, micro-controller unit (MCU), wireless communication, and the assessing algorithm. This readout circuitry was implemented on a printed circuit board (PCB). Enclosing the PCB was a newly-developed PPG sensor device, as shown in Figure 5. Also, the photo of measurement using this PPG sensor device is shown in Figure 6. The detailed designs of the circuitry and the algorithms are described in the following.

3.1. Readout Circuitry

The analog readout circuitry of the employed PPG sensor device was composed of a light emitted diode (LED), a photodiode (PD), a transimpedance amplifier (TIA), a band-pass filter, a programmable gain amplifier (PGA), and an analog–digital converter (ADC), as shown in Figure 4. First, the light beams emitted from the LED penetrate, refract, and reflect back from the blood vessels in the measured AVF. Then, the intensity changes of the reflected light due to the pulsation of the blood vessels at the AVF are detected and converted by the PD into electrical current signals. Next, a TIA circuit was designed and implemented to transform the current signals from PD into the voltage signals. Third, to deal with motion artifacts and interferences from ambient lighting (50 or 60 Hz), a 4th-order band-pass filter with cut-off frequencies about 0.2 and 10 Hz was proposed to delete the undesired frequency components. Note that the cut-off frequencies are determined in a real-time fashion by the adopted MCU based on the heart rate analyzed from the measured PPG waveforms. This adaptiveness of the cut-offs is highly important, considering the large variations in heart rate from person to person, i.e., approximately 50–110 Hz. Moreover, a tunable PGA circuit was proposed to increase the SNR by controlling the PPG signals to fill the full dynamic range of the ADC. Note that the novel designs of the 4th-order band-pass filter and the tunable PGA make it possible to render PPG waveforms that are almost DC-free and fully dynamic ranged. Finally, the digital PPG signals converted from the ADC are transmitted wirelessly to a smart-phone application or a laptop for the classifier algorithm to assess AVF quality.

3.2. Assessing Algorithms

In this work, three different machine learning classifiers are proposed to assess the quality of the AVF, including k-nearest neighbors (kNN), naïve Bayes classifier (NBC), and support vector machine (SVM). The details are described in the followings.

3.2.1. k-Nearest Neighbors (kNN)

The k-nearest neighbors (kNN) is a popular non-parametric supervised learning method used for classification or pattern recognition. It is reported to reveal promising results in PPG sensor applications in biometrics identification [24] and in detecting obstructive sleep apnea [25]. The basic concept of kNN is to classify the testing data by training data with the k nearest Euclidean distance. Although the simple computation makes kNN suitable for implementation in many small-sized devices or into application-specific integrated circuits (ASICs), the computation time may grow without proper feature reduction and/or data compression. Generally, the computation time for the complexity of N samples in a D feature dimension using k-nearest samples is in an order of D × N × k. In this work, the distance matrix was calculated using Euclidean distance, while the optimized k value was obtained by a using grid search technique.

3.2.2. Naive Bayes Classifier (NBC)

Naive Bayes classifier is a known supervised learning method for classifying data by applying Bayes theorem under the assumption that all features are independent of each other. Although the independences among all features are always violated in real-world problems, NBC still reveals some robustness in two-class classification due to the fact that the classification results based on the maximum a posterior portability regardless of the probability function of each class. Naive Bayes classifier is widely used in classification applications for PPG sensors such as biometrics [26], cardiac alarming [27], etc. In this work, all feature distributions were assumed to be Gaussian distribution. Therefore, the mathematical equation of the probability density function of the testing data y classified to class Ck can be expressed as:
p ( x = y | C k ) = 1 2 π σ k 2 e x p ( ( y μ k ) 2 2 σ k 2 ) ,
where x denotes a continuous value; y denotes the testing data; Ck denotes the kth class; μk and σ2k denote the mean and variance of the training dataset, respectively.

3.2.3. Support Vector Machine (SVM)

The SVM classifier is a popular supervised learning algorithm for data classification, of which the basic concept is to find a hyper-plane separating the two classes with the largest margin. The computation process of SVM can be described as a Lagrange optimization problem in dual quadratic form:
L p = 1 2 β β + C * j n ζ j j n μ j ζ j j n α j ( y i f j ( x j ) ( 1 ζ j ) ) ,
where Lp is the objective function of Lagrange; fj(x) is the separating hyper-plane with pointing vector β and bias vector b; αj and μj are the Lagrange multiplier; xj are the features vector with the class label yj; ξj is the slack variable representing the subjects of misclassification; and C* is the penalty for misclassification. Moreover, solving Equation (25) leads to the dual formulation as:
max α j n α j 1 2 j n k n α j α k y j y k x j x k ,
subjected to the constraint:
j n y j α j = 0 ,   0 α j C * .  
To deal with non-linear-separable classification problems, the kernel function technique was introduced to transform the dot product xjxk into another features space. In this work, the radial basis function is proposed as the kernel function:
G ( x j , x k ) = e x p ( x j x k 2 σ ) ,
where G(xj,xk) denotes the radial basis kernel function for substituting the dot product x’jxk; σ is a tunable parameter denoting the scaling factors. The optimized value of C* and σ are determined by using a grid search technique.

3.2.4. Input Features

According to the discussion in Section 2, the input features for assessing AVF by DOS and BFV are determined based on Equations (17) and (23), respectively, as listed in Table 1. Note herein that the six features selected, as seen in Table 1, are complete based on the thorough physiological analysis leading to Equations (17) and (23) in Section 2.2 and Section 2.3, but not guaranteed independent of each other. This possible non-independence is supposed to be well tackled by the three adopted machine-learning classifiers, especially the SVM that establishes hyperplanes among features to tackle the dependencies. To avoid weighted error, all features are normalized to −1 and 1 before training. Also, to avoid over-fitting results, 10 fold cross validation was introduced in this work. The steps for the 10 fold cross validation process are:
  • Step (1): randomly divide subjects into 10 subsets.
  • Step (2): take only one subset for testing and leave the other for training.
  • Step (3): repeat Step (2) 10 times.
  • Step (4): calculate the average accuracy and analyze the results.

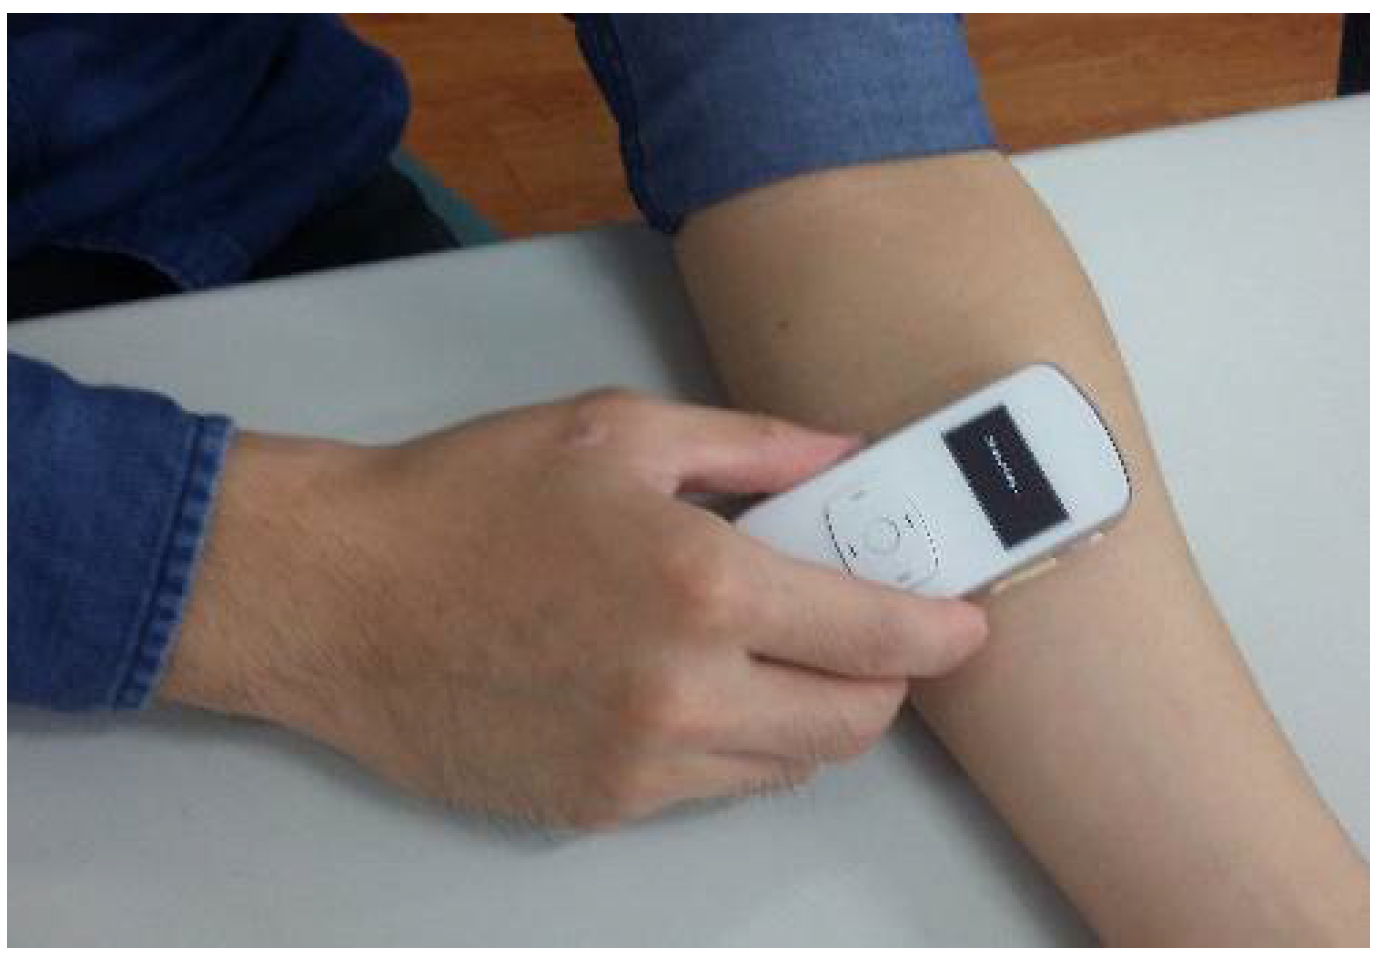
4. Clinical Validation

4.1. Experiment Setup

According to the National Kidney Foundation [1], AVFs with DOS larger than 30% are regarded as high-risk in patients. Patients were labeled into DOS-positive and DOS-negative classes. The ground truths of DOS were measured by an ultrasound Doppler machine, Phillips ClearVue 550. In this work, there were a total of 74 subjects who participated in the DOS assessment experiments, including 45 patients labeled as DOS-positive class (DOS < 30%), while 29 patients were labeled as DOS-negative class (DOS > 30%). On the other hand, also according to the National Kidney Foundation [1], the BFV at AVF should be at least 600 mL/min for functional HD treatments. The ground truths of BFV were also obtained by the aforementioned ultrasound Doppler machine, Phillips ClearVue 550. There were a total of 79 subjects who participated in the BFV assessment experiment, including 61 subjects labeled as BFV-positive class (BFV > 600 mL/min), while 18 subjects were labeled as BFV-negative class (BFV < 600 mL/min).
Prior to measurements, all subjects were asked to rest for at least 10 min. During the experiments, the DOS and BFV of each patient were measured and labeled as positive or negative by professional nephrologists. Systolic and diastolic blood pressures were measured with an electronic sphygmomanometer, while the oxyhemoglobin saturation for pulse oximetry (SpO2) was measured by a certified oximeter. The proposed PPG sensor was placed at the same measuring spot as the ultrasound Doppler machine. The values of PImax, PImin, and HR (ω) were obtained via calculations based on the measured PPG signals. A photo of the proposed PPG sensor device during measurement is shown in Figure 6.

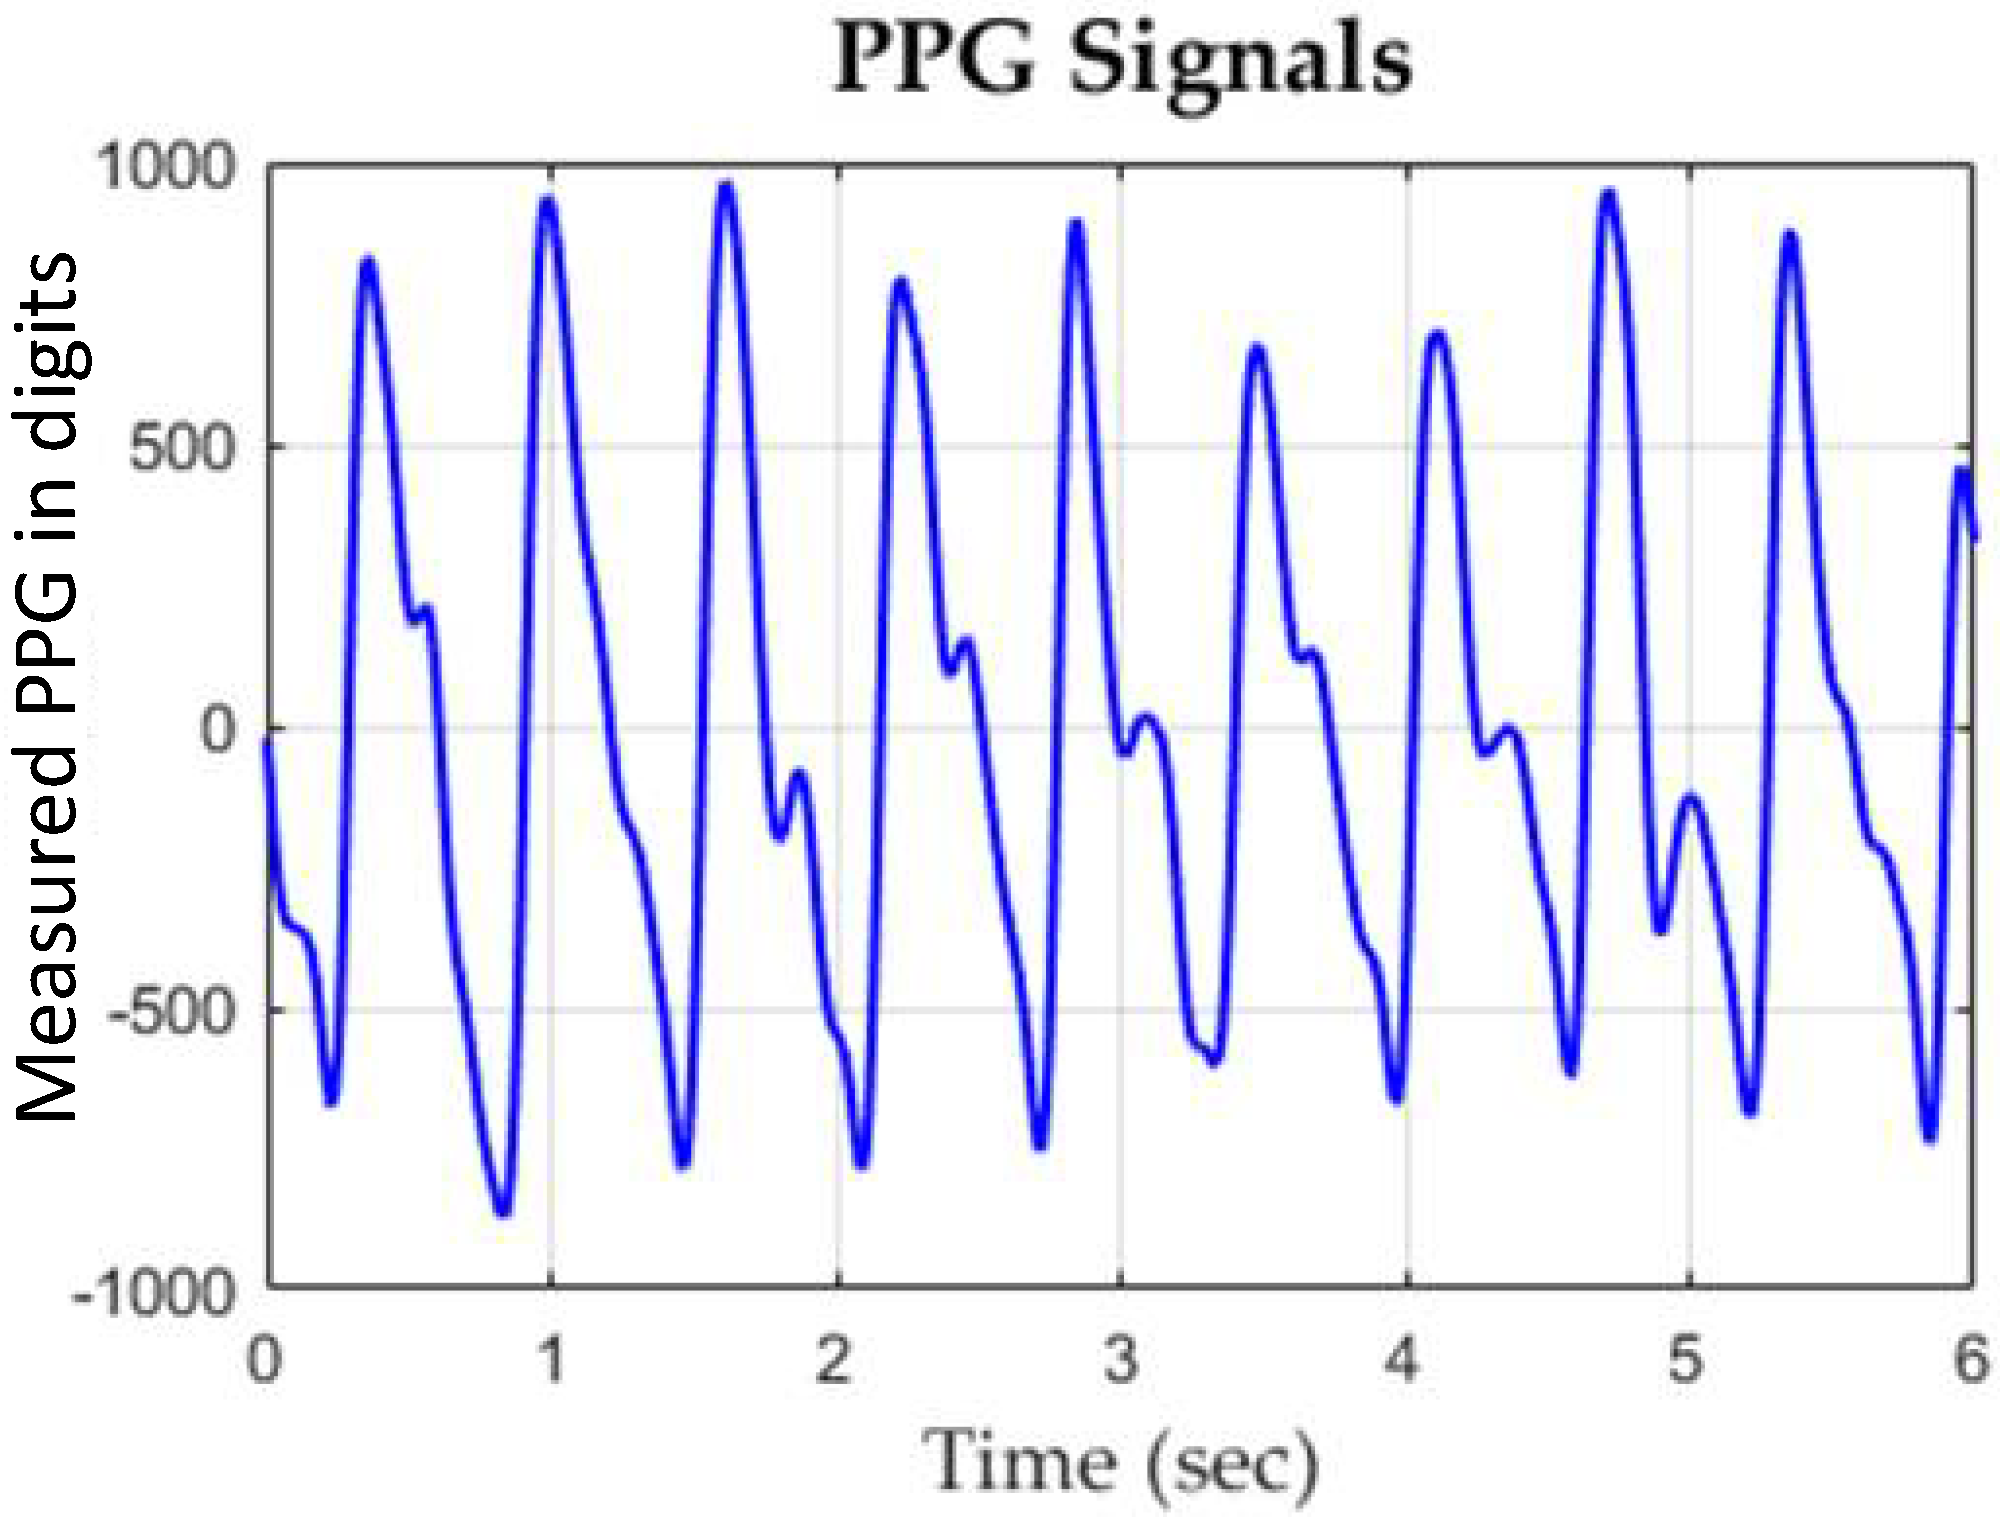
4.2. Experiment Results

A typical PPG waveform measured by the employed PPG sensor device is shown in Figure 7. The confusion matrix of the classification results of assessing DOS and BFV are shown in Table 2 and Table 3, respectively, where it can be seen that the SVM classifier showed higher accuracies and lower type II error as compared to other methods. A comparison table to other works is given as Table 4.
Observing Table 4, it is clear that the employed PPG sensor device with the designed SVM classifier demonstrated significantly better performance as compared to acoustic sensors in accuracy and type II error for assessing DOS. Although the bilateral PPG sensor [8] shows the highest accuracy in assessing DOS, its sensor’ size are too large to be implemented with a portable or wearable device, not to mention only 11 subjects were tested. On the other hand, for assessing BFV, the proposed PPG sensor device was much better than the authors’ previous work [10] in type II error. Lastly, the employed PPG sensor device with the designed SVM classifier showed better performance compared to the camera sensor [13] in both the sensor’s size and assessing results.

5. Conclusions

A newly developed PPG sensor device with a SVM classifier designed for assessing DOS and BFV at AVF were proposed in this work. The optical theory of PPG and the hemodynamic models of AVF were reviewed and solved by an analogy to the telegrapher equation to determine all the possible input features of classifiers for assessing BFV. In addition, the readout circuitry for the PPG sensor device was custom-designed successfully to reduce ambient interference and also improve signal quality. Three classifiers of kNN, NBC, and SVM were applied for assessing AVF. Experiments were conducted with the results showing that the SVM rendered the best performance, successfully achieving the accuracies of 87.84% and 88.61% in assessing AVF quality by DOS and BFV, respectively. These well-demonstrated performances are favorable to the results by all prior arts. The satisfactory accuracies of sensing DOS/BFV presented by the PPG sensor device and the SVM algorithm inside offer hemodialysis patients a convenient device to monitor the quality of their AVFs ubiquitously, including at home. With high accuracies achieved on DOS and BFV individually, future efforts are being undertaken to develop a new classifier to ensure both DOS and BFV are within secure ranges (DOS < 30% and BFV > 600 mL/min) defined by the National Kidney Foundation.

Author Contributions

Conceptualization, P.-Y.C., P.C.-P.C., C.-Y.Y., D.-C.T., and C.-L.W.; Data curation, P.-Y.C., T.-Y.T., Y.-H.K., C.-Y.Y., and D.-C.T.; Formal analysis, P.-Y.C.; Project administration, P.C.-P.C.; Software, T.-Y.T. and Y.-H.K.; Supervision, P.C.-P.C.; Validation, P.-Y.C., T.-Y.T., and Y.-H.K.; Writing—original draft, P.-Y.C., P.C.-P.C., and T.-Y.T.

Acknowledgments

This study was supported by the Ministry of Science and Technology, Taiwan via grant nos. MOST 106-2634-F-009-001-CC2, 107-2221-E-009-166-MY2, 107-2218-E-009-006-, 107-3017-F009-003, 107-2622-E-009-025-CC2, 108-2823-8-009-002-, and 108-2623-E-009-004-D. It was also supported in part by the Novel Bioengineering and Technological Approaches to Solve Two Major Health Problems in Taiwan sponsored by the Taiwan Ministry of Science and Technology Academic Excellence Program under Grant Number: MOST 108-2633-B-009-001. This work was financially supported by the Center for Intelligent Drug Systems and Smart Bio-devices (IDS2B) from The Featured Areas Research Center Program within the framework of the Higher Education Sprout Project by the Ministry of Education (MOE) in Taiwan.

Conflicts of Interest

The authors declare no conflict of interest.

Ethical Statements

All subjects gave their informed consent for inclusion before they participated in the study. The study was conducted in accordance with the Declaration of Helsinki, and the protocol was approved by the Ethics Committee of National Chiao Tung University (NCTU-REC-105-048) and Ethics Committee of Taipei Veterans General Hospital (2017-01-003A).

Appendix A

At first, it is supposed that:
p ( z , t ) = P ( z ) e j ω t ,
q ( z , t ) = Q ( z ) e j ω t ,
where P(z) and Q(z) denote the phasers of p(z,t) and q(z,t), respectively. Substituting Equations (A1) and (A2) into Equations (6) and (7) gives:
P ( z ) z = ( R + j ω L ) Q ( z ) ,
Q ( z ) z = ( G + j ω C ) P ( z ) .
Taking partial derivatives of Equations (A3) and (A4) with respect to z yields:
2 P ( z ) z 2 = ( R + j ω L ) Q ( z ) z ,
2 Q ( z ) z 2 = ( G + j ω C ) P ( z ) z .
Combining Equations (A3)–(A6) leads to:
2 P ( z ) z 2 = ( R + j ω L ) ( G + j ω C ) P ( z ) ,
2 Q ( z ) z 2 = ( R + j ω L ) ( G + j ω C ) Q ( z ) ,
where the impedance term can be expressed as:
γ 2 = ( R + j ω L ) ( G + j ω C ) .
Therefore, Equations (A7) and (A8) can be rewritten as:
2 P ( z ) z 2 = γ 2 P ( z ) ,
2 Q ( z ) z 2 = γ 2 Q ( z ) .
Equations (A10) and (A11) are to be solved for P and Q in homogenous formats as:
P ( z ) = P 0 + e γ z + P 0 e γ z ,
Q ( z ) = Q 0 + e γ z + Q 0 e γ z ,
where P0+ and P0 denote the BP wave along positive and negative directions, respectively, while Q0+ and Q0 denote the BFV along positive and negative directions, respectively. The pulse waves from the negative direction, P0 and Q0, are the waves reflected from peripheral microvessels. Moreover, it is known that wave velocity of blood (about 10 m/s) is much faster than fluid velocity of blood (about 50 cm/s), thus, the waveforms of P and Q are superimposed at AVF. Furthermore, considering the amplitude of the reflected wave is small enough at AVF to be considered as negligible as compared to the forward wave, Equations (A12) and (A13) can be approximated by:
P ( z ) = P 0 + e γ z ,
Q ( z ) = Q 0 + e γ z .
Substitution of Equations (A14) and (A15) into Equations (A1) and (A2) gives:
p ( z , t ) = P 0 + e γ z e j ω t ,
q ( z , t ) = Q 0 + e γ z e j ω t ,
Considering only the real parts of BP and BFV waves give the solutions of BP and BFV as
p ( z , t ) = Re P 0 + e γ z e j ω t = P 0 + e α z cos ( β z + ω t ) ,
q ( z , t ) = Re Q 0 + e γ z e j ω t = Q 0 + e α z cos ( β z + ω t ) ,
where Re denotes the real parts of complex numbers.

References

  1. National Kidney Foundation. KDOQI clinical practice guidelines and clinical practice recommendations for 2006 updates: Hemodialysis adequacy, peritoneal dialysis adequacy and vascular access. Am. J. Kidney Dis. 2006, 48, S1–S322. [Google Scholar]
  2. Wang, H.Y.; Wu, C.H.; Chen, C.Y.; Lin, B.S. Novel noninvasive approach for detecting arteriovenous fistula stenosis. IEEE Trans. Biomed. Eng. 2014, 61, 1851–1857. [Google Scholar] [CrossRef] [PubMed]
  3. Chen, W.L.; Kan, C.H.; Lin, C.H. Arteriovenous shunt stenosis evaluation using a fractional-order fuzzy petri net based screening system for long-term hemodialysis patients. J. Biomed. Sci. Eng. 2014, 7, 258–275. [Google Scholar] [CrossRef]
  4. Yeih, D.F.; Wang, Y.S.; Huang, Y.C.; Chen, M.F.; Lu, S.S. Physiology-based diagnosis algorithm for arteriovenous fistula stenosis detection. In Proceedings of the 2014 36th Annual International Conference of the IEEE Engineering in Medicine and Biology Society, Chicago, IL, USA, 26–30 August 2014; pp. 4619–4622. [Google Scholar] [CrossRef]
  5. Durand, L.G.; Pibarot, P. Digital signal processing of the phonocardiogram: Review of the most recent advances. Crit. Rev. Biomed. Eng. 1995, 23, 163–219. [Google Scholar] [CrossRef] [PubMed]
  6. Wu, J.X.; Lin, C.H.; Wu, M.J.; Li, C.M.; Lim, B.Y.; Du, Y.C. Bilateral photoplethysmography analysis for arteriovenous fistula dysfunction screening with fractional-order feature and cooperative game-based embedded detector. Healthc. Technol. Lett. 2015, 2, 64–69. [Google Scholar] [CrossRef] [PubMed]
  7. Du, Y.C.; Stephanus, A. A Novel Classification Technique of Arteriovenous Fistula Stenosis Evaluation Using Bilateral PPG Analysis. Micromachines 2016, 7, 147. [Google Scholar] [CrossRef] [PubMed]
  8. Du, Y.C.; Stephanus, A. Levenberg-Marquardt Neural Network Algorithm for Degree of Arteriovenous Fistula Stenosis Classification Using a Dual Optical Photoplethysmography Sensor. Sensors 2018, 18, 2322. [Google Scholar] [CrossRef] [PubMed]
  9. Wu, J.X.; Lin, C.H.; Du, Y.C.; Chen, P.J.; Shih, C.C.; Chen, T. Estimation of arteriovenous fistula stenosis by FPGA based Doppler flow imaging system. In Proceedings of the 2015 IEEE International Ultrasonics Symposium (IUS), Taipei, Taiwan, 21–24 October 2015; pp. 1–4. [Google Scholar] [CrossRef]
  10. Chiang, P.Y.; Chao, P.C.P.; Tarng, D.C.; Yang, C.Y. A Novel Wireless Photoplethysmography Blood-Flow Volume Sensor for Assessing Arteriovenous Fistula of Hemodialysis Patients. IEEE Trans. Ind. Electron. 2017, 64, 9626–9635. [Google Scholar] [CrossRef]
  11. Webb, R.C.; Ma, Y.; Krishnan, S.; Li, Y.; Yoon, S.; Guo, X.; Feng, X.; Shi, Y.; Seidel, M.; Cho, N.H.; et al. Epidermal devices for noninvasive, precise and continuous mapping of macrovascular and microvascular blood flow. Sci. Adv. 2015, 1, 30. [Google Scholar] [CrossRef] [PubMed]
  12. Lee, Y.J.; Lee, C.K.; Kang, M.; Kang, S.J.; Kim, K.N.; Kim, K.; Kim, K.S.; Lee, J.W. Magneto-Plethysmographic Sensor for Peripheral Blood Flow Velocity. IEEE Sens. J. 2014, 14, 1341–1342. [Google Scholar] [CrossRef]
  13. Zhu, F.; Williams, S.; Putnam, H.; Campos, I.; Ma, J.; Johnson, C.; Kappel, F.; Kotanko, P. Estimation of arterio-venous access blood flow in hemodialysis patients using video image processing technique. In Proceedings of the 2016 38th Annual International Conference of the IEEE Engineering in Medicine and Biology Society (EMBC), Orlando, FL, USA, 16–20 August 2016; pp. 207–210. [Google Scholar] [CrossRef]
  14. Chuang, C.T.; Chang, T.; Chiang, Y.T.; Chang, F.R. Adaptive filtering for heart rate estimation using cepstrum technique. In Proceedings of the 2016 International Conference on System Science and Engineering (ICSSE), Puli, Taiwan, 7–9 July 2016; pp. 1–3. [Google Scholar] [CrossRef]
  15. Hsiao, C.C.; Hsu, F.W.; Lee, R.G.; Lin, R. Correlation analysis of heart rate variability between PPG and ECG for wearable devices in different postures. In Proceedings of the 2017 IEEE International Conference on Systems, Man, and Cybernetics (SMC), Banff, AB, Canada, 5–8 October 2017; pp. 2957–2962. [Google Scholar] [CrossRef]
  16. Huang, S.C.; Hung, P.H.; Hong, C.H.; Wang, H.M. A New Image Blood Pressure Sensor Based on PPG, RRT, BPTT, and Harmonic Balancing. IEEE Sens. J. 2014, 14, 3685–3692. [Google Scholar] [CrossRef] [Green Version]
  17. Yang, Y.H.; Tang, K.T. A pulse oximetry system with motion artifact reduction based on Fourier analysis. In Proceedings of the 2014 IEEE International Symposium on Bioelectronics and Bioinformatics (IEEE ISBB 2014), Chung Li, Taiwan, 11–14 April 2014; pp. 1–4. [Google Scholar] [CrossRef]
  18. Venema, B.; Gehring, H.; Michelsen, I.; Blanik, N.; Blazek, V.; Leonhardt, S. Robustness, Specificity, and Reliability of an In-Ear Pulse Oximetric Sensor in Surgical Patients. IEEE J. Biomed. Health Inform. 2014, 18, 1178–1185. [Google Scholar] [CrossRef] [PubMed]
  19. Lee, C.; Shin, H.S.; Park, J.; Lee, M. The Optimal Attachment Position for a Fingertip Photoplethysmographic Sensor with Low DC. IEEE Sens. J. 2012, 12, 1253–1254. [Google Scholar] [CrossRef]
  20. Nitzan, M.; Romem, A.; Koppel, R. Pulse oximetry: Fundamentals and technology update. Med. Devices Evid. Res. (Auckland, N.Z.) 2014, 7, 231–239. [Google Scholar] [CrossRef] [PubMed]
  21. Bessems, D.; Rutten, M.; Vosse, F.V.D. A wave propagation model of blood flow in large vessels using an approximate velocity profile function. J. Fluid Mech. 2007, 580, 145–168. [Google Scholar] [CrossRef] [Green Version]
  22. Chiang, P.Y.; Chao, P.C.P.; Yang, C.Y.; Tarng, D.C. Theoretical Developments and Clinical Experiments of Measuring Blood Flow Volume (BFV) at Arteriovenous Fistula (AVF) Using a Photoplethysmography (PPG) Sensor. Microsyst. Technol. 2018, 24, 4587–4603. [Google Scholar] [CrossRef]
  23. Womersley, J.R. Method for the calculation of velocity, rate of flow and viscous drag in arteries when the pressure gradient is known. J. Physiol. 1995, 127, 553–563. [Google Scholar] [CrossRef] [PubMed]
  24. Akhter, N.; Tharewal, S.; Gite, H.; Kale, K.V. Microcontroller based RR-Interval measurement using PPG signals for Heart Rate Variability based biometric application. In Proceedings of the 2015 International Conference on Advances in Computing, Communications and Informatics (ICACCI), Kochi, India, 10–13 August 2015; pp. 588–593. [Google Scholar] [CrossRef]
  25. Bozkurt, F.; Uçar, M.K.; Mehmet, R.B.; Tuna, S.; Bílgín, C. Respiratory scoring using photoplethysmography signal and nearest neighbor algorithm. In Proceedings of the 2018 26th Signal Processing and Communications Applications Conference (SIU), Izmir, Turkey, 2–5 May 2018; pp. 1–3. [Google Scholar] [CrossRef]
  26. Nadzri, N.I.M.; Sidek, K.A.; Nor, R.M. Biometric Identification for Twins Using Photoplethysmogram Signals. In Proceedings of the 2016 6th International Conference on Information and Communication Technology for The Muslim World (ICT4M), Jakarta, Indonesia, 22–24 November 2016; pp. 320–324. [Google Scholar] [CrossRef]
  27. Venema, B.; Blazek, V.; Leonhardt, S. In-ear photoplethysmography for mobile cardiorespiratory monitoring and alarming. In Proceedings of the 2015 IEEE 12th International Conference on Wearable and Implantable Body Sensor Networks (BSN), Cambridge, MA, USA, 9–12 June 2015; pp. 1–5. [Google Scholar] [CrossRef]
Figure 1. A typical photoplethysmography (PPG) signal, which consists of a very large DC component (>90%) and a very small AC component (<10%) with pulse frequency the same as heart rate (about 50–110 bpm).
Sensors 19 03422 g001
Figure 2. The coordinate axis used in this work, where the z-axis lies along the blood vessel with the measuring spot assumed to be at z = 0.
Sensors 19 03422 g002
Figure 3. The definition of degree of stenosis (DOS), which is defined as the ratio of the stenosis to non-stenosis areas, where h1 and h2 denote the wall thicknesses of normal vessel and the vessel with endothelia cell proliferation.
Sensors 19 03422 g003
Figure 4. The system architecture of the proposed wireless PPG sensor system for accessing arteriovenous fistulas (AVFs), which is composed of a 904 nm wavelength light-emitting diode (LED), a photodiode (PD), a transimpedance amplifier (TIA), a band-pass filter, an analog–digital converter (ADC), a microcontroller unit (MCU), a wireless communication interface, and the proposed classifiers for accessing DOS and blood flow volume (BFV) of AVFs.
Sensors 19 03422 g004
Figure 5. A photo of the proposed portable, wireless, small-sized PPG sensor device for assessing AVF quality.
Sensors 19 03422 g005
Figure 6. Measurement by the PPG sensor.
Sensors 19 03422 g006
Figure 7. A typical experimental PPG waveform measured by the proposed PPG sensor.
Sensors 19 03422 g007
Table 1. The input features for assessing DOS and BFV.
SymbolFeatures for Assessing DOSFeatures for Assessing BFVMeasurementDescription
The max of peak to peak interval (PImax)OOThe perfusion index (AC/DC) by the PPG sensorsThe normalized maximum length of light transmission path in blood
The min of peak to peak interval (PImin)OOThe perfusion index (AC/DC) by the PPG sensorsThe normalized minimum length of light transmission path in blood
sphygmomanometer. Oxyhemoglobin saturation by pulse oximetry (SpO2)OOOximeterThe blood oxygen saturation level
Systolic Blood Pressure (SBP)OOElectronic sphygmomanometerThe systolic blood pressure
Diastolic Blood Pressure (DBP)OOElectronic sphygmomanometerThe diastolic blood pressure
Heart rate (ω)XOThe proposed PPG sensorsThe heart rate
Table 2. The confusion matrix for assessing DOS.
Samples Number = 74Ground Truth (Actual Class)
PositiveNegative
Classification Results of k-Nearest Neighbors (kNN)
(Predicted Class)
PositiveTP = 32 (43.24%)FP = 5 (6.76%)
NegativeFN = 13 (17.57%)TN = 24 (32.43%)
Classification Results of Naive Bayes Classifier (NBC)
(Predicted Class)
PositiveTP = 41 (55.41%)FP = 8 (10.81%)
NegativeFN = 4 (5.41%)TN = 21 (28.38%)
Classification Results of Support Vector Machine (SVM)
(Predicted Class)
PositiveTP = 42 (56.76%)FP = 6 (8.11%)
NegativeFN = 3 (4.05%)TN = 23 (31.08%)
Table 3. The confusion matrix of assessing BFV.
Samples Number = 79Ground Truth (Actual Class)
PositiveNegative
Classification Results of kNN
(Predicted Class)
PositiveTP = 51 (64.56%)FP = 6 (7.59%)
NegativeFN = 10 (12.66%)TN = 12 (15.19%)
Classification Results of NBC
(Predicted Class)
PositiveTP = 59 (74.68%)FP = 8 (10.13%)
NegativeFN = 2 (2.53%%)TN = 10 (12.66%)
Classification Results of SVM
(Predicted Class)
PositiveTP = 59 (74.68%)FP = 7 (8.86%)
NegativeFN = 2 (2.53%)TN = 11 (13.92%)
Table 4. Performance comparison table to other prior works.
H. Y. Wang et al. (2014) [2]Du Y.-C. et al. (2018) [8]D. F. Yeih et al. (2014) [4]J. X. Wu et al. (2015) [9]P. Y. Chiang et al. (2017) [10]F. Zhu et al. (2016) [13]This Work
SensorStethoscope AuscultationBilateral PPGStethoscope AuscultationUltrasoundSingle PPGCameraSingle PPG
Assessing IndexDOSDOSDOSDOSBFVBFVDOS and BFV
PrincipleAcousticOpticalAcousticDopplerOpticalOpticalOptical
CommunicationWirelessWiredWirelessWiredWirelessWiredWireless
Assessing AlgorithmNeural NetworkNeural NetworkSupport Vector MachineColor Relation AnalysisNeural NetworkOptic Flow MethodsSupport Vector Machine
Size9 cm × 4 cm × 2 cmLarge-Large9 cm × 8 cm × 4 cmLarge9 cm × 3.5 cm × 1.5 cm
Number of Subjects4791122504040DOS: 74
BFV: 79
Accuracy87.8%94.82%84.3%83%R2 = 0.7176 *R2 = 0.71 *
(with 32.5% outlier subjects)
DOS: 87.84%
BFV: 88.61%
Type II Error10.75%-16.7%->50%-DOS: 6.67%
BFV: 3.28%
* Correlation to ground truth is regarded as accuracies.

