1. Introduction
The low cost, off the shelf availability, and operational flexibility of a drone lead to its misuse by civilian society, apart from military applications, thereby increasing posing threats to society [
1]. Potential threats, such as drugs smuggling, transportation of contraband materials like weapons to criminals in prison, unauthorized imaging and filming in restricted areas, illegal surveillance, air collision, terrorist attacks, and radio frequency (RF) jamming are among the potential threats posed by the drone misuse. This has become a matter of importance due to the alarming threat to our community and the recorded security breach [
2] caused by a drone. It may have posed a threat to scenarios, such as (i) our recreational centers like a stadium, (ii) strategic and critical infrastructure or secured environment, etc., such that no sound can be noticed and no warnings may be provided.
Several attempts made to detect the drone, such as radio frequency-based (RF) [
3,
4], acoustic [
5], video imaging [
6], audiovisual [
7], software-based smartphone [
8], and other non-technical methods like shooting and netting [
9], reported their achievements in various capacities. Considering the drone-generated audio frequencies that are usually within 40 kHz, drone detection may fail due to a higher noise ratio in urban cities [
1]. The drone’s nature of following a predefined GPS route [
4,
10] provides no RF link to trace and, as such, cannot be detected. The constant update failure of the drone’s signatures needed by a referenced database in RF-based method [
4] and the noisy nature of unlicensed WIFI RF bands [
11] due to many users are other challenging issues. In the case of a camera-based method, detection may be hidden due to dynamic target background which, in turn, suffers few pixels representation; these make it difficult to differentiate a drone from flying birds [
1,
10]. The thermal technique is considered inefficient due to drone’s plastic frames and minimal heat exhaust [
1].
In contrast, these make a radar system as an alternative as it does not suffer from environmental effects, such as dark, noisy, and blurred or misty environments [
11]. The present challenge of detecting a target with low monostatic radar cross-section (RCS) like the drone by the modern radars [
12] is still challenging due to the target size and non-reflective material. The drone is considered difficult to be detected among other biological targets, such as insects and birds existing in the same surveillance volume, and is usually outside the range of conventional radars. Besides, some military unmanned aerial vehicle (UAVs) are made with stealth technology of high absorption coefficient, resulting in low monostatic RCS. Recently, a step-frequency continuous wave (SFCW) radar was proposed for Doppler compensation, especially when detecting target like UAV. Despite the achievement made, there are some unresolved challenges the drone feature due to the rotating blades. This has become challenging due to the nature and size of the drone; thus, this paper employed forward scattering radar (FSR) system to detect a drone and utilized its micro-Doppler formed by the drone rotating blades for its identification.
An FSR is a special bistatic mode when a bistatic angle is near to 180°. In FSR geometry, the target crossing between the transmitter (Tx) and receiver (Rx) blocks the electromagnetic (EM) wave traveling from the Tx-to-Rx; this forms a target’s shadow (silhouette) irrespective of the target’s material. The FSR minimizes the effect of radar cross-section (RCS) of the target while detection [
13,
14]. The high target’s RCS irrespective of the target’s shape and radar absorbing material (RAM) makes it popular over the traditional monostatic radar [
15]; instead, FSR considers the target physical dimension and the wavelength during detection. The FSR system has an improved feature of being counter to stealth technology, low RCS targets detection, high power yield [
16], among others. These identified benefits may fit its usage in detecting a target characterized as a low altitude, slow speed, and small RCS (LSS) target [
17] like a quadcopter commercial drone.
This paper aimed to conduct a micro-Doppler feature extraction and analysis of a drone rotating blades in addition to the main Doppler by using FSR geometry. We have presented a theoretical signal model, simulation, and experimental validation of the rotating blade signature. The actual drone signature in FSR geometry was presented with an extract of the LSS micro-Doppler feature, relative to the micro motions due to the blade rotation, as this can be a basis for drone classification from other similar targets. The paper is organized as follows:
Section 2 describes a theoretical signal model of Doppler of the main body and the micro-Doppler supported by simulation results.
Section 3 explains the experimental set-up and the experimental campaign.
Section 4 illustrates the experimental results and findings, and the paper is concluded by summarizing the outcomes of the entire work, suggesting some potential future research area.
2. Received Signal Model in FSR
A micro-Doppler signature from a drone rotating blade was a required parameter for detection in this paper. The rotating parts of the drone may have micro-motions referenced to the main silhouette-generating center of the target’s body; this resulted in an additional frequency modulations of the reflected wave and, hence, micro-Doppler [
18]. The signature is now determined by the additional motion of the target that is different from the main body’s motion [
17]. The micro-motion may be caused by rotation, vibrations, or both [
19,
20], resulted from multiple combinations of point scatterers [
21].
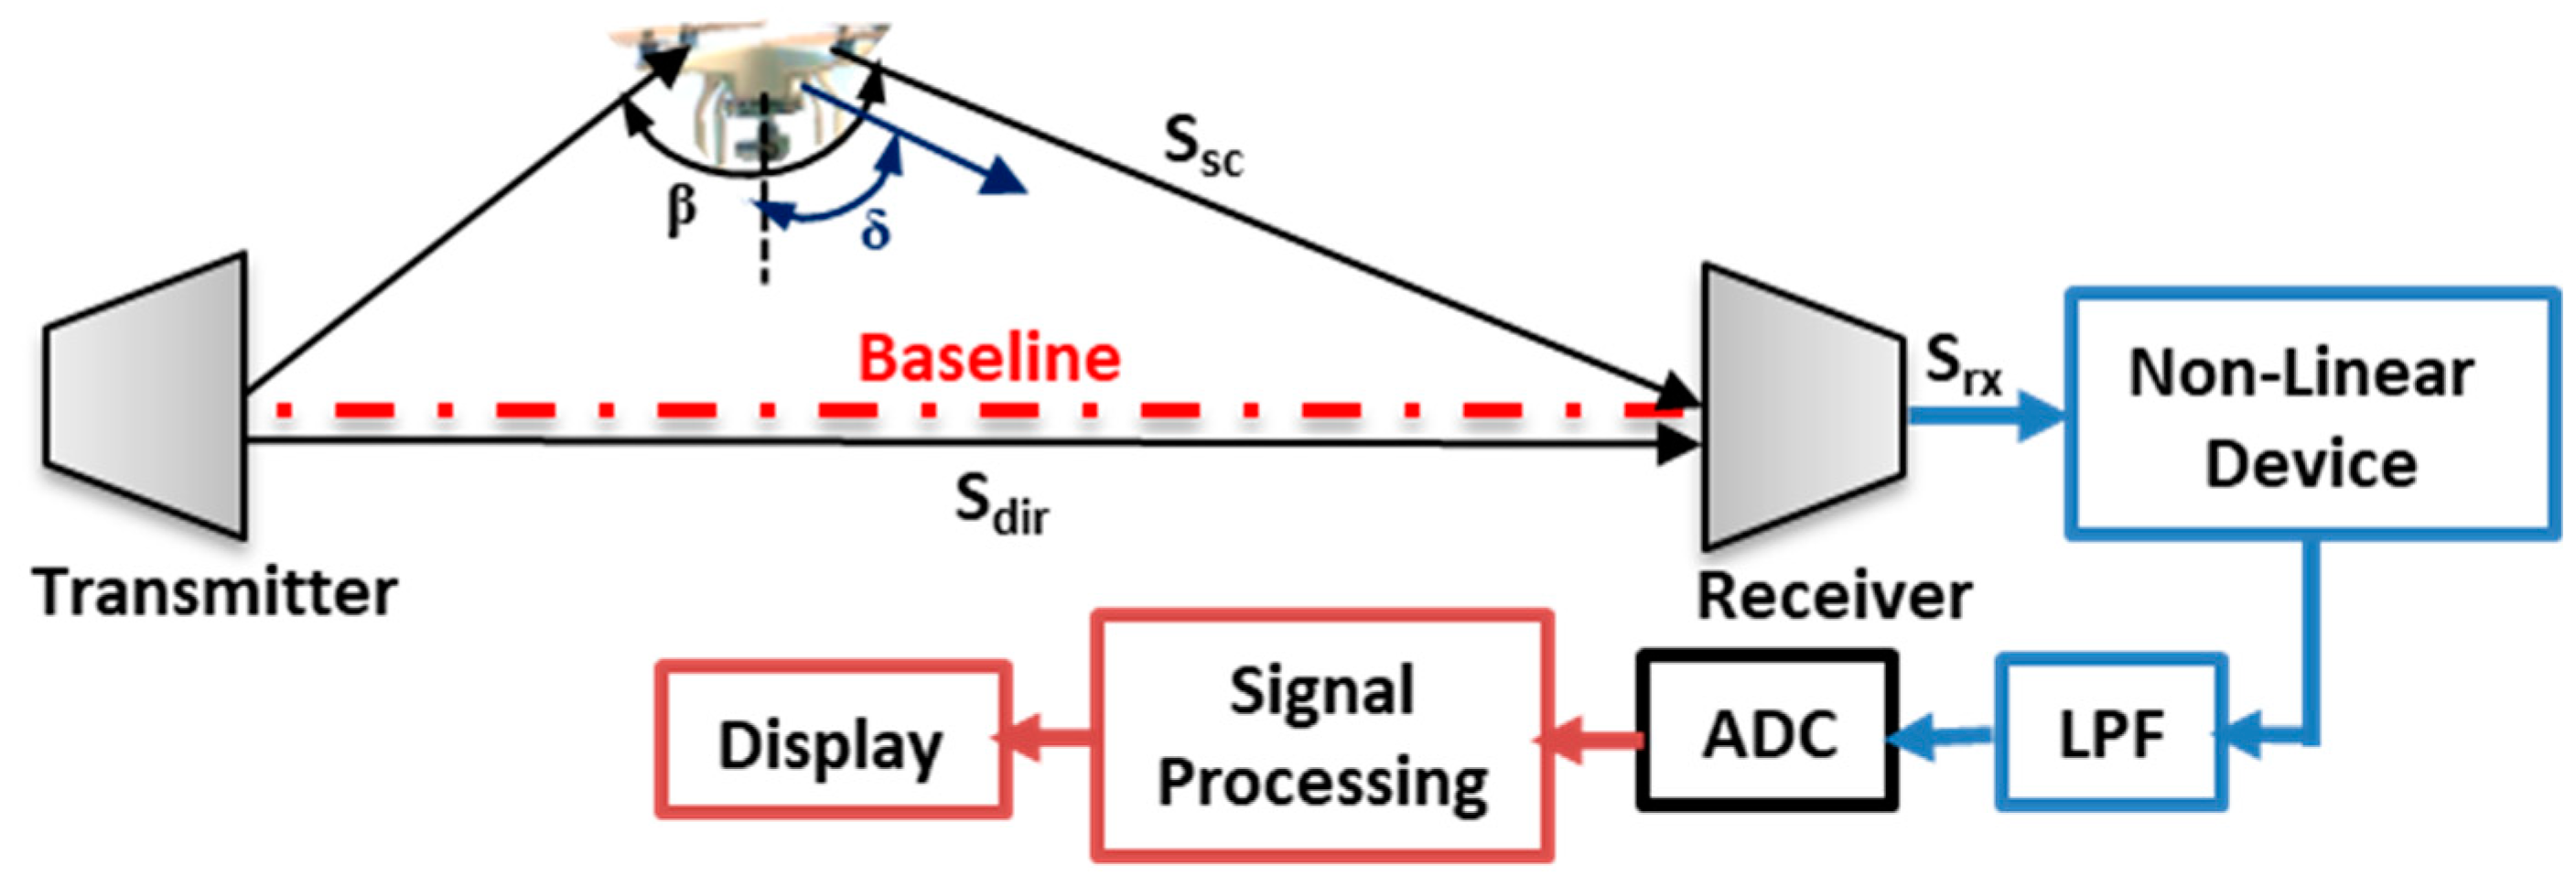
The FSR geometry as presented in
Figure 1, had the target moving toward the baseline. The scattered signal caused an additional modulation due to the rotating blades, thus, forwarded to the receiver as received signal.
From
Figure 1, a combination of both the scattered and the direct signal forms the received signal S
rx = S
dir + S
sc. Assuming the direct signal is given by S
dir = A
dirCos(ω
c)t, and the scattered signal be S
sc = A
scSin(ω
c + ω
sc)t, the received signal, as in [
22], is given by
where ω
c = 2πF
c and ω
sc = 2πF
d. Equation (1) is the representation of the entire signal at the receiver. Within the scattered signal, a Doppler component is present. The received signal passes through a non-linear device and yields a signal with a square law on the output. A filtering process is then applied using a low pass filter (LPF) to filter out the high frequency component from the diode output, leaving only the two spectral components, i.e., the direct leakage signal and the signal containing the Doppler component scattered by the target and a conversion factor due to the type of diode used. The direct signal (leakage) component can be filtered out by using a high pass filter (HPF), leaving the signal with only a Doppler component, thus, ω
sc is the angular frequency combining the Doppler component
fd due to linear motion and the micro-Doppler
fmd due to the blade rotation; thus, ω
sc = 2π
fdt + 2π
fmdt, as described in [
22], and the received signal equation is now:
From [
22], the general Doppler equation for the bistatic arrangement is given by
where V is the radial velocity, β is the Tx-target-Rx bistatic angle, [
] are the coefficient factors due to bistatic geometry, and λ is the wavelength. A detailed derivation of the Doppler equation is also in [
22].
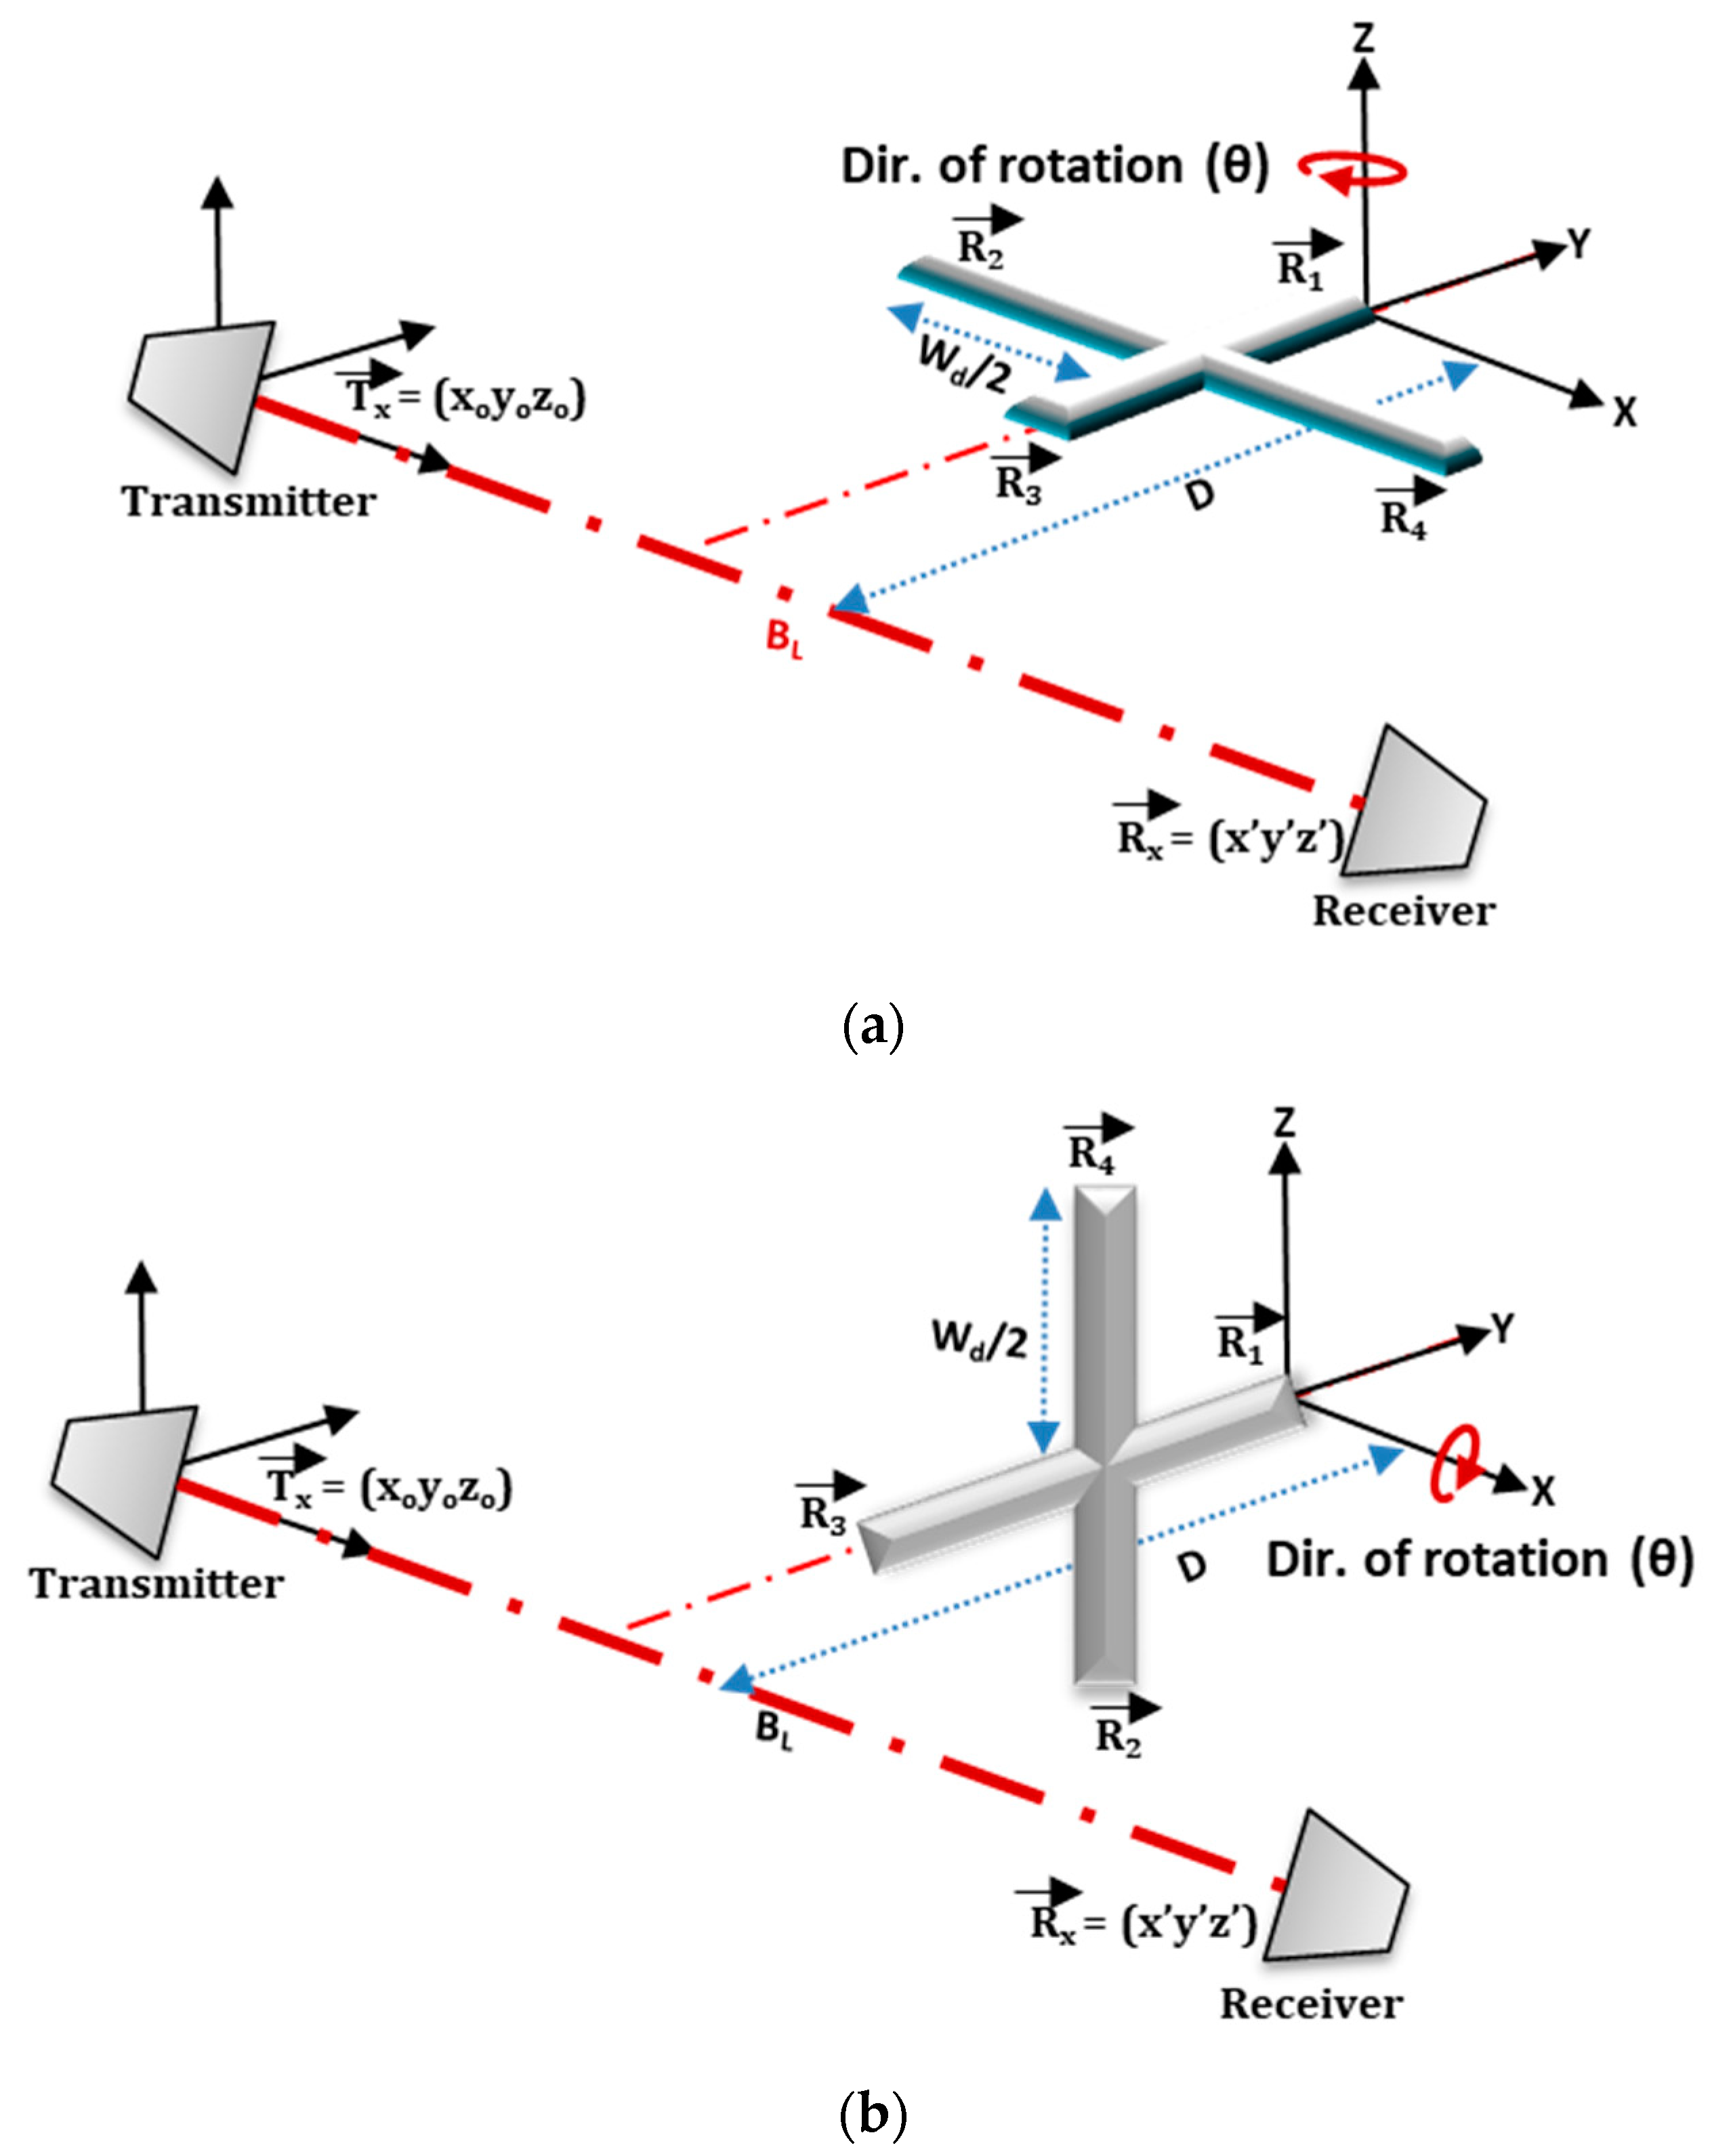
In this paper, an actual quadcopter drone geometry with 4-rotors of 2-rotating blades, maintaining similar dimensions was represented by a crossbar in FSR geometry, as illustrated in
Figure 2. In the geometry, the drone was placed equidistance between the transmitter and the receiver. Two significant scenarios, such as horizontally (Facing-Up) and vertically (Facing-Rx) aligned, 1 m away from the baseline, were modeled. If the T
x is located at the origin of fixed coordinates (X
0, Y
0, Z
0 = 0) and the R
x placed on the same plane of equal height separated by a baseline distance B
L, the corresponding R
x coordinate is given by (B
L, 0, 0). The rotors positions were assumed to be at the tip ends of the crossbar, and the rotor vectors signifying their positions on the (xyz) plane was defined. In the ‘Facing-Rx’ scenario, the blades of all rotors were made to rotate about the
Z-axis, and the
X-axis for ‘Facing-Up’ scenarios, as illustrated in
Figure 2a,b. The corresponding position vectors of all the rotors for each case are described in Equations (4) and (5).
If the rotor vectors are represented by R
na and R
nb, (for n = 1… 4), where n corresponds to the number of rotors, ‘a’ and ‘b’ are the corresponding scenarios for ‘Facing-Up’ and ‘Facing-Rx’, respectively, D is the distance travel, and W
d is the width of the drone, the corresponding rotor vectors are represented by:
From Equations (4) and (5), R
1a represents rotor-1 of
Figure 2a and R
1b refers to rotor-1 of
Figure 2b. Each of this rotor serves as the center of 2-blades upon which the blades rotate. Based on the rotor positions of
Figure 2, a receiver-range geometry of two rotating blades and their corresponding range profiles are presented in
Figure 3. The ranges between the receiver-to-blade-tip are given by R
rx_tip
nm, and the transmitter-blade-tip by R
tx_tip
nm. These make a bistatic angle ‘β
tip’ for each rotor ‘n’ blade ‘m’. Similarly, R
tx_Fixed
n and R
rx_Fixed
n are the corresponding ranges for transmitter-to-rotor fixed position and rotor-to-receiver, with bistatic angle ‘β’. The scattered signal can, therefore, be calculated based on the location and orientation of the blades.
Figure 3 is a zoomed view of only one rotor described in
Figure 2. Each rotor has 2-blades rotating about a fixed rotor point that forms the bistatic angle between the receiver and the transmitter. It describes the Doppler due to the blade-tip and the blade’s range profile referenced to both transmitter and the receiver. The ‘β
tip’ is the bistatic angle formed by the blade-tip while rotating through 0–2π, about a fixed rotor position. The variation of the blade yaw angle is determined by the rotation rate, the blade length L
b, and the initial angle given by ‘θ’. If the blade rotates at a constant rotation rate (Ω) over time (t), a yaw angle is formed (Ωt + θ
o), and, thus, the velocity is caused by the blade tip. The velocity of the blade-tip (V
tip), which is a function of the Doppler generated, is indicated in (6).
where L
b is the blade length, 2π is the conversion rate of radial velocity. The received range reference to the blade tips can be obtained by using (7)
where R
tx_Fixed
n and R
rx_Fixed
n are the corresponding transmitter and receiver ranges for the rotor ‘n’. These ranges are used to obtain the bistatic angle ‘β’ for the target’s radial motion. Similarly, R
rx_tip
nm and R
tx_tip
nm are the corresponding ranges of receiver-to-blade-tip and transmitter-to-blade-tip, for rotor ‘n’, blade ‘m’. These are also used to calculate the bistatic angle ‘β
tip’ made by the blade-tip at each point while rotating. From (2), the total received signal for rotor ‘n’ with ‘N’ maximum number of blades, the sum of the received signal is, therefore, represented as:
Φ
md(t) is the phase modulation generated as a result of a circumferential micromotion of each blade and can be represented as
L
b is the blade length, Ωt and θ
o are the rotation rates of the rotating blade in the rs−1 and initial angle of the blade, respectively. If a rotor has multiple numbers of blades, the rotating scatterers of each blade with different initial angles [
23] can be generated by using θ
n = θ
o + n2π/N, for n = 0, 1, …, N − 1; in our case, the rotor had only 2-blades, therefore, n = 0, 1.
As shown in
Figure 3, the angle ‘θ
o’ was assumed to lie at the origin, and this made the initial angle ‘θ
o’ to be zero [
18], leaving only the blade rotation rate Ωt. We used the Bessel function of the first kind to obtain the micro-Doppler frequency of each blade. This was achieved by differentiating Equation (9) for time ‘t’ [
24,
25].
where V
tip is the velocity of the blade tip. If 2π is the conversion rate of the angular speed Ω
t, L
b is the blade’s length, then V
btip = 2π ∗ L
b ∗ Ω
t. The maximum micro-Doppler is now represented as
The total signal received for ‘N’ number of blades can, therefore, be represented as
If the received amplitude A
rx(n) is represented as A
r ∗ A
e(n), then the total received signal is
In summary, the received signal of each of the four rotors can be treated independently based on their geometrical positions.
Based on the described geometry of
Figure 2 and
Figure 3, Equation (12) was used to generate the Doppler due to blade rotation with ‘V
tip’ as velocity due to blade rotation. The bistatic angle made by the blade-tip ‘β
tip’ was used in the Doppler equation; hence, the Doppler equation was
. A rotating speed of 36 r/s, three (3) continuous wave (CW) frequencies, i.e., 3 GHz S-band (for air traffic control), 5 GHz C-band (for weather radars), in addition to 7 GHz, were used to demonstrate the simulated micro-Doppler of the rotating blades. Each frequency used satisfied the equation 2πƖ/λ >10 in a way that the target dimension was electrically large when compared with the wavelength [
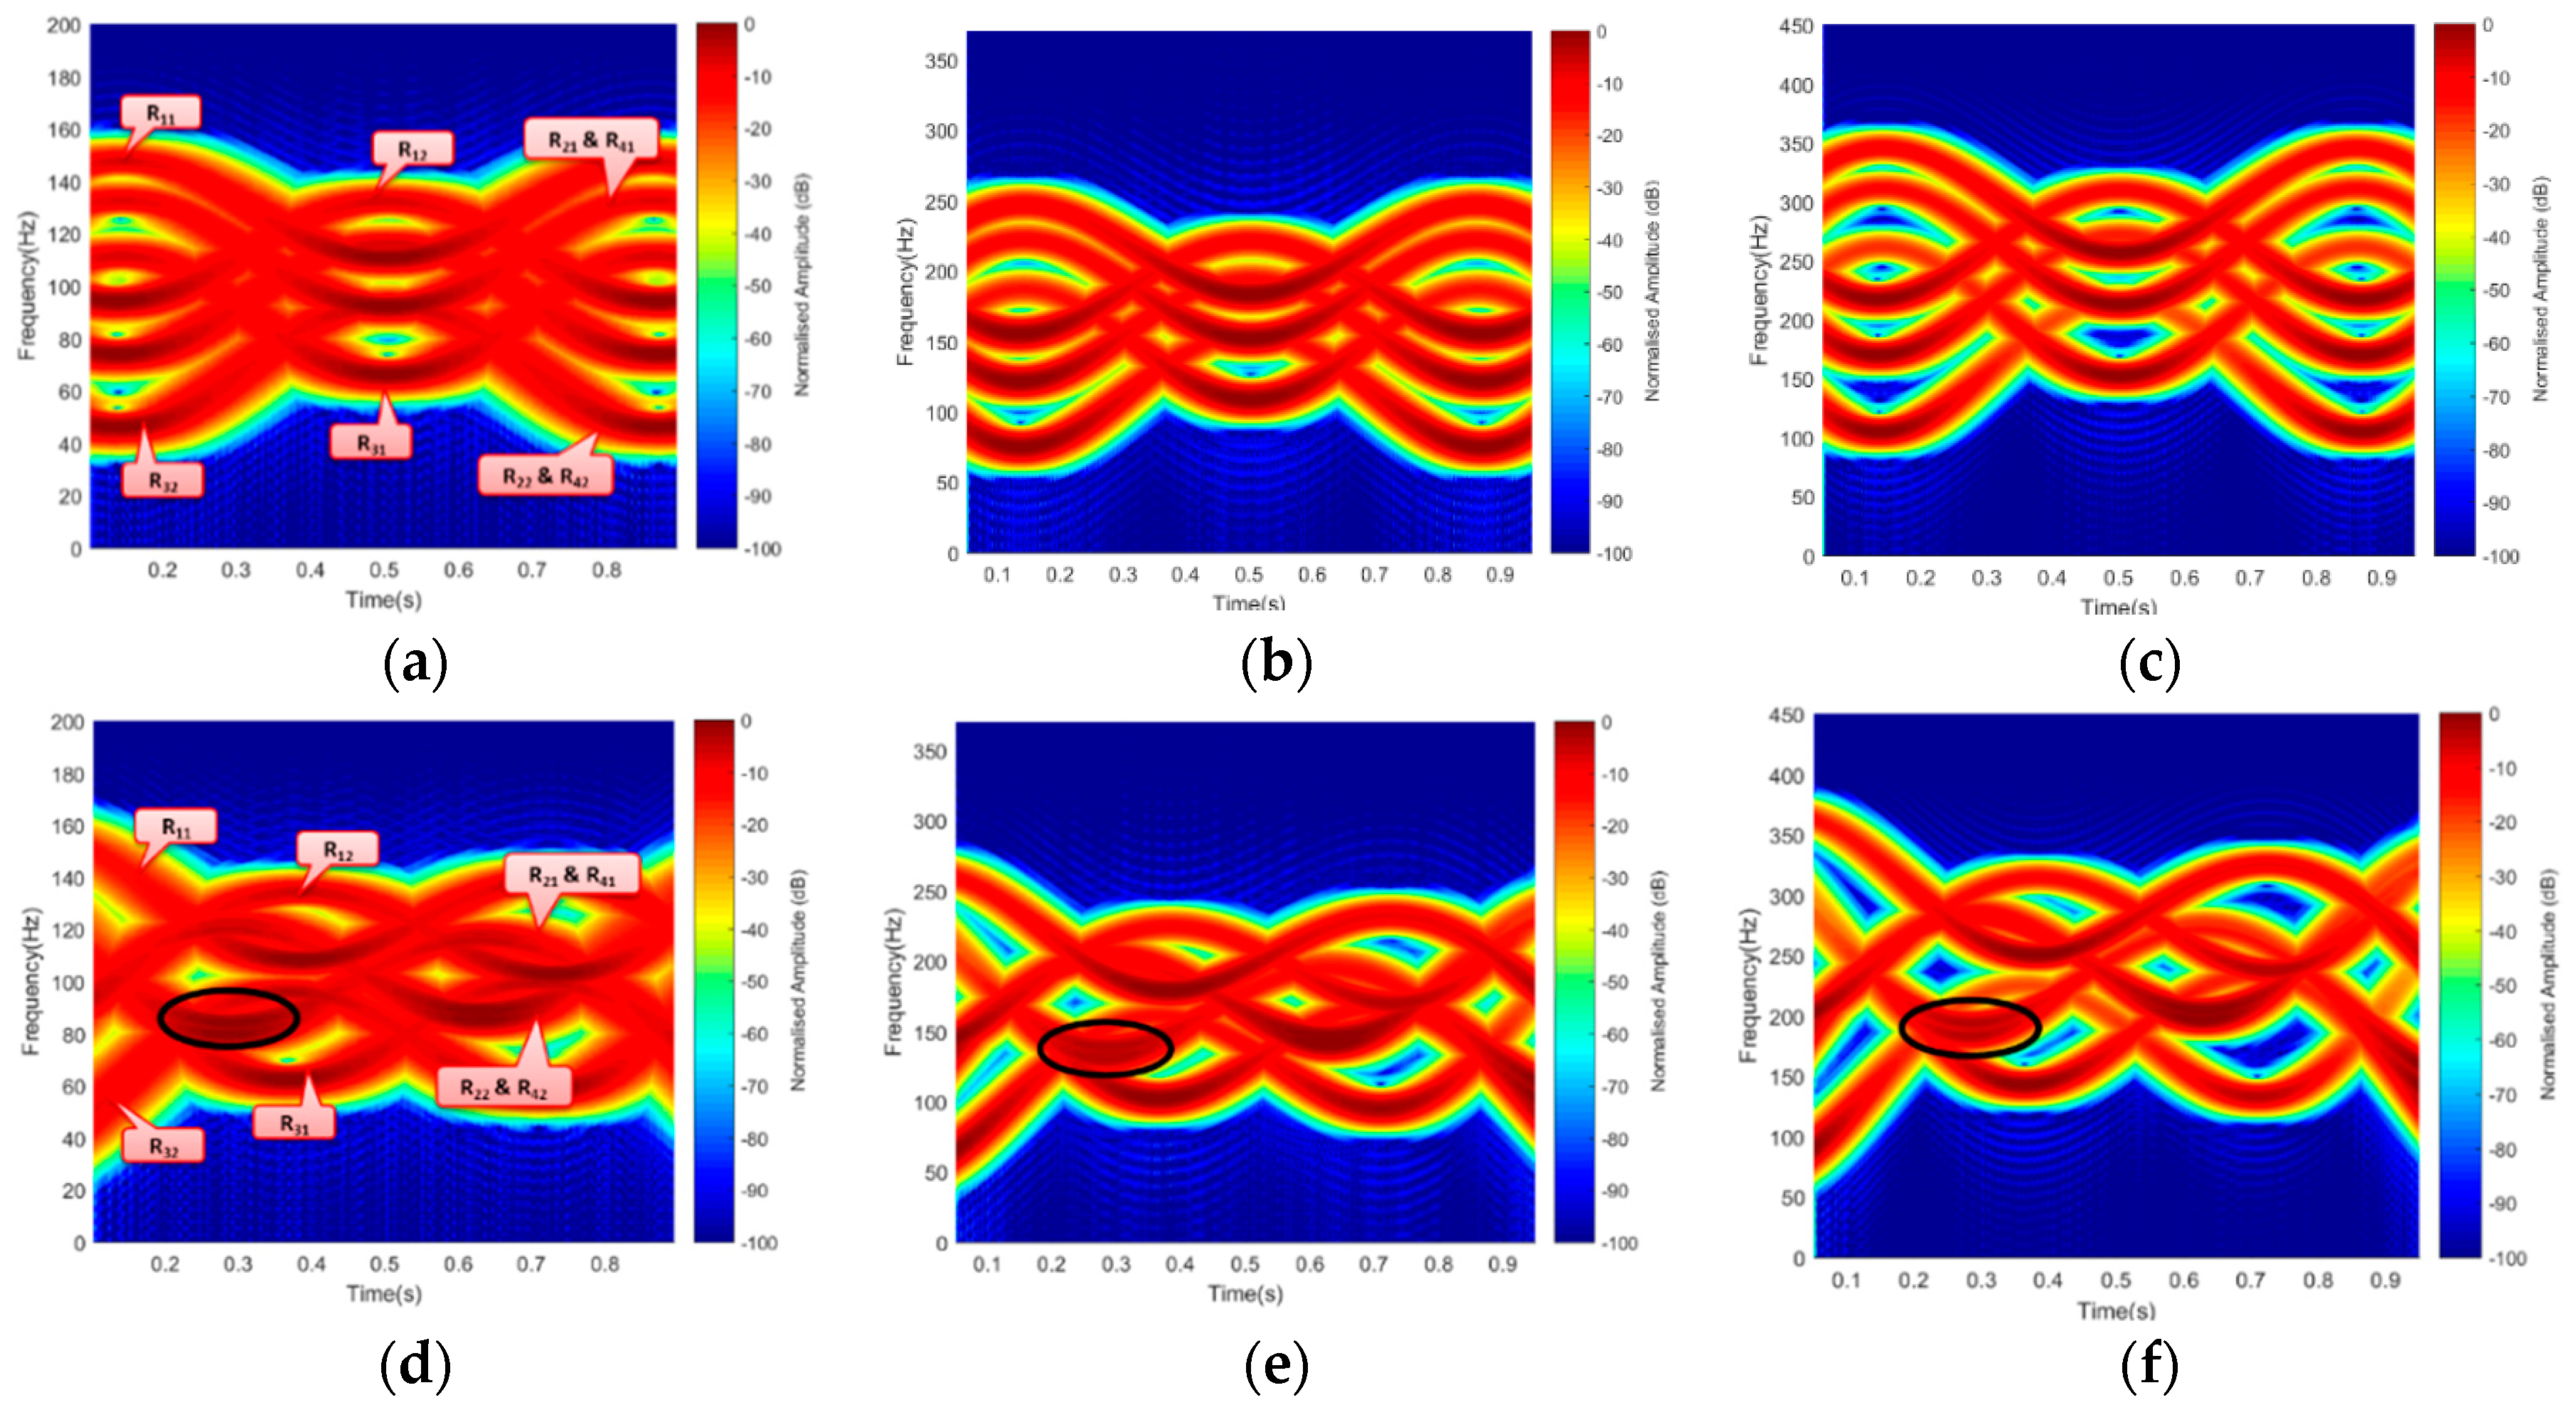
26], where ‘Ɩ’ is the target radius. These frequencies were also used during the experimental micro-Doppler analysis. The corresponding short-time Fourier transform (STFT) signature representation is illustrated in
Figure 4.
Figure 4a–c resulted from Facing-Rx geometry of
Figure 2b, while
Figure 4c,d is the signature due to Facing-Up scenario of
Figure 2a.
A micro-Doppler due to the rotation of each blade-tip, while the rotor was in ‘On’ position, for an observation time of 1 s, is presented in
Figure 4, with both blades preceding one another. The signal response of each blade was generated independently, based on the geometrical position to their corresponding rotor position. The signature of each blade was represented as R
11, R
12, R
31, R
32 with only rotor R
2 and R
4 mapped into one another. It was observed that the Facing-Up scenario yielded better resolution by separating the two mapped rotors R
2 and R
4, as can be seen in
Figure 4d–e. Result in
Figure 4 shows the resolution improved by increasing the operating frequency. This is because micro-Doppler is proportional to the operating frequency. This revealed how smaller wavelength is expected to yield a better Doppler resolution during the experimental work. Based on the simulated results, the signatures due to rotating blades corresponds to the findings in [
17,
19]. The observation angle played a vital role in the Doppler and range resolutions, as can be seen between ‘Facing-Up’ and ‘Facing-Rx’ blade orientation. In the ‘Facing-Up’ scenario of
Figure 4d–f, the overlapping rotors R
2 and R
4 can be seen, unlike the ‘Facing-Rx’ case.
4. Experimental Results
In this study,
Section 4.1 and
Section 4.2 focus on the “micro-Doppler” components due to the rotating blades and are compared with the simulation. The experiment in
Section 4.3 considered both the main Doppler due to drone linear motion and the micro-Doppler due to the blade micro motions. The experiment is more practical due to the baseline range, location of the transmitter, and antenna specifications. For
Section 4.1 and
Section 4.2, the experiment used “horn antenna” at both transmitting and receiving end, while in
Section 4.3, the 11 GHz experimental setup involved a horn antenna transmitter and a parabolic dish receiver. In
Section 4.3, we considered using 11 GHz due to the following reasons:
- (a)
To have a more meaningful and practical FSR system, future work will involve passive system by using illuminator of opportunity. For drone detection using FSR geometry, the best illuminator is using a satellite signal; thus, the proposed 11 GHz in our study could resemble satellite signal working at K/Ka/Ku band.
- (b)
Based on the satellite signal as mentioned in (a), the system needs to use a dish antenna for acceptable Signal to Noise (SNR). Thus, practically using lower frequency will make the dish antenna bigger, so at 11 GHz, the antenna size is reasonable.
- (c)
To verify the performance of our developed receiving system that only operates within Ku-band frequencies, in the detection of a real commercial drone.
The experiment aimed at detecting and extracting the micro-Doppler of rotating blades. The blade is 0.12 m length, which made to rotate at an approximate speed of 36 r/s. Firstly, the blades are wrapped with a conducting material (usually aluminum foil) to improve its reflective property, because most drones are made of either plastic material or carbon fiber [
27]. Subsequently, the default blades are used without been wrapped to determine the degree of their detectability as compared to the first case. During the experiment, scenarios involved in both cases include blades Facing-Receiver, Facing-Up, and maneuvered motion. The effect of look angles of the drone blade on the rotating blade while detection in addition to wavelength selection was also considered. This paper compared the simulated and the experimental signature for 3 GHz operating frequency, as illustrated in
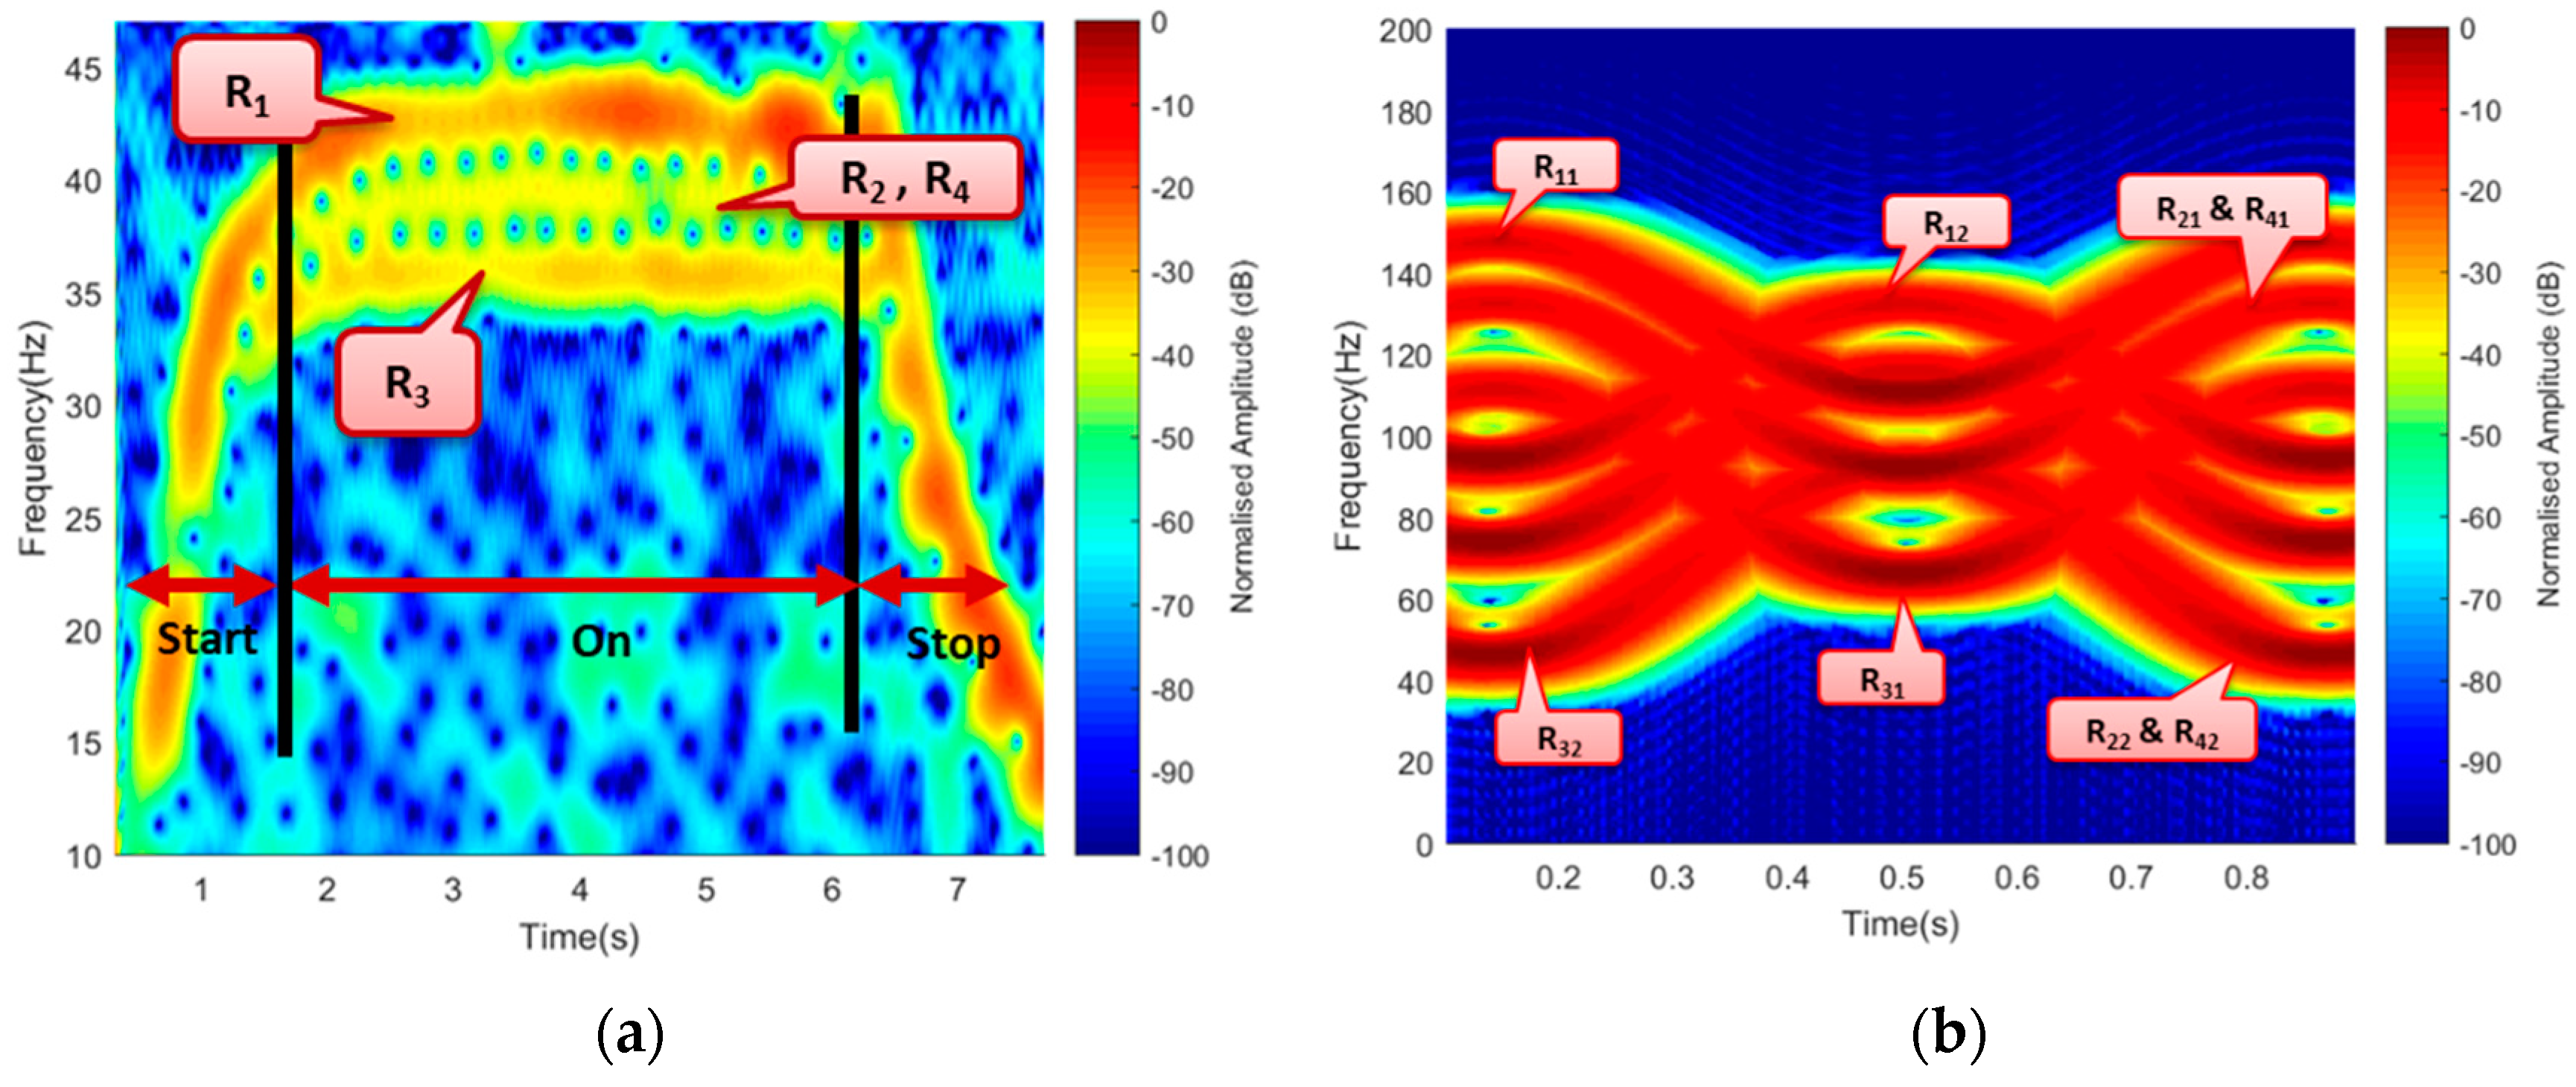
Figure 7.
Figure 7 is the STFT representation of the experimental micro-Doppler in
Figure 7a and the simulated in
Figure 7b. The experimental result comprised of the three-state transition of the blade, i.e., ‘Start’, ‘On’, and ‘Stop’. A three-bar signature represented the ‘On’ state of the rotating blade. The three separated bars represented the signatures of R
1, R
2–R
4 (R
2 and R
4 mapped on one another), and R
3, respectively. The ‘start’ and ‘stop’ states represented the blade’s transition when switched ‘On’ and ‘Off’, respectively. In both cases, blade-1 and blade-2 mapped together. Similarly, the simulation represented only the ‘On’ position of the rotating blade and had R
11, R
12, R
31, R
32, represented with R
2 and R
4 mapped together, as described earlier. Besides, unlike the experimental signature that represented the signature of the entire blade length, the simulated signature only represented the blade-tips. The variation in the Doppler value resulted due to multiple factors, such as the difference in obtaining the exact value of the theoretical parameters like the bistatic angle, aspect angle, blade rotation rate, etc., and the signal degradation due to other external factors.
4.1. Rotating Blades Outdoor
An outdoor experiment was conducted to ascertain the detectability of the drone rotating blades. It further verified the look angle effects and the effects due to the maneuvered motion of the drone. To achieve these, we used 3 GHz frequency for both Facing-Receiver and Facing-Up scenarios for illustration purposes. This was based on the observed similarity in the signature for all the three operating frequencies earlier used. Subsequently, the experimental setup, shown in
Figure 8, was not to scale but rather for illustration purposes to provide insightful information on how the experiment was conducted.
4.1.1. Blade Detection
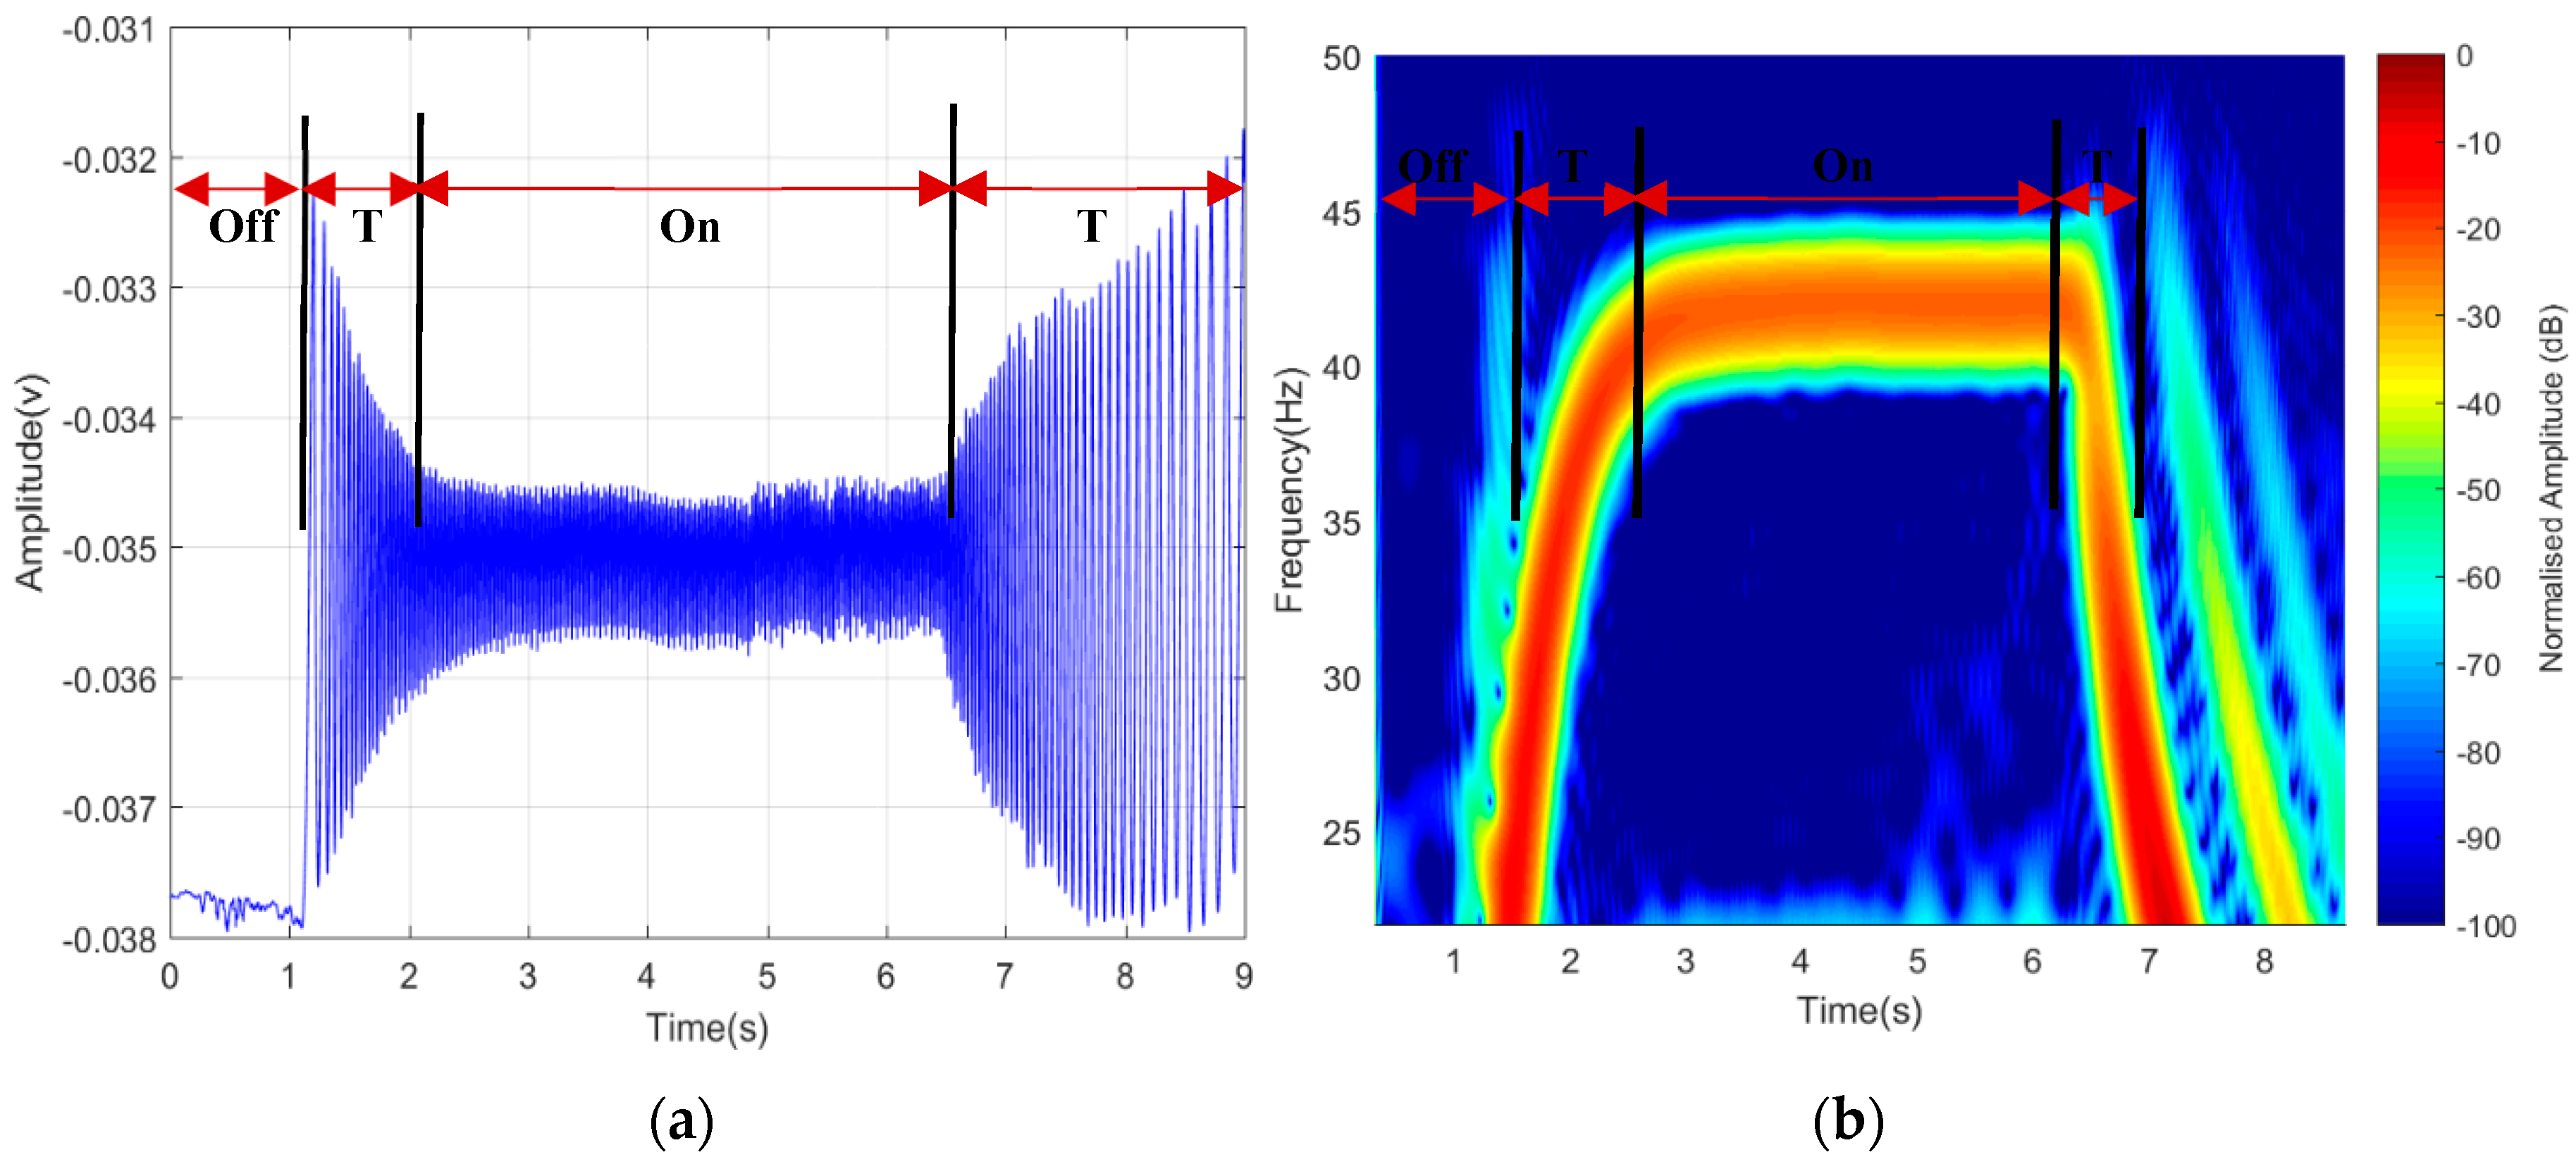
Total observation time of 15 s was used to verify the detectability of the rotating blade, which was considered enough to record the three-states transition of the blades, i.e., Off-On-Off. The blade was initially in ‘Off’ position, then switched ‘On’ and then ‘Off’ again for 5 s each. Between each ‘On’ and ‘Off’ positions, a transition time was observed with a projected rise due to starting torque from ‘steady’ state to ‘rotation’ state, as seen in
Figure 9. A similar occurrence happened when the rotors slowed down to steady state after it was turned ‘Off’. Both time domain and the STFT represented only 9 s because the transition time of “2 s” out of “5 s” for both start and stop were captured, while the remaining “5 s” was for “On” state. Despite the weather and other effects, such as ground reflection, clutter, and volume scattering, the detected signature was considered a success; hence, ascertained our prior claims and assumption in the designed theoretical model.
4.1.2. Aspects of Angle Effect
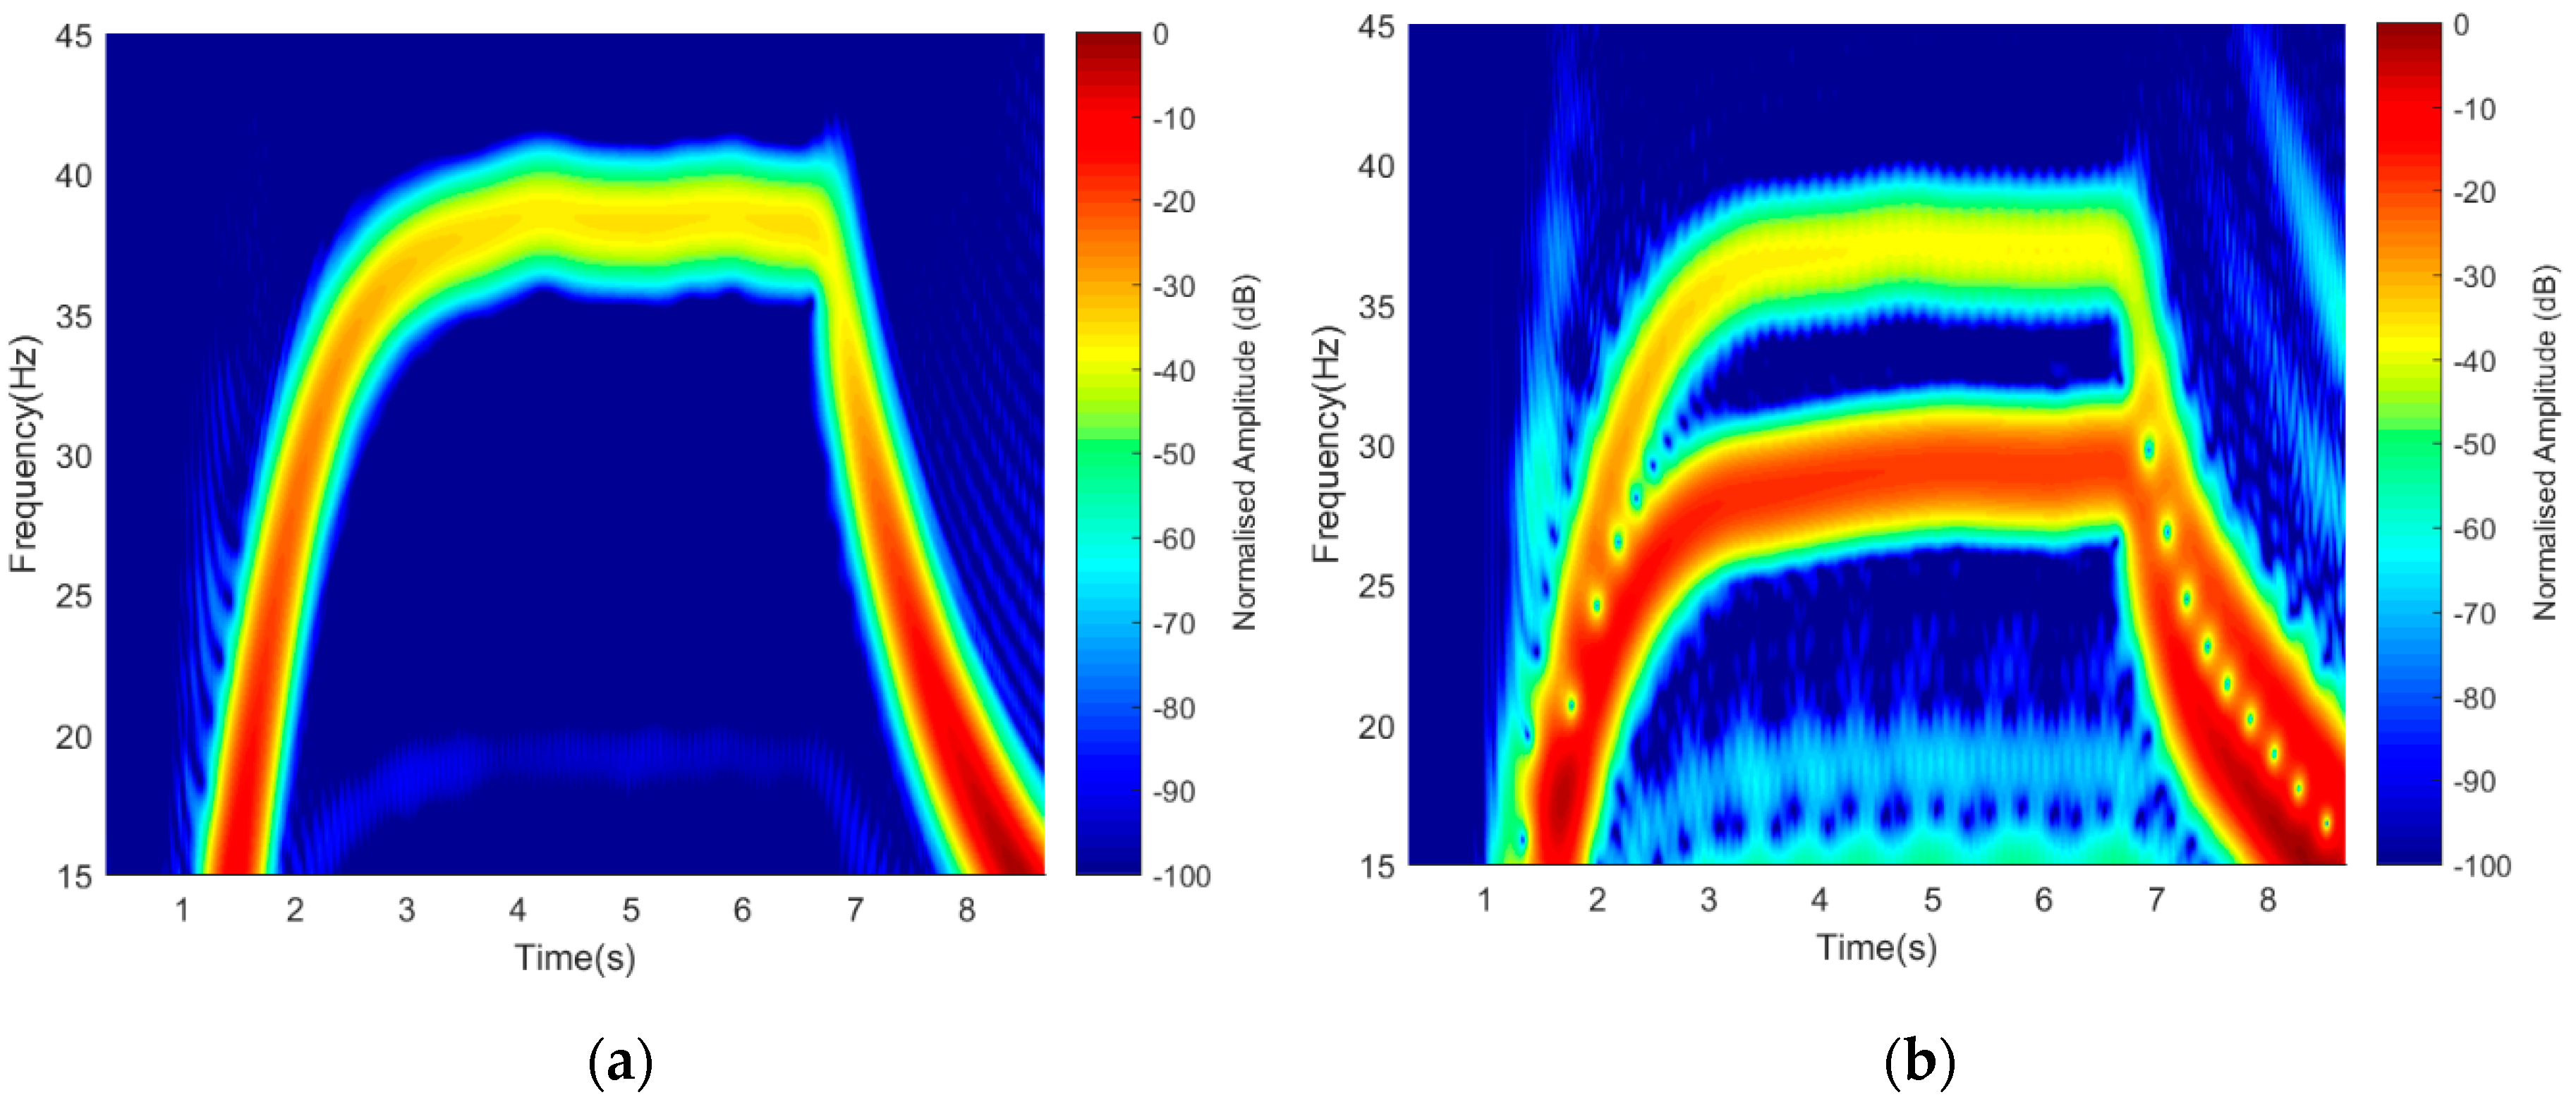
The effect of aspect angle due to blades orientation was verified by using the two scenarios, i.e., the blades ‘Facing-Rx’ and the blades ‘Facing-Up’ orientations, as described in
Figure 5. This was described by using 1-rotor, 2-blades and 2-rotors, 2-blades to display Doppler resolutions. Maintaining similar operating frequency of 3 GHz, the detected signatures are illustrated in
Figure 10.
A short-time Fourier transform (STFT) signature representation of 1-rotor, 2-blades and 2-rotors, 2-blades, with the rotating blades facing the receiver is shown in
Figure 10a,b. Similarly, with the rotating blades Facing-Up, their signatures can also be seen in
Figure 10c,d. Two bars represented the 2-rotors signature (R
1 and R
3) during ‘On’ position, with blade 1 and 2 mapped on one another. It was observed that the ‘Facing-Rx’ orientation had higher power intensity as compared to the ‘Facing-Up’ scenario. In both cases, good Doppler resolutions were observed as both rotors signature were seen.
4.1.3. Maneuvering Effects
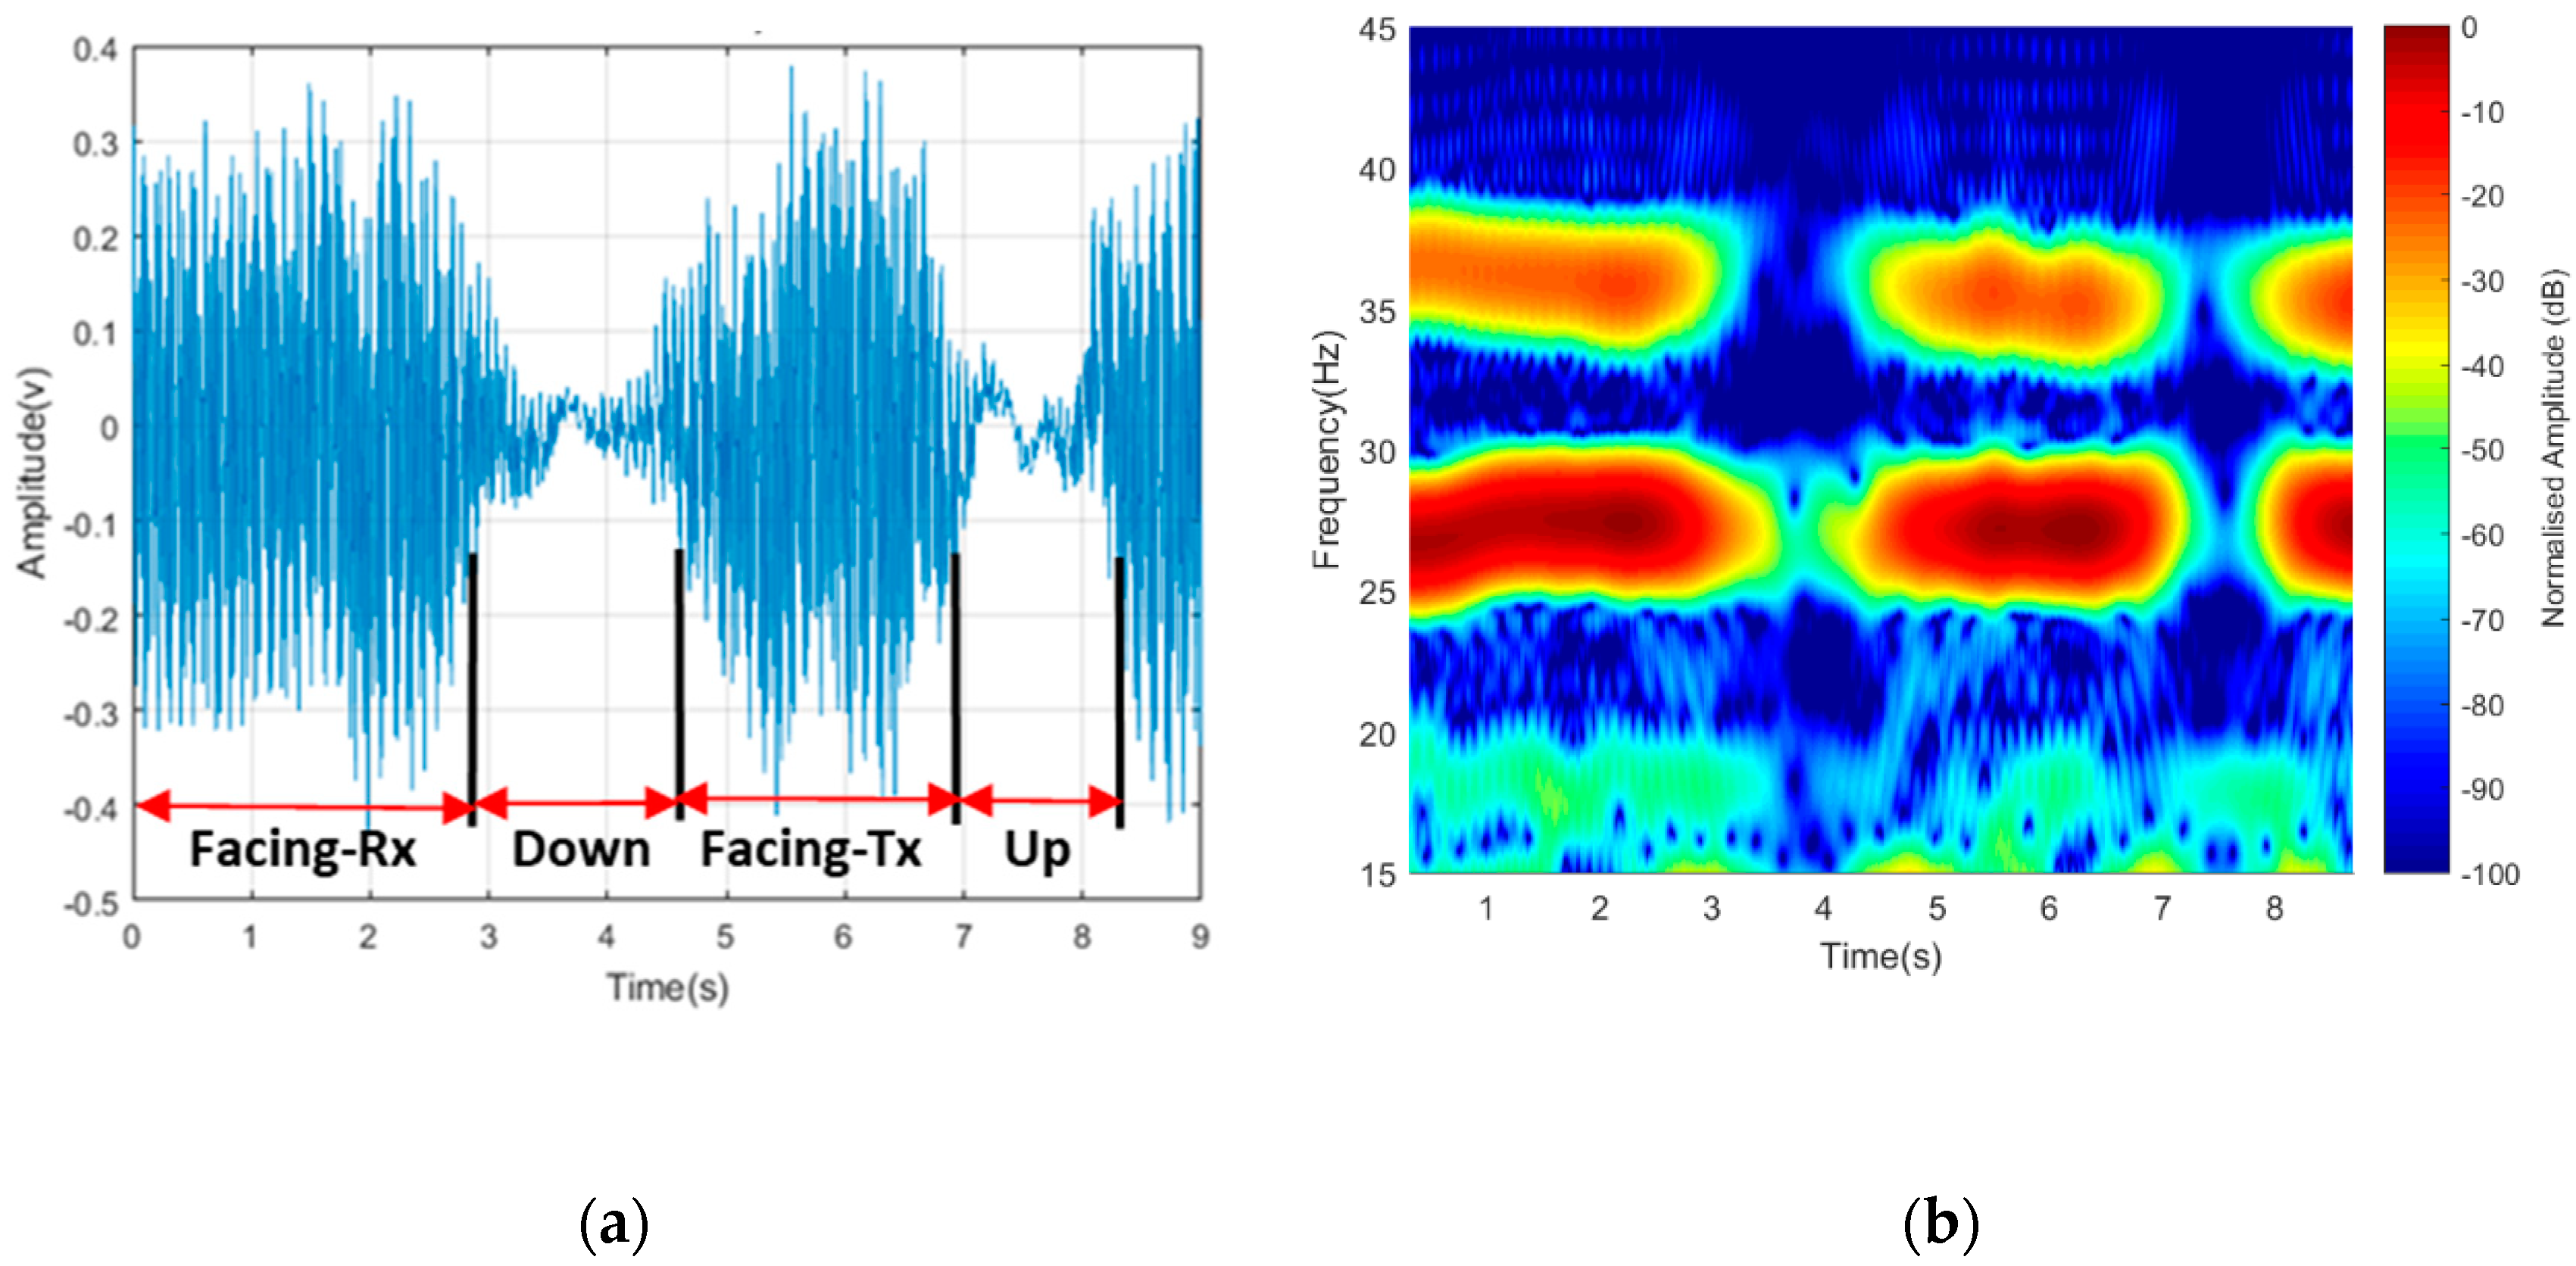
Based on the drone operational behavior, we considered the blade signature due to maneuvering motion. At first, the blade was made to be in ‘On’ state facing the receiver with blades rotating at an approximate speed of 36 r/s with 3 GHz operating frequency. The entire 4-rotors would then be turned slowly about a fixed position in a clockwise direction over a complete circle 0–2π. The observed change in a signature over 360° was observed in both time domain and spectrogram representation, as shown in
Figure 11. The first part of the time domain was when the blade was facing in the direction of the receiver, i.e., perpendicular to the baseline. The blades turned by 90° to face down, then faced the transmitter, and finally faced up. The signal power seemed to always be of higher intensity when facing the receiver or transmitter but degraded when facing up or down. This signature might be of help in recognizing the drone maneuvering motion in the course of actual drone flight operation.
4.2. Anechoic Chamber
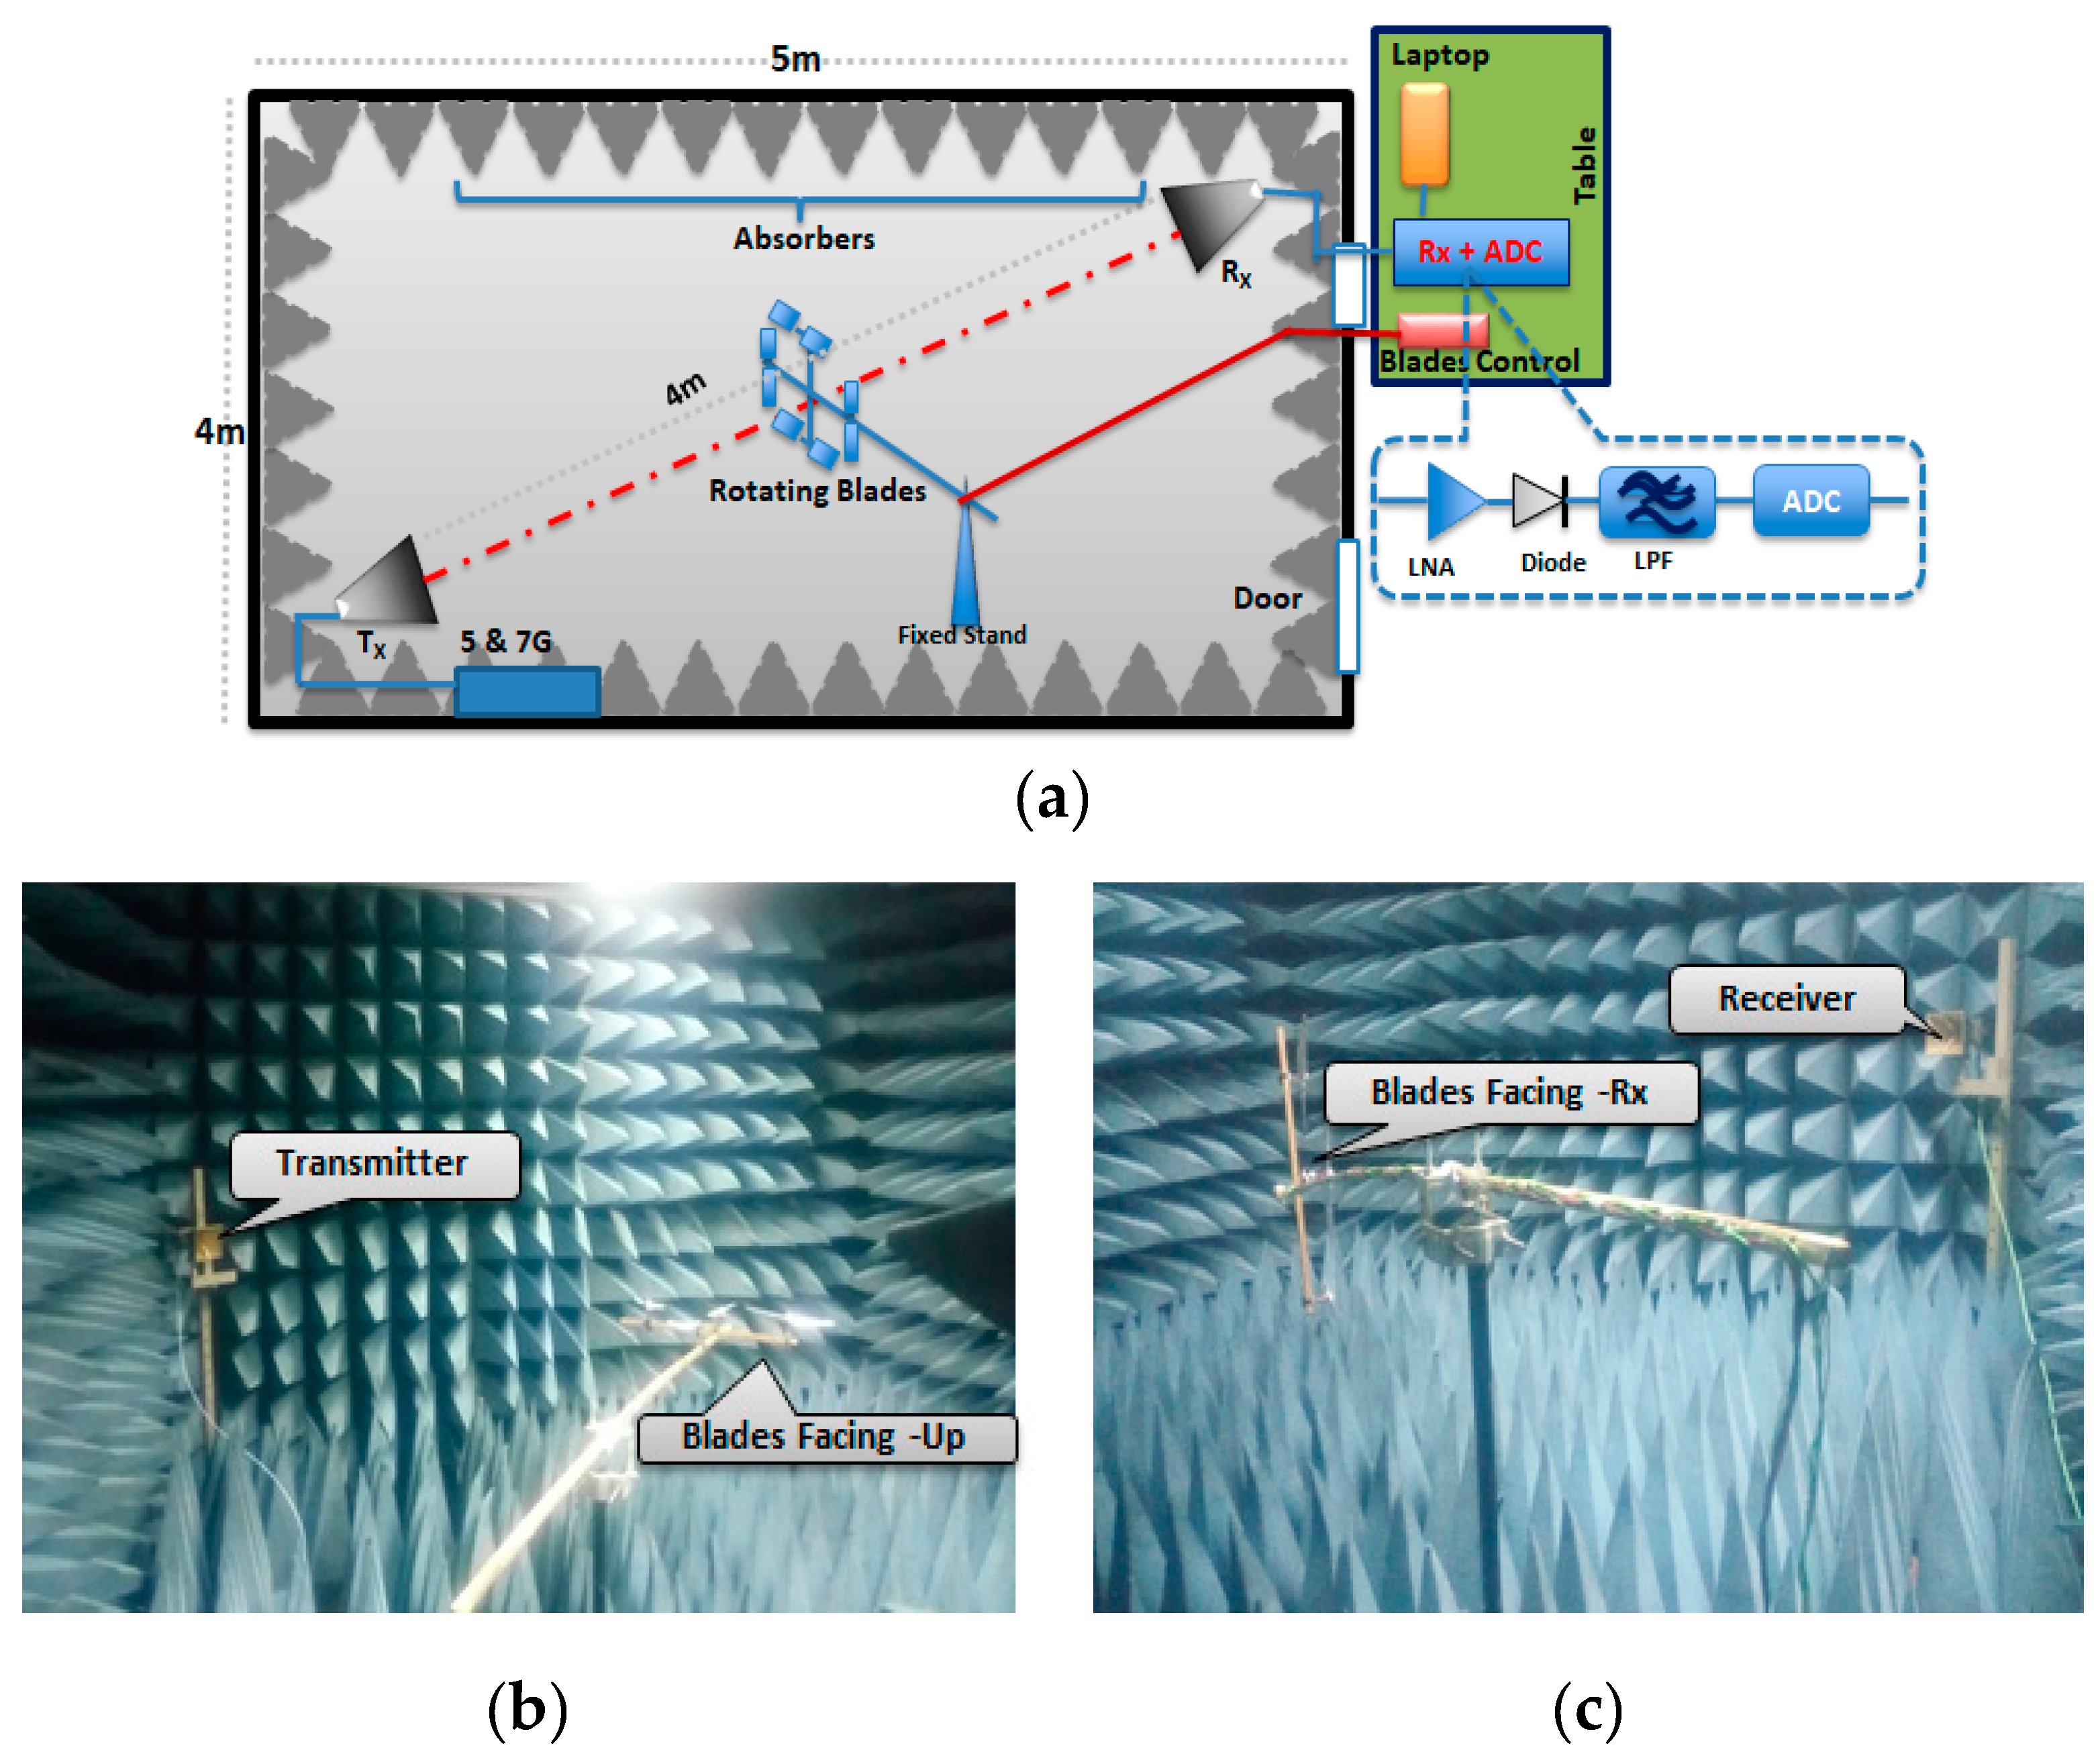
In an attempt to minimize other external factors, a controlled environment was used to further confirm the system capability. This experiment was conducted in an anechoic chamber and focused on the feasibility of detecting a default, unwrapped plastic material blade, maintaining the same geometry. Two frequencies (5 and 7 GHz) were used in the micro-Doppler analysis for the experiment in the anechoic chamber. Based on the simulation result, only two higher frequencies were selected because this experiment aimed to validate the theoretical model.
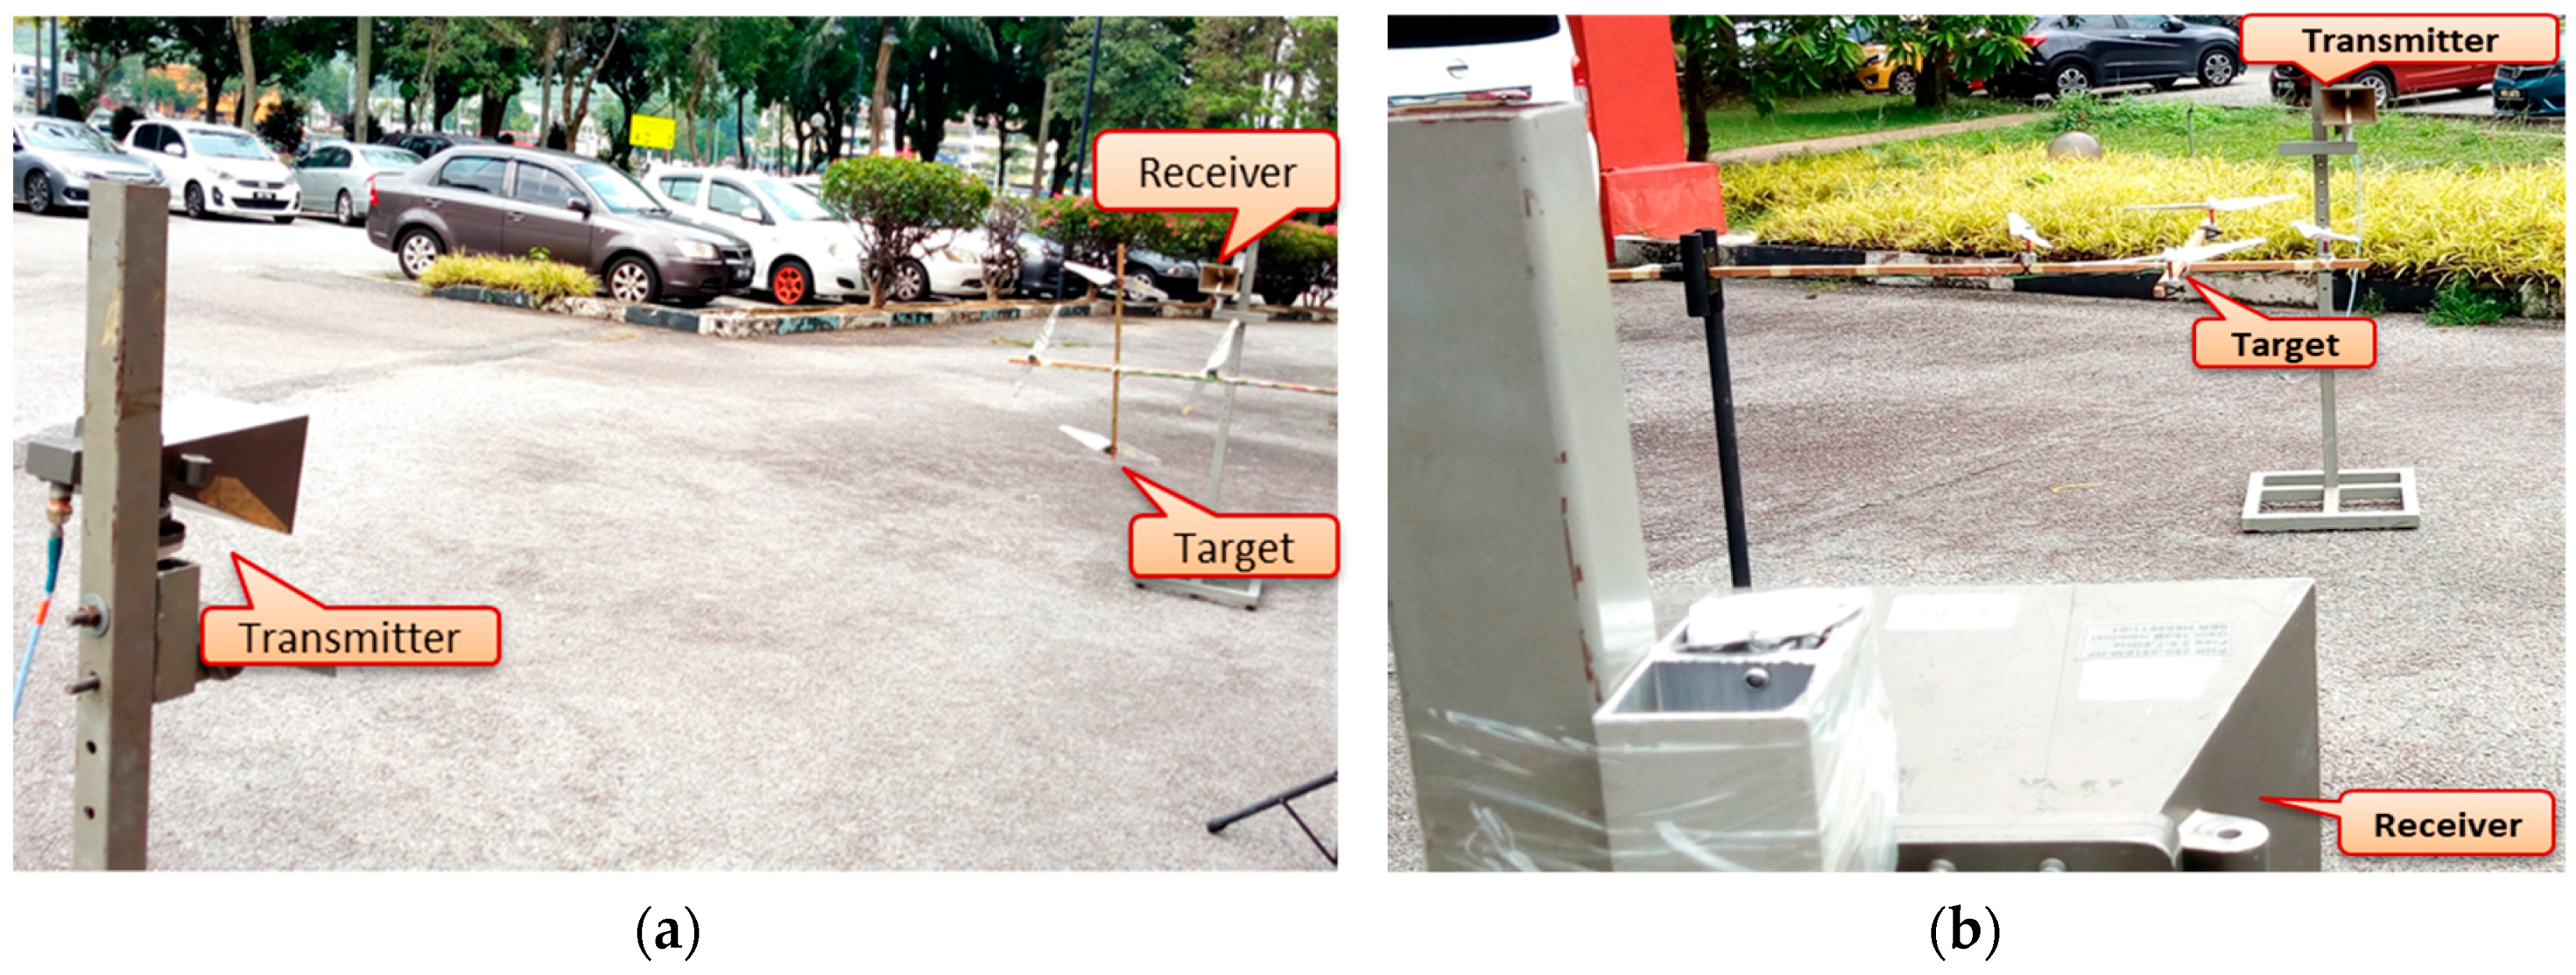
Figure 12 illustrates the experimental setup in an anechoic chamber, showing the Tx-to-Target and Target-to-Rx geometry. Following similar scenarios, the blades were placed at the center of the baseline, with ‘Facing-Up’ and ‘Facing-Rx’ scenarios, respectively. At first, the detection was conducted with blade wrapped with aluminum foil and later repeated with the default blade without foil.
4.2.1. Doppler Separation between Rotors
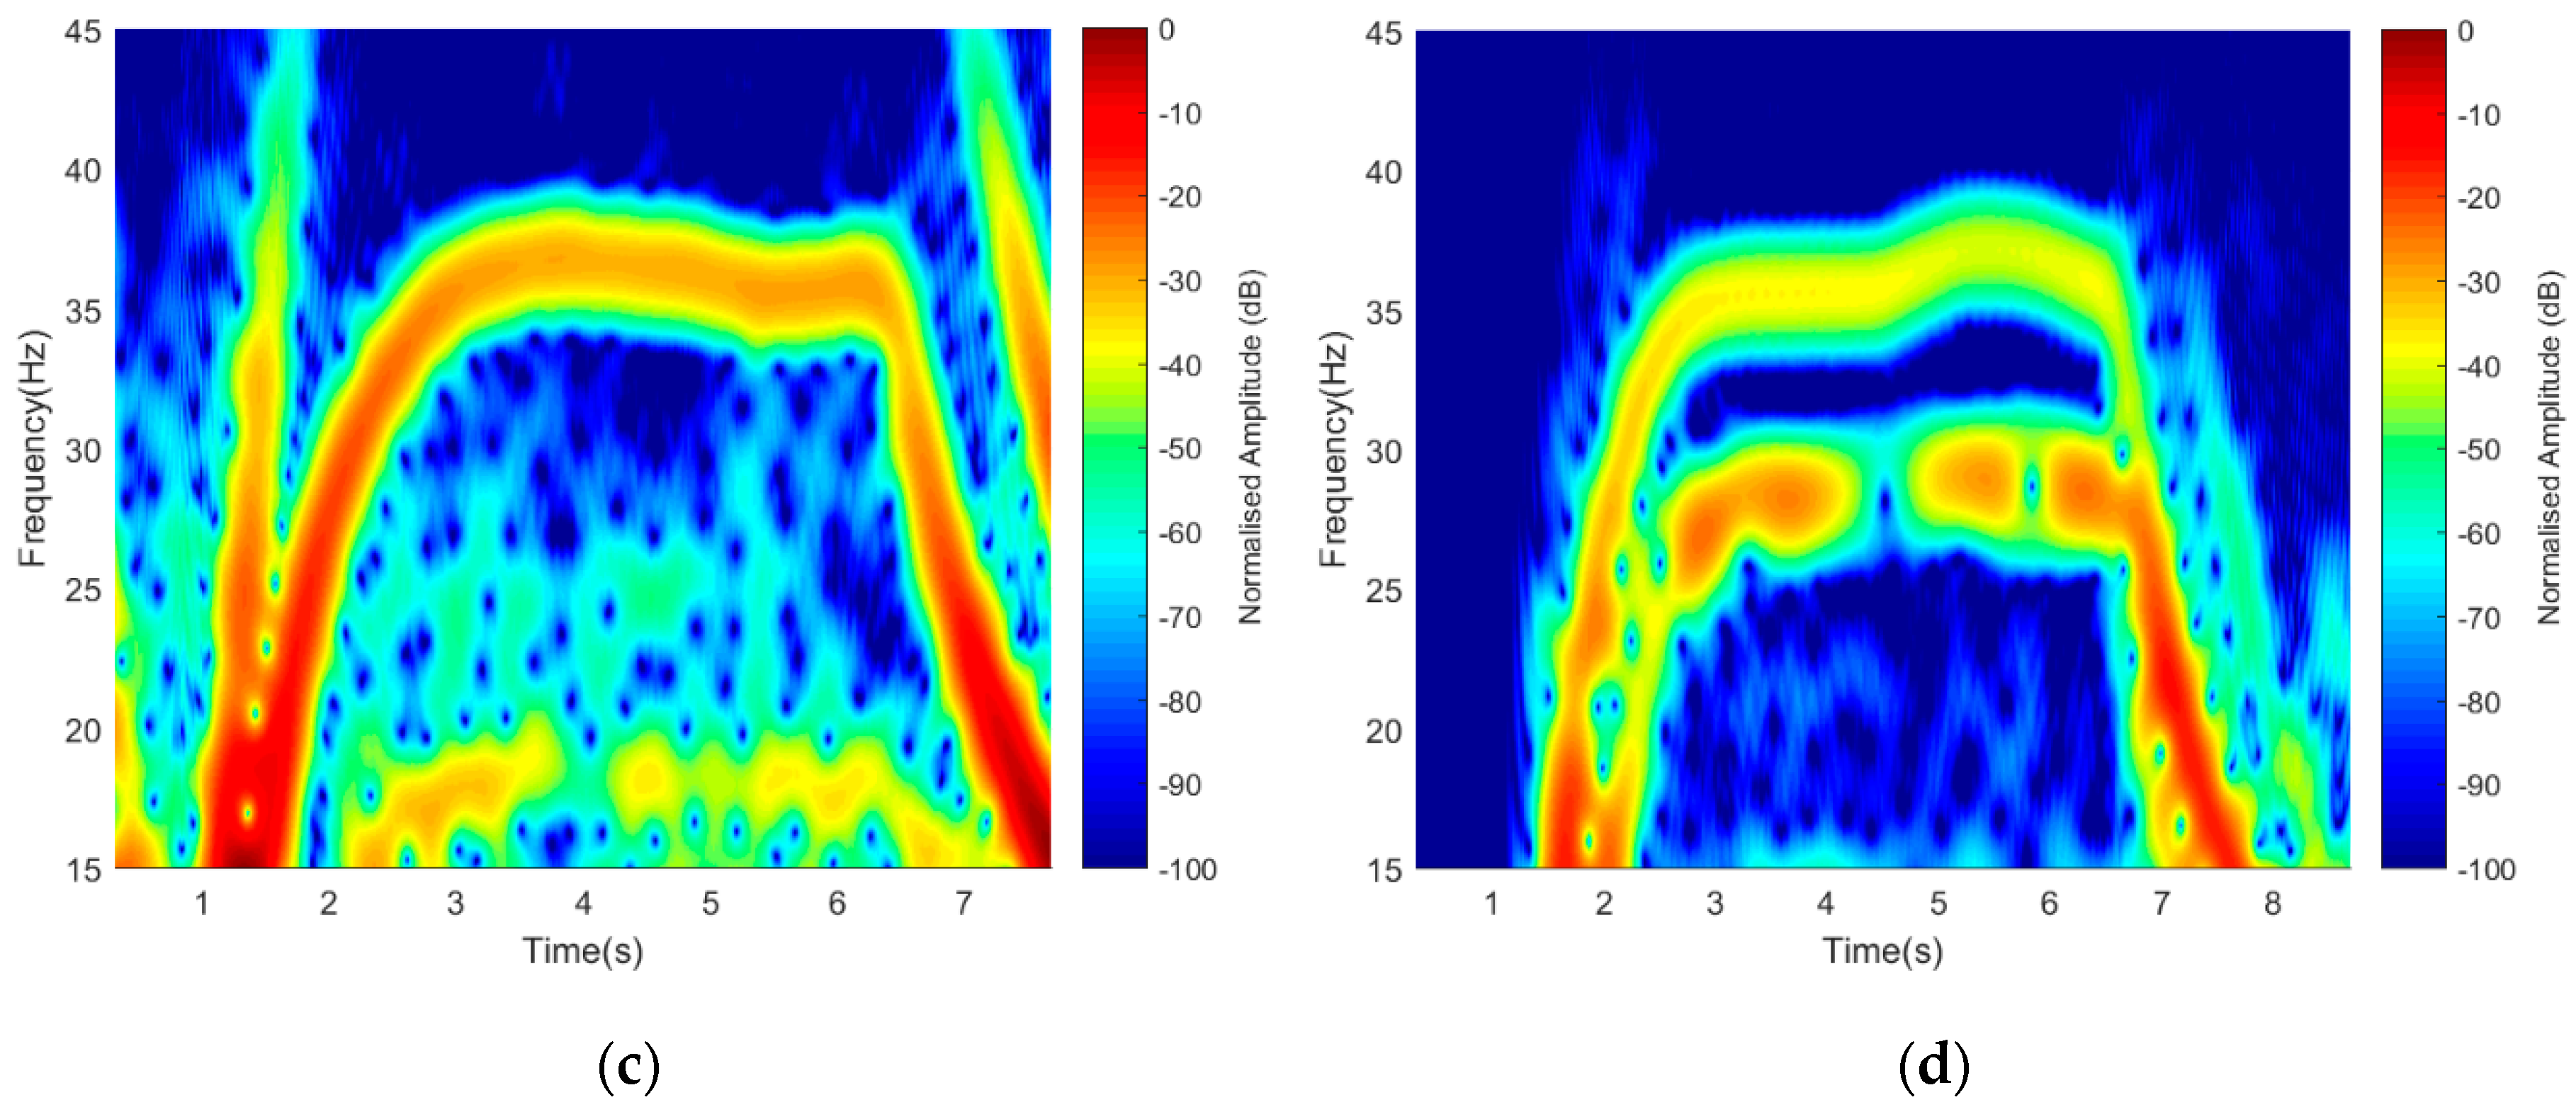
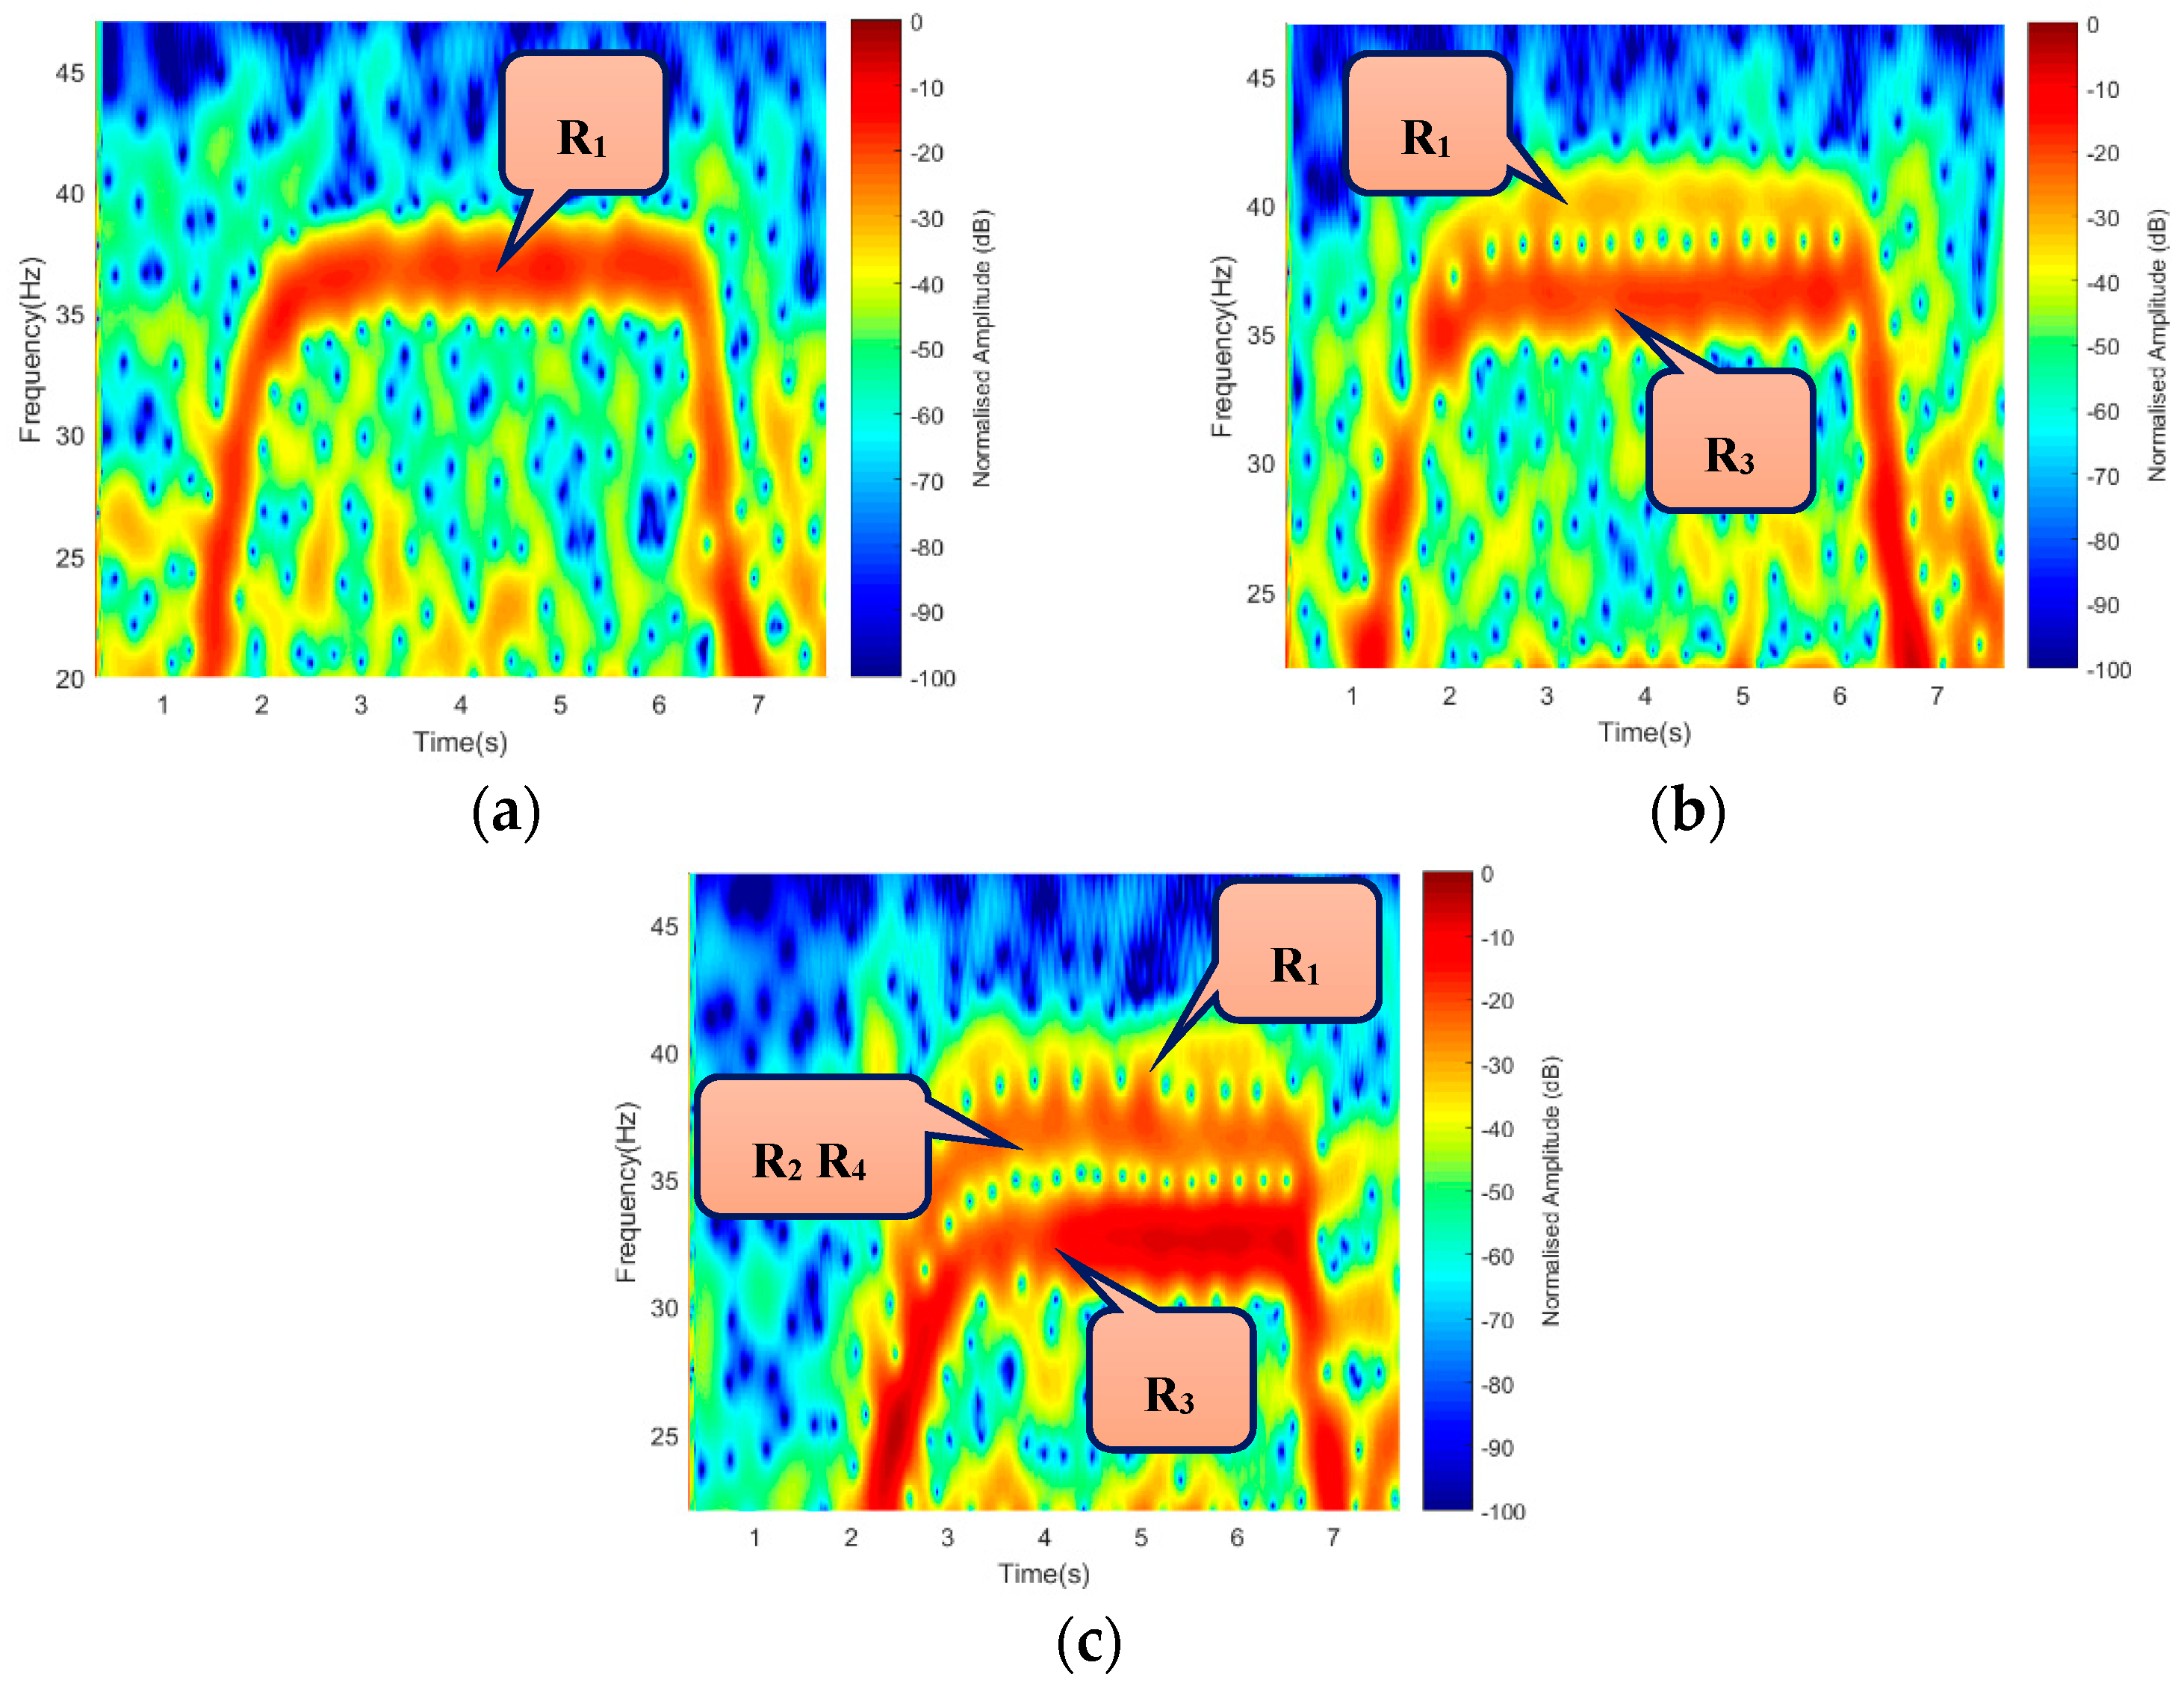
An essential component of this work is the detection of a drone through its blade generated micro-Doppler. It is, therefore, of great importance to have an outstanding Doppler resolution that can separate signatures based on the number of rotors used. To achieve this, we considered using 1-rotor, 2-rotors, and 4-rotors, respectively, with 5 GHz operating frequency. This may indeed help in identifying a drone from a flapping bird’s wing during classification. Similarly, a 15 s integration time with three-states Off-On-Off transitions was observed. The recording started while rotors were in ‘Off’ position for 5 s, then switched ‘On’ for another 5 s. The ‘Transition’ time between ‘Off’ and ‘On’ was represented by the projected rise in the signature due to the starting torque from ‘Off’ to ‘On’ position. Based on the number of the rotors used during ‘On’ state,
Figure 13 shows a 1-bar for 1-rotor, 2-bars for 2-rotors, and 3-bars for 4-rotors, respectively, manifesting that the Doppler resolution over a reasonable distance was achieved. As always the case, the middle bar of
Figure 13c represents rotor R
2 and R
4 as their symmetrical positions make them mapped onto one another.
4.2.2. Plastic Blade Detection
Based on the facts that the default drone blades are either a plastic (usually transparent) or carbon composite material and considering their poor reflective characteristics with conventional radars, we aimed at implementing the FSR geometry coupled with performance enhancement of the chamber, to verify the detection possibility of the default plastic blade by using 5 and 7 GHz frequencies for both Facing-Rx and Facing-Up scenario. By using similar operating frequency, 1-rotor, 2-rotors, and 4-rotors were detected, as shown in
Figure 14.
Despite the inverse relation of signal amplitude to the transmitting frequency, the Doppler value improved in the ratio of 10 Hz, as seen in
Figure 13. The detection of default plastic blade could be considered successful, despite the loss in resolution and power intensity degradation when compared to blade wrapped with foil.
4.3. Actual Drone Detection
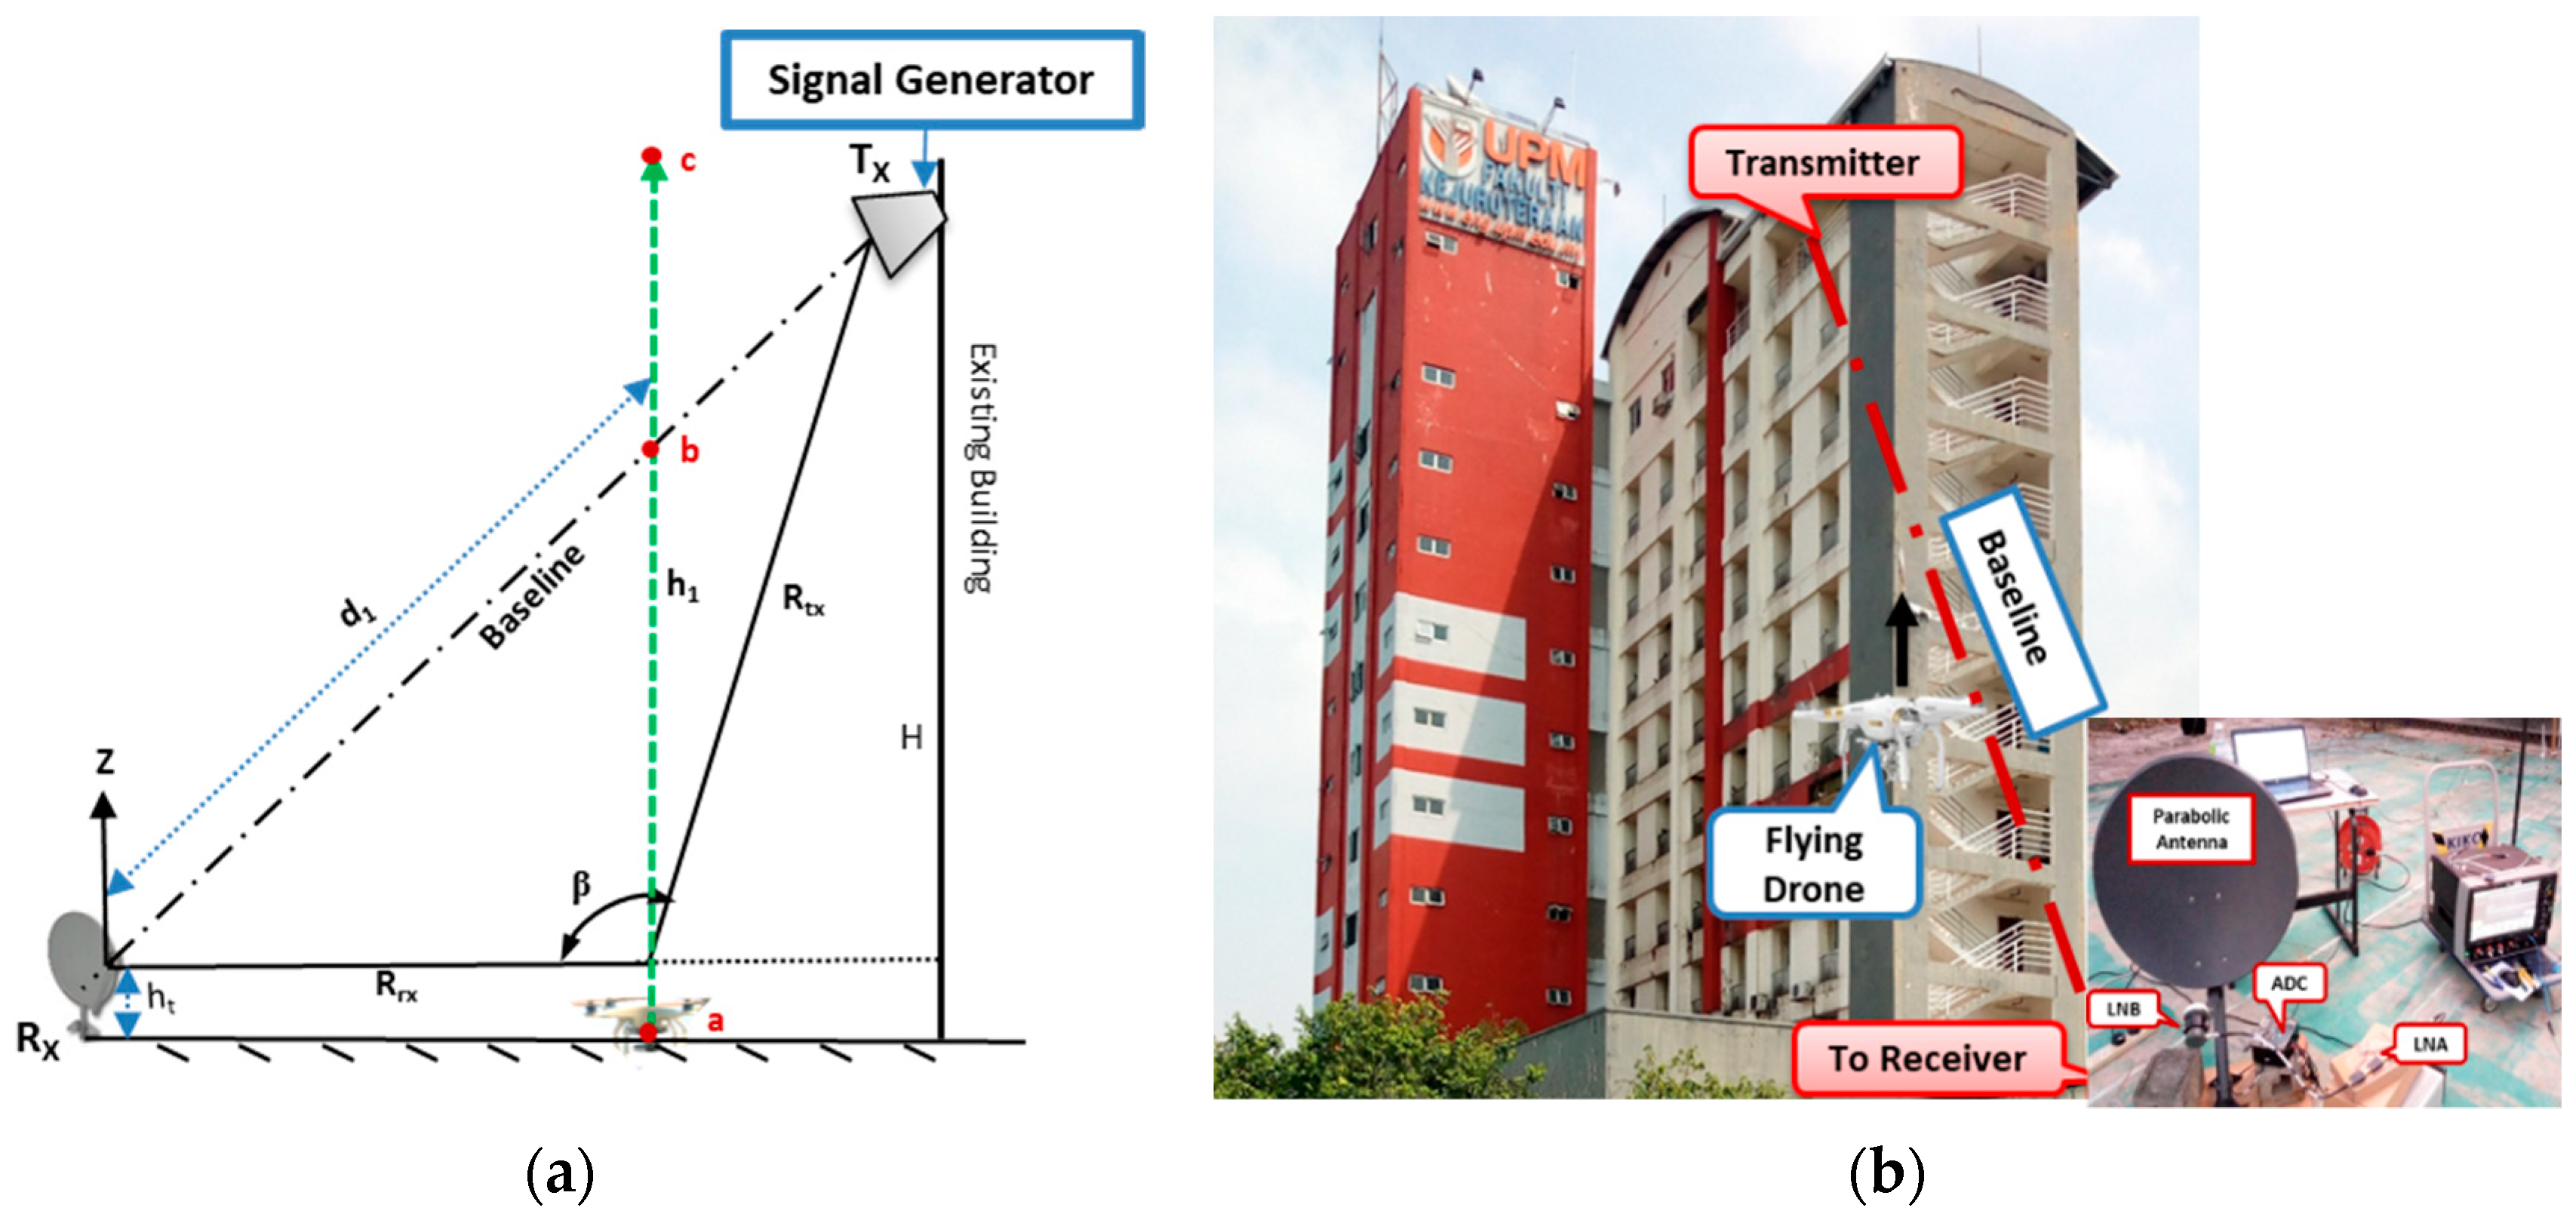
An off the shelf commercial drone was used to ascertain its detectability using the FSR geometry. This setup used a parabolic dish antenna as a receiver to increase gain. For a smooth flight condition of the drone, the transmitter was placed on the 11th floor of a tower at engineering faculty Universiti Putra Malaysia (UPM), with 40 m height (H). The transmitter was made to face an open area behind the building during the conduct of the experiment. The transmitter comprised a signal generator and a dual-polarized high-frequency horn antenna with 15 dB gain. The signal generator transmitted 11 GHz frequency with a maximum 15 dBm signal power.
The receiver was set to point towards the direction of the transmitter main lobe. For maximum power received, an effort was made to maintain the line of sight with the transmitter while observing the signal strength by using a spectral analyzer.
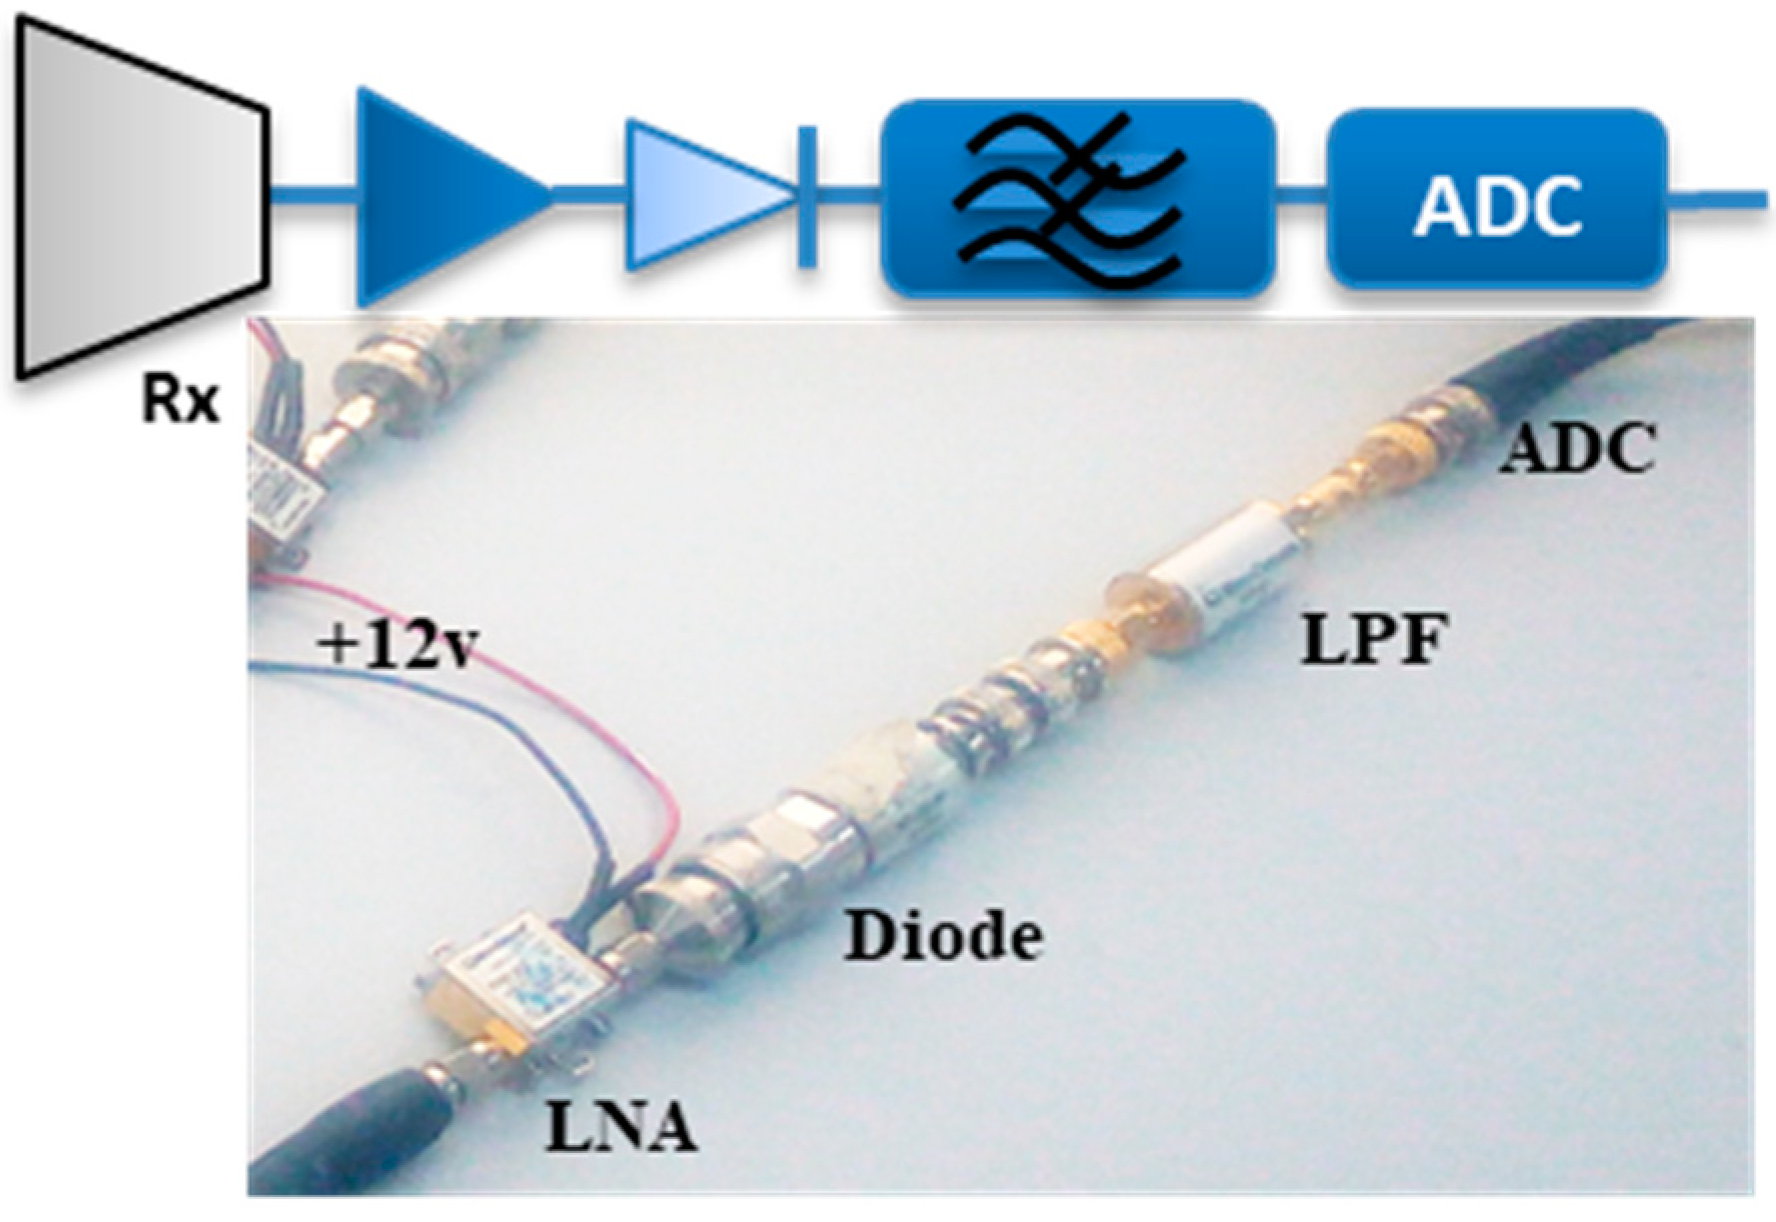
Figure 15 illustrates the experimental geometry and the aerial view of the experimental site. The receiver consisted of a 65 cm parabolic dish antenna, with a feed horn mounted to point the focal point of the dish, to receive the focused reflected energy by the dish. The receiving antenna had a minimum gain of 36 dBi, 2.6° beam width at 3 dB points. For our purpose, the low noise block (LNB) circuit inside the feed horn was developed to suit our purpose. At first, we used a high-resolution ADC device to confirm the signal reception before the detection, as shown in
Figure 15b. Based on the signal power received of (−47 dBm), we required about 20 dB gain to meet the sensitivity level of the amplitude detector for the down-conversion process and the Doppler signature extractions. To achieve this, a fabricated LNA operating within Ku-band frequencies was, therefore, used during the experiment. We tried as much as possible to imitate the Satellite by using low power transmit and also the actual satellite dish receiver with a narrow beamwidth.
Figure 15 describes the experimental FSR geometry and the aerial view of the experimental site. Based on the geometry, shown in
Figure 15a, the detection was conducted, as described in the subsequent sections.
4.3.1. Target Detection
Before the experimental validation, the main Doppler due to the drone linear motion was simulated by using the geometry in
Figure 15a. This helped in having prior knowledge of the expected signature of the target. A target linear motion was simulated with a radial velocity of 16 m/s similar to the actual drone speed. The resultant signature is depicted in
Figure 16.
Figure 16 shows the simulated Doppler signal in FSR due to target linear motion based on the geometry shown in
Figure 15a. Both the time domain and STFT representations depicted the phase change at the point the target approached and left the baseline; hence, an expected signature due to FSR geometry was established.
During the experimental work, we had a collection of clutter which was identified as “low clutter” environment. The clutter was further reduced by using a narrow beamwidth of the receiver antenna. Besides, the receiver was Facing-Up (to the sky) with nothing within the coverage area.
Figure 15b shows the transmitter, target, and receiver positions and their formation of the FSR geometry. The drone was made to fly up and cross the baseline formed by the Tx–Rx. Immediately, the drone crossed the baseline, it blocked the signal and caused an additional modulation, which would then be propagated to the receiver. The signal, arriving the receiver, was received by the developed LNB of the receiving system. The received signal followed a conventional FSR receiver processing technique, discussed earlier in
Section 3.1, and, therefore, extracted the Doppler signature, as shown in
Figure 17.
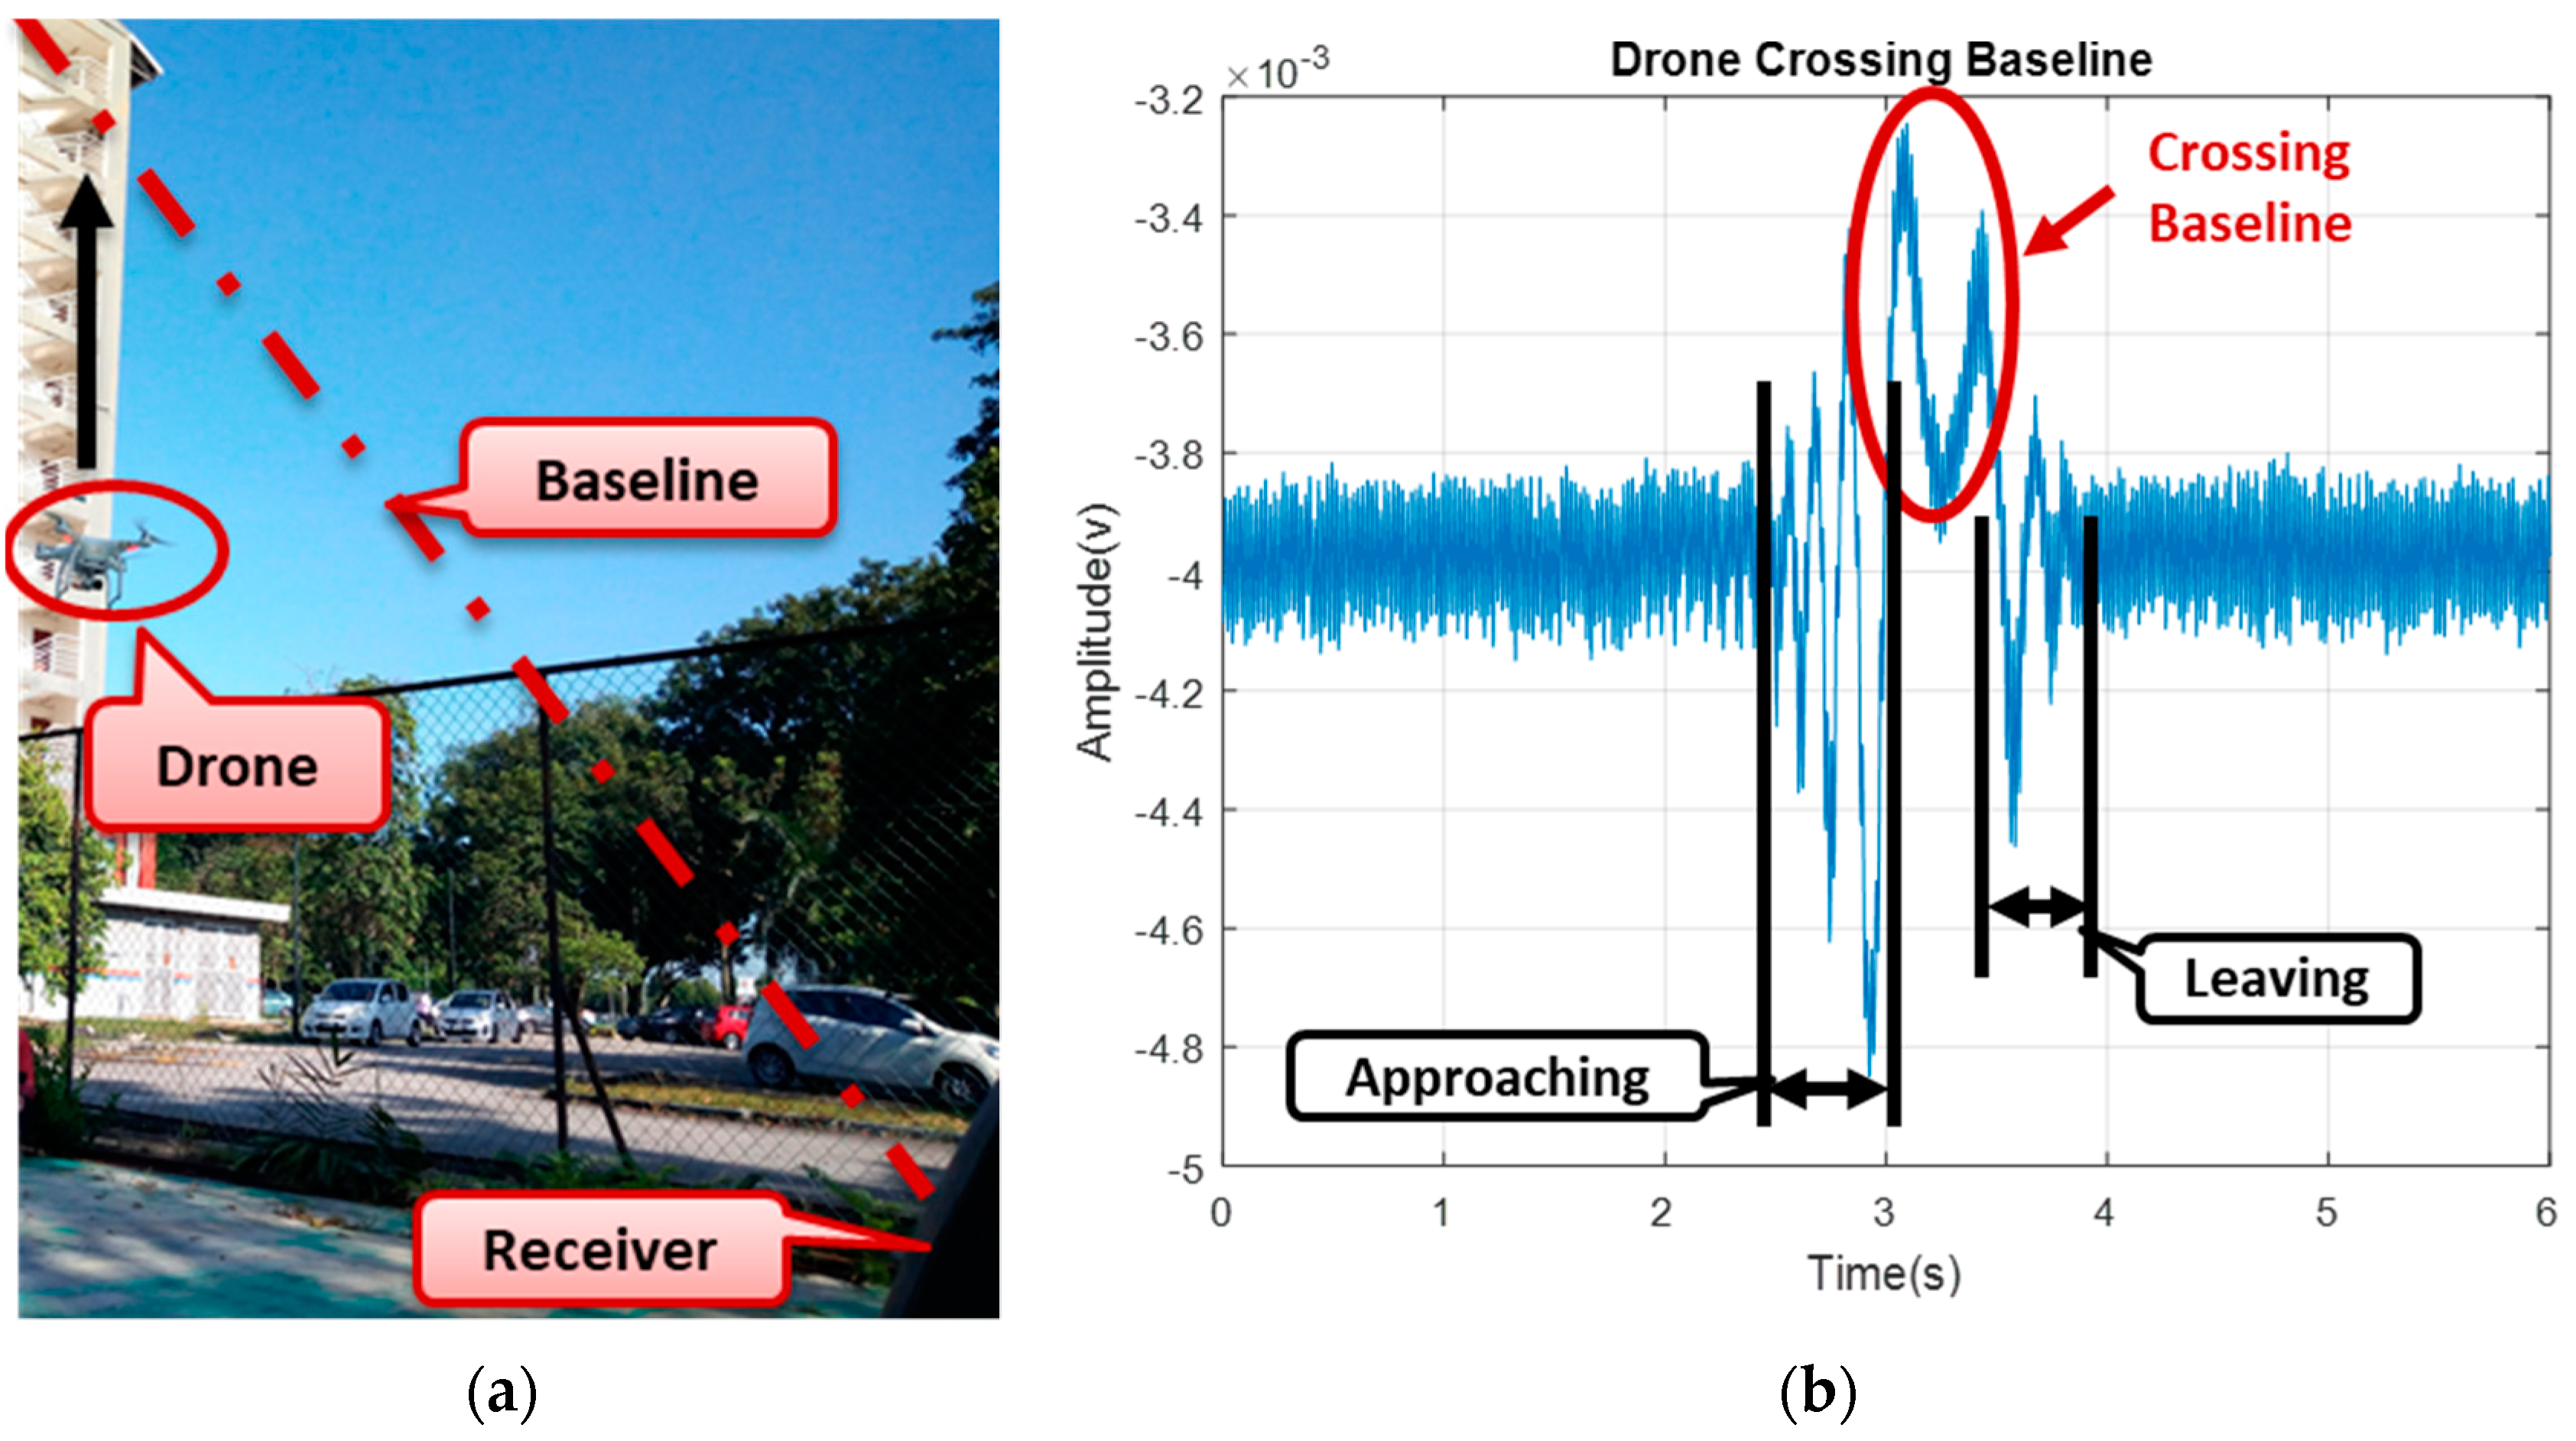
Figure 17 shows how the drone flies vertically to cross the baseline with the time domain, describing the point at which the target is crossing the baseline in
Figure 17b. The drone was made to hover and cross the baseline vertically with target-receiver ranges (R
rx) for up to 40 m. The Doppler signature of the drone started as soon as the drone approached the baseline; when the bistatic angle was within the FS mode until the Doppler was approximately close to zero, while the drone was crossing the baseline. All the three-states approaching, crossing, and leaving of the drone signature can be seen in
Figure 17, and the phase changes due to target crossing. The difference in the Doppler value between the simulation and the experiment might have resulted from factors, such as variation in the geometrical alignment like the aspect angle, degradation of the real signal due to mechanical noise and surrounding clutter, or affected by volume scattering and background noise. Although detection of a target crossing the baseline was established, yet, a conclusion was not made as to whether the detected target was a drone or not. To further ascertain that, an STFT was used to extract the micro-Doppler features due to blade rotation, as this could serve as an avenue to identifying the drone.
4.3.2. Micro Doppler Extraction
The FSR geometry in
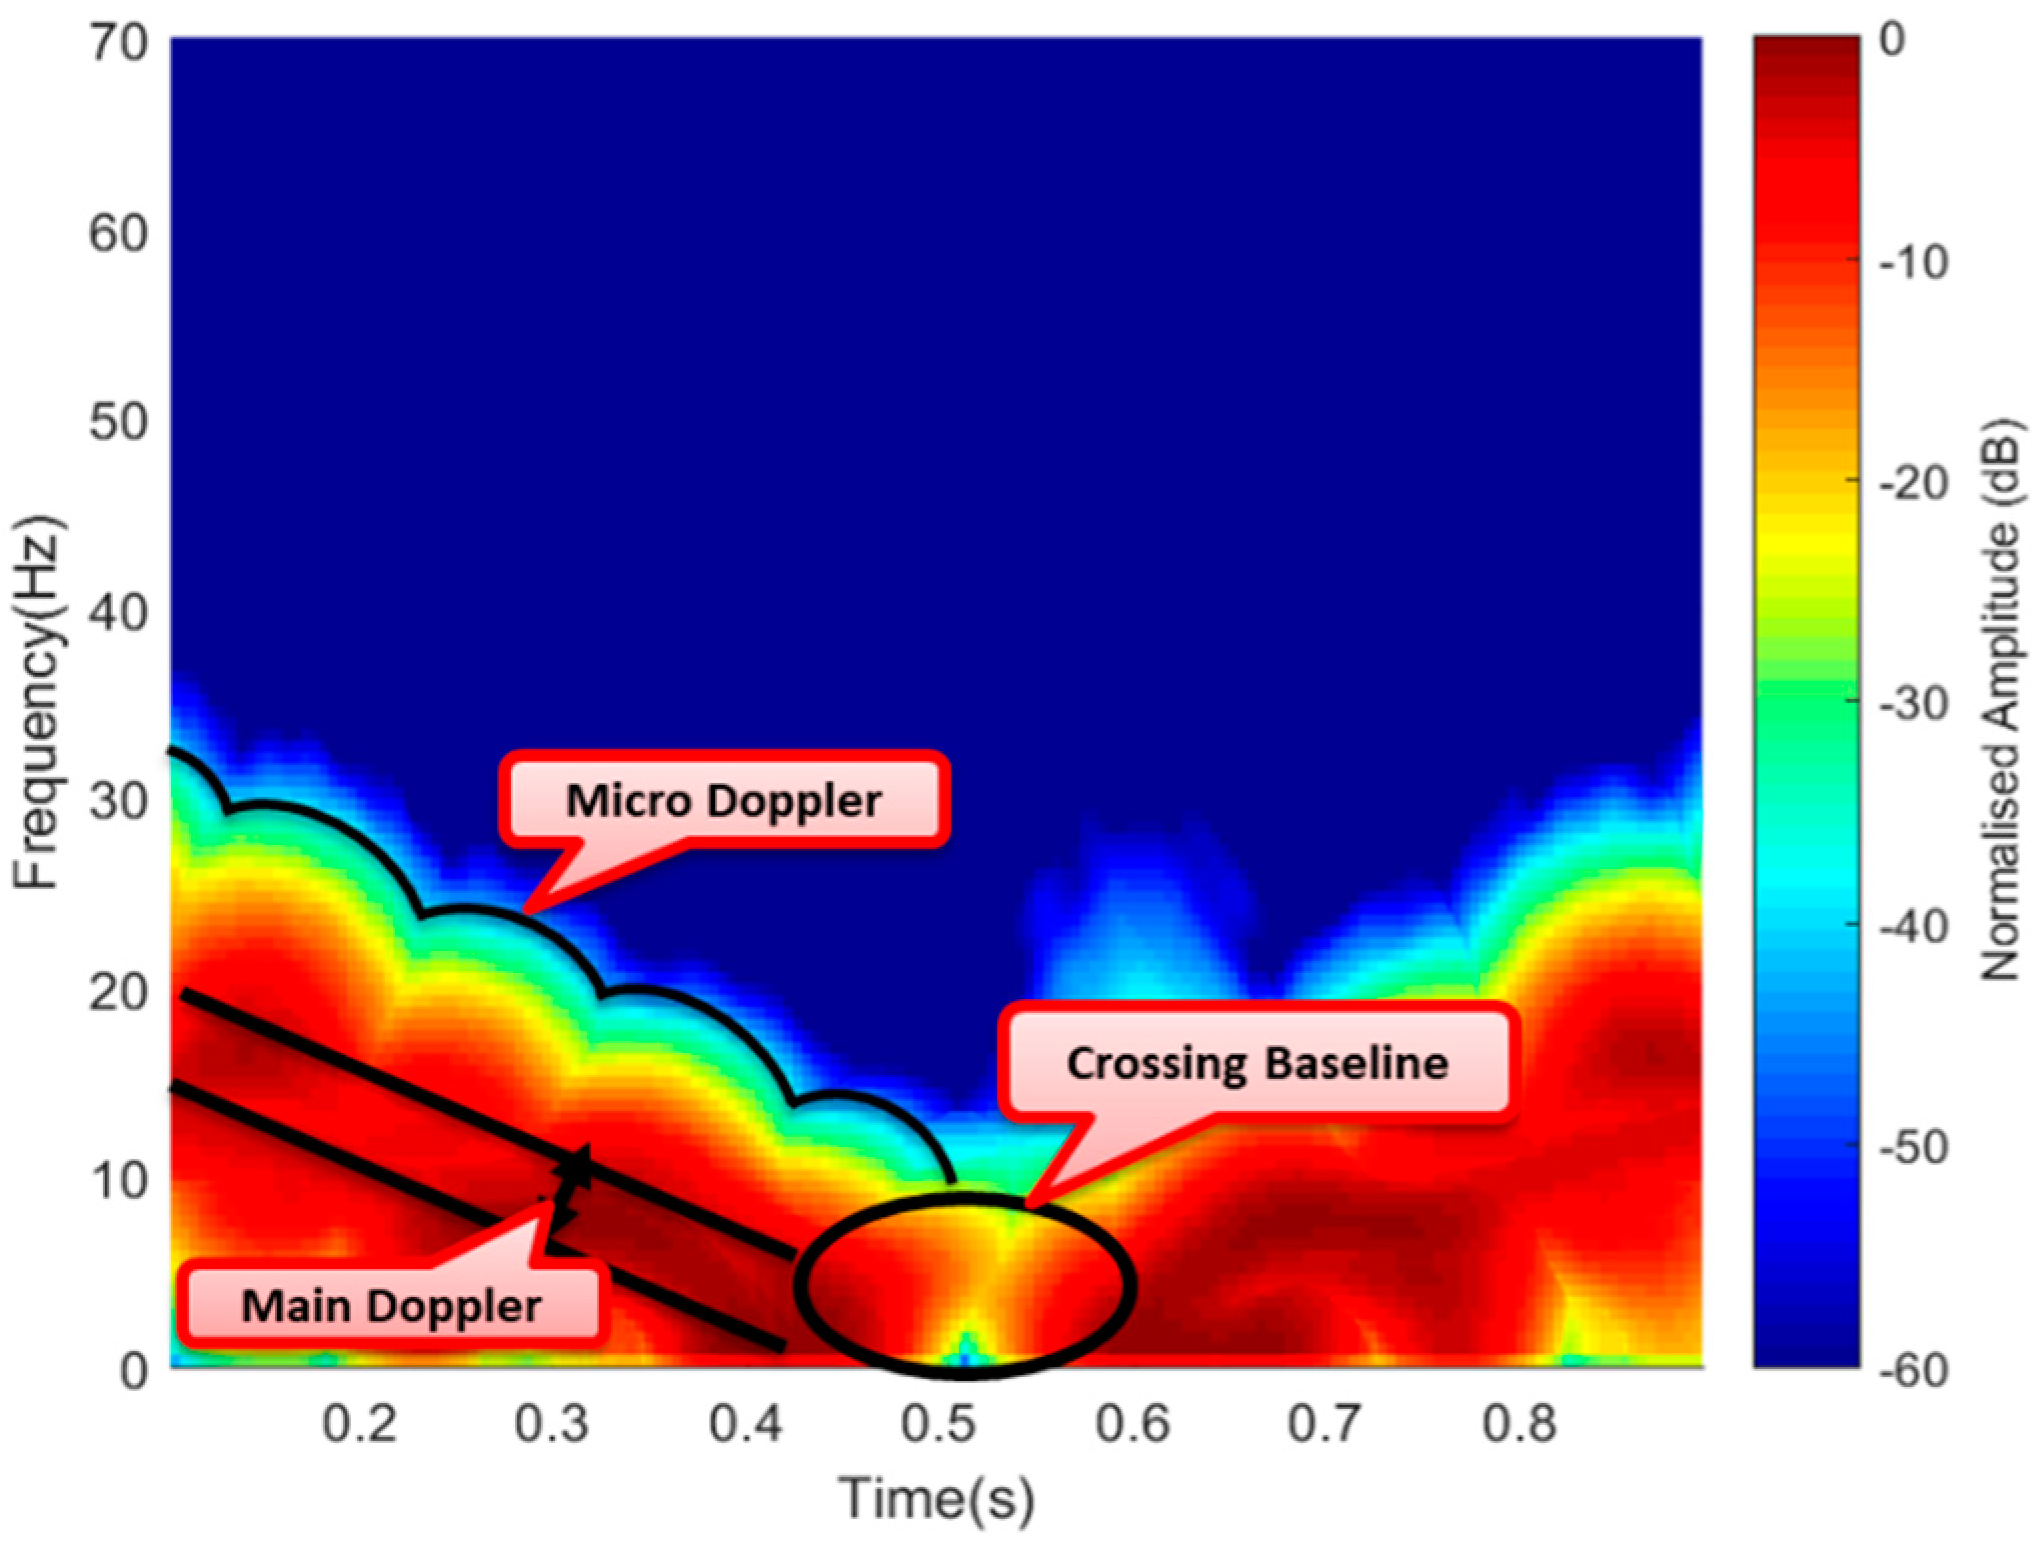
Figure 15a was also used to simulate a micro-Doppler signature of a flying drone; this gave an insightful behavior of the combined Doppler, i.e., Doppler due to the main body and micro-Doppler due to rotating blades. As earlier discussed, the micro motions resulted in an additional modulation surrounding the main Doppler. An STFT representation of the simulated signature for one second described the expected performance of the Doppler signature when the drone crossed the baseline. This is illustrated in
Figure 18.
As illustrated in
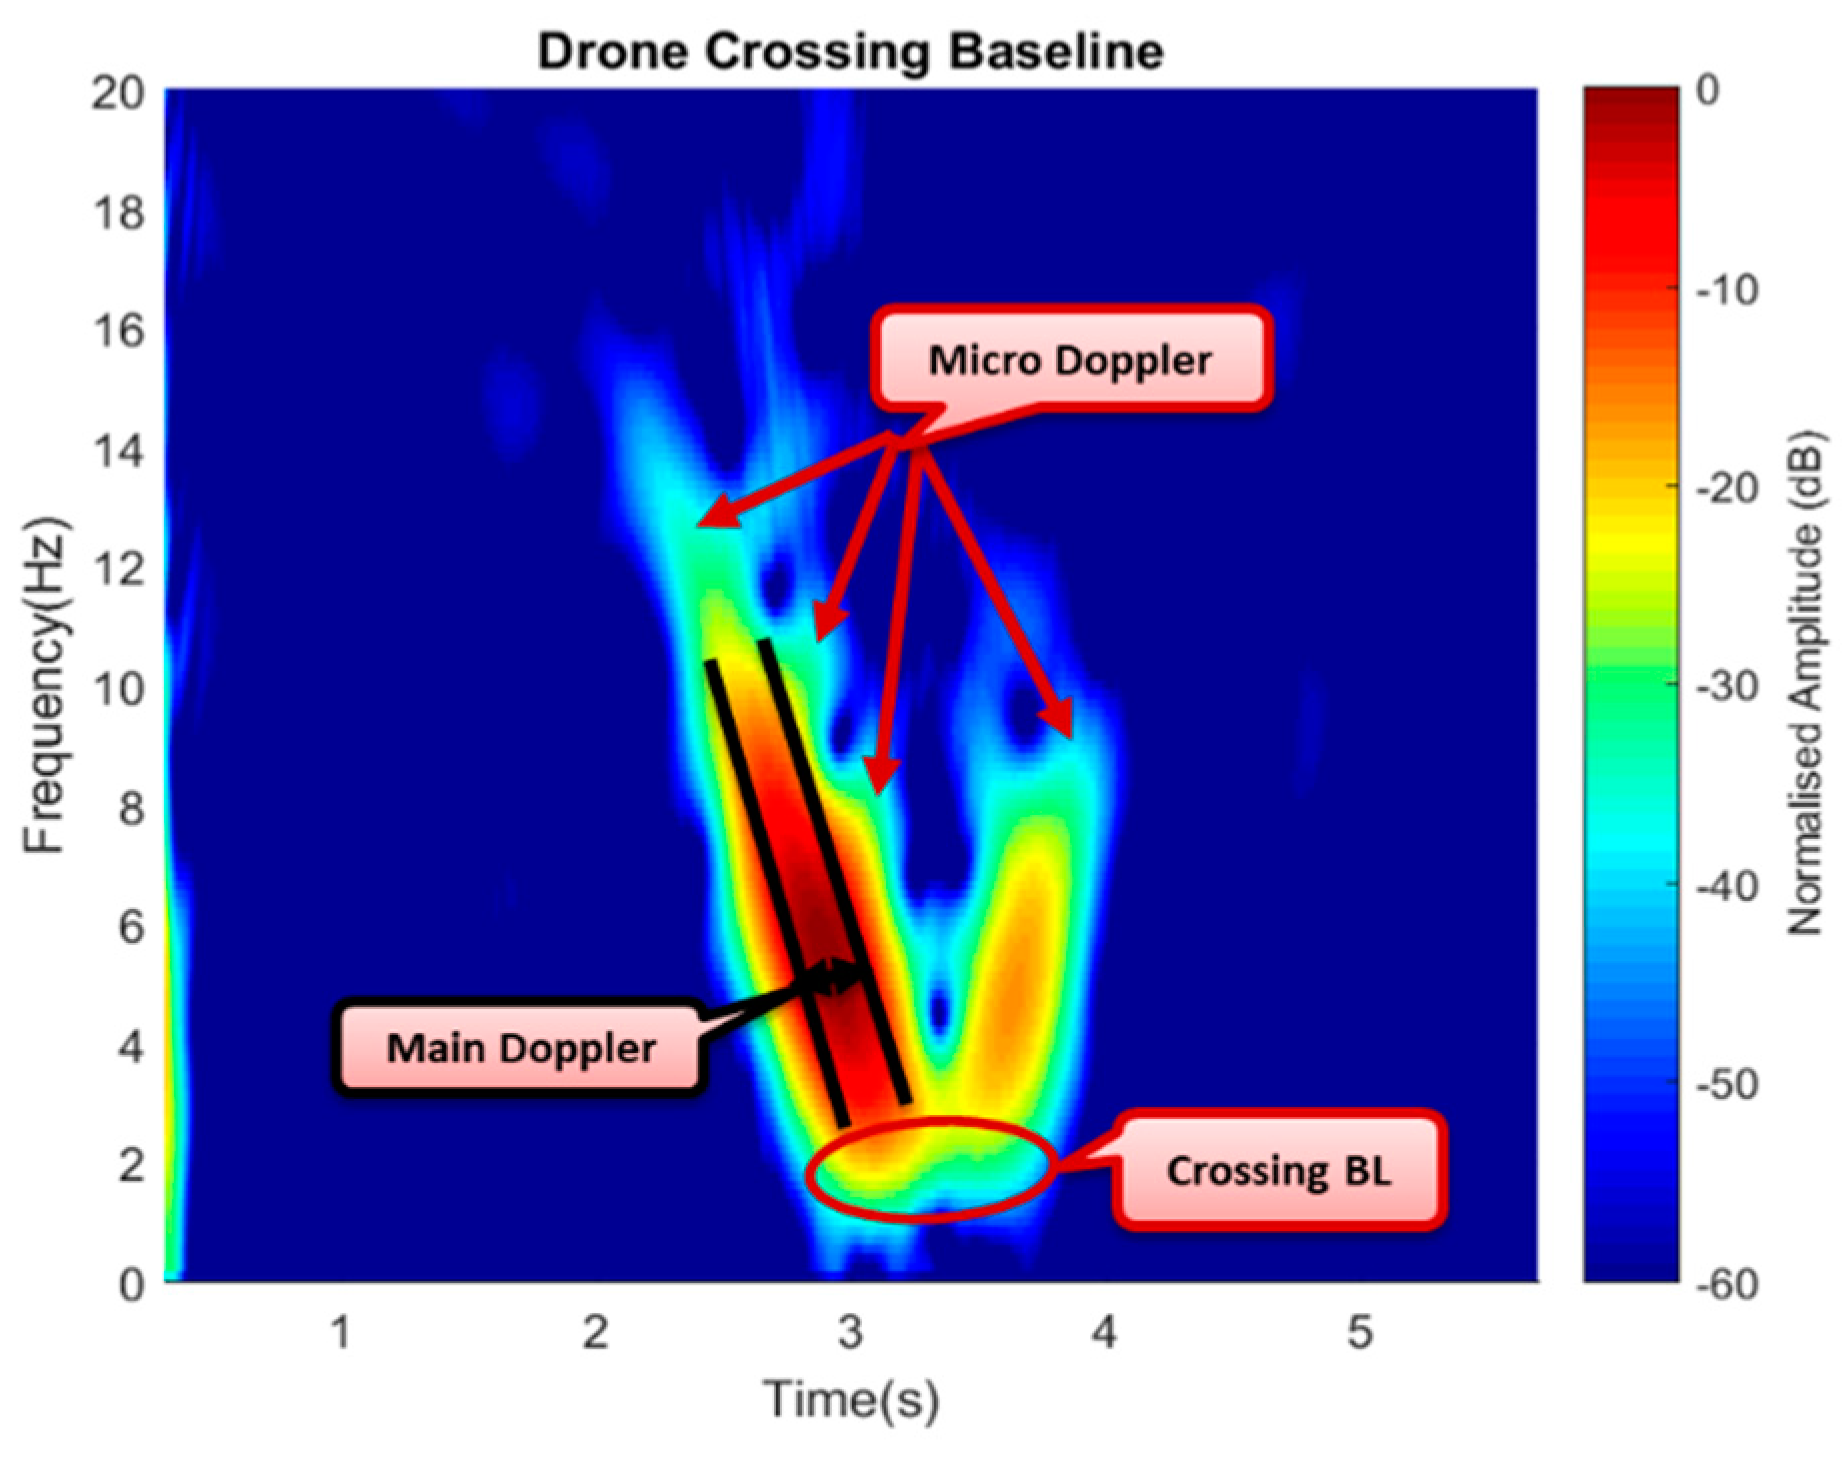
Figure 18, the simulated signature provided a clear view of the Doppler due to the linear motion of the main target body of about 20 Hz and the micro-Doppler surrounding the V-shape signature spread for 1 s. Having this in mind, the experimental result can be compared to also show a combined signature of Doppler due to the drone’s body and the micro-Doppler from the rotating blades. The area covered by the signature was also within a period of 1 s as the case of the simulated signature; this is illustrated in
Figure 19.
Figure 19 shows the experimental signature with micro-Doppler features in the form of spikes surrounding the main Doppler. In both the simulated and the experimental signatures, the Doppler approximately equaled to zero at the point a target crossed the baseline and tended to improve as soon as the drone moved away the baseline forming the V-shape signature of an FSR geometry, as can be seen in both cases. The simulated results complemented the experimental signature, thus confirming the detection of the commercial drone through its micro-Doppler features. Apart from target identification, the micro-Doppler feature could further be used to establish the direction of flight of the drone. In contrast, the Doppler value only reflected the speed lower than the maximum.
4.3.3. Drone Direction of Flight
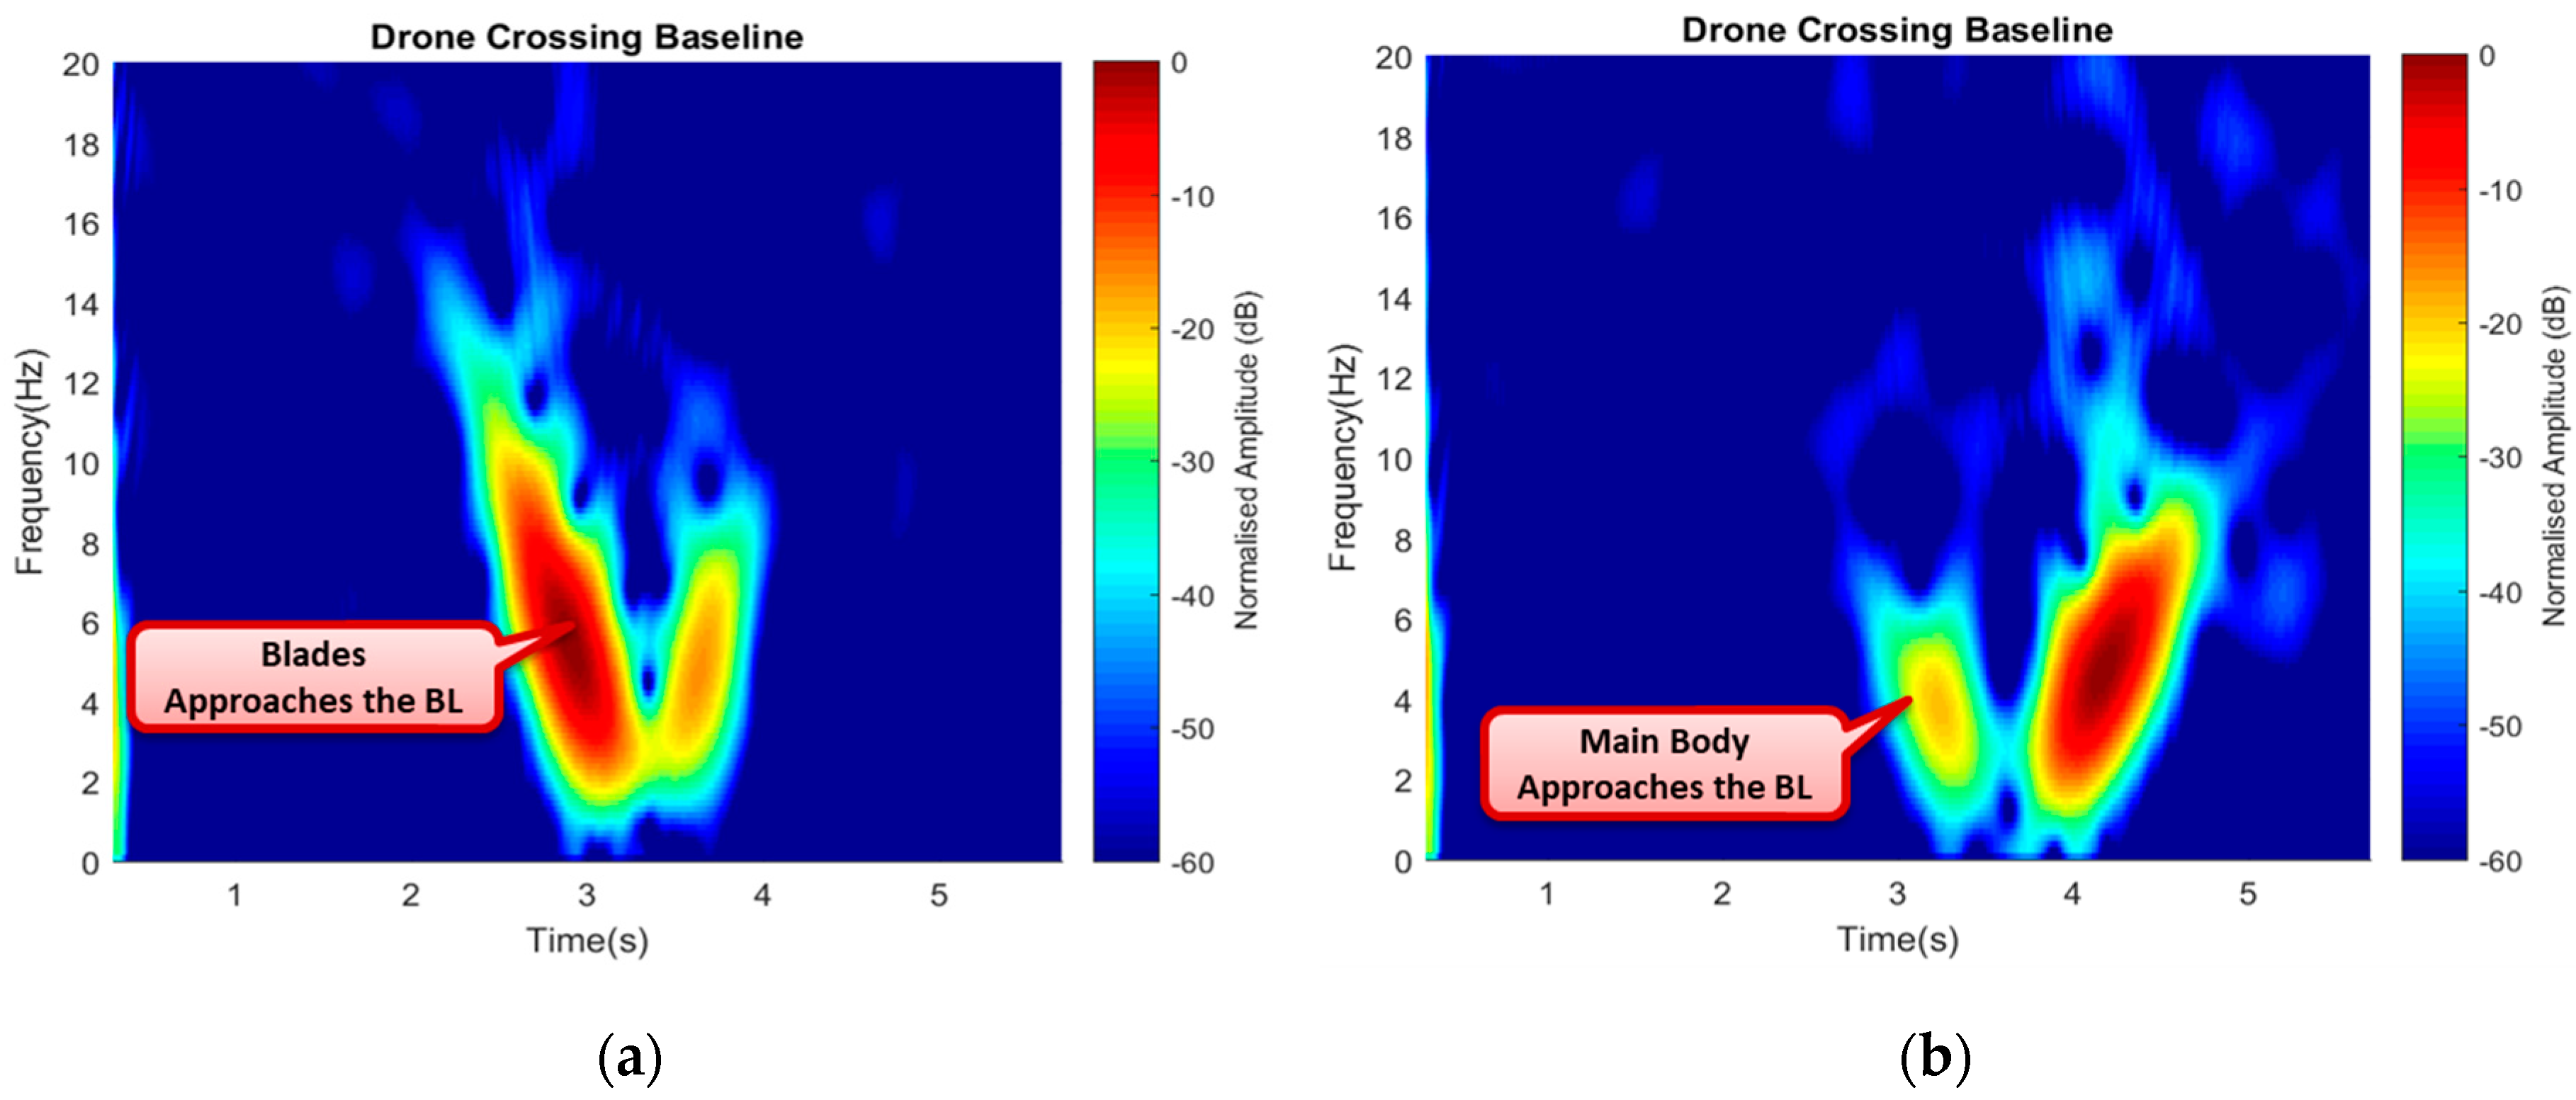
Here, the effect of micro-Doppler features was used for further identification of other drone movements. A drone performed different movement during flight, such as yaw, pitch, roll, maneuvering, among others, by merely altering the rotating blades mode. For instance, the drone hovered by increasing the net thrust of all the four rotors and performed the opposite when vertically descending to land. During the experiment, the observation time of 30 s was considered. The drone was made to hover after 5 s to cross the baseline height (h), stay up for a while like 20 s, and then descend to cross the baseline for the second time. The intention here was to observe the effect of both the rotating blades and the drone body, i.e., to say while hovering up; the blades were the first to approach the baseline and vice-versa for landing. Based on this scenario, a 6 s segment of the acquired signal represented a window containing the signature information, the corresponding signatures are illustrated in
Figure 20.
Figure 20a shows the signature of the drone moving vertically up (hovering up) with a higher power intensity and Doppler value when the rotating blades were the first to approach the baseline, and a low Doppler value was observed as it moved away from the baseline. During the landing (Vertically down), the main drone body first approached and crossed the baseline; hence, low power intensity and Doppler value were also recorded, as shown in
Figure 20b. These features could be used to identify the direction of flight, and other maneuvered motions by the drone.
