Article

A Generalized SDP Multi-Objective Optimization Method for EM-Based Microwave Device Design

1
Department of Electrical and Electronic Engineering, Southern University of Science and Technology, Shenzhen 518055, China
2
School of Electronics and Information Engineering, Harbin Institute of Technology, Harbin 150001, China
3
School of Science and Engineering, Reykjavik University, Menntavegur 1, IS-101 Reykjavik, Iceland
4
Faculty of Electronics, Telecommunications and Informatics, Gdansk University of Technology, 80-233 Gdansk, Poland
*
Author to whom correspondence should be addressed.
Sensors 2019, 19(14), 3065; https://doi.org/10.3390/s19143065
Submission received: 12 May 2019 / Revised: 24 June 2019 / Accepted: 3 July 2019 / Published: 11 July 2019

Abstract

:
In this article, a generalized sequential domain patching (GSDP) method for efficient multi-objective optimization based on electromagnetics (EM) simulation is proposed. The GSDP method allowing fast searching for Pareto fronts for two and three objectives is elaborated in detail in this paper. The GSDP method is compared with the NSGA-II method using multi-objective problems in the DTLZ series, and the results show the GSDP method saved computational cost by more than 85% compared to NSGA-II method. A diversity comparison indicator (DCI) is used to evaluate approximate Pareto fronts. The comparison results show the diversity performance of GSDP is better than that of NSGA-II in most cases. We demonstrate the proposed GSDP method using a practical multi-objective design example of EM-based UWB antenna for IoT applications.

1. Introduction

Nowadays, full-wave electromagnetic (EM) analysis has become a necessary tool for designing microwave devices. Full-wave EM analysis methods include method of moment (MoM) [1] and the finite-difference time domain method (FDTD) [2], et al. At present, microwave device models can be analyzed by commercial full-wave EM-based simulation software packages such as CST and HFSS. The full-wave EM analysis process is computationally expensive, especially for complex models. When the model is designed using numerical optimization methods such as the quasi-Newton method [3], genetic algorithm [4] or other population-based metaheuristic methods, the cost may become prohibitive.
In the design process of microwave devices, such as multi-port component design, many design objectives need to be considered at the same time, such as return loss [5], insertion loss [6] and so on. In many cases, especially IoT component design, the miniaturization of devices is also an objective that a designer has to consider [7]. Therefore, the design process can be seen as a multi-objective problem that takes many design objectives into consideration. These objectives require simultaneous optimization and are usually in conflict with each other, which means that improving one objective may degrade other objectives [8].
The commercial EM-based simulation software packages (CST [9] and HFSS [10]) allow the inclusion of many optimization objectives. Traditionally, these objectives can be converted into a single objective by weighted sum and then optimized by popular methods such as the genetic algorithm and pattern search method [11]. However, this method can only find one of many possible solutions, and the solution found by the arbitrary setting of the weight of each objective may not be satisfactory. Currently, the most robust multi-objective optimization algorithms with good convergence are population-based metaheuristic multi-objective optimization methods (such as NSGA-II [12]) and multi-objective particle swarm optimization methods [13]. In the case of EM-based component design [14,15,16] (each function evaluation normally requires a full-wave EM analysis), these population-based metaheuristic methods are not applicable because of the large amount of objective function evaluation required and thus the very high computation cost. Multi-objective optimization can also be carried out by constructing surrogate models of EM-based simulation of microwave devices [17,18,19,20] and combining with optimization algorithms such as NSGA-II. The computational cost is saved, but the accuracy of the solutions may suffer.
The sequential domain patching (SDP) method [21] overcomes the problem of a large number of function evaluations (EM simulations) by means of searching small areas (patch) sequentially between two optimal solutions. Since the SDP method uses EM simulation directly for multi-objective optimization, the error is relatively small. However, the SDP method is only applicable to two-objective optimization problems.
In this work, a generalized SDP (GSDP) method is proposed to efficiently solve EM-based multi-objective optimization. The method is applicable to solve optimization problems of two or three objectives, and it has the potential to be expanded to more objectives. Compared with the existing algorithms such as NSGA-II [12], the GSDP greatly reduces the computational cost and ensures a good diversity of optimization results.

2. GSDP Algorithm

2.1. Problem Formulation

Let Fk(x), k = 1, …, Nobj, be the kth design objective (x stands for a vector of design parameters). The aim of the multi-objective optimization is to find an approximate Pareto set X so that for any xX, there is no y for which yx. Here, ≺ is the dominance relation defined as yx (y dominates over x) if Fk(y) ≤ Fk(x) for all k = 1, …, Nobj, and Fk(y) < Fk(x) for at least one k [22]. A Pareto set in design space corresponds to a Pareto front [23] in the objective space. All the design solutions in X have the best possible trade-offs between the considered objectives.

2.2. Framework of GSDP Algorithm

The GSDP algorithm is designed to solve multi-objective problems of two or three objectives. The algorithm consists of four parts. The first step is to find all the extreme Pareto-optimal design solutions. Secondly, the Pareto set boundaries between every two extreme Pareto-optimal design solutions are found through an updated sequential domain patch (SDP [21]) method. If the problem is a two-objective optimization problem, the obtained boundary is defined as a “design profile”. The profile is then refined to obtain the final approximate Pareto set.
If the problem is a three-objective optimization problem, the three Pareto set boundaries form a design profile. The profile is then filled with Pareto-optimal design solutions using the updated SDP method. These Pareto-optimal design solutions are refined to obtain the final approximate Pareto set. The flowchart of the GSDP is shown in Figure 1.

2.3. Determining Extreme Pareto-Optimal Designs

The GSDP algorithm begins by obtaining the extreme Pareto-optimal designs [24]. Here, the extreme pareto-optimal designs are a set of optimal solutions for all single objectives. The optimal solution x k * for kth objective, k = 1, …, Nobj, is defined as follows:
x k * = arg min x F k ( x )

2.4. Determining Design Profile

After all the extreme Pareto-optimal designs are obtained, we use an updated SDP method to obtain the Pareto set boundaries between every two extreme Pareto-optimal designs. There is only one Pareto set boundary which can be obtained when it is a two-objective problem, and this boundary forms a so-called design profile. When it is a three-objective problem, all three Pareto set boundaries are linked together to form a design profile. This process of finding a Pareto set boundary is equivalent to solving a two-objective optimization problem.
Suppose a two-objective optimization problem is defined as follows:
F = { min F 1 ( x ) min F 2 ( x ) ,
where x is the n-dimensional design parameter vector. x 1 * and x 2 * are the single objective optimal solutions of F1 and F2, respectively,
x 1 * = arg min x F 1 ( x ) ,
x 2 * = arg min x F 2 ( x ) .
The method to find the Pareto set boundary of the two objectives is described in detail as follows:
  • Determine the design space; the lower bound vector lb and upper bound vector ub can be defined as follows:
    l b j = min ( x 1 j * , x 2 j * ) ,
    u b j = max ( x 1 j * , x 2 j * ) ,
    where l b j and u b j are the jth variables of vectors lb and ub respectively; x 1 j * and x 2 j * are the jth variables of vectors x 1 * and x 2 * respectively.
  • Set the perturbation size vector d = [d1, …, dn]T.
  • Let the current points x c 1 = x 1 * and x c 2 = x 2 * .
  • Evaluate n perturbations x k p = x c 1 + [ 0 , , 0 , d k , 0 , , 0 ] T (k = 1, , n) around x c 1 (towards x c 2 only) and select the one that leads to the largest improvement with regard to the second objective F2 as the current point x c 1 .
  • Evaluate n perturbations x k p = x c 2 + [ 0 , , 0 , d k , 0 , , 0 ] T (k = 1, , n) around x c 2 (towards x c 1 only) and select the one that leads to the largest improvement with regard to the first objective F1 as the current point x c 2 .
  • If x c 1 or x c 2 exceeds the design space, the process is stopped. If both x c 1 and x c 2 are in the design space, return to step 4.
In step 2, the perturbation size vector d can be obtained by the following formula:
d j = | x 1 j * x 2 j * | K ,
where d j   ( j = 1 , , n ) means the size of the perturbations in the jth direction. The value of K is a user-defined constant (typically between 5 and 20).
As an illustration, the above method is applied to solve a two-objective optimization problem:
F = { min f 1 ( x ) = 1 e ( x 1 1 6 ) 2 ( x 2 + 1 8 ) 2 min f 2 ( x ) = 1 e ( x 1 + 1 6 ) 2 ( x 2 1 8 ) 2 ,
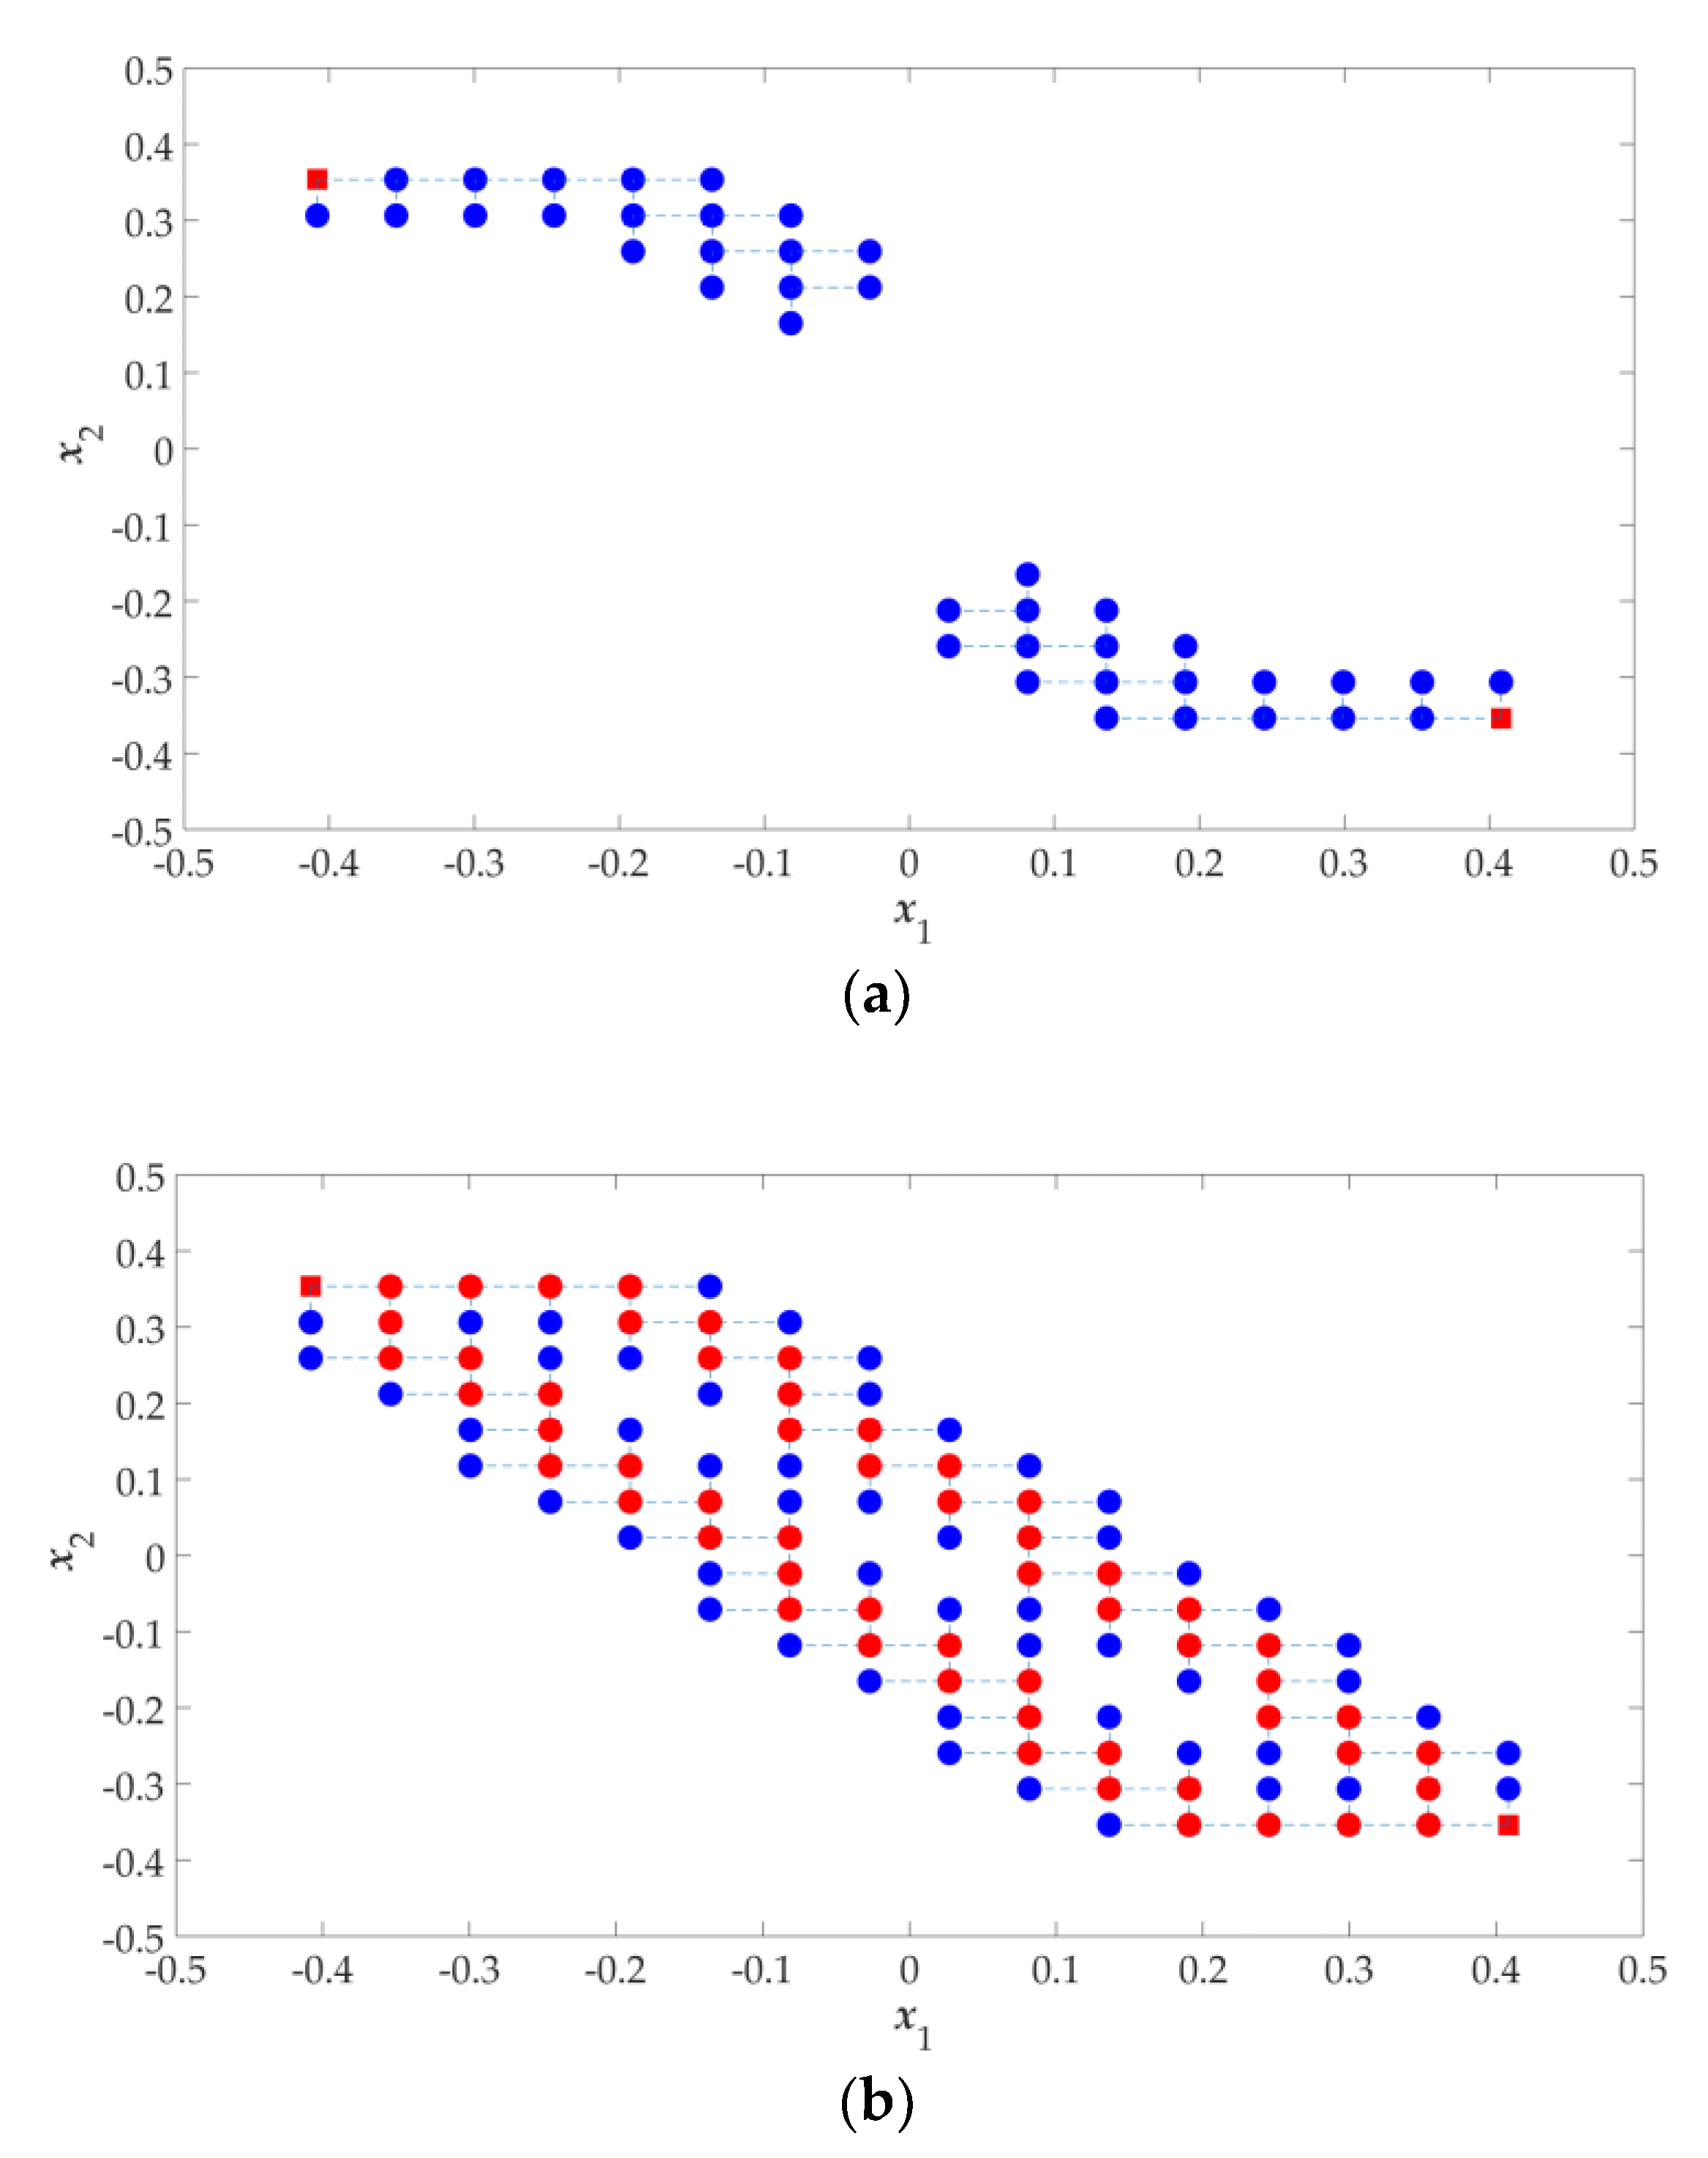
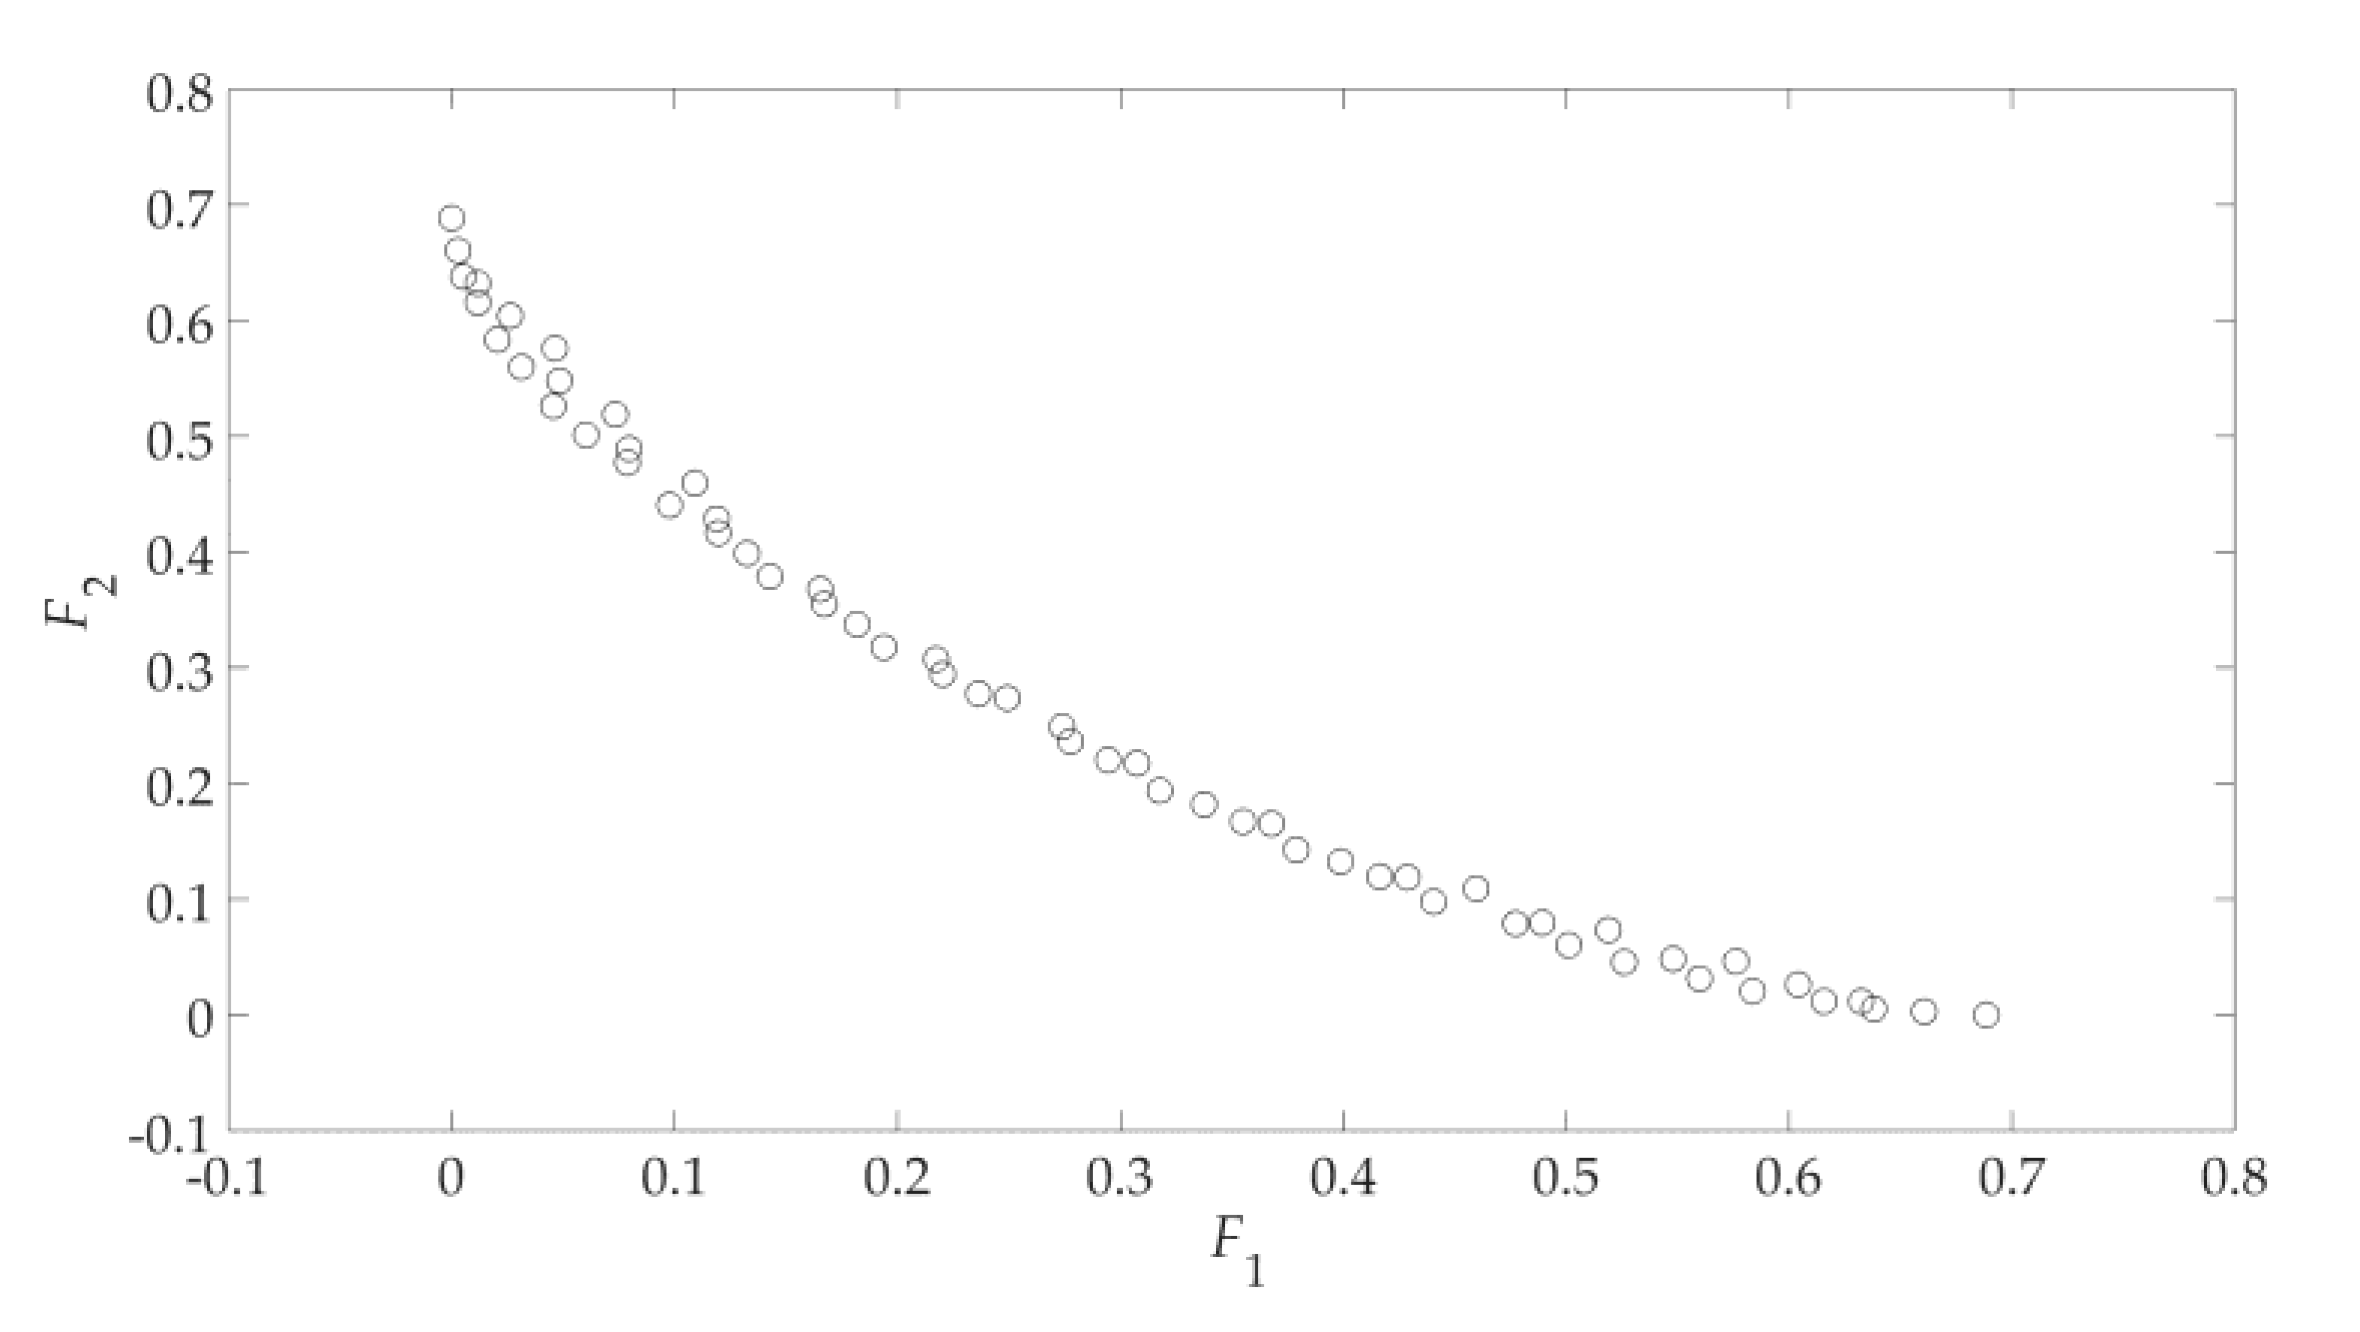
where the design parameter dimension n = 2 and constant K = 15; the process to find the Pareto set boundary is shown in Figure 2. Corresponding to the Pareto set boundary for the two-objective problem in Figure 2, the Pareto front boundary in the objective space is shown in Figure 3.
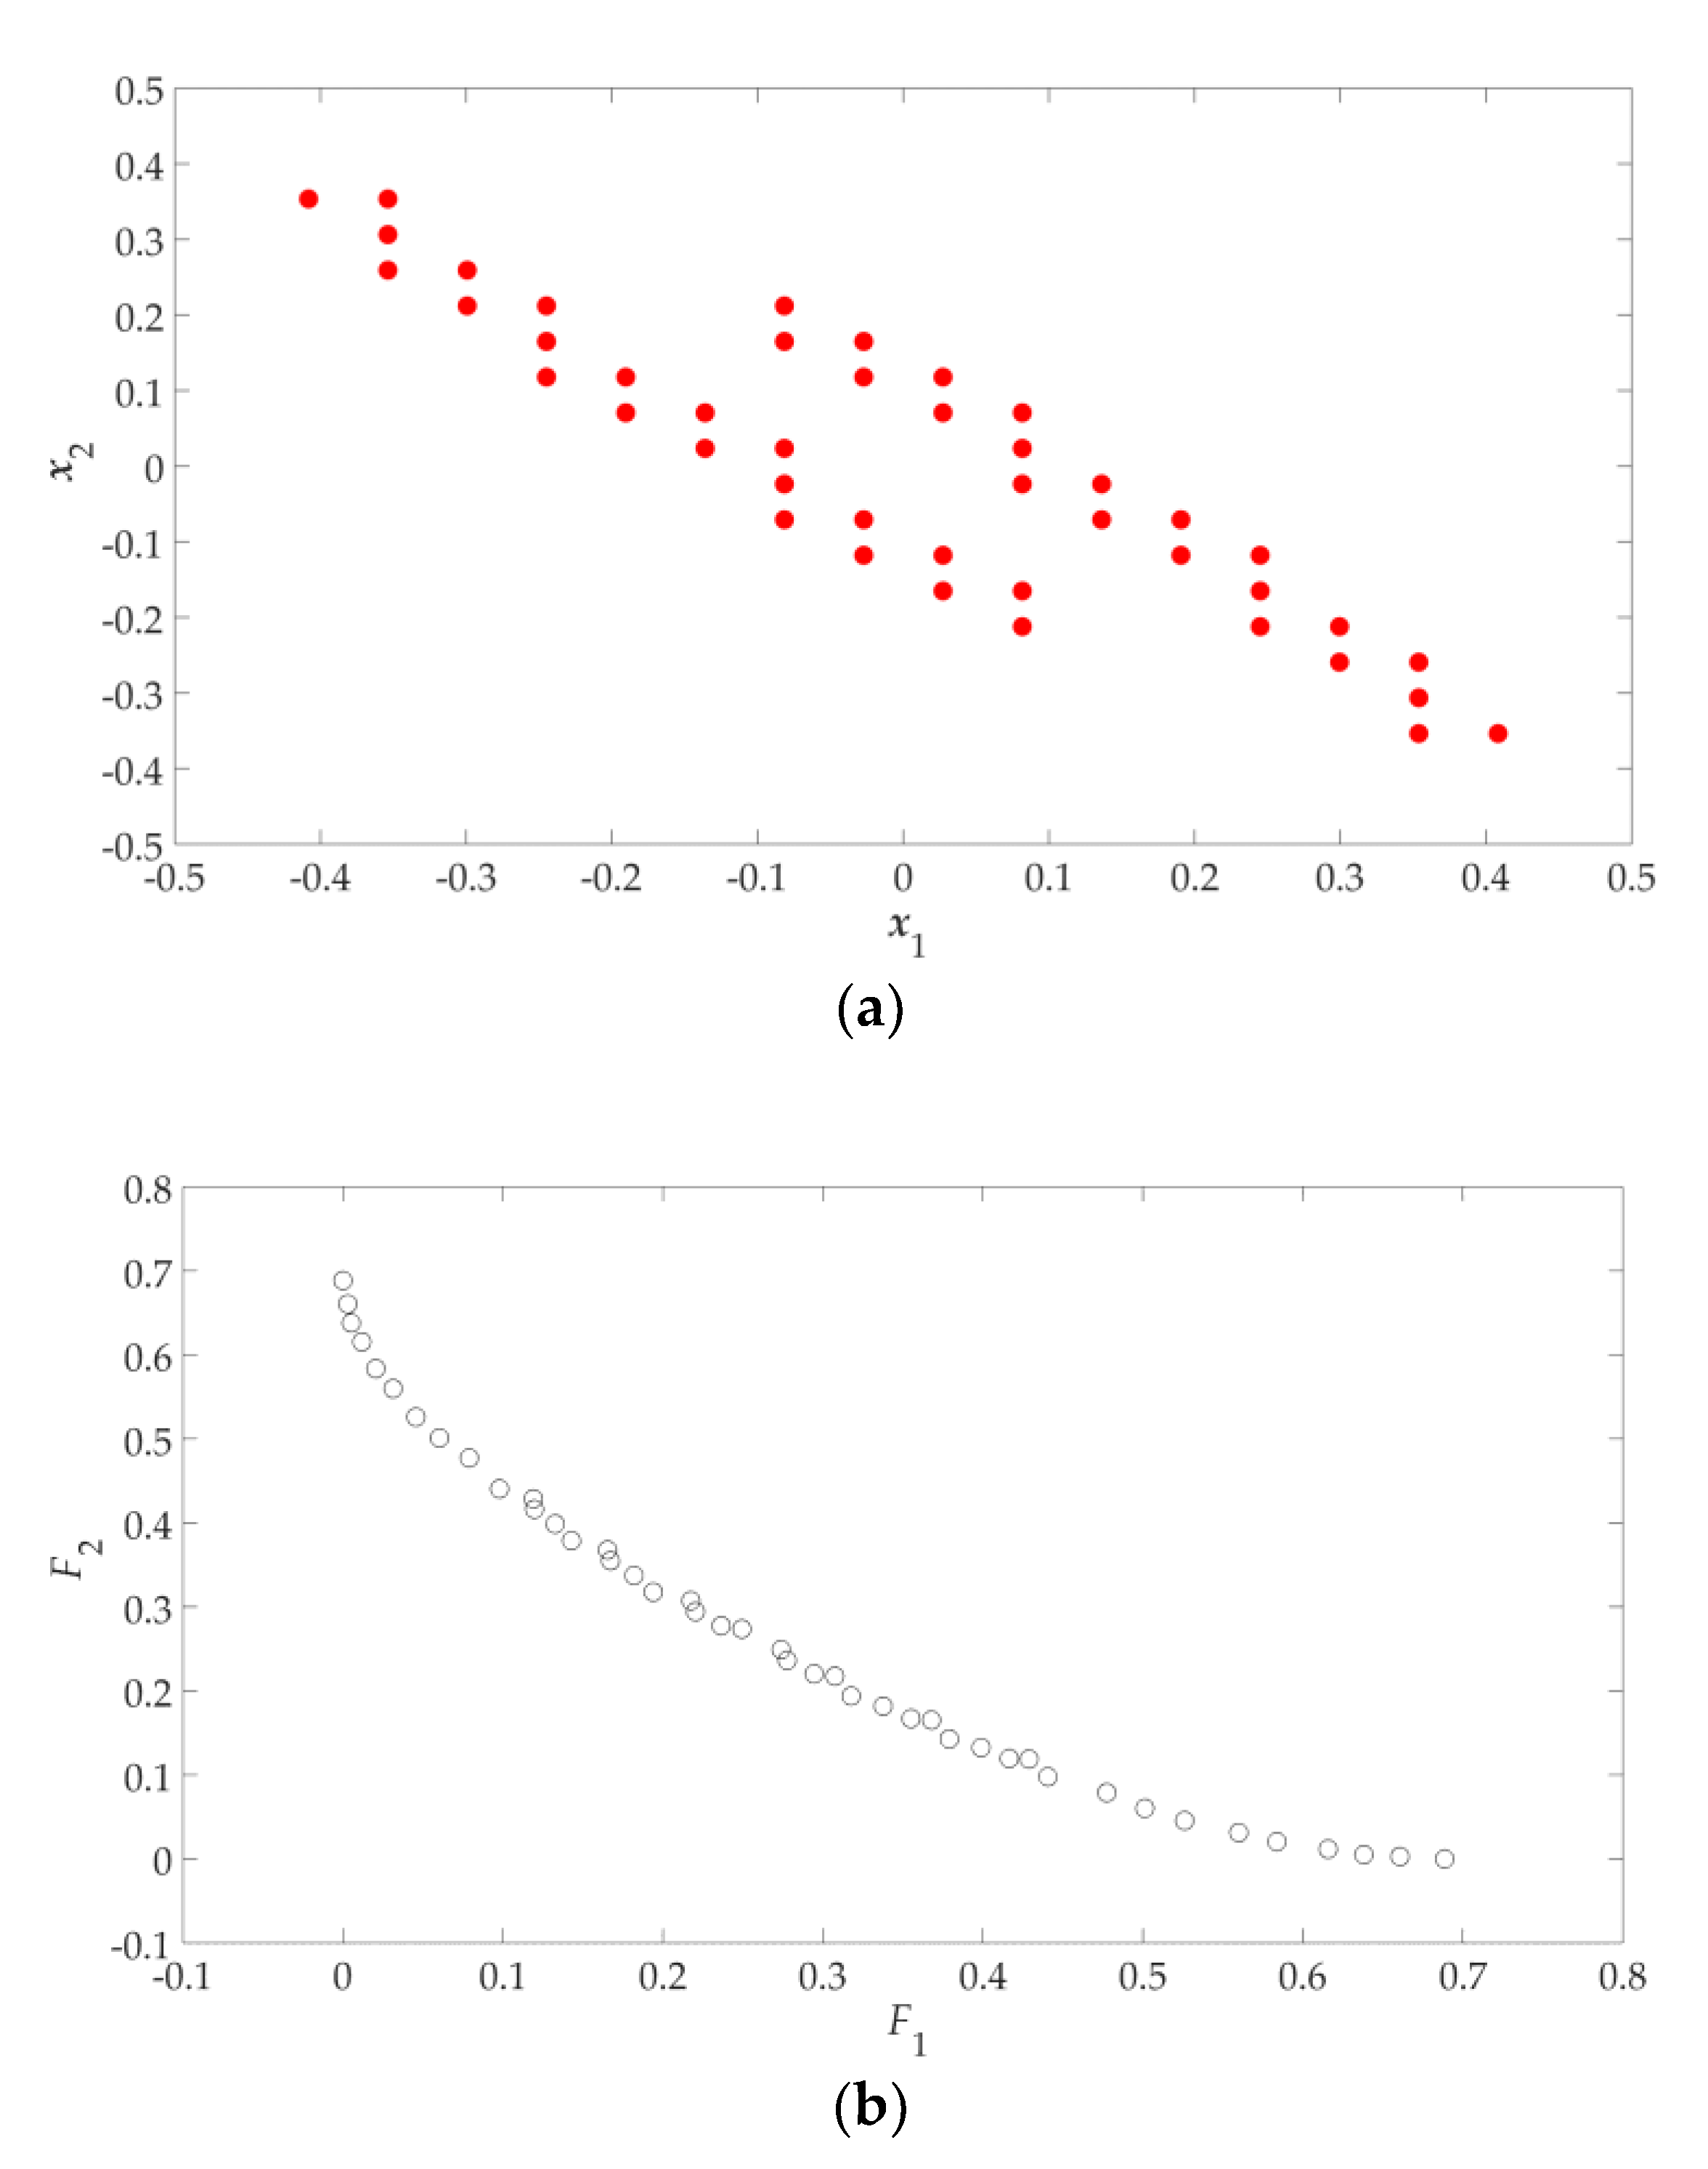
Since (8) is a two-objective optimization problem, the design profile is formed by the Pareto set boundary (shown as red dots in Figure 2b). Its corresponding Pareto front boundary (shown in Figure 3) is called the “objective profile”. According the GSDP algorithm flowchart (shown in Figure 1), all the solutions in the design profile need to be refined to obtain the final approximate Pareto set. Its corresponding approximate Pareto front is shown in Figure 4. The refinement process is described later in Section 2.6.
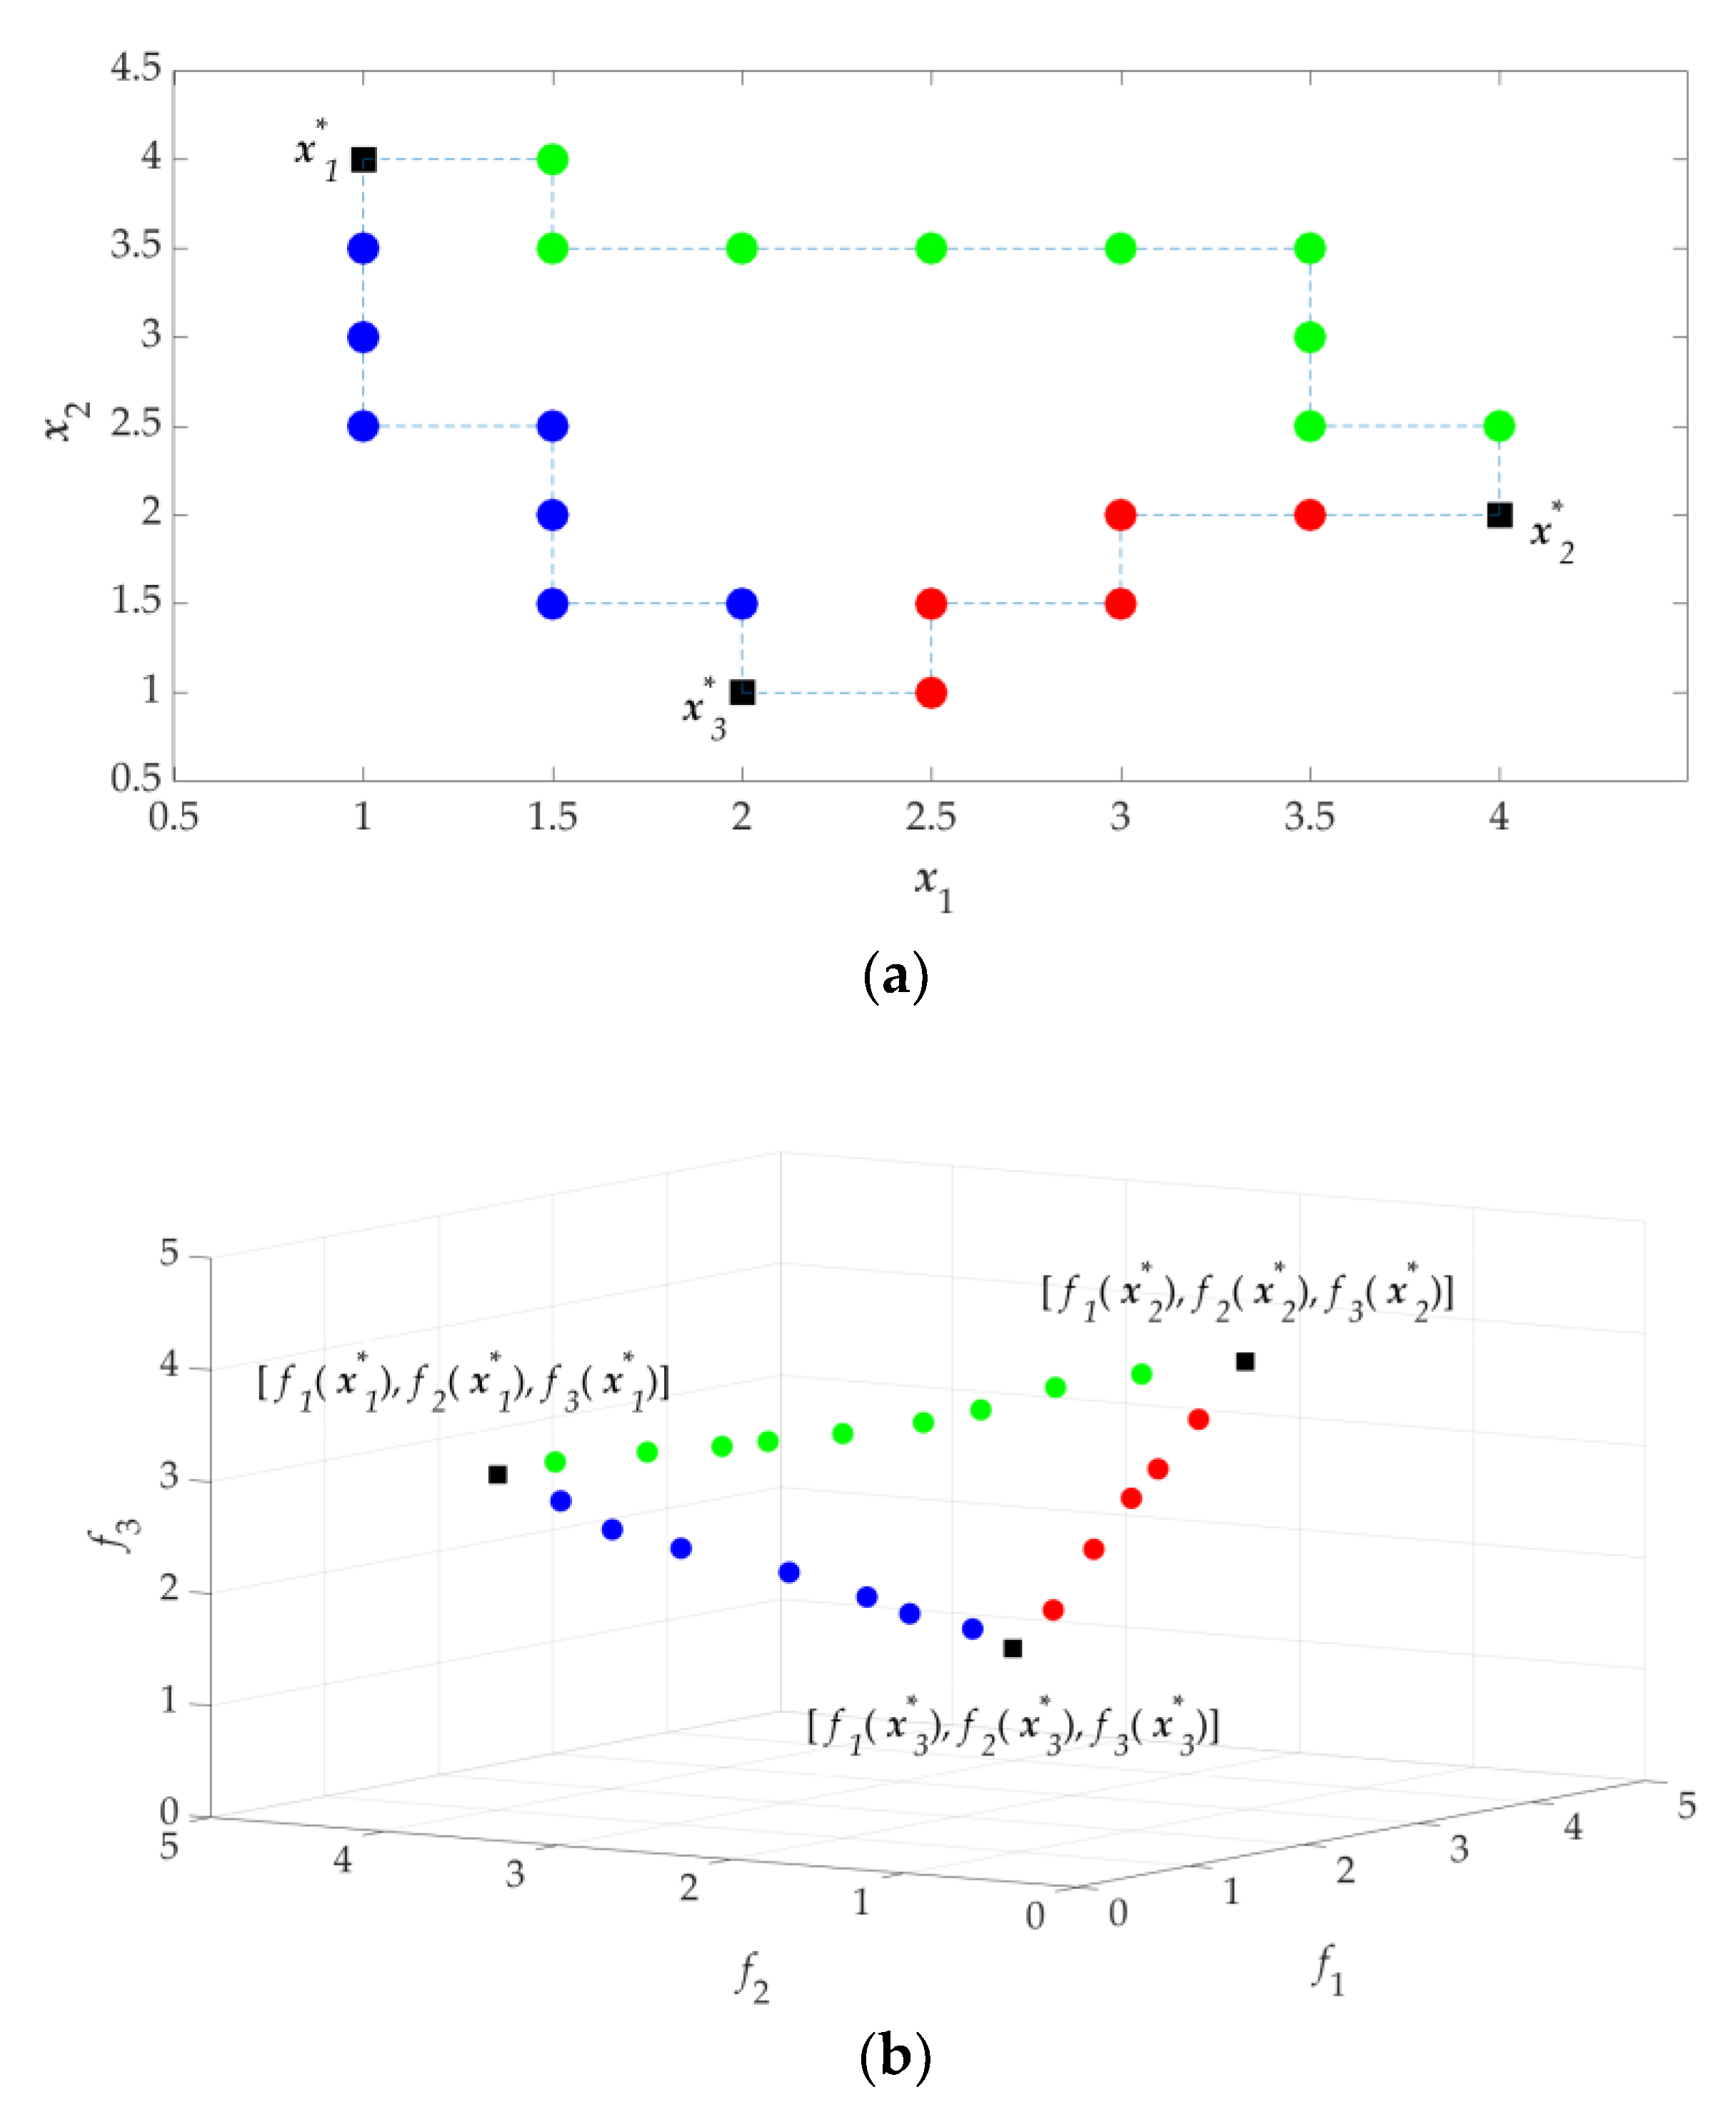
If the problem is a three-objective optimization problem, the extreme Pareto-optimal designs X12, X13, and X23 are obtained first, where Xij is the Pareto set boundary of the ith and jth objectives found by updated SDP, and Fij is the Pareto front boundary corresponding to Xij. F12, F13 and F23 form the objective profile for three objectives. The conceptual results for the obtained design profile and objective profile for three objectives are illustrated in Figure 5.

2.5. Filling Design Profile

In the case of three design objectives ( f 1 , f 2 and f 3 ), the corresponding extreme optimal designs are x 1 * , x 2 * and x 3 * , respectively. The design profile found following Section 2.4 is filled by the process described below.
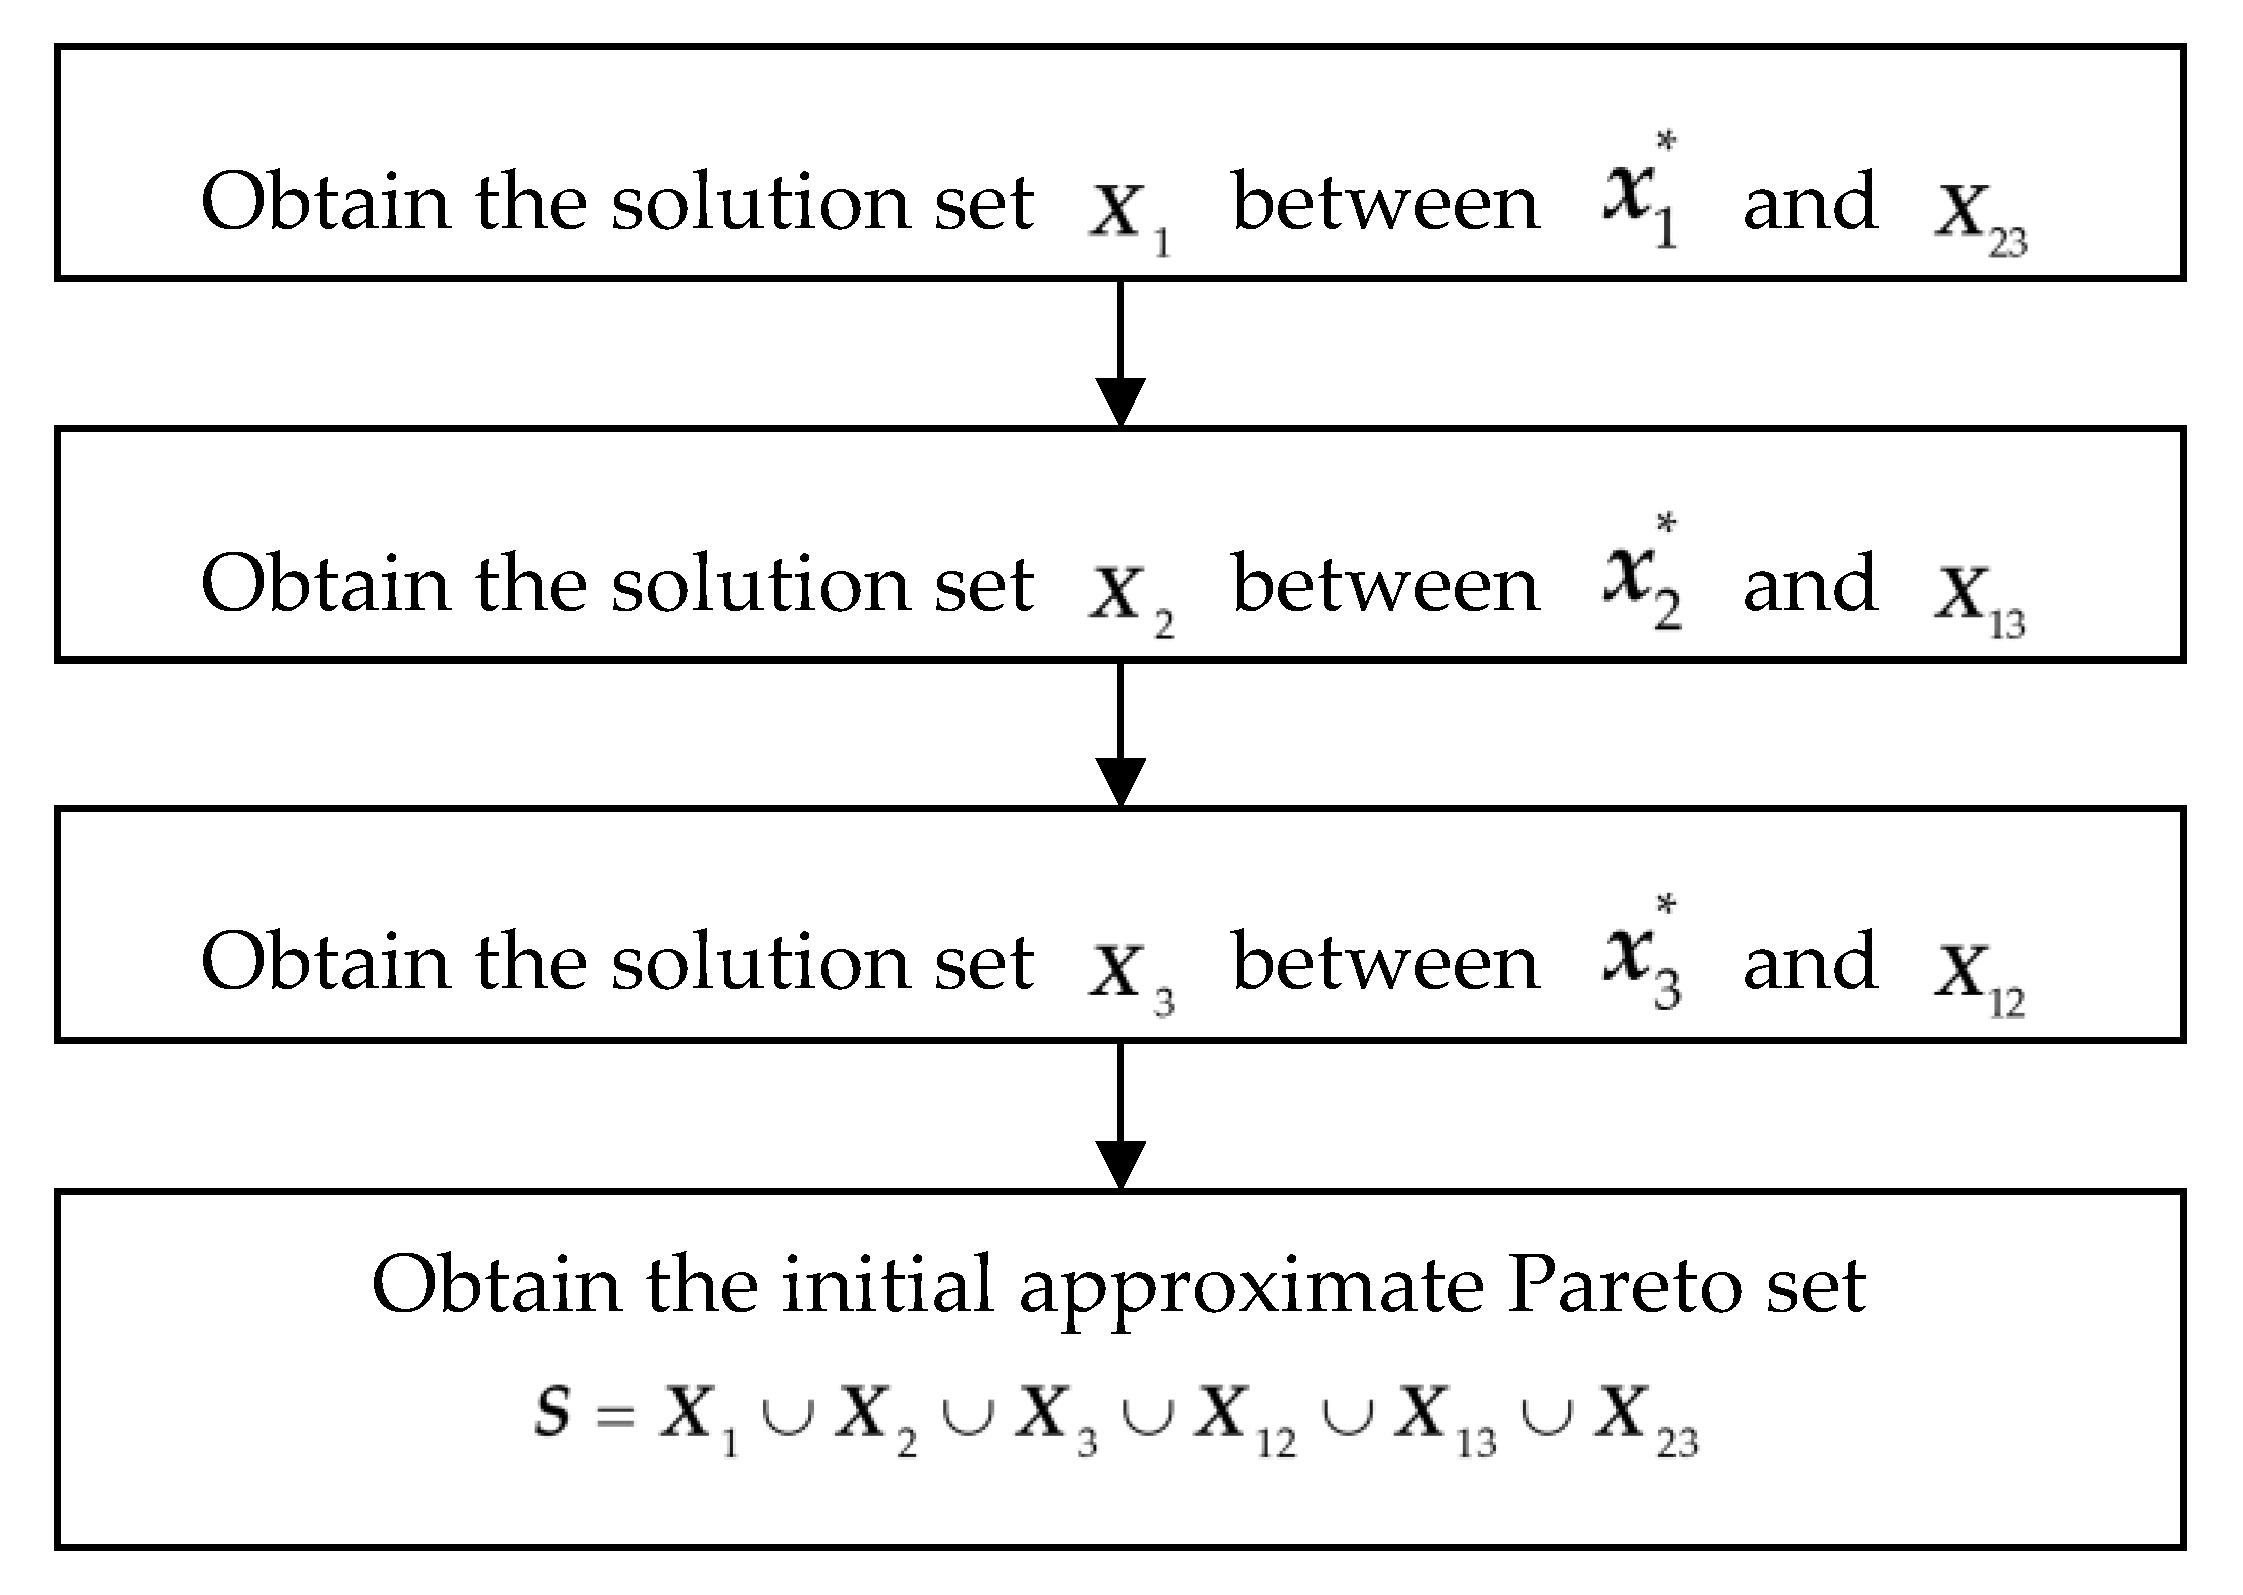
The process finds the appropriate design set X i between x i * and its opposite Pareto set boundary Xjk (j, k = 1, 2, 3 and j, ki) for all i = 1, 2, 3. The design sets X i (i = 1, 2, 3) and the design profile are combined to form the initial approximate Pareto set S. In other words, the design profile is filled by the three similar steps shown in the flowchart in Figure 6.
Here, we only describe the process of obtaining the solution set X 1 between x 1 * and X 23 for ease of reading. The processes to find X 2 and X 3 are similar.
  • Let X 23 i be the ith solution in X 23 , i = 1 .
  • If i > N, the process stops, where N is the number of solutions in X 23 .
  • Determine the design subspace, the lower bound vector lb and upper bound vector ub can be defined as follows:
    l b j = min ( x 1 j * , X 23 j i ) ,
    u b j = max ( x 1 j * , X 23 j i ) ,
    where l b j and u b j are the jth variables of vectors lb and ub, respectively, and x 1 j * and X 23 j i are the jth variables of vectors x 1 * and X 23 i , respectively, where X 23 i is the ith solution in X 23 .
  • Set the perturbation size vector d = [d1, …, dn]T, d j = | x 1 j * X 23 j i | K ; K is up to the user.
  • Let the current points x c 1 = x 1 * and x c 2 = X 23 i .
  • Evaluate n perturbations x k p = x c 1 + [ 0 , , 0 , d k , 0 , , 0 ] T (k = 1, , n) around x c 1 (towards x c 2 only) and select the one that leads to the largest improvement with regard to F 2 = a f 2 + b f 3 as the current point x c 1 .
  • Evaluate n perturbations x k p = x c 2 + [ 0 , , 0 , d k , 0 , , 0 ] T (k = 1, , n) around x c 2 (towards x c 1 only) and select the one that leads to the largest improvement with regard to F 1 = f 1 as the current point x c 2 .
  • If x c 1 and x c 2 exceeds the design subspace, i = i + 1 , return to step 2. If both x c 1 and x c 2 are still in the design space, return to step 6.
The weighting factors a and b in step 6 are defined as follows:
a = d l d l + d r ,
b = d r d l + d r ,
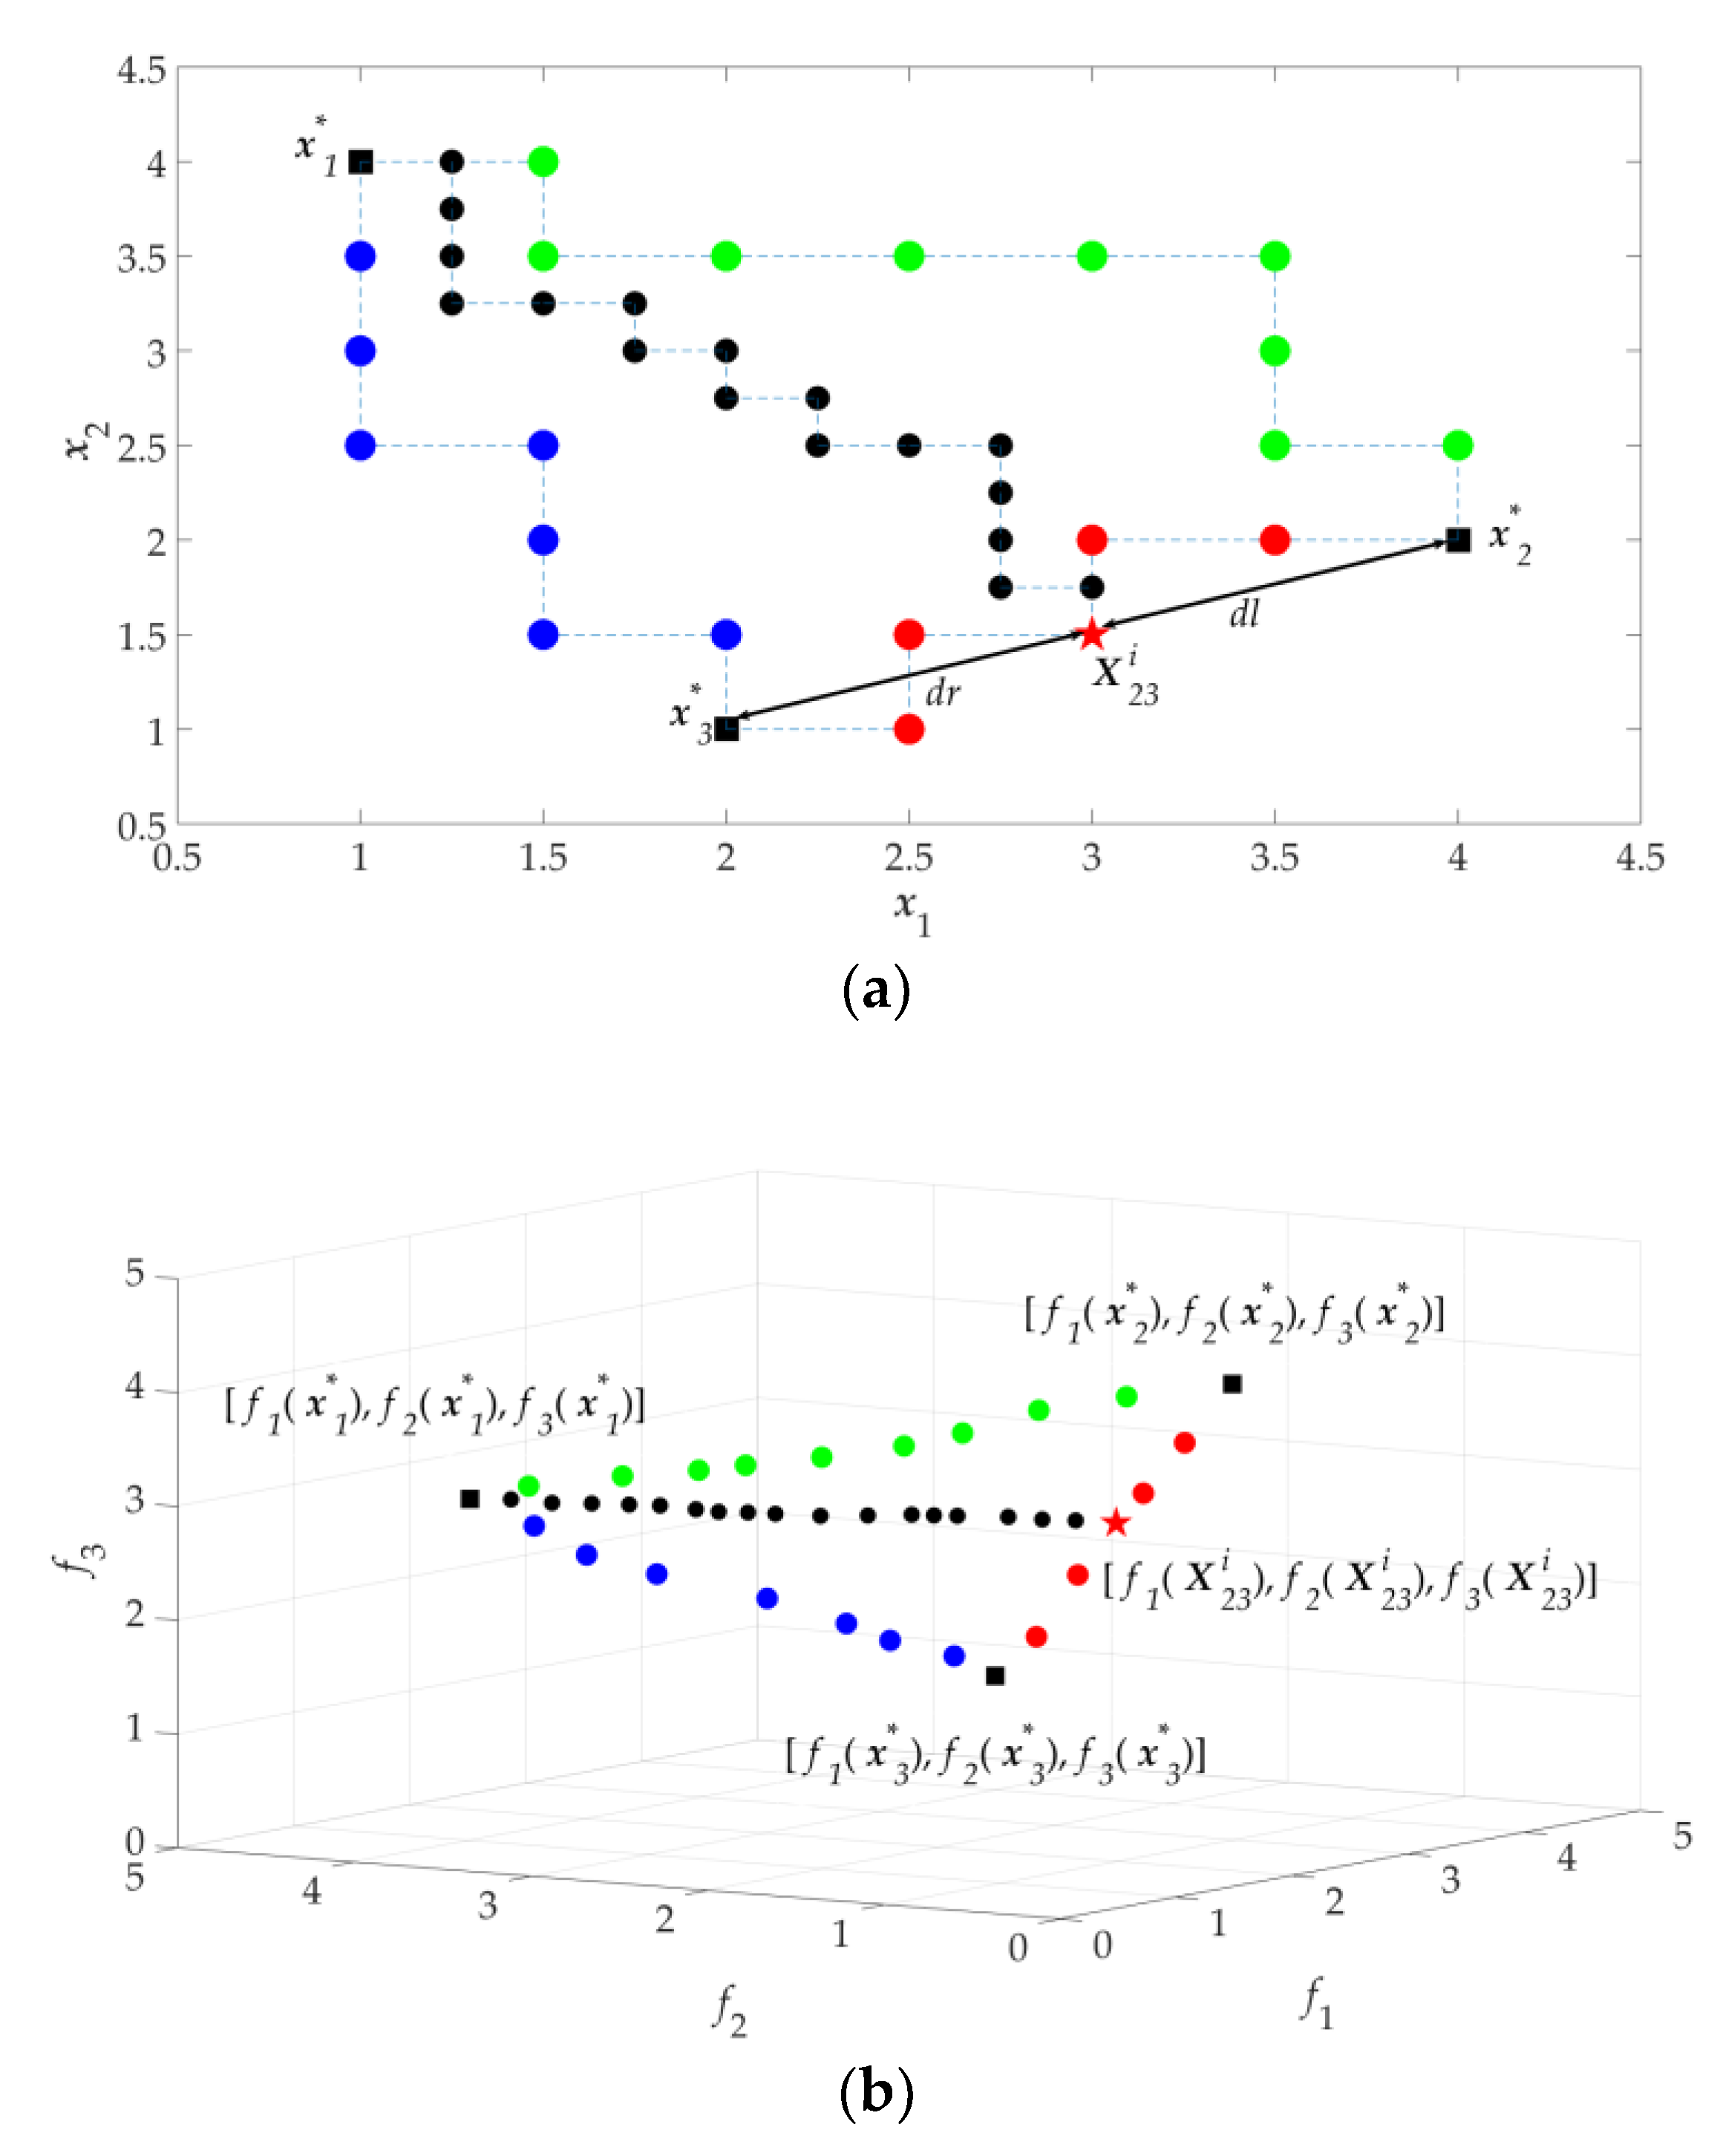
where dl is the distance between X 23 i and x 2 * in the design space, and dr is the distance between X 23 i and x 3 * . When x 1 * and X 23 i are taken as starting points to locate set X 1 by the process mentioned above, the relative location of X 23 i in X 23 affects the selection of the perturbed design. As shown in Figure 7a, if dl < dr, the selection is biased towards x 3 * and if dl > dr, the selection is biased towards x 2 * . Therefore, the weighting factors a and b are necessary to balance the bias. The process to connect x 1 * and X 23 i is illustrated as Figure 7.
When the filling design profile is complete, all the obtained paths and design profiles obtained in Section 2.4 together constitute the initial approximate Pareto set.

2.6. Pareto Set Refinement

In the above method, the initial approximate Pareto set and the corresponding Pareto front are obtained, so there are still many dominated solutions in the result. These dominated solutions are deleted to ensure the results are all non-dominated solutions (the final approximation Pareto set).

2.7. Evaluation

The Diversity Comparison Indicator (DCI) [25] is used to assess the diversity of the obtained Pareto front with respect to the other Pareto fronts. In this method, all the concerned Pareto fronts are compared together and the dominated solutions are removed. The remaining solutions are put into a grid environment. DCI considers the total contribution of each Pareto front to all the nonempty grid cells. The DCI method can only be applied to the assessment of relative diversity of a Pareto front against others rather than providing an absolute measure of distribution for a single Pareto front. The DCI value is a number in the range [0, 1], and the higher the DCI value, the better the distribution of this Pareto front.

3. Illustration and Verification Examples

In this section, we use 4 DTLZ three-objective functions to verify the GSDP algorithm.

3.1. Design Case 1: DTLZ1

The DTLZ1 [26] function is as follows:
D T L Z 1 = { min f 1 ( x ) = 0.5 x 1 x 2 ( 1 + g ( x ) ) min f 2 ( x ) = 0.5 x 1 ( 1 x 2 ) ( 1 + g ( x ) ) min f 3 ( x ) = 0.5 ( 1 x 1 ) ( 1 + g ( x ) ) g ( x ) = 100 ( n 2 + i = 3 n ( ( x i 0.5 ) 2 cos ( 20 π ( x i 0.5 ) ) ) ) ,
where x i means the ith variable of n-dimensional vector parameter x.
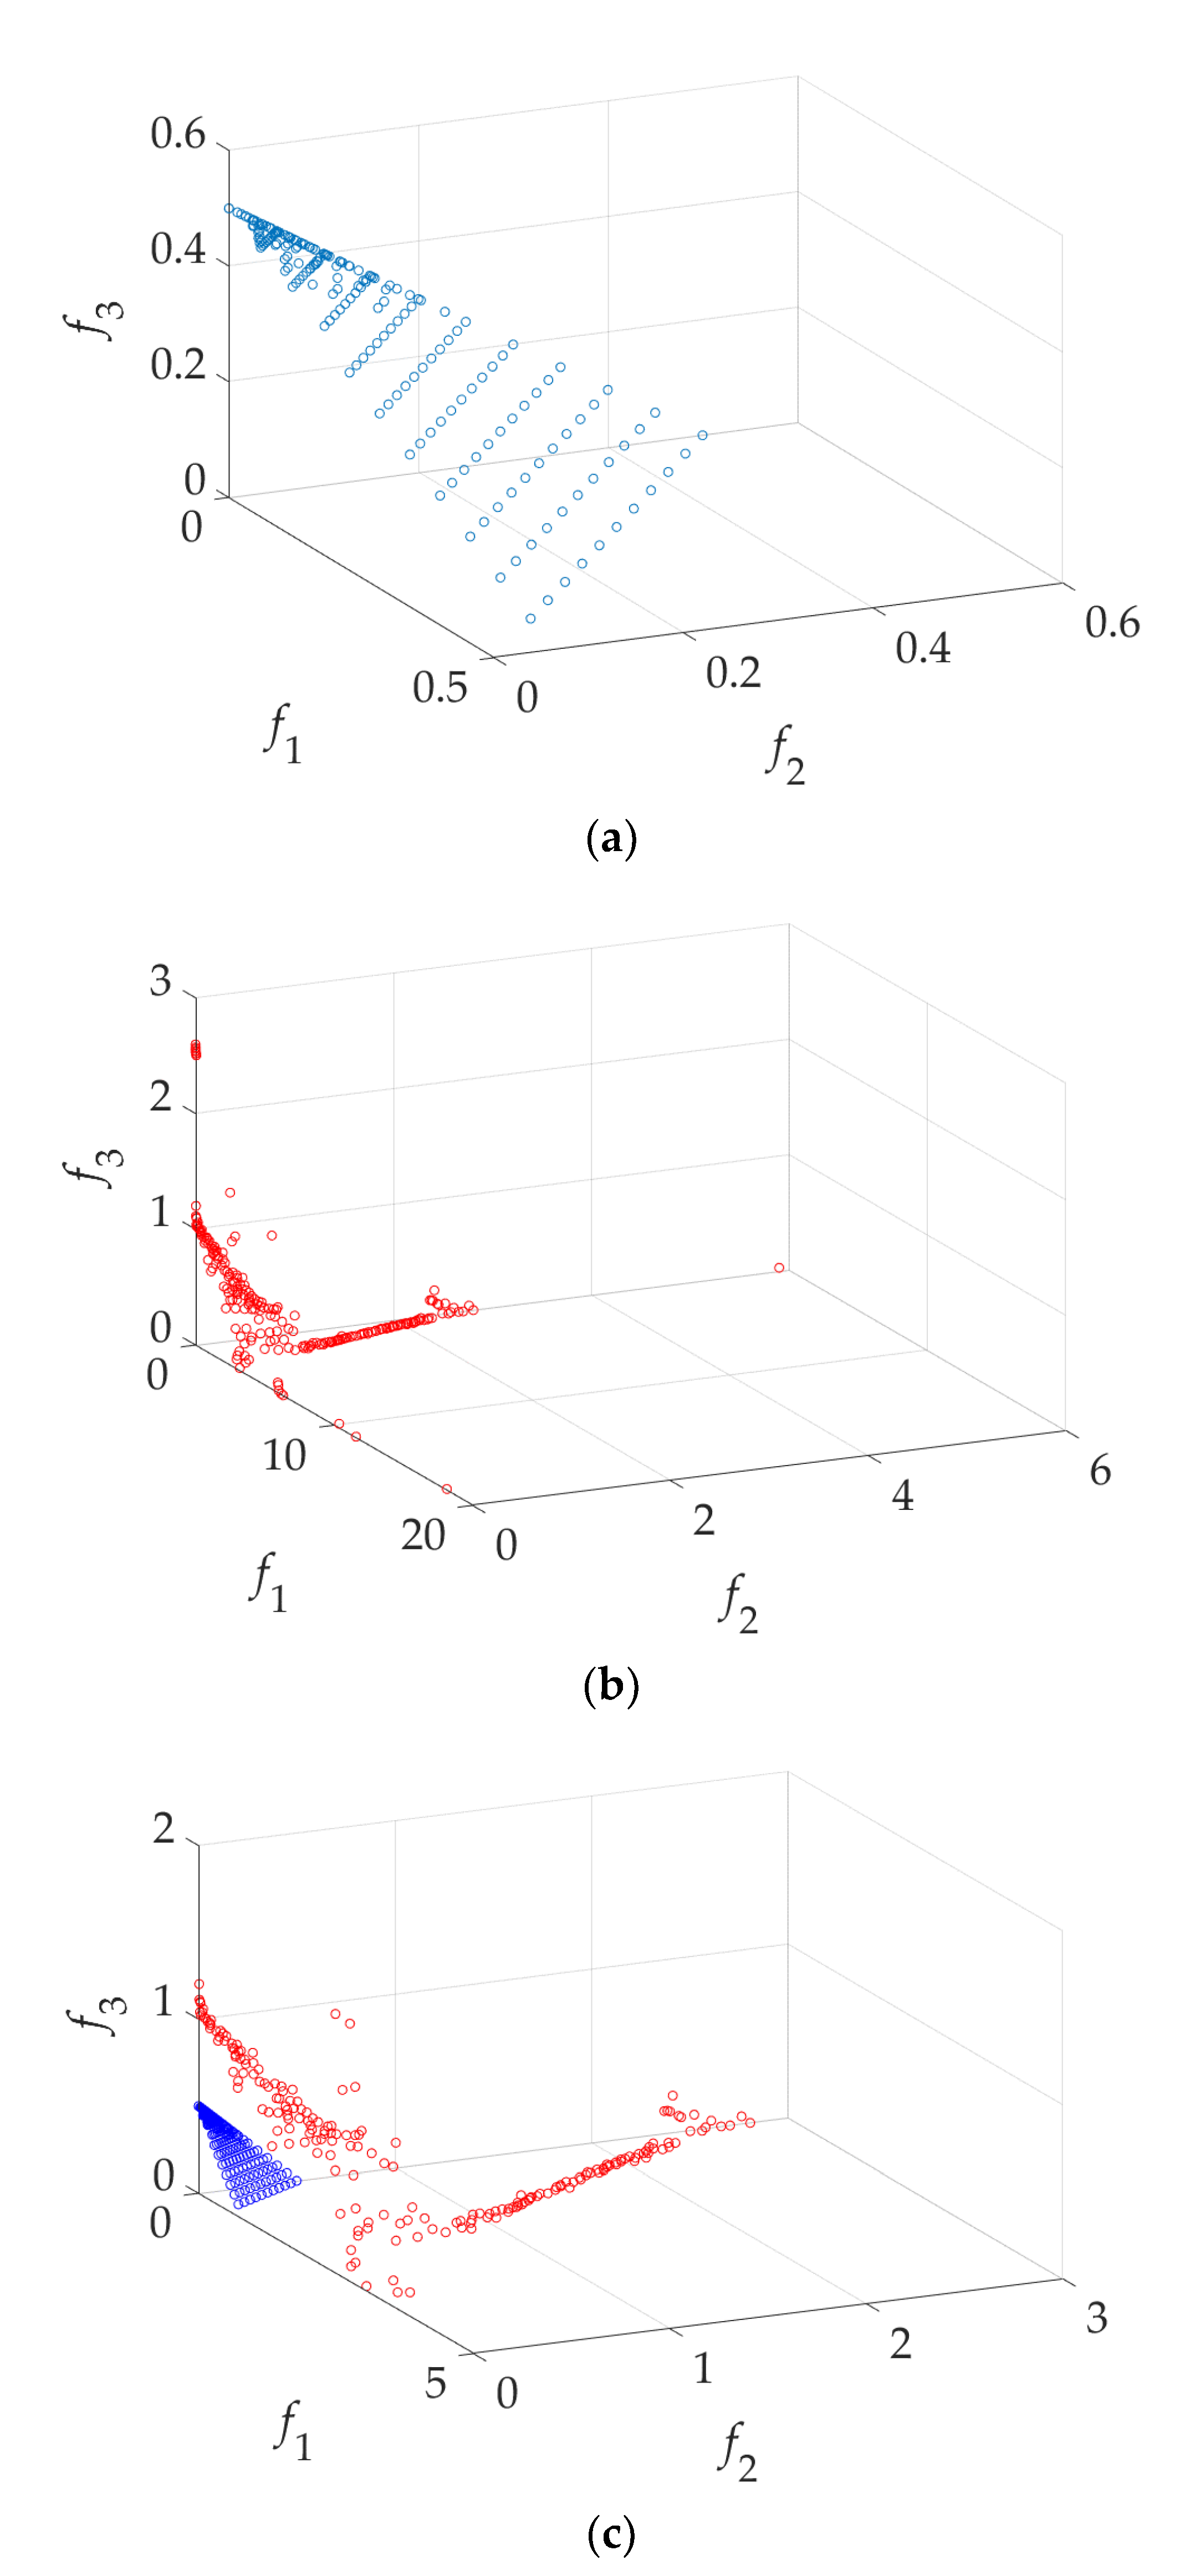
Here, parameter x has a dimension of n = 6. The built-in function in MATLAB fmincon is used with the initial optimization points [0, 0, 0, 1, 1, 1] to obtain the three single-objective optimal solutions, x 1 * = [0.0008, 0.0008, 0.5000, 0.5000, 0.5000, 0.5000], x 2 * = [0.1784, 0.8241, 0.5999, 0.4001, 0.4001, 0.4001], x 3 * = [1.0000, 0.5404, 0.7998, 0.4002, 0.4002, 0.4000]. Then, let the three solutions be the starting points of GSDP. The approximate Pareto front of 233 solutions is obtained by GSDP, and the process costs 5303 f 1 function evaluations, 5394 f 2 function evaluations and 5218 f 3 function evaluations.
As a comparison, (13) is also solved using the built-in function in MATLAB gamultiobj which is a controlled, elitist genetic algorithm (a variant of NSGA-II). To find the approximate Pareto front of 233 solutions, each of the objective functions ( f 1 , f 2 , and f 3 ) is evaluated 105,735 times. The computational cost of GSDP is 95% less than that of NSGA-II. The approximate Pareto fronts P1 and P2 obtained by the GSDP and NSGA-II, respectively, are shown in Figure 8.
By combining P1 and P2 and deleting the dominated solutions, all the 233 solutions in the P1 are retained, while only 37 solutions in the P2 are retained. That means 196 solutions in P2 are dominated by the solutions in P1.
The distribution performances of the obtained two Pareto fronts are evaluated by the Diversity Comparison Indicator (DCI) [25]. In this case, the DCI value of P1 is 0.7667, while the DCI value of P2 is 0.2333.
As demonstrated in this example, GSDP is much more efficient than NSGA-II. Moreover, the distribution of the approximate Pareto front of GSDP is relatively better than that of NSGA-II.

3.2. Design Case 2: DTLZ2

The DTLZ2 [26] function is as follows:
D T L Z 2 = { min f 1 ( x ) = cos ( π 2 x 1 ) cos ( π 2 x 2 ) ( 1 + g ( x ) ) min f 2 ( x ) = cos ( π 2 x 1 ) sin ( π 2 x 2 ) ( 1 + g ( x ) ) min f 3 ( x ) = sin ( π 2 x 1 ) ( 1 + g ( x ) ) g ( x ) = i = 3 n ( x i 0.5 ) 2 ,
where x i means the ith variable of the n-dimensional vector parameter x.
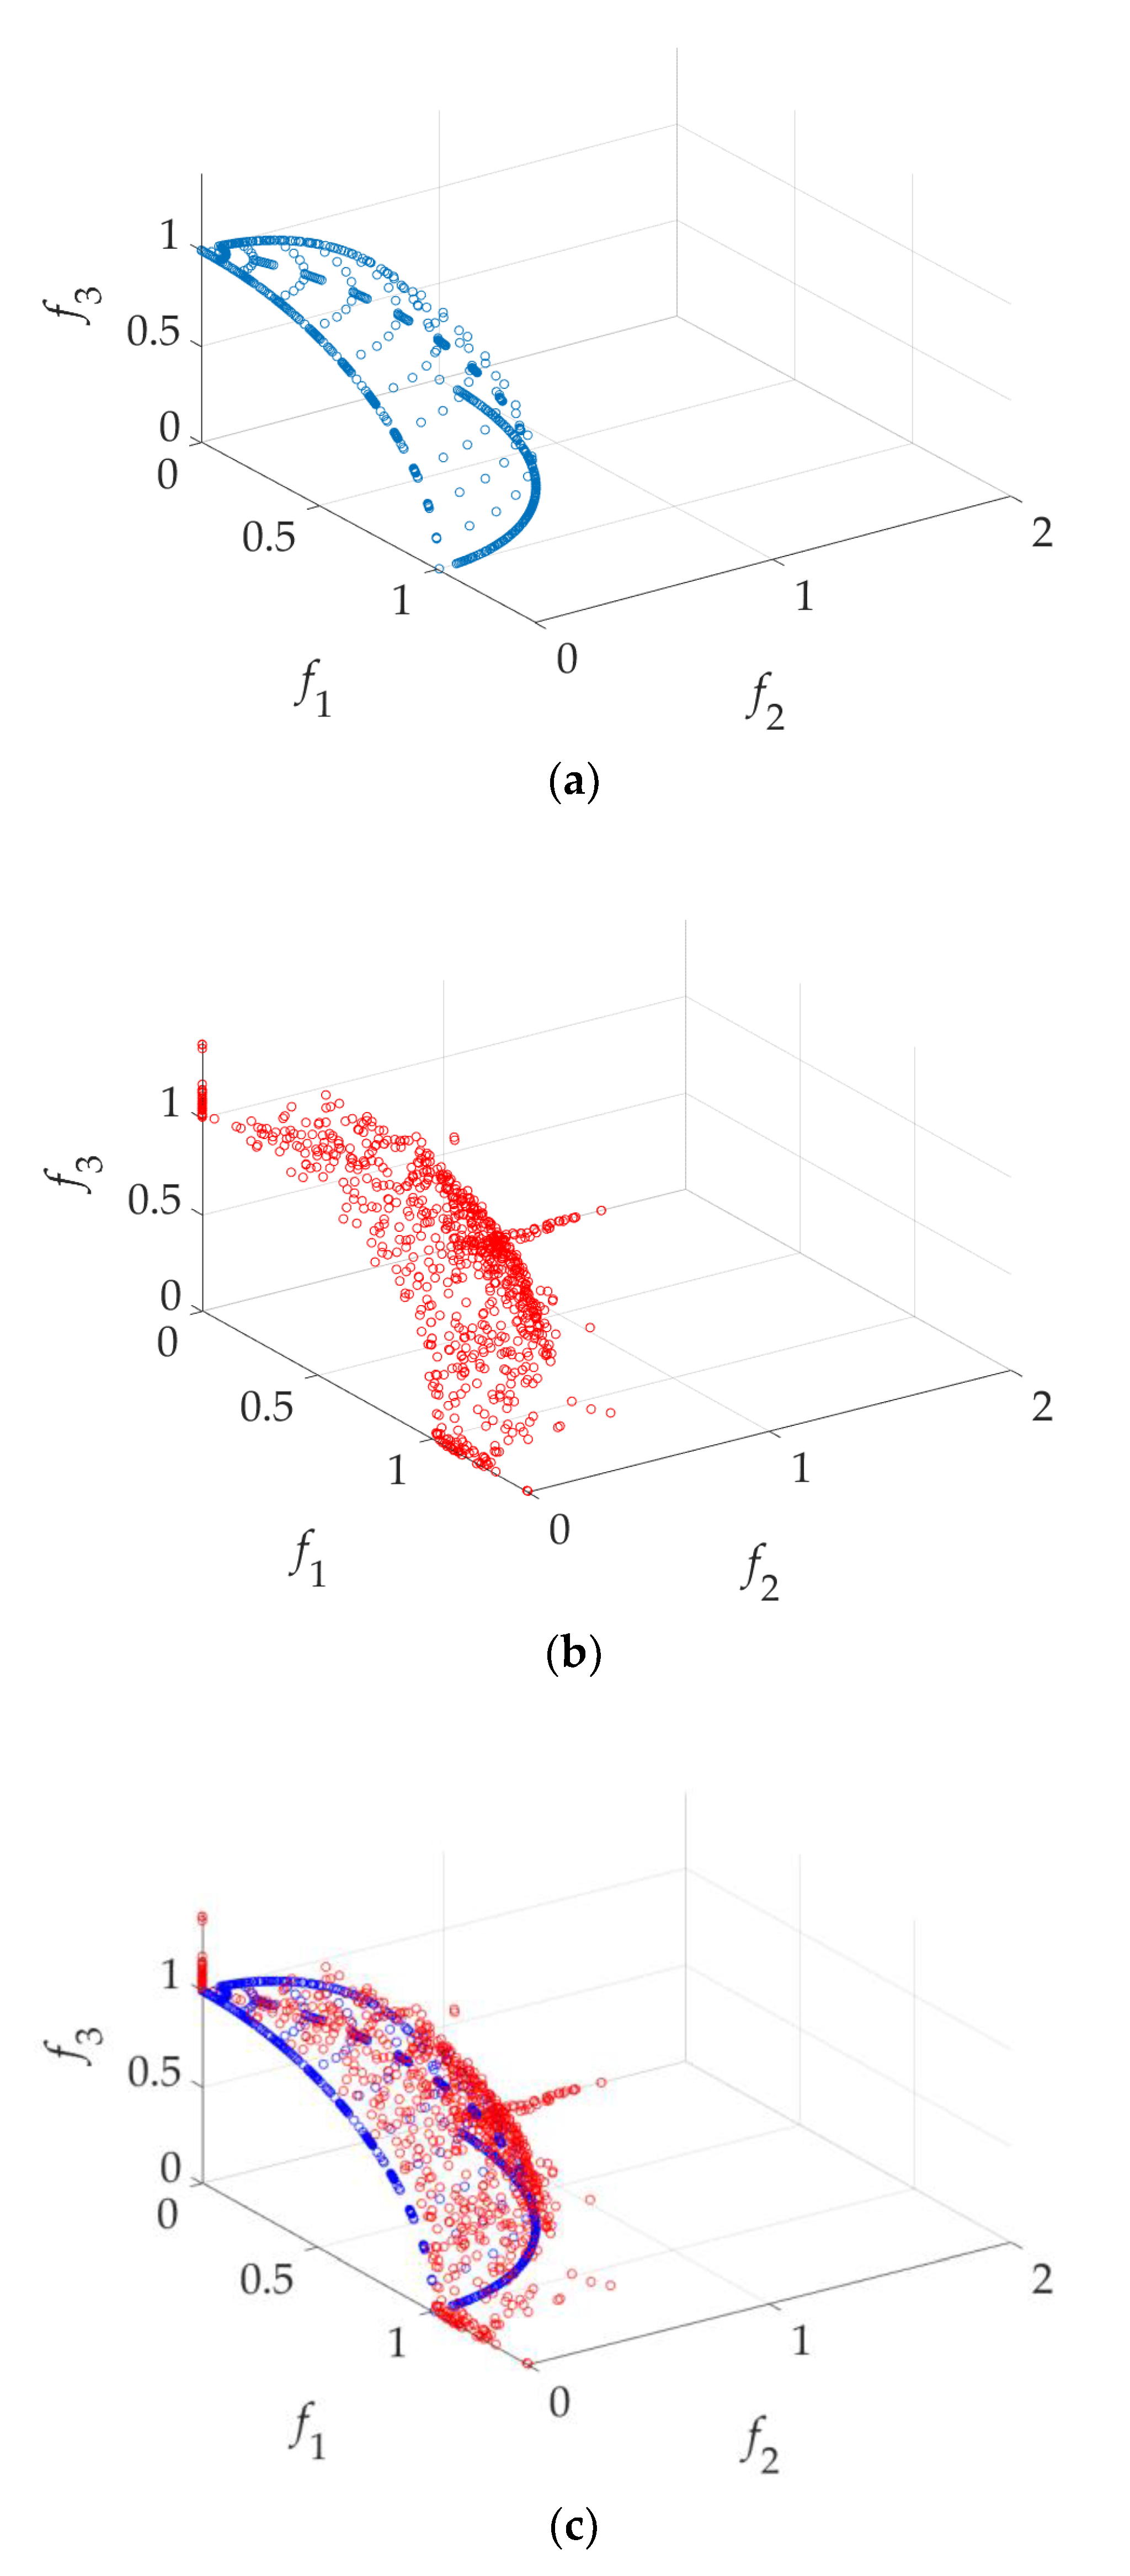
At n = 9, the built-in function in MATLAB fmincon is used with the initial optimization points [0, 0, 0, 1, 1, 0, 0, 1, 0] to obtain the three single-objective optimal solutions x 1 * = [0.9994, 0.9994, 0.5038, 0.4962, 0.4962, 0.5038, 0.5038, 0.4962, 0.5038], x 2 * = [0.9524, 0.0077, 0.5004, 0.4996, 0.4996, 0.5004, 0.5004, 0.4996, 0.5004], x 3 * = [0.0000, 0.4907, 0.5069, 0.4931, 0.4931, 0.5069, 0.5069, 0.4931, 0.5069]. Then, let the three solutions be the starting points of GSDP. The approximate Pareto front of 833 solutions is obtained by GSDP, and the process costs 6328 f 1 function evaluations, 9208 f 2 function evaluations and 6270 f 3 function evaluations.
As a comparison, NSGA-II is used to obtain 833 solutions of the approximate Pareto front. Each objective function is evaluated 268,940 times. GSDP saves about 97% of computational cost compared to NSGA-II. The approximate Pareto fronts P1 and P2 obtained by the GSDP and NSGA-II, respectively, are shown in Figure 9.
After combining P1 and P2 and deleting the dominated solutions, all 833 solutions in the P1 are retained, while only 454 solutions in the P2 are retained. The DCI values of P1 and P2 are 0.4840 and 0.5426, respectively. Although the DCI of P1 is slightly less than that of P2, the GSDP has absolute advantages in terms of computational cost.

3.3. Design Case Validation Summary

In addition to the above test results, the GSDP method is tested using more three-objective functions with variables of various dimensions. We summarize the results in Table 1. P1 and P2 represent the approximate Pareto fronts obtained by the GSDP and NSGA-II, respectively. P1 and P2 have the same number of solutions. It can be seen that for a variety of problems and variable dimensions, the GSDP method performs better than or similar to NSGA-II in terms of distribution, but GSDP saves more than 85% in computational cost for all the testing cases.

4. UWB Antenna Multi-Objective Design Example

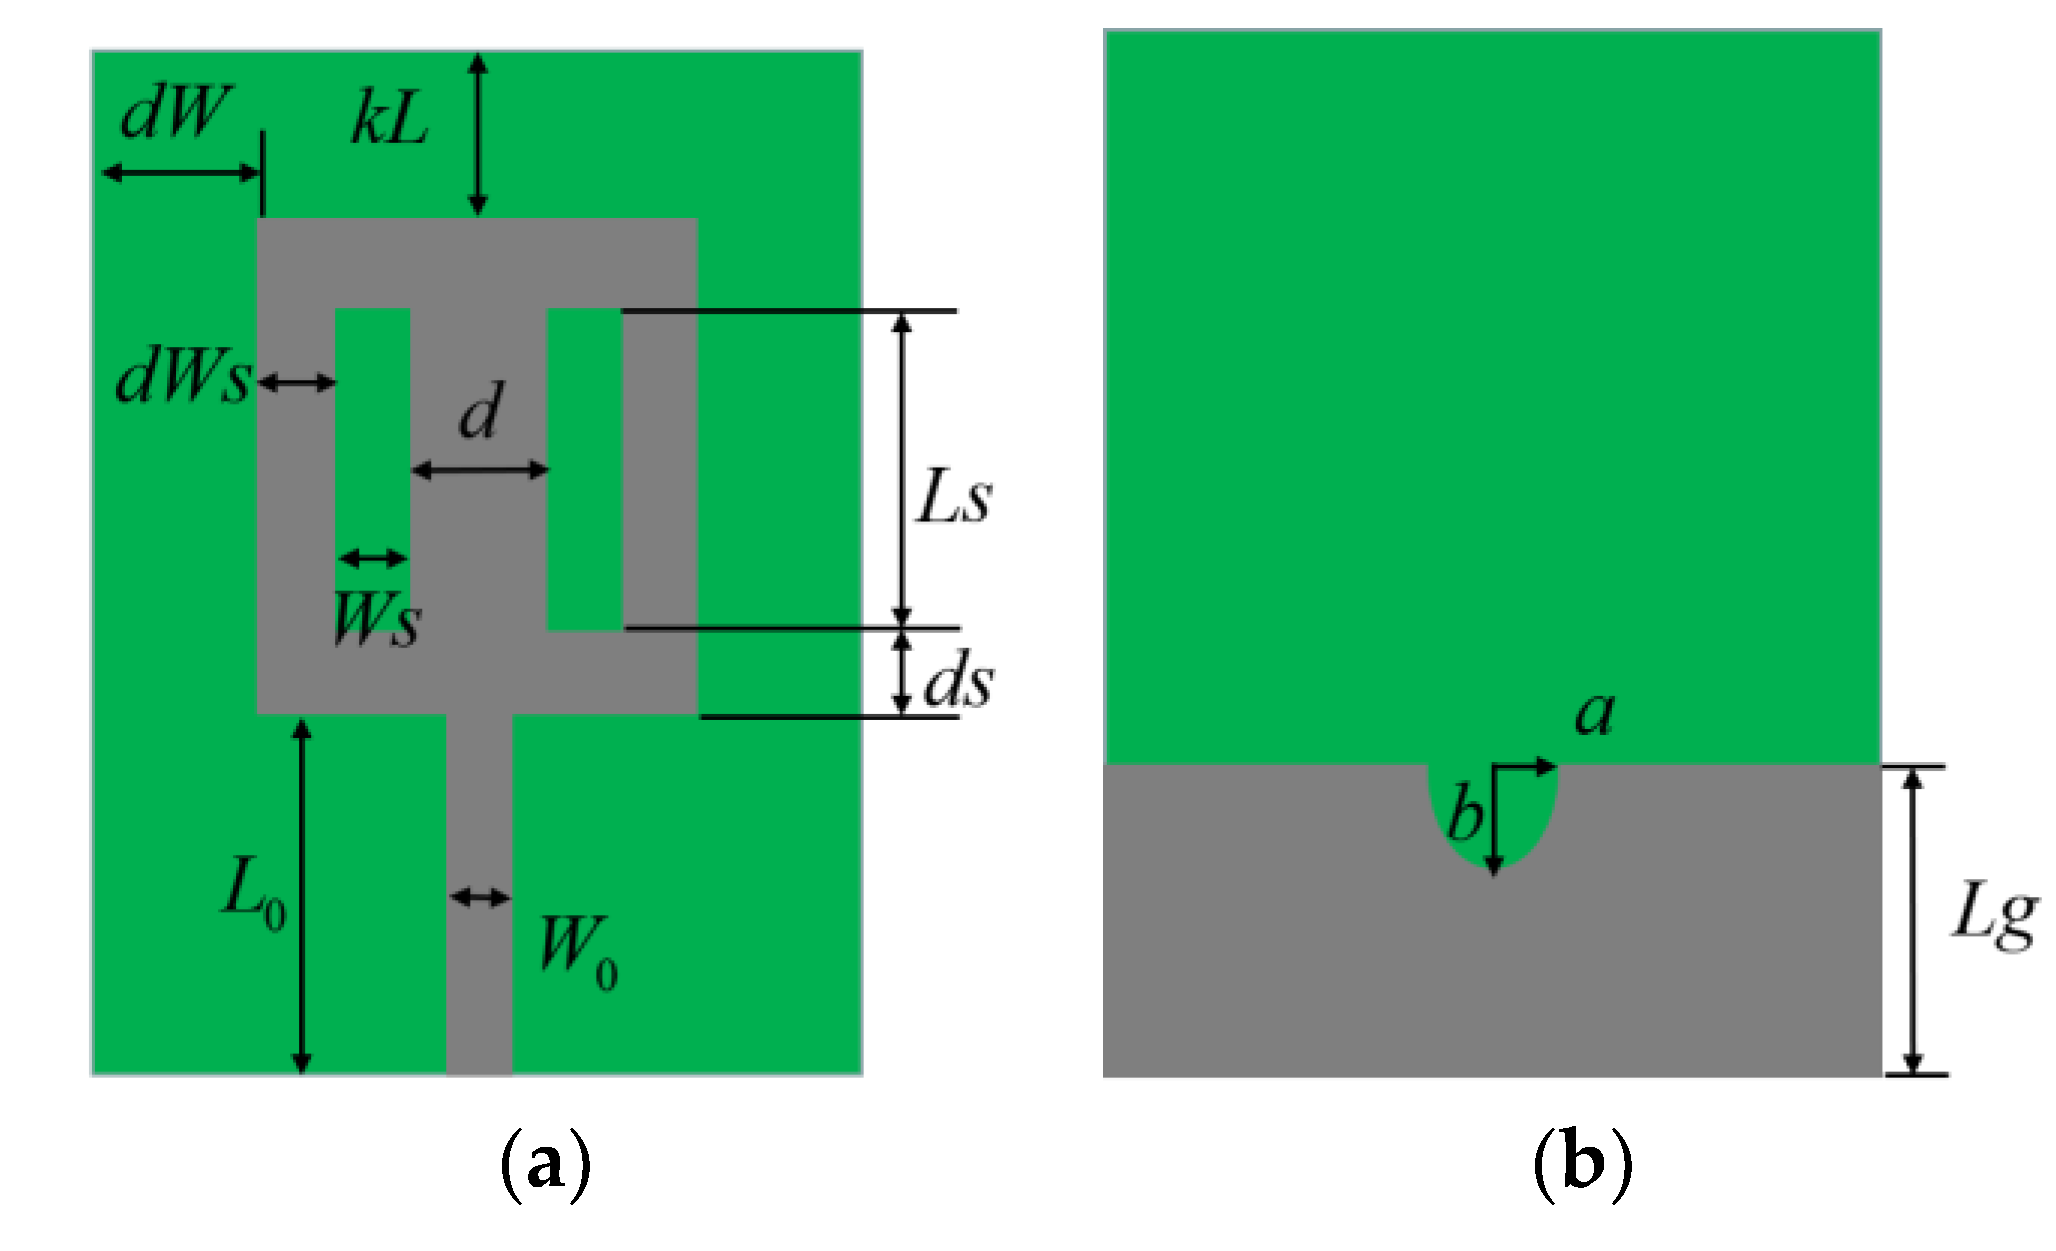
The proposed GSDP method is applied to the multi-objective optimization of a microwave device: a UWB antenna [27]. The antenna is implemented on an FR4 substrate (ε = 4.3, h = 1.55 mm, tanδ = 0.02). Here, f 1 (the first objective) is used to minimize | S 11 | ( dB ) between 4 GHz and 10 GHz, while f 2 (the second objective) is used to minimize the difference of the realized gain between 4 GHz and 10 GHz and f 3 (the third objective) is used to minimize the UWB antenna size. The antenna structure and design parameter vector x = [ a , b , d , k L , d s , d W , d W s , L 0 , L g , L s , W s ] are shown in Figure 10.
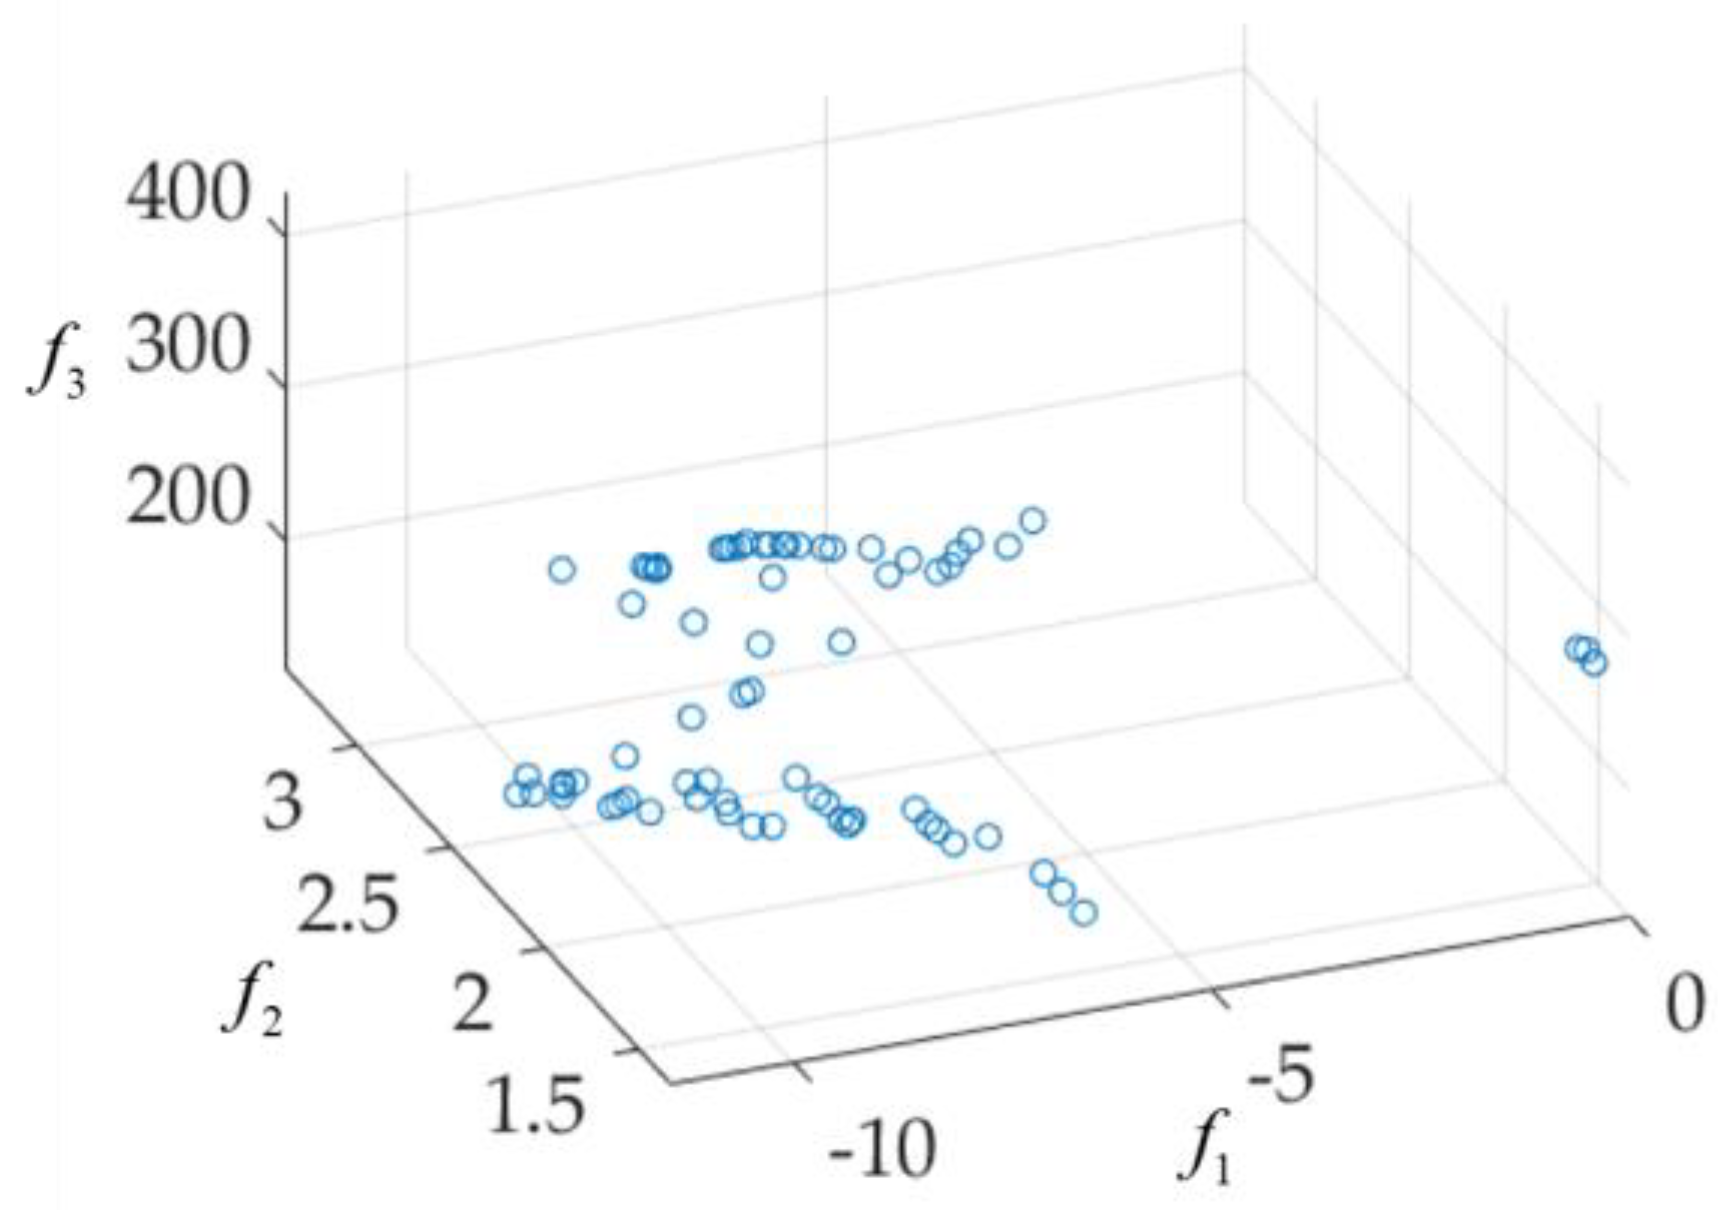
Here, W 0 = 0.731 is fixed. The first step of the GSDP method is to find the three extreme optimal design solutions using single-objective optimization (here, a genetic algorithm is used): x 1 * = [1.1149, 0.5310, 4.3989, 6.2208, 1.4515, 2.3120, 1.3032, 12.5860, 8.6279, 8.0845, 0.5176], x 2 * = [0.5991, 0.4793, 4.9893, 6.4903, 1.7809, 2.0737, 2.5576, 9.5941, 6.2921, 8.8158, 0.4254], x 3 * = [1.1813, 0.3480, 2.3139, 3.6562, 0.6466, 1.1315, 1.1168, 5.3947, 3.6096, 5.3438, 0.2531]. Then, the approximate Pareto front is found by GSDP as shown in Figure 11.
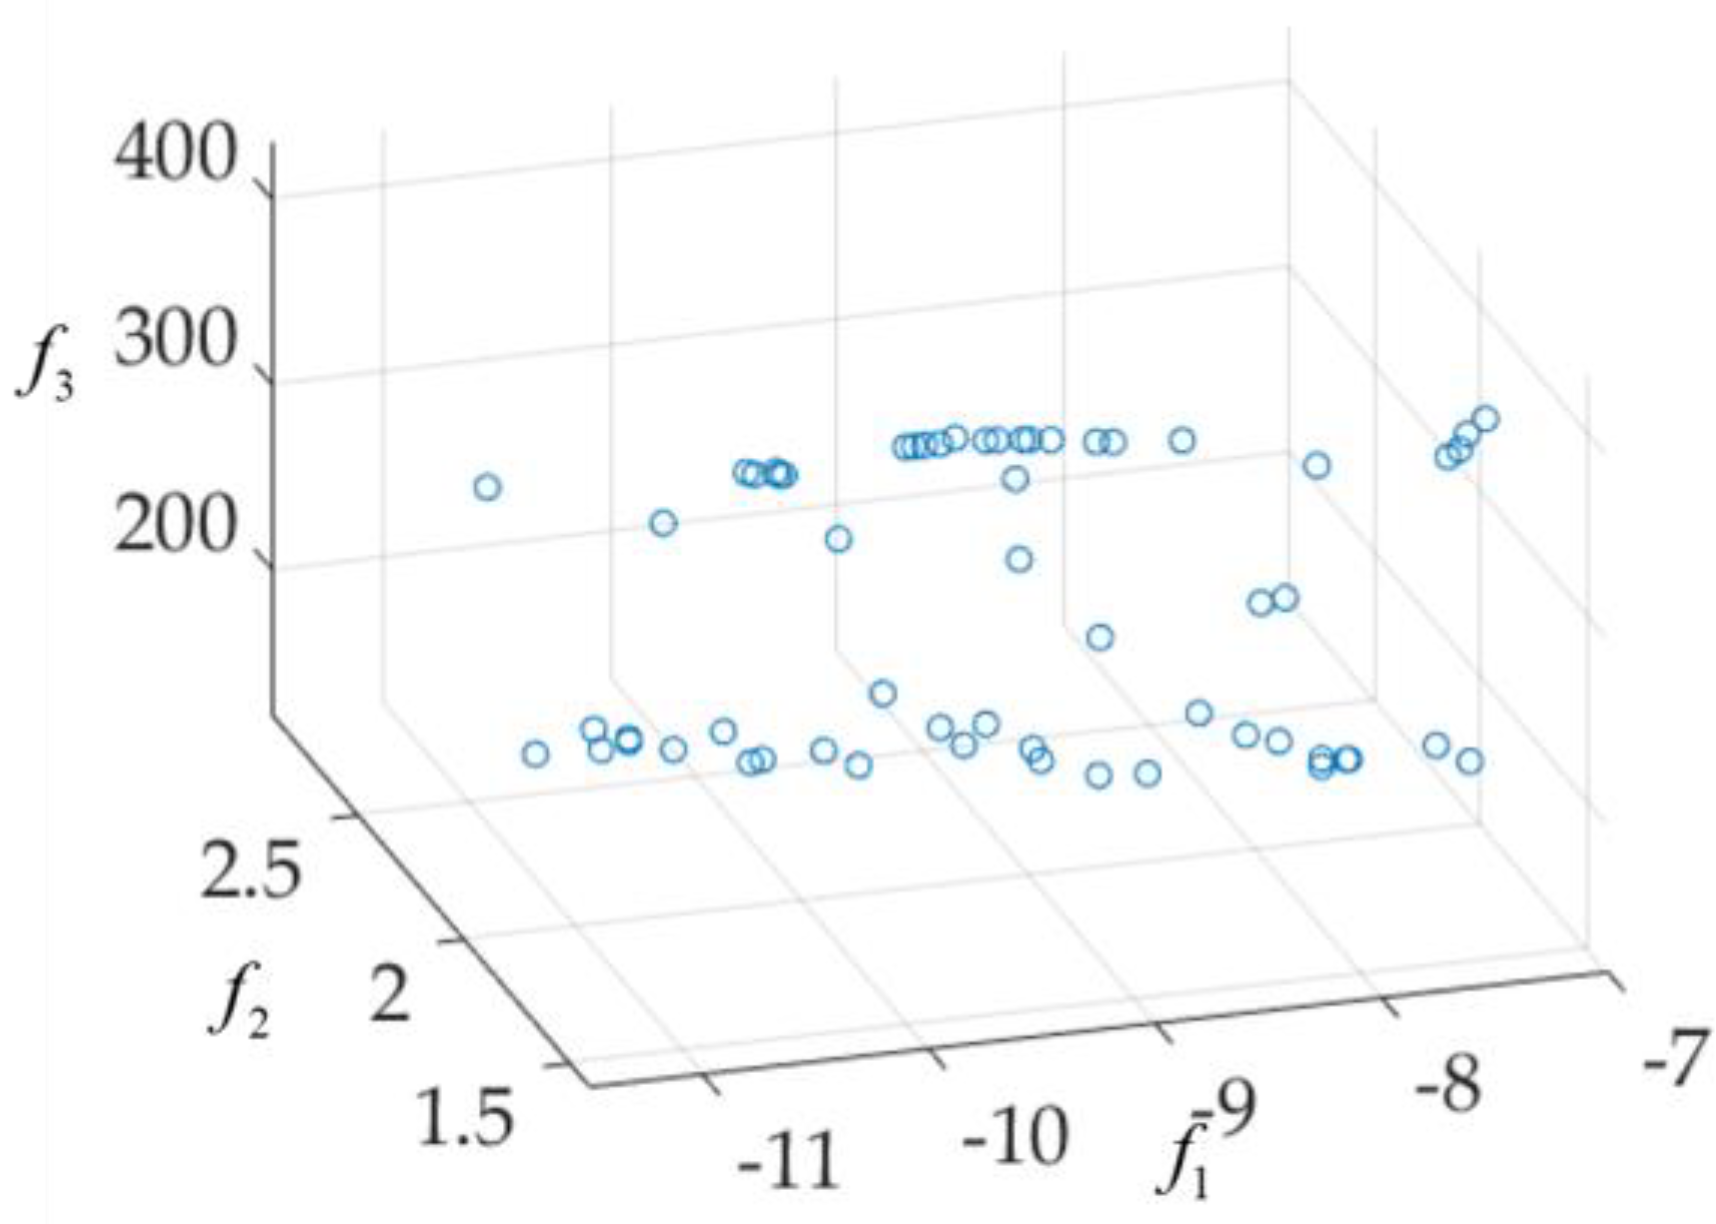
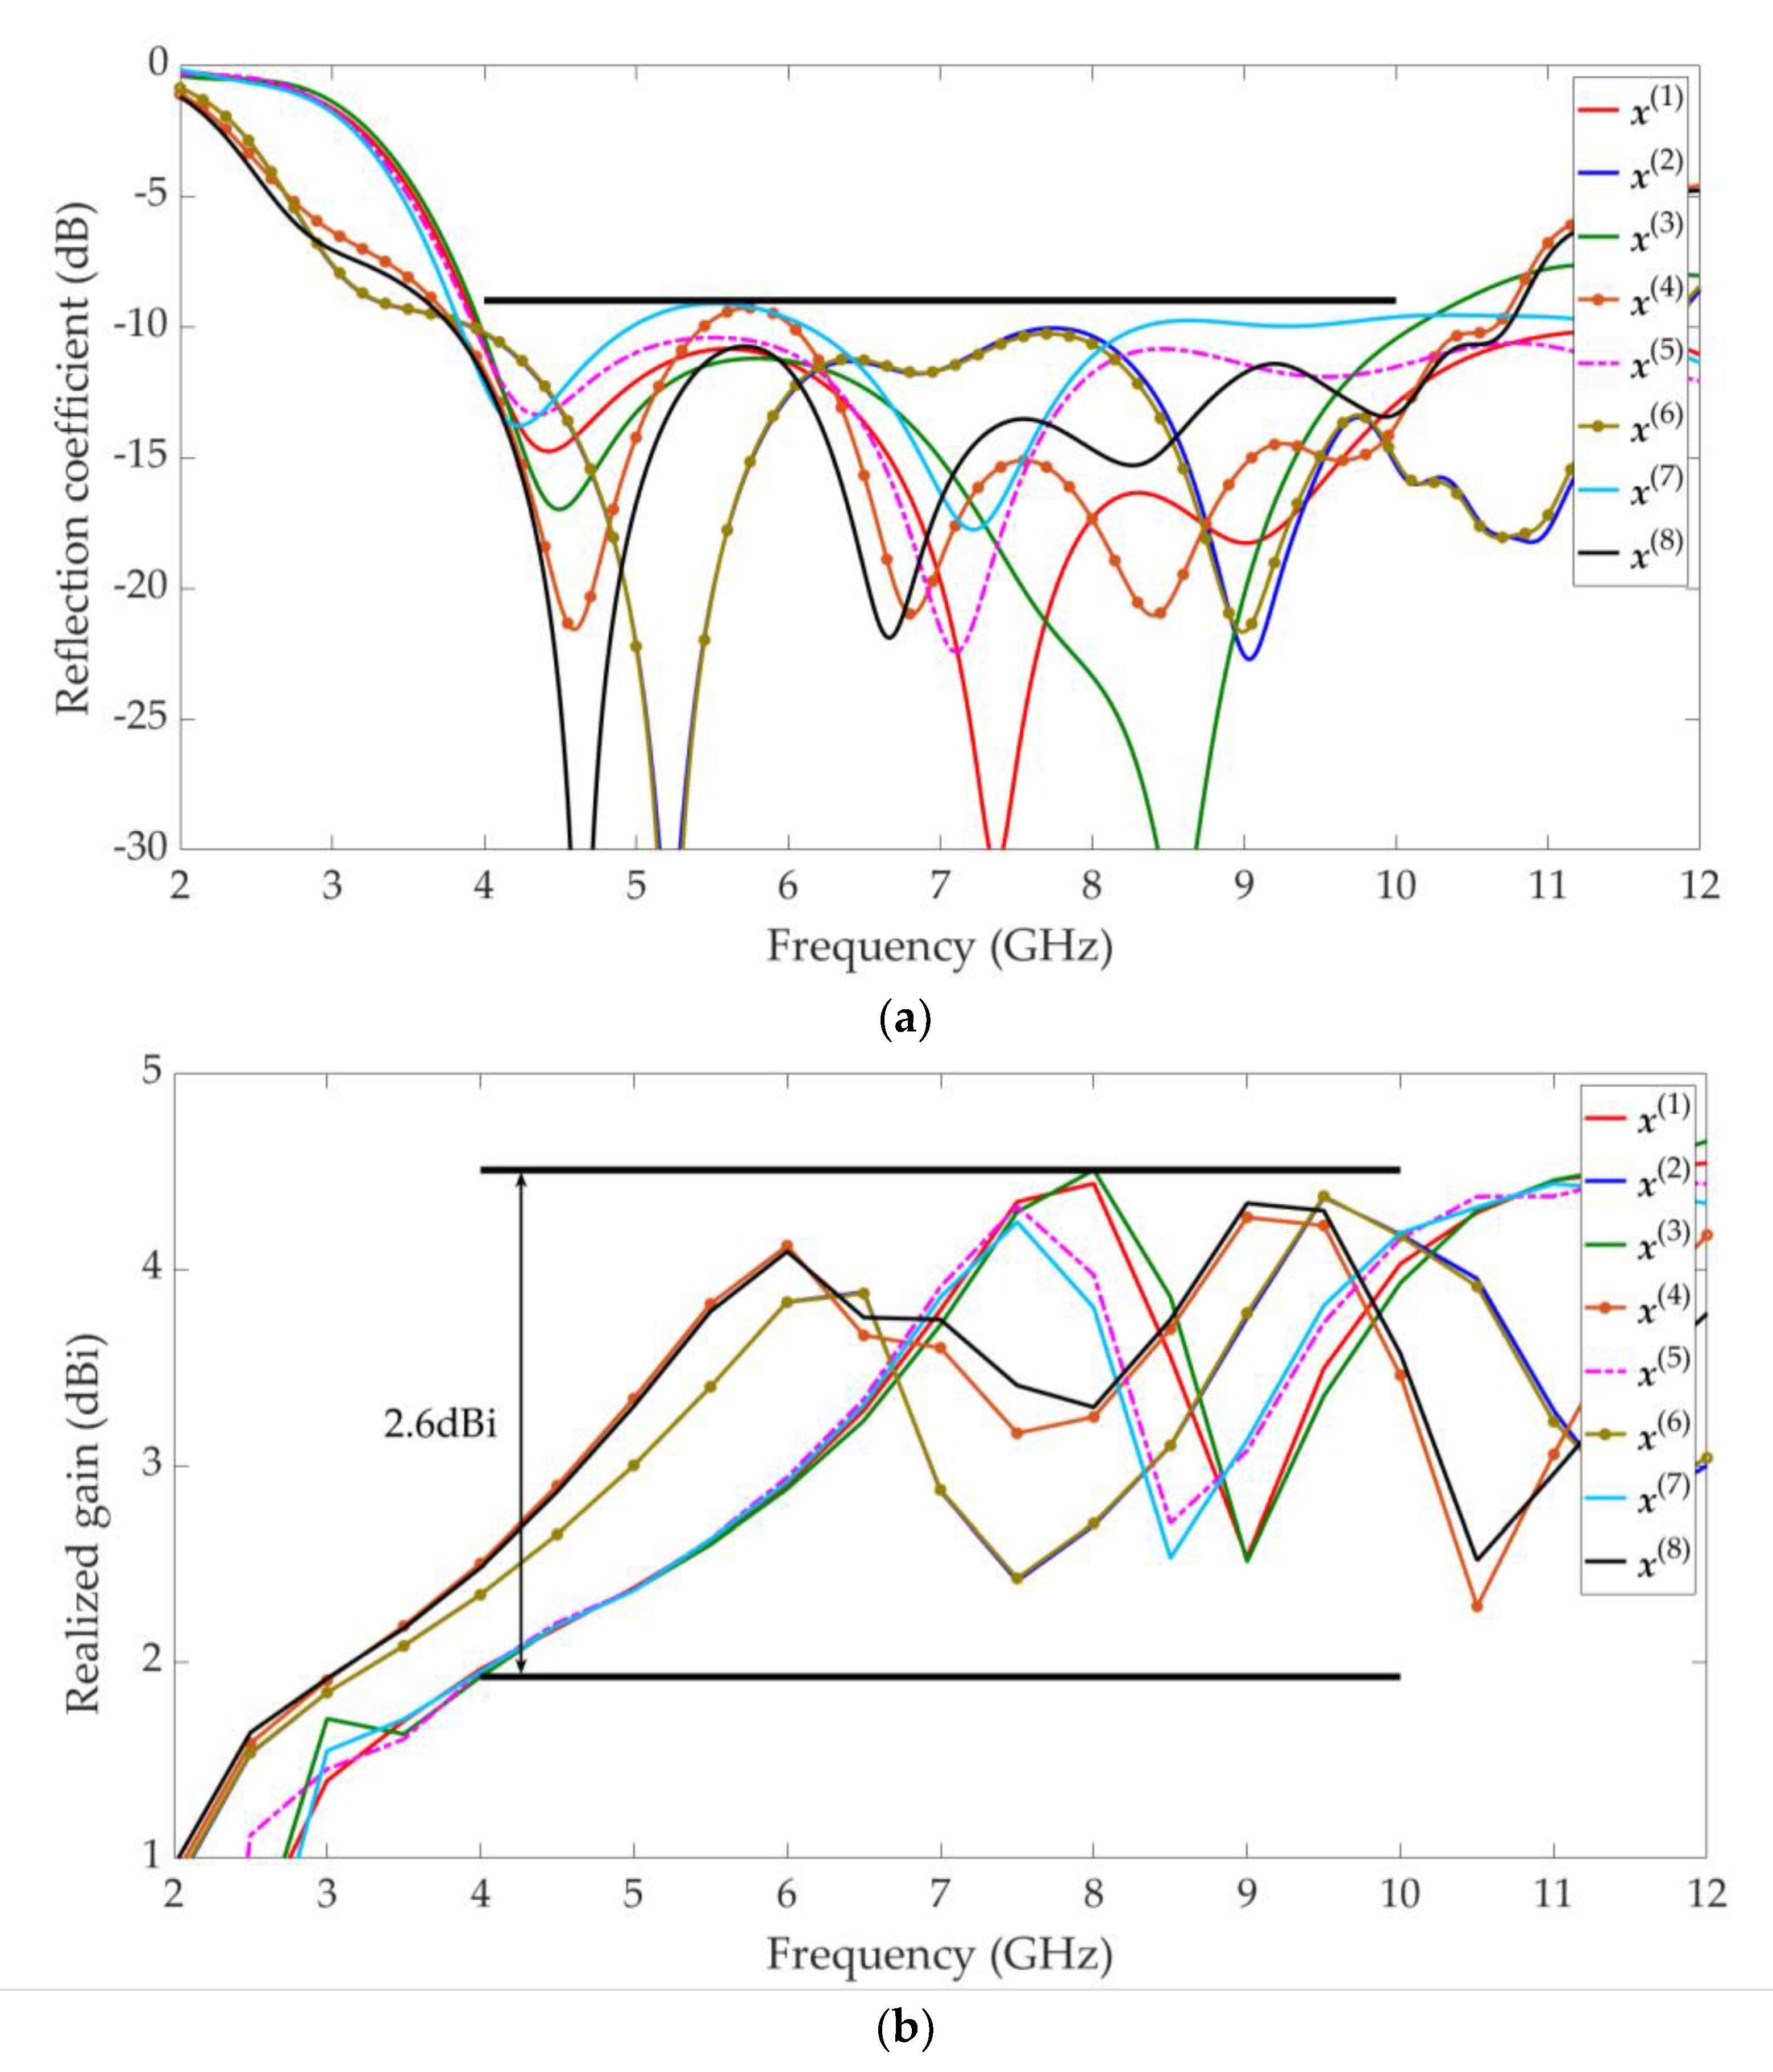
Some of the solutions in the Pareto front shown in Figure 11 may not applicable to the design of UWB antennae. For example, the f 1 ( | S 11 | ) value is greater than −7 dB. These solutions are discarded. Then, the final UWB antenna multi-objective design results are shown in Figure 12. Eight solutions ( x ( 1 ) , x ( 2 ) , …, x ( 8 ) ) are selected according to customized specifications (e.g., all are below −9 dB between 4 GHz and 10 GHz, all the realized gain (dBi) variation are below 2.6 between 4 GHz and 10 GHz, and sizes are below 400 mm2). Their objective values and parameter values are shown in Table 2. The S 11 ( dB ) responses (reflection coefficient) and the realized gain (dBi) are shown in Figure 13.
A total of 3466 CST simulations are used to optimize the UWB antenna, which includes 1600 simulations to obtain the extreme optimal solutions (single-objective optimization process). This takes about 48.14 h on an Intel(R) Core i5-6500 processor with 8 GB RAM. If the NSGA-II method were used for the three-objective optimization of this UWB antenna (11 design variables), the computational cost is estimated at more than 100,000 CST EM simulations (see DTLZ2(11) in Table 1), which is prohibitive.

5. Conclusions

An efficient multi-objective optimization method (GSDP) for EM-based microwave device design is presented. The GSDP method generalizes the SDP method to solve multi-objective problems of both two and three objectives. The GSDP method includes four parts: (i) determining the extreme Pareto-optimal designs; (ii) determining the design profile; (iii) filling the design profile; and (iv) refining the Pareto set. Each part is described in detail. The GSDP method is compared to NSGA-II in terms of computational efficiency and the performances of Pareto fronts. The GSDP method saves more than 85% in computational cost compared to NSGA-II with similar or better performance in terms of Pareto front distribution (DCI). A UWB antenna multi-objective EM-based design example demonstrates the efficiency of GSDP in finding the approximate Pareto set (front). Selected designs from the approximate Pareto set satisfy all three customized specifications.

Author Contributions

Y.L., Q.S.C. and S.K. devised the research and wrote the paper; Y.L. and Q.S.C. designed algorithms and the experiments; Y.L. and Q.S.C. improved the English. All authors have read and approved the final manuscript.

Funding

This research was funded by National Natural Science Foundation of China Grant, 61471258 and by Science & Technology Innovation Committee of Shenzhen Municipality Grant, KQJSCX20170328153625183.

Conflicts of Interest

The authors declare no conflict of interest.

References

  1. Chadebec, O.; Coulomb, J.L.; Janet, F. A review of magnetostatic moment method. IEEE Trans. Magn. 2006, 42, 515–520. [Google Scholar] [CrossRef] [Green Version]
  2. Wu, Y.; Wassell, I. Introduction to the Segmented Finite-Difference Time-Domain Method. IEEE Trans. Magn. 2009, 45, 1364–1367. [Google Scholar]
  3. Dennis, J.E. Quasi-Newton Methods, Motivation and Theory. Siam Rev. 1977, 19, 46–89. [Google Scholar] [CrossRef] [Green Version]
  4. Konak, A.; Coit, D.W.; Smith, A.E. Multi-objective optimization using genetic algorithms: A tutorial. Reliab. Eng. Syst. Saf. 2006, 91, 992–1007. [Google Scholar] [CrossRef]
  5. Koziel, S.; Bekasiewicz, A.; Zieniutycz, W. Expedited EM-Driven Multiobjective Antenna Design in Highly Dimensional Parameter Spaces, Motivation and Theory. IEEE Antennas Wirel. Propag. Lett. 2014, 13, 631–634. [Google Scholar] [CrossRef]
  6. Hsieh, L.H.; Chang, K. Compact, low insertion-loss, sharp-rejection, and wide-band microstrip bandpass filters. IEEE Trans. Microw. Theory Tech. 2003, 51, 1241–1246. [Google Scholar] [CrossRef]
  7. Koziel, S.; Ogurtsov, S. Multi-Objective Design of Antennas Using Variable-Fidelity Simulations and Surrogate Models. IEEE Trans. Antennas Propag. 2013, 61, 5931–5939. [Google Scholar] [CrossRef]
  8. Coello, C.A.C. Evolutionary Multi-Objective Optimization a Historical View of the Field. IEEE Comput. Int. Mag. 2006, 1, 28–36. [Google Scholar] [CrossRef]
  9. Rütschlin, M.; Wittig, T. State of the Art Antenna Simulation with CST STUDIO SUITE. In Proceedings of the 2015 9th European Conference on Antennas and Propagation, Lisbon, Portugal, 7–12 April 2015. [Google Scholar]
  10. Dar, S.H.; Ahmed, Z.; Ihsan, M.B. Characterization of Waveguide Slots Using Full Wave EM Analysis Software HFSS. In Proceedings of the 2008 IEEE International Multitopic Conference, Karachi, Pakistan, 23–24 December 2008. [Google Scholar]
  11. Torczon, V. On the Convergence of Pattern Search Algorithms. SIAM J. Optim. 1997, 7, 1–25. [Google Scholar] [CrossRef]
  12. Deb, K.; Pratap, A.; Agarwal, S.; Meyarivan, T. A fast and elitist multiobjective genetic algorithm: NSGA-II. IEEE Trans. Evol. Comput. 2002, 6, 182–197. [Google Scholar] [CrossRef] [Green Version]
  13. Sha, D.; Lin, H.-H. A multi-objective PSO for job-shop scheduling problems. Expert Syst. Appl. 2010, 37, 1065–1070. [Google Scholar] [CrossRef]
  14. Leal-Romo, F.; Moreyra-González, R.; Rayas-Sánchez, J.E. HFSS Automated Driver Based on Non-GUI Scripting for EM-Based Design of High-Frequency Circuits. In Proceedings of the 2012 IEEE 3rd Latin American Symposium on Circuits and Systems (LASCAS), Playa del Carmen, Mexico, 29 February–2 March 2012. [Google Scholar]
  15. Bandler, J.W.; Cheng, Q.S.; Gebre-Mariam, D.H.; Madsen, K.; Pedersen, F.; Sondergaard, J. EM-Based Surrogate Modeling and Design Exploiting Implicit, Frequency and Output Space Mappings. In Proceedings of the IEEE MTT-S International Microwave Symposium Digest, Philadelphia, PA, USA, 10–15 July 2003. [Google Scholar]
  16. Rayas-Sánchez, J.E.; Estrada-Arámbula, E. EM-Based Design Optimization of Microstrip Lines Traversing a Rectangular Gap in the Reference Plane. In Proceedings of the 2012 International Conference on Synthesis, Modeling, Analysis and Simulation Methods and Applications to Circuit Design (SMACD), Seville, Spain, 19–21 September 2012. [Google Scholar]
  17. Koziel, S.; Sigurasson, A.T. Multi-Objective Design of Antennas Using Variable-Fidelity EM Models and Constrained Surrogates. In Proceedings of the 2018 IEEE International Symposium on Antennas and Propagation & USNC/URSI National Radio Science Meeting, Boston, MA, USA, 8–13 July 2018. [Google Scholar]
  18. Koziel, S.; Ogurtsov, S.; Zieniutycz, W.; Bekasiewicz, A. Design of a Planar UWB Dipole Antenna with an Integrated Balun Using Surrogate-Based Optimization. IEEE Antennas Wirel. Propag. Lett. 2015, 14, 366–369. [Google Scholar] [CrossRef]
  19. Akinsolu, M.O.; Liu, B.; Grout, V.; Lazaridis, P.I.; Mognaschi, M.E.; Di Barba, P. A Parallel Surrogate Model Assisted Evolutionary Algorithm for Electromagnetic Design Optimization. IEEE Trans. Emerg. Top. Comput. Intell. 2019, 3, 93–105. [Google Scholar] [CrossRef] [Green Version]
  20. Feng, F.; Zhang, C.; Na, W.; Zhang, J.; Zhang, W.; Zhang, Q.J. Adaptive Feature Zero Assisted Surrogate-Based EM Optimization for Microwave Filter Design. IEEE Microw. Wirel. Components Lett. 2019, 29, 2–4. [Google Scholar] [CrossRef]
  21. Koziel, S.; Bekasiewicz, A. Multi-Objective Antenna Design by Means of Sequential Domain Patching. IEEE Antennas Wirel. Propag. Lett. 2016, 15, 1089–1092. [Google Scholar] [CrossRef]
  22. Lee, L.H.; Chew, E.P.; Teng, S.; Goldsman, D. Finding the non-dominated Pareto set for multi-objective simulation models. IIE Trans. 2010, 42, 656–674. [Google Scholar] [CrossRef]
  23. Kim, I.; De Weck, O. Adaptive weighted-sum method for bi-objective optimization: Pareto front generation. Struct. Multidiscip. Optim. 2004, 29, 149–158. [Google Scholar] [CrossRef]
  24. Koziel, S.; Bekasiewicz, A. Multi-objective design optimization of antenna structures using sequential domain patching with automated patch size determination. Eng. Optim. 2017, 50, 218–234. [Google Scholar] [CrossRef]
  25. Li, M.; Yang, S.; Liu, X. Diversity Comparison of Pareto Front Approximations in Many-Objective Optimization. IEEE Trans. Cybern. 2014, 44, 2568–2584. [Google Scholar] [PubMed]
  26. Deb, K.; Thiele, L.; Laumanns, M.; Zitzler, E. Scalable Multi-Objective Optimization Test Problems. In Proceedings of the 2002 Congress on Evolutionary Computation, Honolulu, HI, USA, 12–17 May 2002. [Google Scholar]
  27. Koziel, S.; Bekasiewicz, A.; Szczepanski, S. Multi-objective design optimization of antennas for reflection, size, and gain variability using kriging surrogates and generalized domain segmentation. Int. J. RF Microw. Comput. Eng. 2018, 28, e21253. [Google Scholar] [CrossRef]
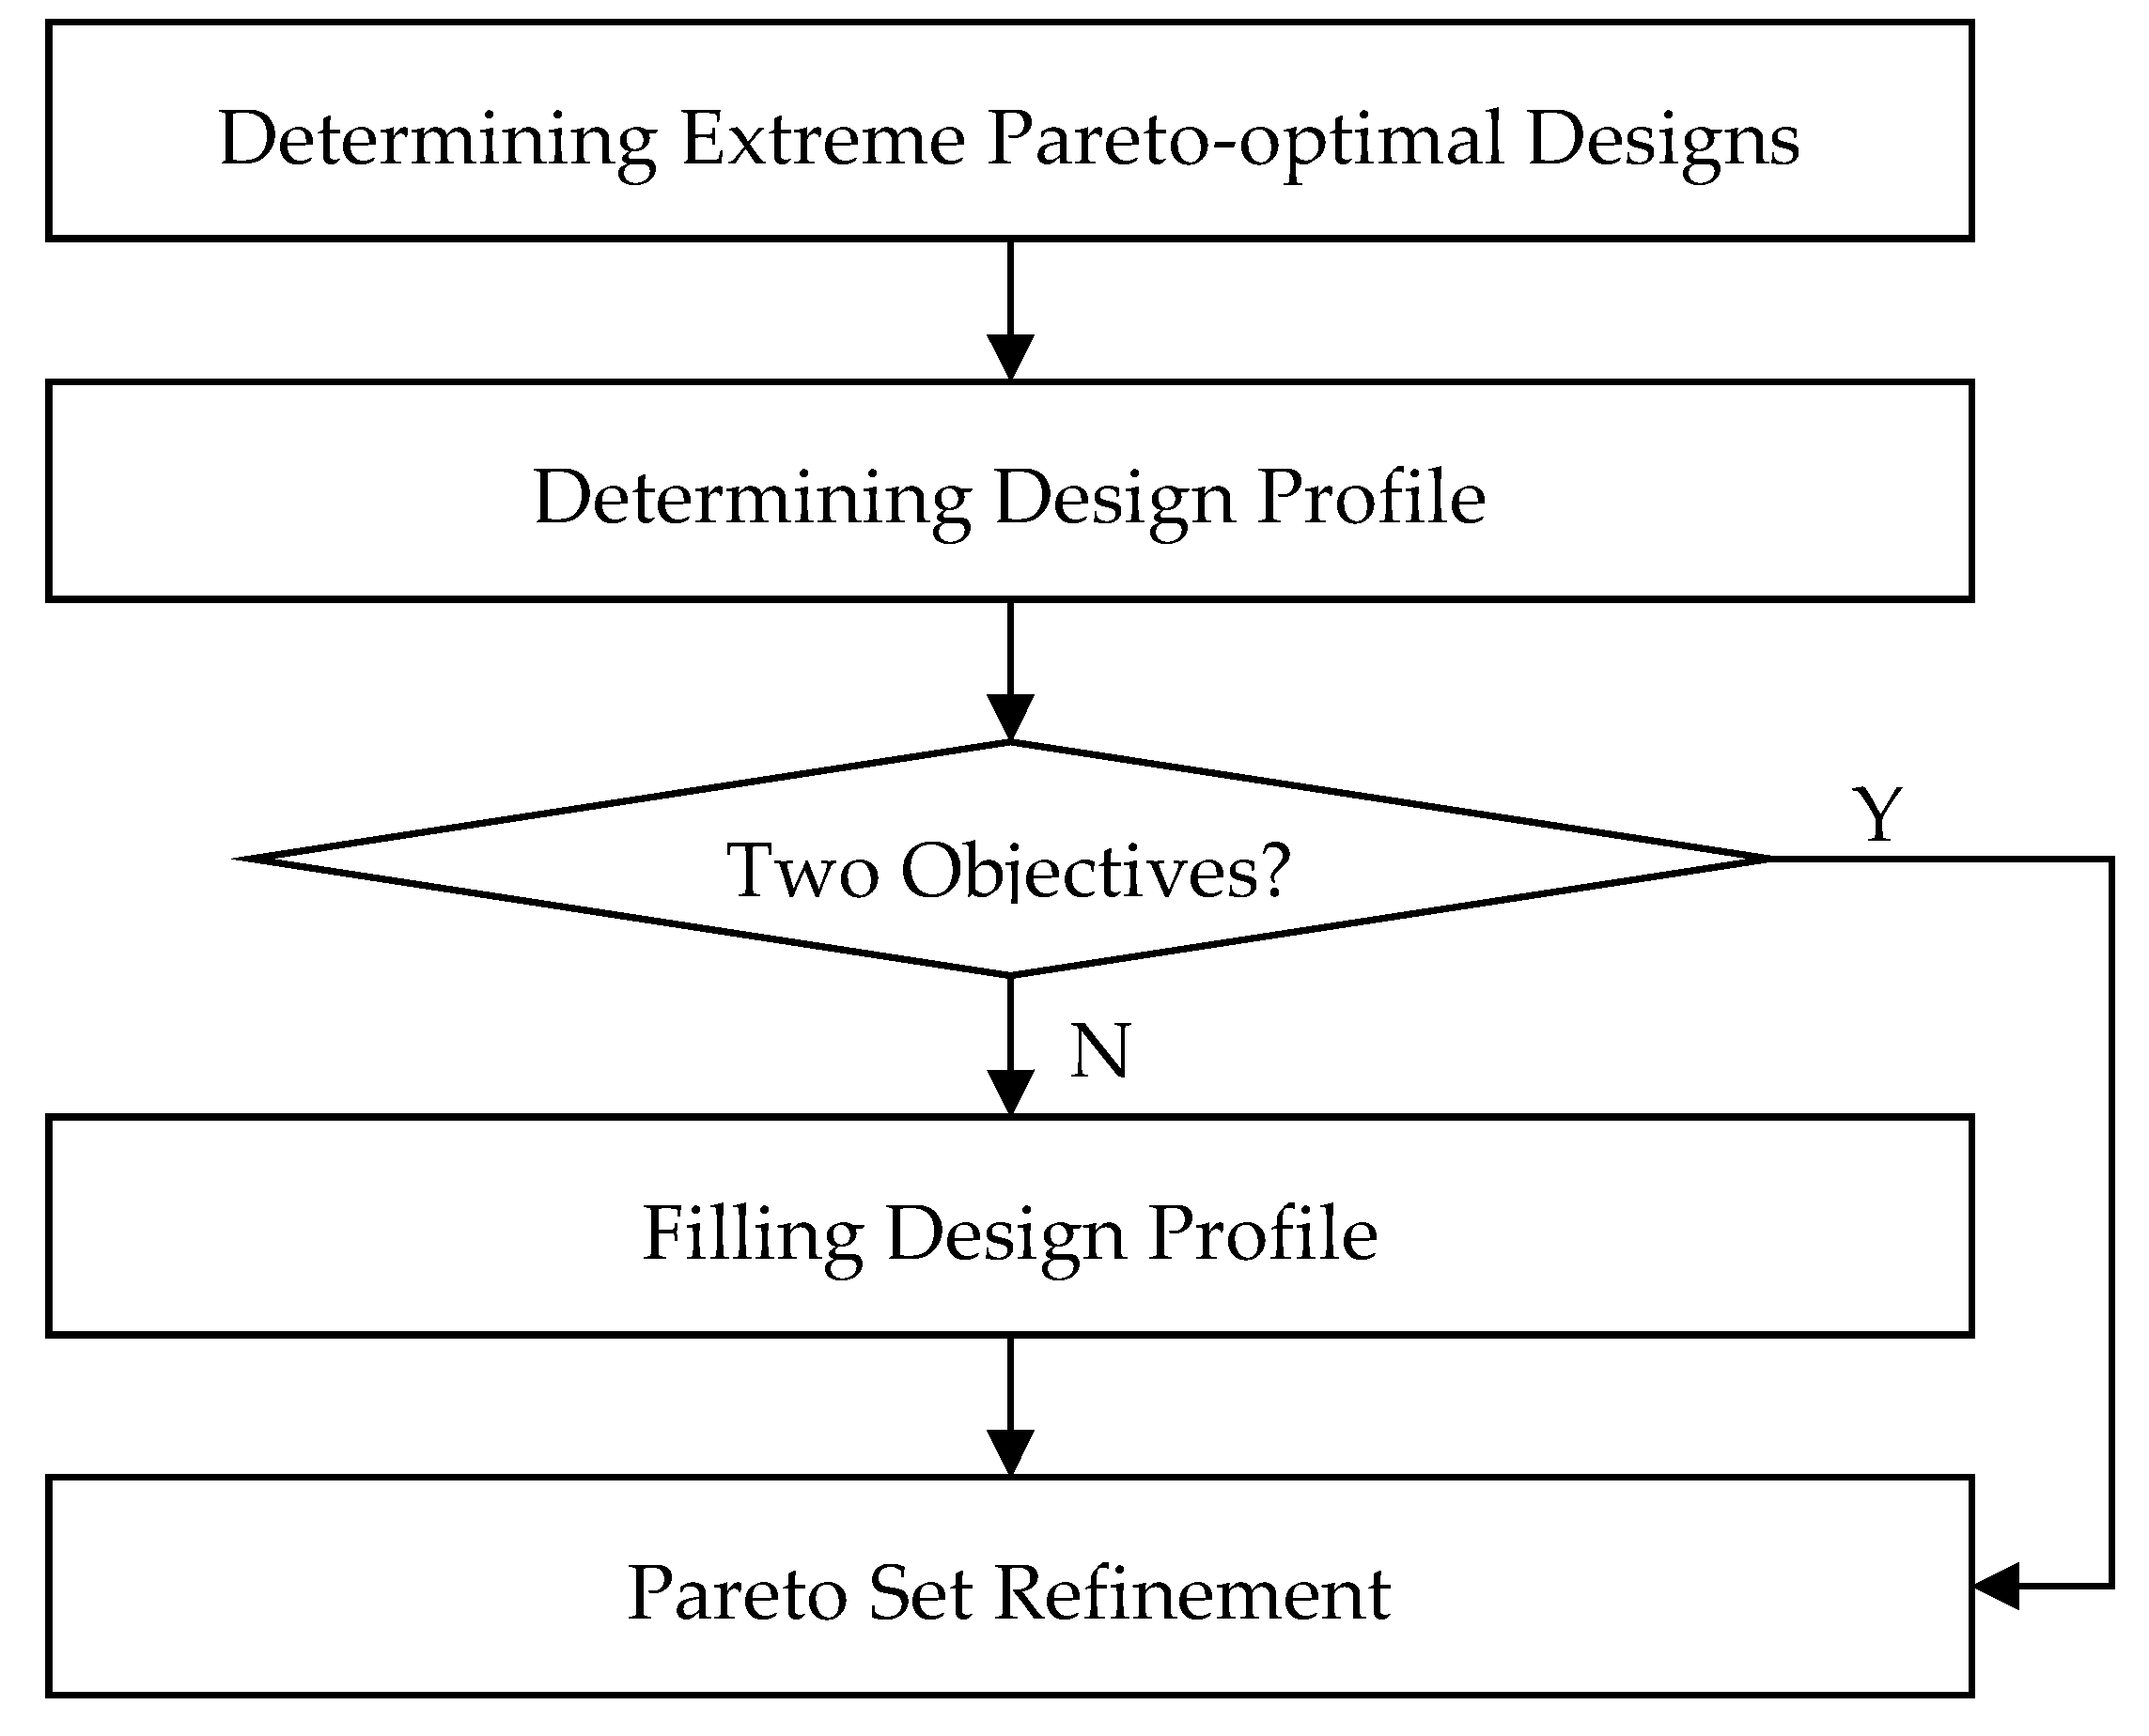
Figure 1. Algorithm flowchart of generalized sequential domain patching (GSDP).
Sensors 19 03065 g001
Figure 2. Illustration of the process of finding a Pareto set boundary by using an updated SDP method: (a) Starting points (red square) and perturbation points (blue dot, where the best perturbations become the centers of the next patches) of the first 10 iterations; (b) Pareto set boundary (red points) found.
Sensors 19 03065 g002
Figure 3. The Pareto front boundary in the objective space.
Sensors 19 03065 g003
Figure 4. Results of two design objectives: (a) approximate Pareto set (design space); (b) approximate Pareto front (objective space).
Sensors 19 03065 g004
Figure 5. Conceptual illustration of three design objectives: (a) design profile (design space); (b) objective profile (objective space).
Sensors 19 03065 g005
Figure 6. Process of filling the design profile.
Sensors 19 03065 g006
Figure 7. Filling the path between x 1 * and X 23 i . (a) Design space. The red five-pointed star is X 23 i , and the black dots are the path between x 1 * and X 23 i . (b) Objective space. The red star is the corresponding representation of X 23 i in the objective space, and the black dots are the corresponding representation of the path in the objective space.
Sensors 19 03065 g007
Figure 8. Approximate Pareto fronts of DTLZ1 (n = 6): (a) obtained by GSDP; (b) obtained by NSGA-II; (c) comparison between GSDP and NSGA-II.
Sensors 19 03065 g008
Figure 9. Approximate Pareto fronts of DTLZ2 (n = 9): (a) obtained by GSDP; (b) obtained by NSGA-II; (c) comparison between GSDP and NSGA-II.
Sensors 19 03065 g009
Figure 10. UWB antenna structure: (a) the front view; (b) back view. The gray part is the metal patch and the green part is the dielectric substrate.
Sensors 19 03065 g010
Figure 11. The approximate Pareto front found by GSDP.
Sensors 19 03065 g011
Figure 12. The applicable designs for the UWB antenna.
Sensors 19 03065 g012
Figure 13. The selected design results ( x ( 1 ) , x ( 2 ) , …, x ( 8 ) ref. Table 2) on the approximate Pareto set obtained by GSDP: (a) All S 11 ( dB ) responses are below −9 dB between 4 GHz and 10 GHz; (b) All the realized gain (dBi) variationd are below 2.6 between 4 GHz and 10 GHz.
Sensors 19 03065 g013
Table 1. Comparison results of GSDP and NSGA-II methods. DCI: Diversity Comparison Indicator.
Functions (Dimension of Design Parameter)Number of Solutions in P1 or P2Function Evaluation Times Using GSDP (P1)Function Evaluation Times Using NSGA-II (P2)Time SavingDCI (P1)DCI (P2)
DTLZ1 (6)23315,915317,20595%0.76670.2333
DTLZ2 (9)83321,806806,82097%0.48400.5426
DTLZ1 (5)47013,299232,65094%0.94240.0576
DTLZ2 (11)34810,043124,23692%0.47370.5533
DTLZ3 (12)192158,3381,192,94195%0.96020.0398
DTLZ4 (7)53024,358179,67086%0.41480.6049
Table 2. Objective values and parameter values of selected designs found by GSDP.
x ( 1 ) x ( 2 ) x ( 3 ) x ( 4 ) x ( 5 ) x ( 6 ) x ( 7 ) x ( 8 )
f 1 −10.7307−10.0570−10.3724−9.2783−10.4177−10.2159−9.1132−10.7473
f 2 2.47392.02322.58101.76192.3698812.02932.29151.8562
f 3 145.9946347.8369140.0131369.7517164.1404350.5260162.1286353.8818
a1.18130.59911.18131.11491.18130.59911.18131.1149
b0.34800.47930.34800.53100.34800.47930.34800.5310
d3.00894.98932.31394.39892.31393.20572.31394.3989
kL3.65626.49034.51116.22083.65626.49033.65626.2208
ds0.91491.78090.64661.45150.64661.78090.64661.4515
dW1.13152.07371.13152.31201.91852.07371.83981.9185
dWs1.11681.11681.11681.30321.17892.05581.11681.3032
L07.39299.59417.074511.98767.91439.59418.271212.5860
Lg3.60966.29213.60968.62793.60966.29213.60968.6279
Ls5.34388.81586.25748.08455.34388.81585.34388.0845
Ws0.25310.42540.25310.51760.25310.42540.25310.5176