Article

Near Room Temperature Light-Activated WS2-Decorated rGO as NO2 Gas Sensor

by
Valentina Paolucci
1,*,
Seyed Mahmoud Emamjomeh
1,
Luca Ottaviano
2,3 and
Carlo Cantalini
1
1
Department of Industrial and Information Engineering and Economics, Via G. Gronchi 18, University of L’Aquila, I-67100 L’Aquila, Italy
2
Department of Physical and Chemical Sciences, Via Vetoio 10, University of L’Aquila, I-67100 L’Aquila, Italy
3
CNR-SPIN Uos L’Aquila, Via Vetoio 10, I-67100 L’Aquila, Italy
*
Author to whom correspondence should be addressed.
Sensors 2019, 19(11), 2617; https://doi.org/10.3390/s19112617
Submission received: 10 May 2019 / Revised: 2 June 2019 / Accepted: 6 June 2019 / Published: 9 June 2019
(This article belongs to the Special Issue Applications of Graphene-Based Materials in Sensors)

Abstract

:
The NO2 response in the range of 200 ppb to 1 ppm of a chemoresistive WS2-decorated rGO sensor has been investigated at operating temperatures of 25 °C and 50 °C in dry and humid air (40% RH) under dark and Purple Blue (PB) light conditions (λ = 430 nm). Few-layers WS2, exfoliated by ball milling and sonication technique, with average dimensions of 200 nm, have been mixed with rGO flakes (average dimension 700 nm) to yield WS2-decorated rGO, deposited on Si3N4 substrates, provided with platinum (30 μm gap distance) finger-type electrodes. TEM analysis showed the formation of homogeneous and well-dispersed WS2 flakes distributed over a thin, continuous and uniform underlying layer of interconnected rGO flakes. XPS and STEM revealed a partial oxidation of WS2 flakes leading to the formation of 18% amorphous WO3 over the WS2 flakes. PB-light irradiation and mild heating of the sensor at 50 °C substantially enhanced the baseline recovery yielding improved adsorption/desorption rates, with detection limit of 400 ppb NO2 and reproducible gas responses. Cross sensitivity tests with humid air interfering vapor highlighted a negligible influence of water vapor on the NO2 response. A charge carrier mechanism between WS2 and rGO is proposed and discussed to explain the overall NO2 and H2O response of the WS2–rGO hybrids.

1. Introduction

The intrinsic merits of Transition Metal Dichalcogenides (TMDs), including their high surface-to-volume ratio and semiconducting properties, have accelerated the development of a diverse range of applications of these materials as chemical sensors [1,2]. Two-dimensional (2D) mono- or few-layer TMDs produced by different exfoliation procedures, expose both plate and edge atoms of a single layer capable of adsorbing gas molecules, providing the largest sensing area per unit volume. Among a large variety of gaseous species, NO2, H2 and NH3 are the most investigated gases, considering their high chemical reactivity with mono- or few-layer MoS2 [3,4,5], WS2 [6,7], MoSe2 [8] and MoTe2 [9].
In need to decrease the operating temperature of the sensing materials, a common drawback of TMDs operating at room temperature, is their slow response and recovery times, or even no recovery when used at low temperatures [3,5,10]. The increase of the operating temperature up to 150 °C greatly improves adsorption/desorption rates and baseline recovery, but causes partial oxidation of TMDs into their metal oxide counterparts, as previously demonstrated for MoS2 and WS2-layered materials [5,7,11]. It turns out that both low and high temperatures hinder the practical use of TMDs due to kinetic (i.e., slow recovery rates) and thermodynamical (i.e., spontaneous oxidation) reasons, respectively. A possible strategy to avoid irreversible adsorption and ageing phenomena, and thus, to enhance the long term stability of the sensors, is to operate them at low temperature utilizing light irradiation as an external source of energy, as previously reported for metal oxide sensors [12,13], rGO-Metal Oxide nanocomposite [14], graphene [15], MoS2 [3] and WS2 [16].
Considering the variety of different preparation techniques for producing mono- or few-flake TMDs, consistent with standard electronic processes, some other aspects must be considered. A first issue is the reproducibility of the exfoliation procedure with respect to both microstructure (i.e., number of layers, lateral size, surface area, etc.) and chemical composition (i.e., defects concentration and surface oxidation). A second aspect is the small allowable average lateral size of the TMDs flakes, which may range from 100 to 300 nm, depending on the exfoliation technique [17]. A final issue is the surface coverage of the substrate, needed to create percolation paths for charge carriers between TMDs flakes, bridging metal electrodes. The possibility of using hybrid nanostructures, mostly focused on MoS2/graphene, making use of large-size, conducting-flakes-pathways of Graphene Oxide (GO) or reduced Graphene Oxide (rGO) with dispersed smaller-size, lesser-conductive-flakes of MoS2 has been recently reported as an effective solution to enhance the fabrication of this new class of gas sensors [18,19,20]. Beside some reports on the utilization of WS2/GO hybrids as electrocatalysts for hydrogen evolution reactions [21,22] and WS2/GO as humidity [23] and NH3 [24] sensors, no applications of WS2–rGO nanocomposite for NO2 gas sensing applications have been reported so far.
In this paper, we report the exfoliation of WS2 powders by a combined ball milling and sonication technique, which leads to average dimensions of 200 nm and “aspect ratios”, i.e., lateral dimension to the thickness of 27, to produce mono to few-layer WS2 with controlled morphology and chemical composition. WS2 flakes are mixed with rGO flakes with average dimensions of 700 nm to yield WS2-decorated rGO as chemoresistive NO2 thin films deposited on large-area Si3N4 substrates, provided with platinum finger-type patterned electrodes.
The aim of this paper is firstly to demonstrate the reliability of the decoration process leading to the deposition of thin films of well dispersed WS2 flakes over large-size, interconnected rGO flakes, secondly, to demonstrate and discuss the influence of purple blue light (λ = 430 nm) to detect NO2 gas in air in the operating temperature range of 25 °C to 50 °C, and lastly, to investigate the influence of water vapor on the NO2 gas response.

2. Materials and Methods

Materials Preparation. GO was prepared via a modified Hummers method [25] starting from graphite flakes of 500 μm maximum size. Monolayers with average sizes of several micrometres and thicknesses of less than 2 nm were obtained and dispersed in water to reach a final concentration of 0.05 mg/mL. Two-dimensional WS2 flakes, with average lateral size of 200 nm and average thickness under 15 nm, were obtained by starting from WS2 commercial powder (Sigma-Aldrich 243639-50G) exfoliated by ball milling assisted sonication, and dispersed in ethanol and subsequently centrifuged as described in the Supporting Figure S1. Finally, equal amounts of the two GO/water and WS2/ethanol solutions were mixed together and sonicated for 10 min to homogenize the dispersion and avoid agglomeration.
Microstructural and chemical characterization. TEM and STEM pictures of the WS2-decorated GO were acquired using a TEM—JEOL 2100 Field Emission Transmission Electron Microscope operating at 200 kV by drop casting the dispersion on a lacey grid. Samples prepared by drop casting the WS2-GO dispersion on Si3N4 substrates were further analyzed by X-Ray Photoemission Spectroscopy (XPS) using a PHI 1257 spectrometer equipped with a monochromatic Al Kα source (hν = 1486.6 eV) with a pass energy of 11.75 eV (93.9 eV survey), corresponding to an overall experimental resolution of 0.25 eV. Thin-film XRD measurements were performed at 3° incidence using a Philips PW1710 diffractometer equipped with grazing-incidence X-ray optics, using Cu Kα Ni-filtered radiation at 30 kV and 40 mA.
Sensor fabrication and gas sensing measurements: Thin layers have been prepared by drop casting 8 μL of the water/ethanol dispersed WS2-GO solution on Si3N4 substrates provided with 30 μm spaced Pt interdigitated electrodes, followed by annealing at 70 °C for 30 min to partially reduce the GO to rGO in order to fix the film resistivity in the range of 104–105 Ohm. The electrical resistance of the sensors was measured by an automated system. The sensors placed inside a Teflon chamber (500 cm3), provided with Teflon tubings have been exposed to different gas concentrations in the range 200 ppb-10 ppm NO2 obtained by mixing certified NO2 mixtures with dry air carrier gas at 500 sccm/min flow rate, by means of an MKS147 multi gas mass controller. Electrical resistance was measured by a volt-amperometric technique (AGILENT 34970A) under dark and Purple Blue (PB) light irradiating conditions (PB λ = 430 nm) and different power densities at 270 μW/cm2, 468 μW/cm2 and 668 μW/cm2. The device temperature has been controlled by heating elements and temperature sensors (thermocouples) integrated on the device backside, guaranteeing that the gas pressure was not affected by the changes in the OT.
In this paper the relative response RR is represented by the ratio RR = Ra/Rg where Ra and Rg are the resistances in dry air and in gas respectively and τads and τdes (respectively adsorption and desorption times) represent the time required to reach 90% of the full response at equilibrium, during both gas adsorption and desorption.

3. Results and Discussion

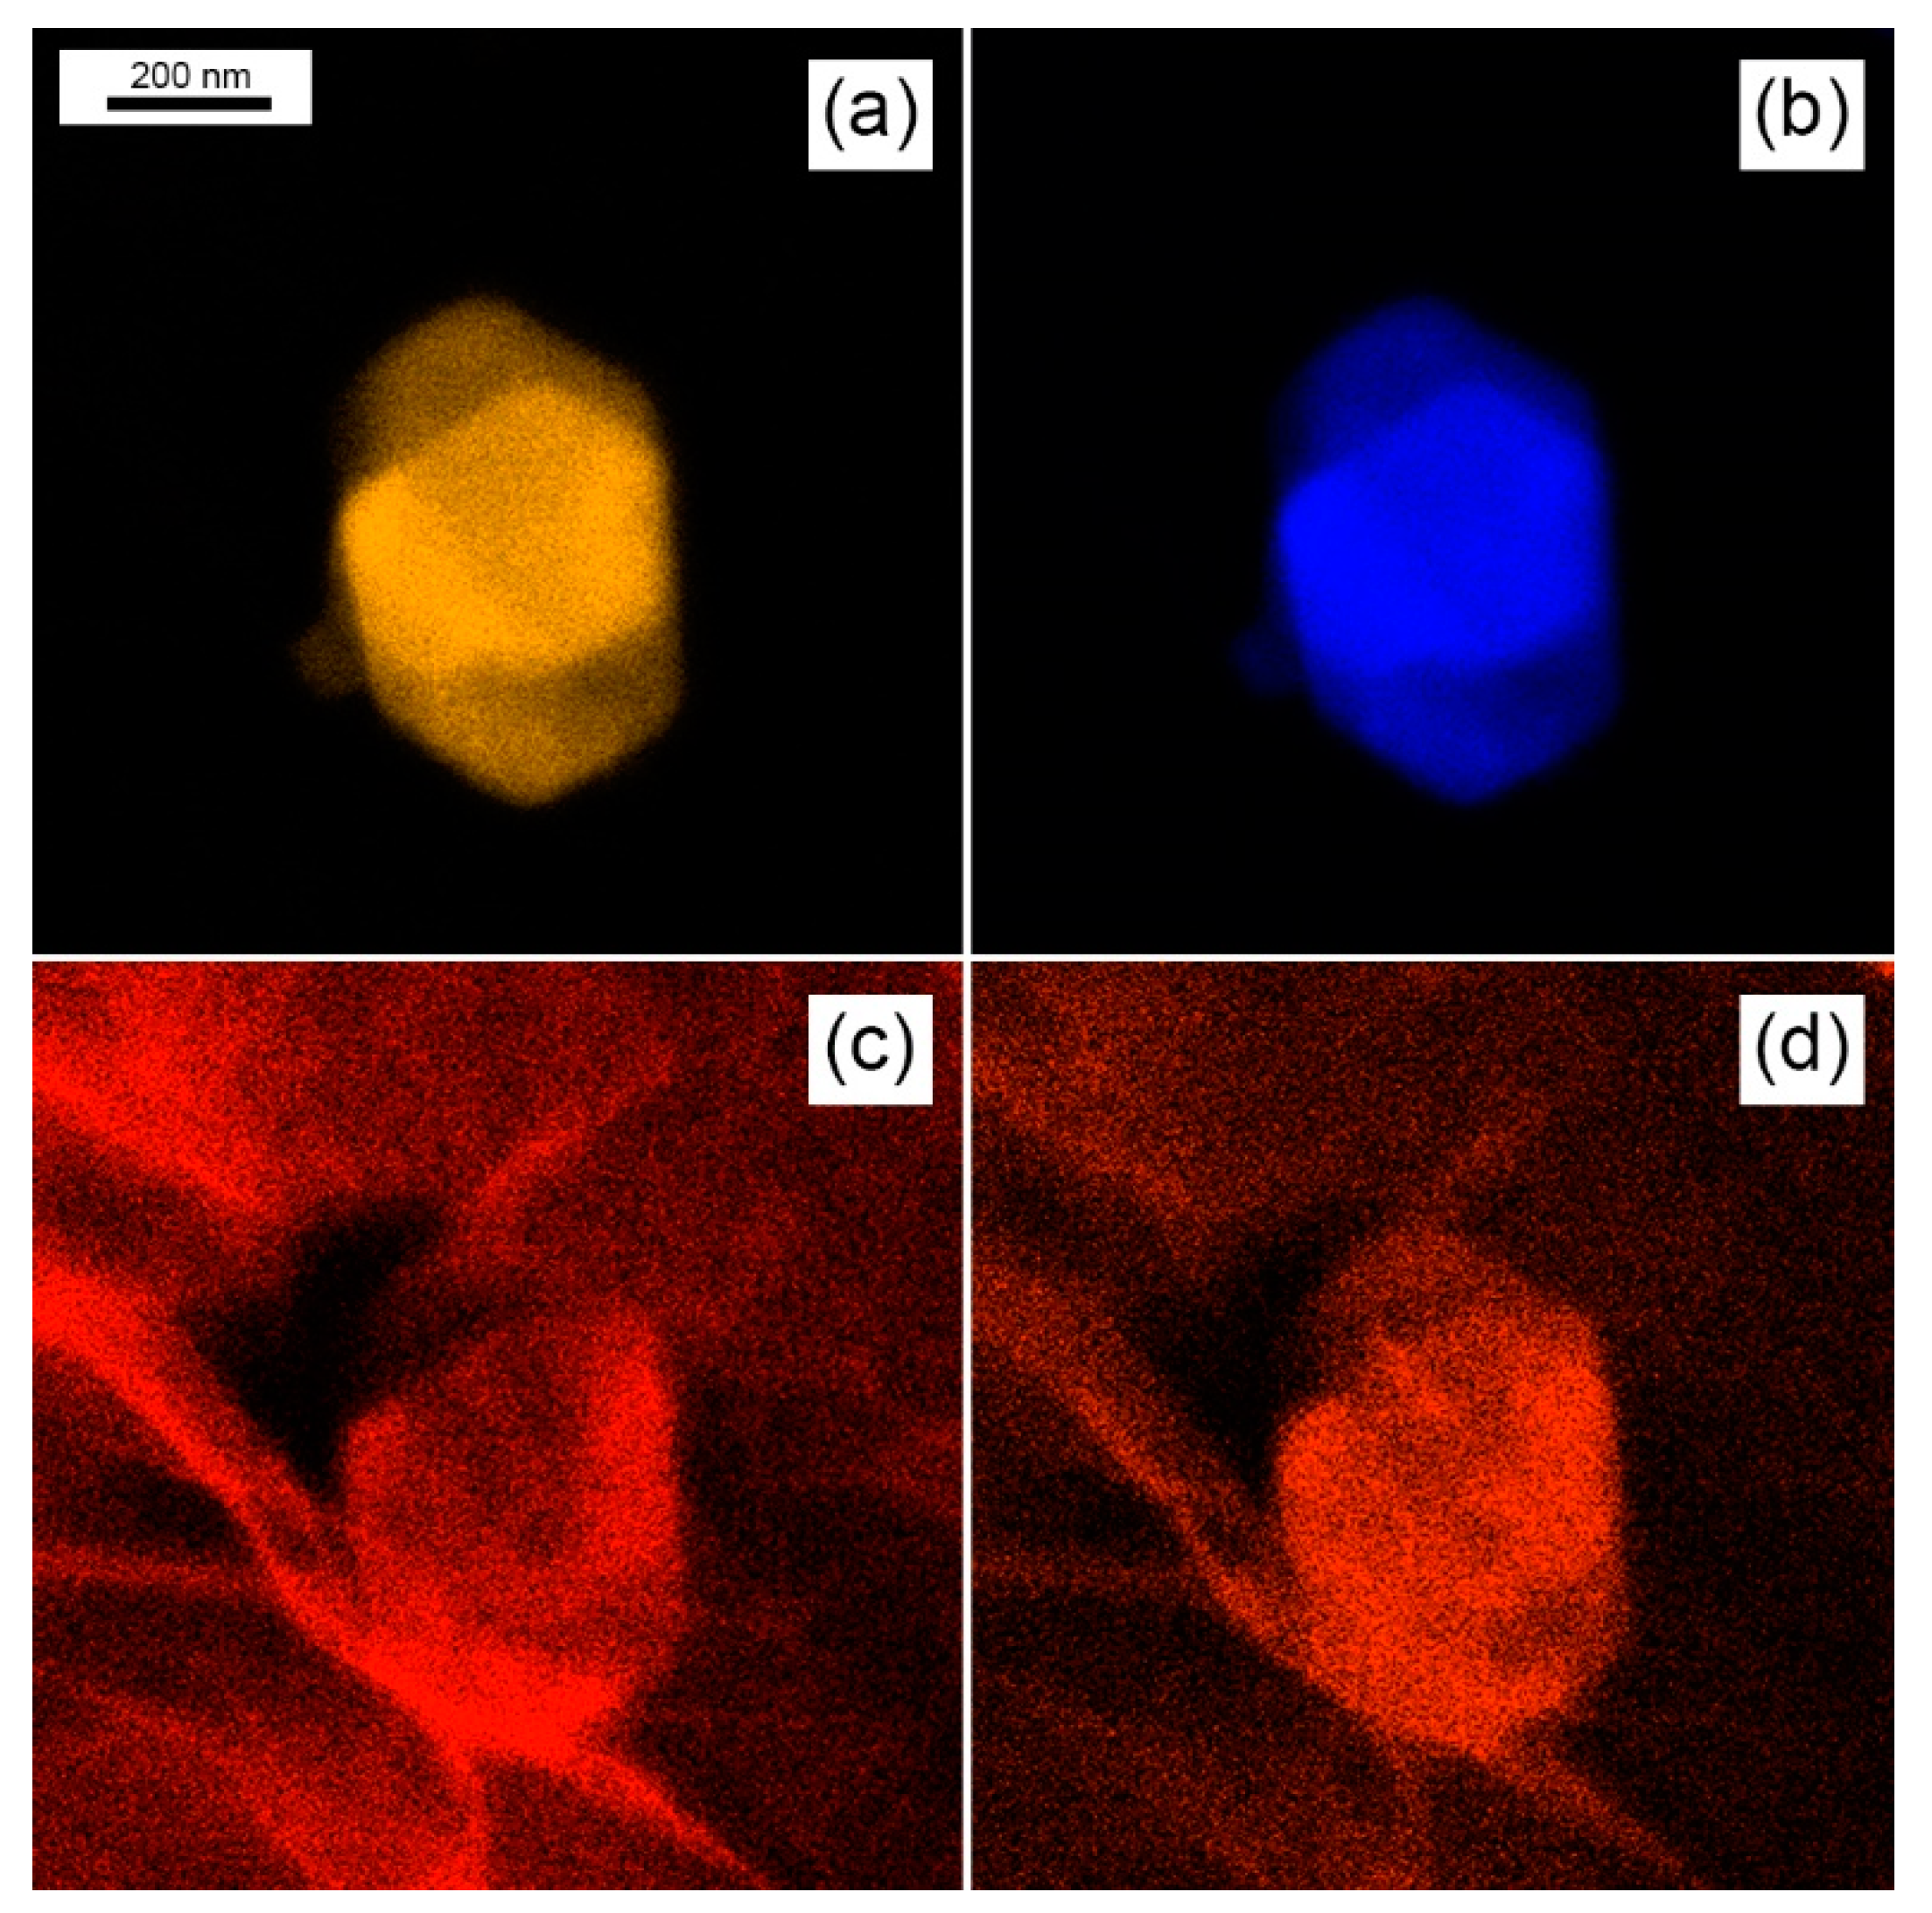
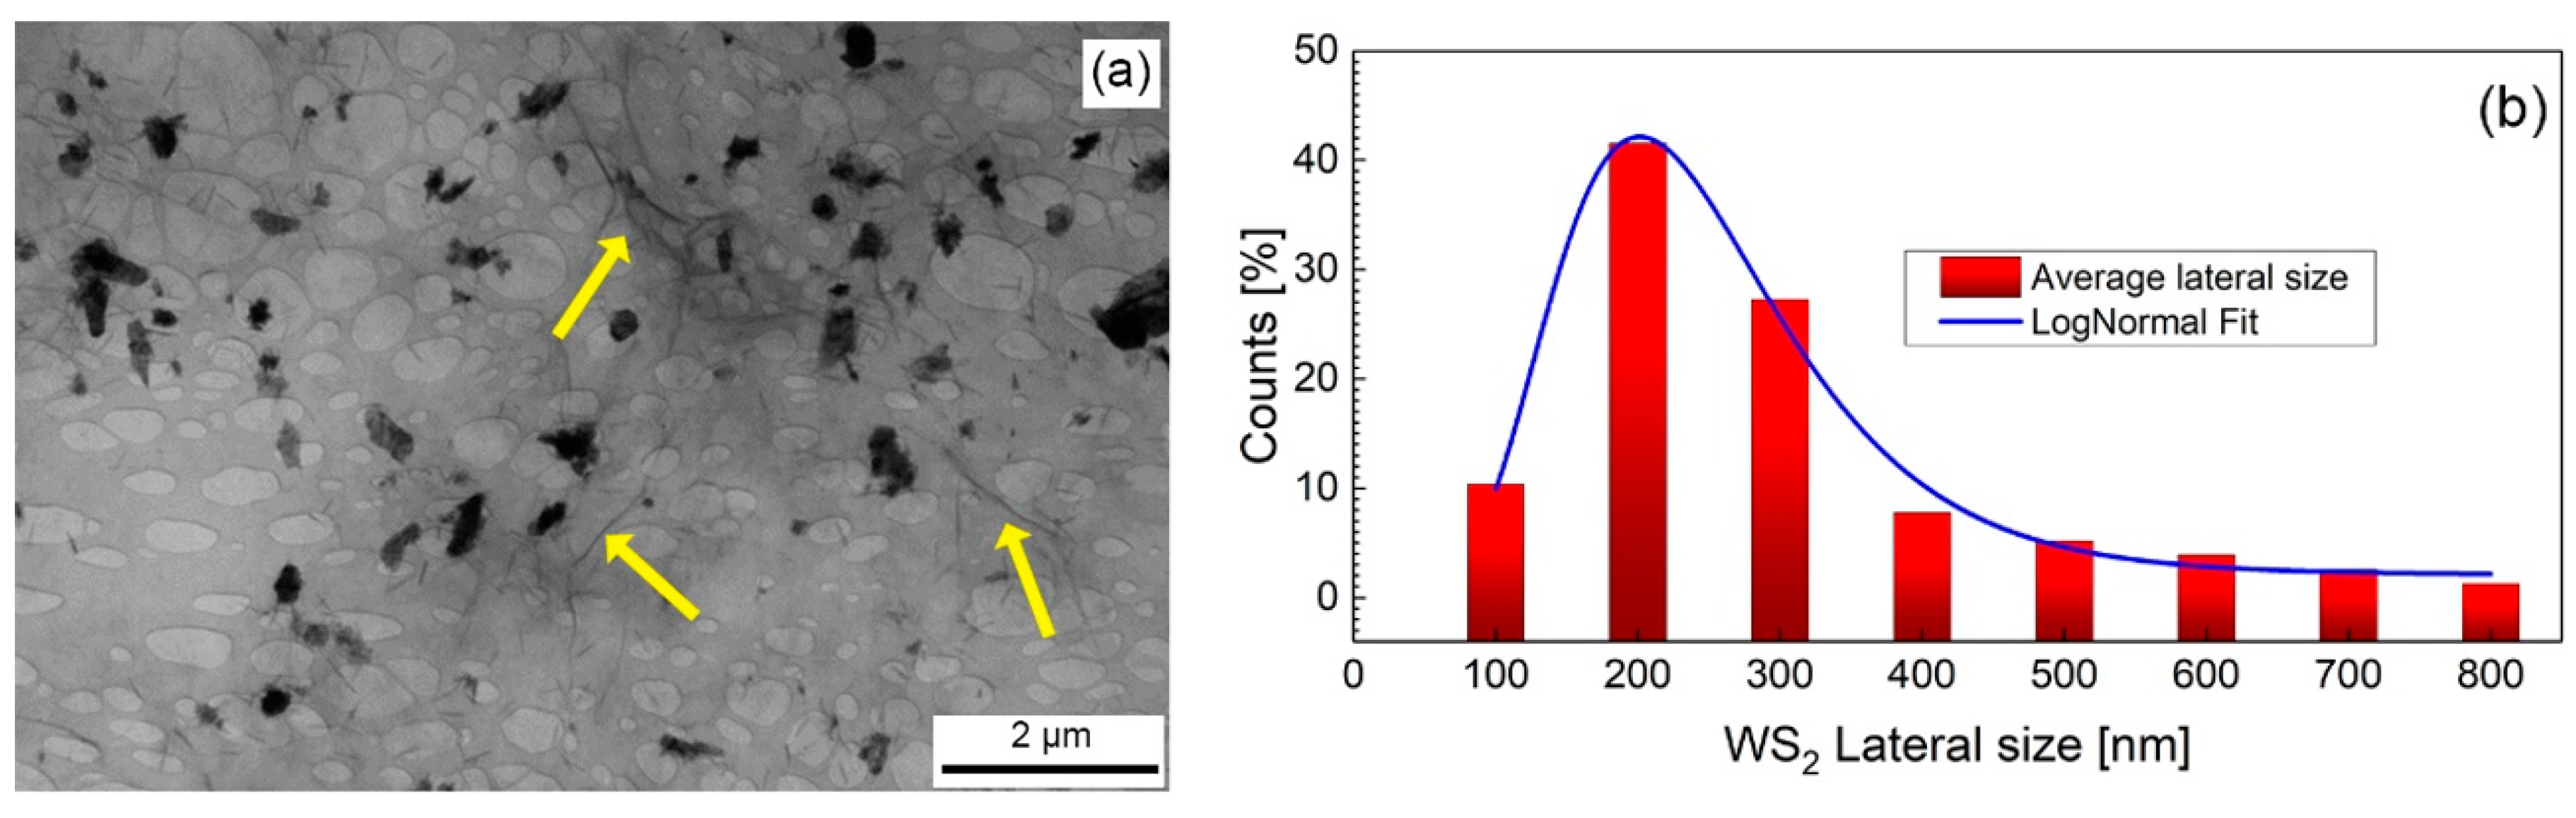
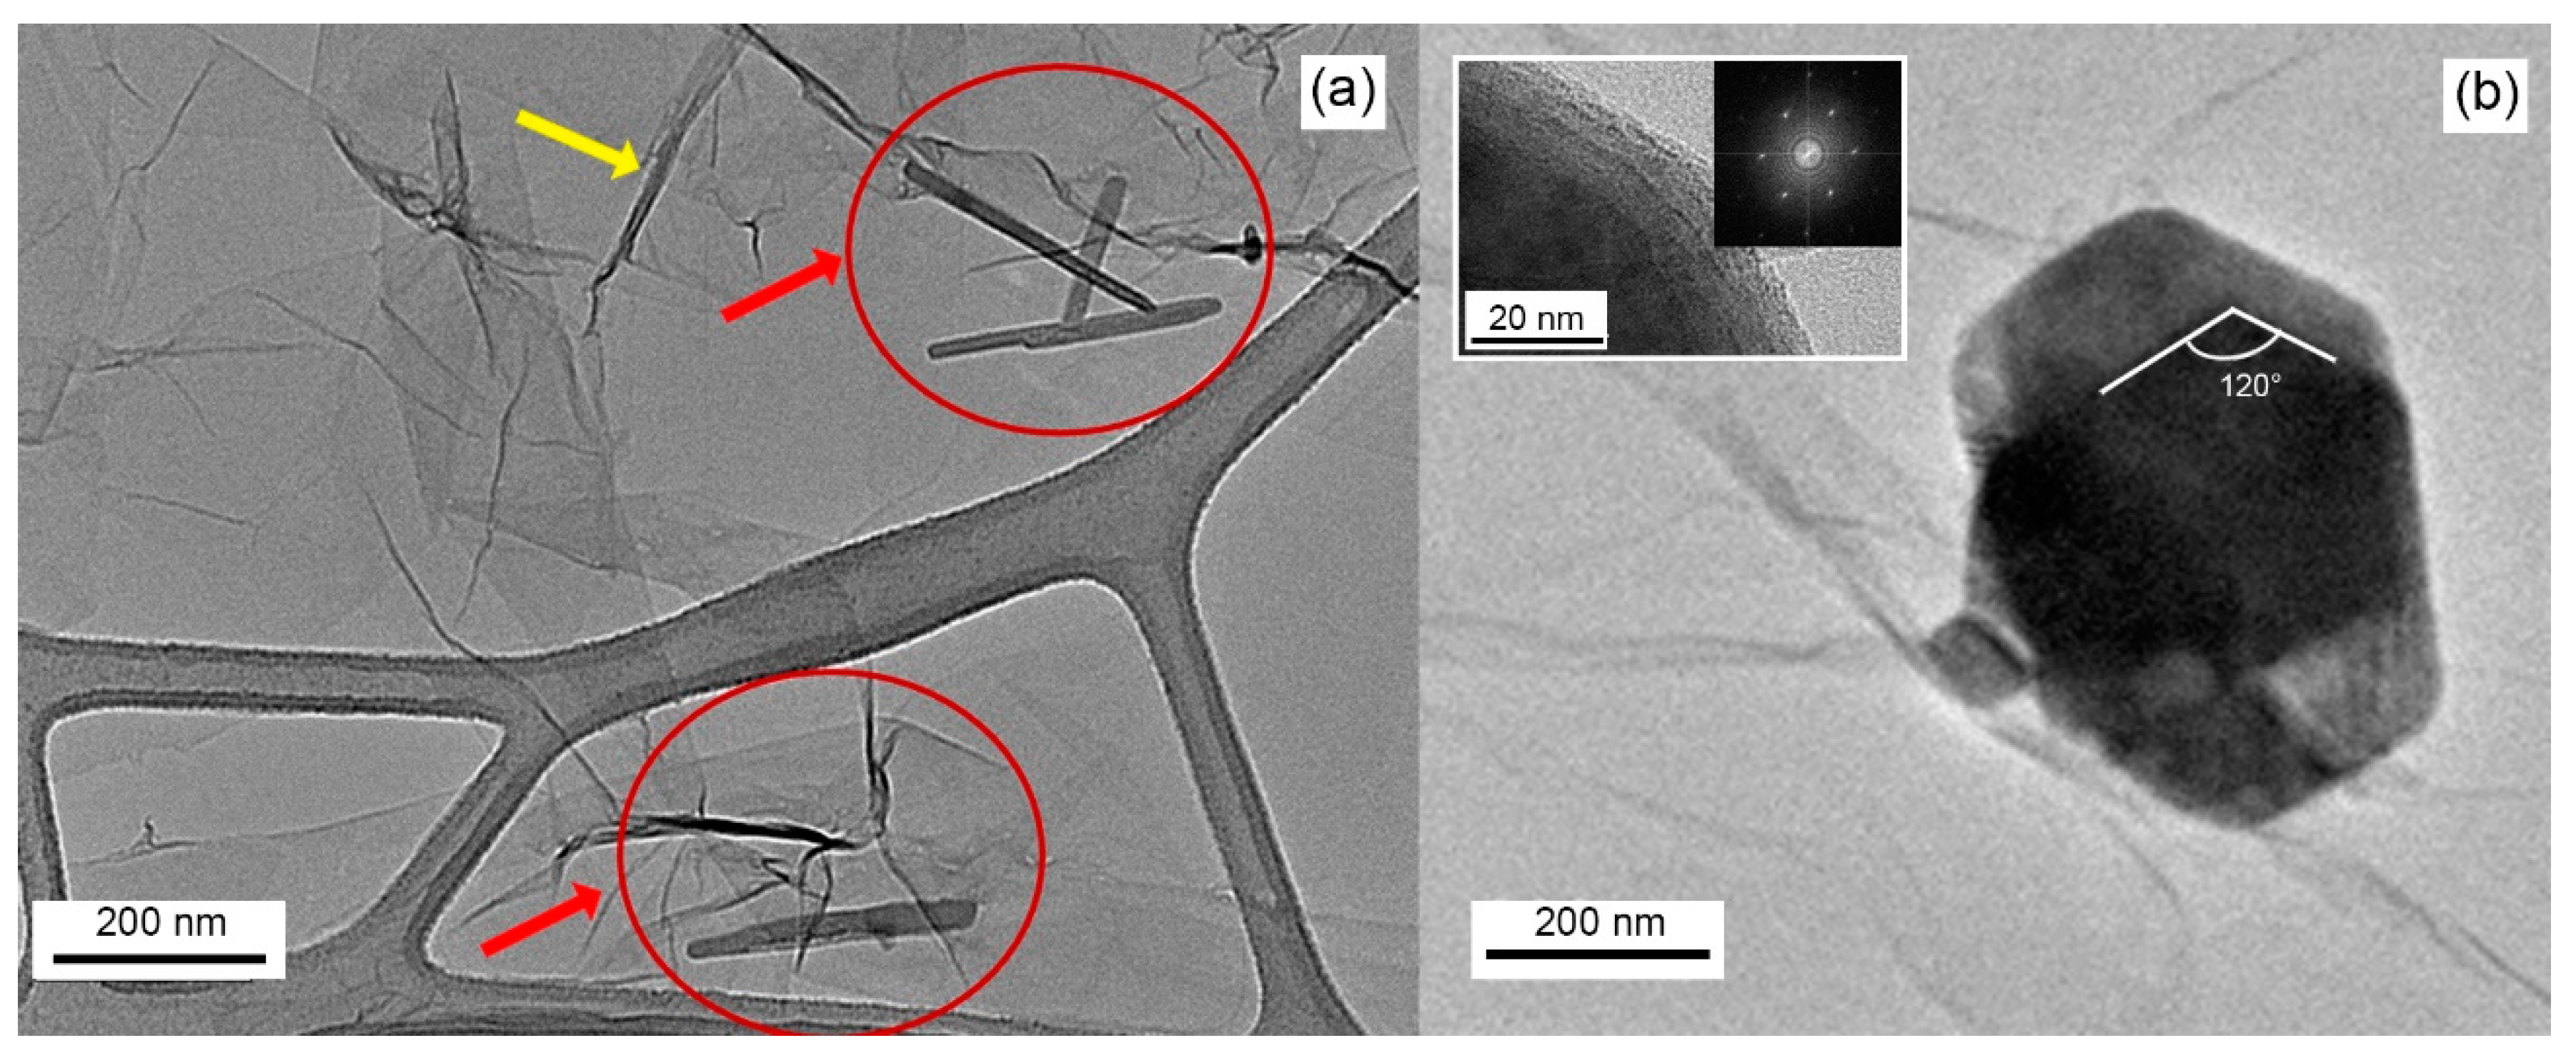
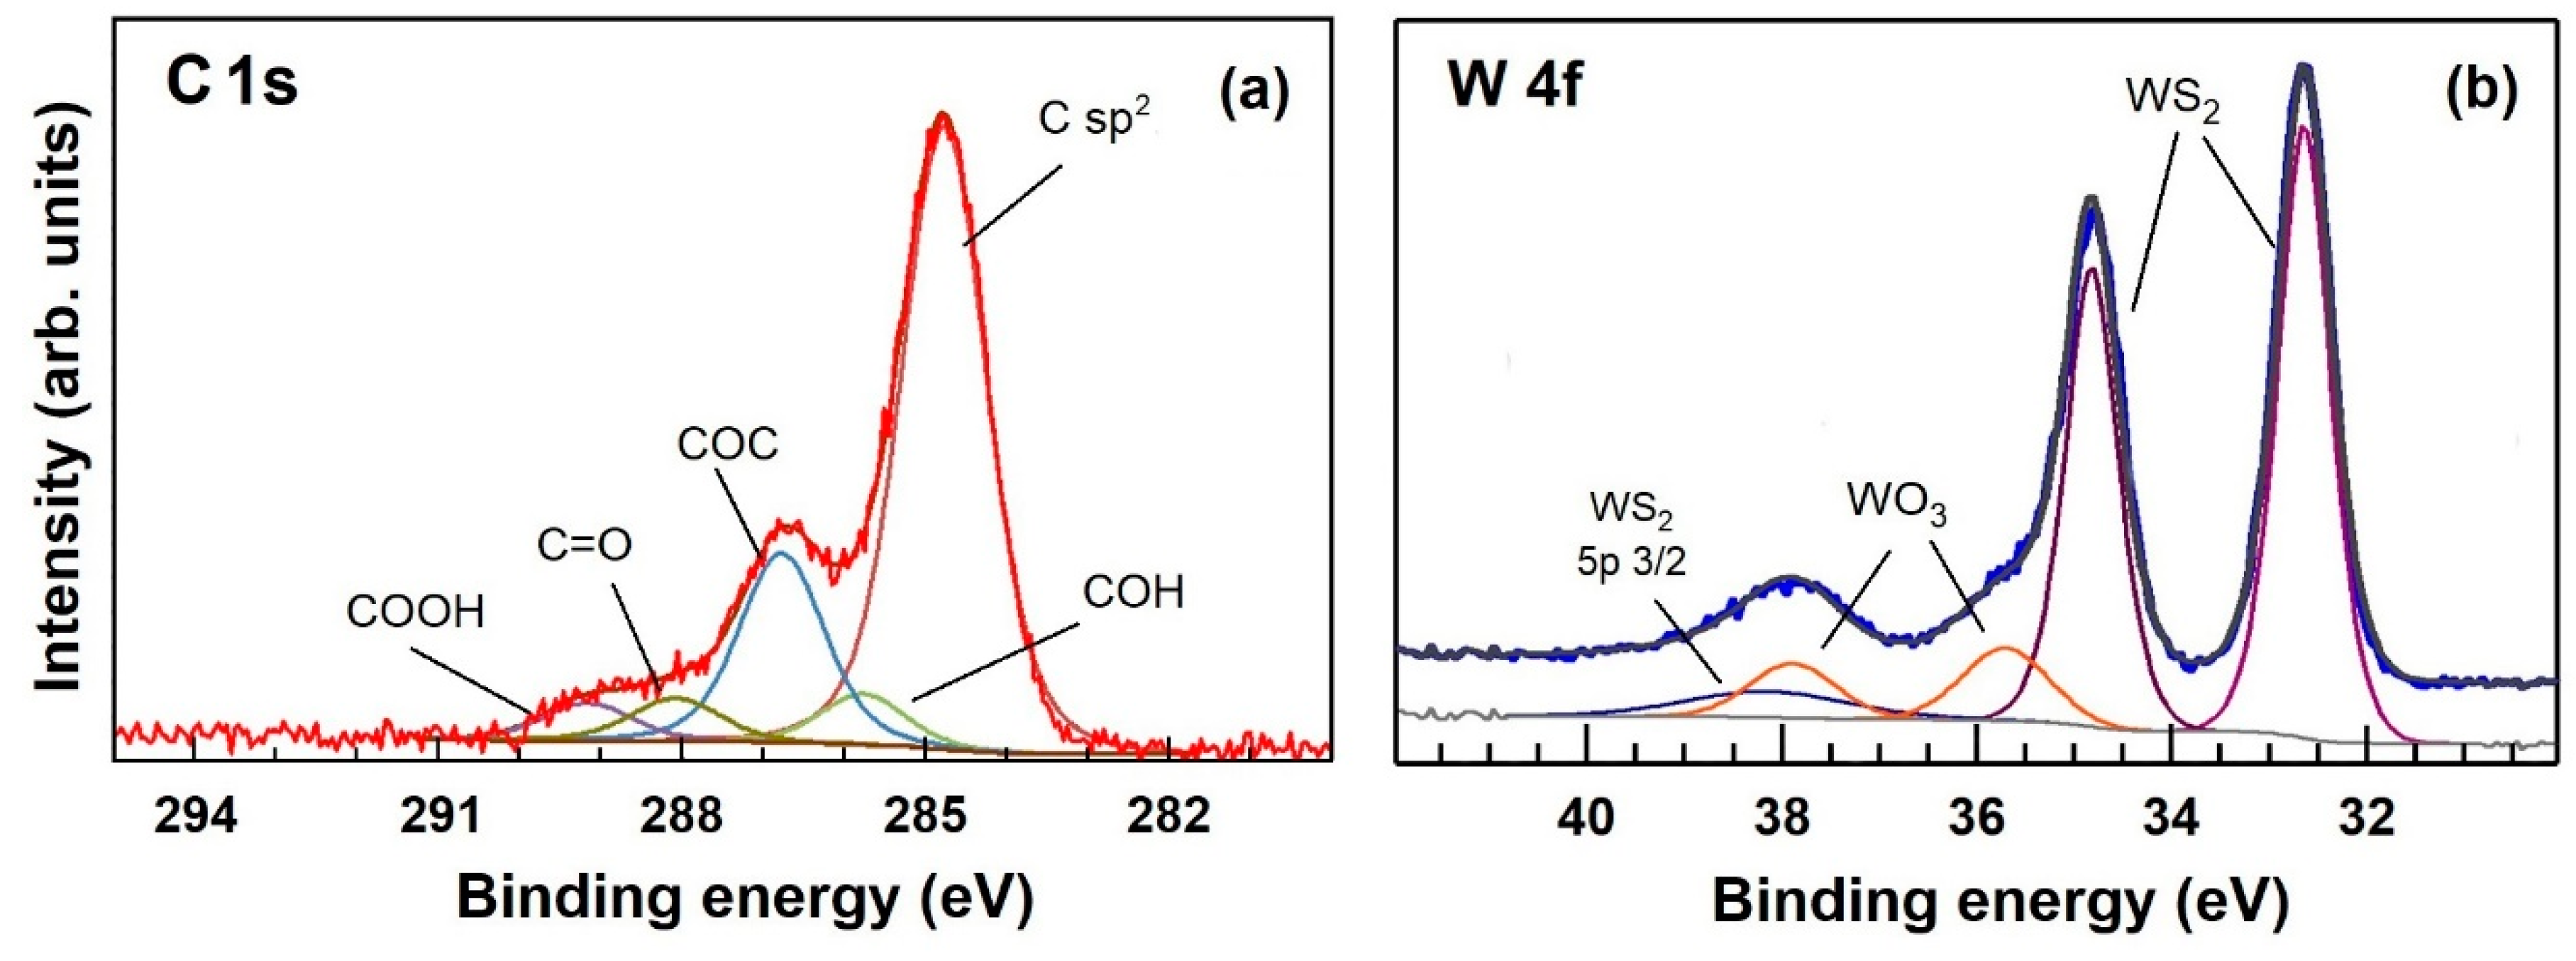
3.1. Morphological and Compositional Characterization of the WS2-Decorated rGO

Thin films of WS2-decorated rGO deposited on Si3N4 substrates provided with Pt finger type electrodes have been characterized. We have firstly deposited by drop deposition the minimum amount of WS2–rGO solution, corresponding to the formation of a continuous percolation path of GO flakes. The development of a continuous percolation path was assessed by recording the electrical resistance of the film corresponding to the onset of an electrical contact between the electrodes (30 µm apart). By further annealing at 70 °C in air for 30 min, the GO flakes have been partially reduced to rGO to yield baseline resistances in air in the range of 104–105 Ω.
The WS2-decorated rGO morphology was first characterized by low-resolution TEM, as shown in Figure 1a. WS2 flakes (darker regions) are distributed over a thin, continuous and uniform layer made of interconnected rGO flakes (light-grey background) as revealed by the presence of grey lines attesting the formation of rGO folded edges (yellow arrows in Figure 1a). Statistical image analysis carried out on differently prepared samples over an area of 80 µm2, as shown in Figure 1b, exhibits a log-normal WS2 average particle size distribution with an average particle size dimension of 200 nm and an average WS2 flakes coverage percentage of 6%. Notably, the dispersion of the WS2 flakes is homogeneous over the investigated area, meaning that the sonication step after mixing represents an effective strategy to avoid agglomeration of the WS2 flakes.
The TEM analysis shown in Figure 2a reveals the presence of large (i.e., hundreds of nanometers) transparent, irregularly shaped GO flakes with folded edges (yellow arrow) distributing according to a continuous planar underlying layer. From Figure 2a it is shown that WS2 flakes may also align vertically, as highlighted by the darker needle-shaped formations inside the red circles of Figure 2a. Statistical analysis carried out on the vertically aligned WS2 flakes revealed an average thickness of 15 nm, corresponding approximately to 25 layers. TEM image depicted in Figure 1b illustrates the formation of well-shaped, stacked-few-layers WS2, with edge angles of 120°, deposited over the underlying GO flakes. The crystalline nature of few-flakes WS2 is confirmed by the selected area electron diffraction (SAED) pattern shown in the inset of Figure 2b, which clearly exhibits the formation of WS2 nanosheet with hexagonal atomic arrangements, assigned to WS2 (100) plane [26].
Figure 3 shows the atomic distribution of sulphur (a), tungsten (b), carbon (c) and oxygen (d) elements, as measured by STEM technique, respectively on the sample displayed in Figure 2b. From Figure 3a,b, it turns out that the distribution of tungsten and sulphur exactly replicates the shape of the WS2 flake. The carbon signal over the WS2 particles of Figure 3c, may be possibly be attributed to a partial contamination of the sample, whereas the carbon signal deriving from the background, clearly replicates the morphology of the rGO underlying layer. The chromatic signal intensity of oxygen corresponding to the WS2 flake (Figure 3d), is slightly brighter than the background, indicating the occurrence of a higher oxygen concentration over the WS2 flake with respect to the rGO background, suggesting the occurrence of an oxidation process of WS2, as it will be confirmed in the next XPS section.
Figure 4 shows the XPS C1s (a) and W4f (b) core level photoemission spectra of WS2-decorated rGO air-annealed at 70 °C. According to the literature [27,28], the C1s spectrum shown in Figure 4a has been successfully fitted by the sum of five components assigned to C sp2 atoms belonging to aromatic rings and hydrogenated carbon (C=C/C−C 284.7 eV), hydroxyl groups (C−OH, 285.8 eV), epoxy groups (C−O−C, 286.8 eV), carbonyl groups (C=O, 288.0 eV), and carboxyl groups (C=O(OH), 289.2 eV). Upon thermal annealing at 70 °C, the intensity of all the oxygen-containing groups is lowered, with regard to sp2 carbon containing ones (i.e., (C=C/C−C), signifying a loss of oxygen in favor of sp2 carbon. Compared to previous results [29], the XPS spectrum shown in Figure 4a is located halfway between the XPS signals of as deposited GO and the one corresponding to 200 °C UHV-annealed rGO. Regarding the tungsten W4f of Figure 4b, the four peaks fitting the spectrum can be located, according to the literature [30,31], to WS2 and WO3. These results suggest, as previously reported for MoS2 and WS2 [5,7,11], that crystalline WS2 is partially oxidized to WO3 with an associated content of approximately 18%. Gracing incidence XRD measurements on the WS2-decorated rGO annealed at 70 °C for 30 min, as shown in the supporting Figure S2, revealed that the WO3 is amorphous.

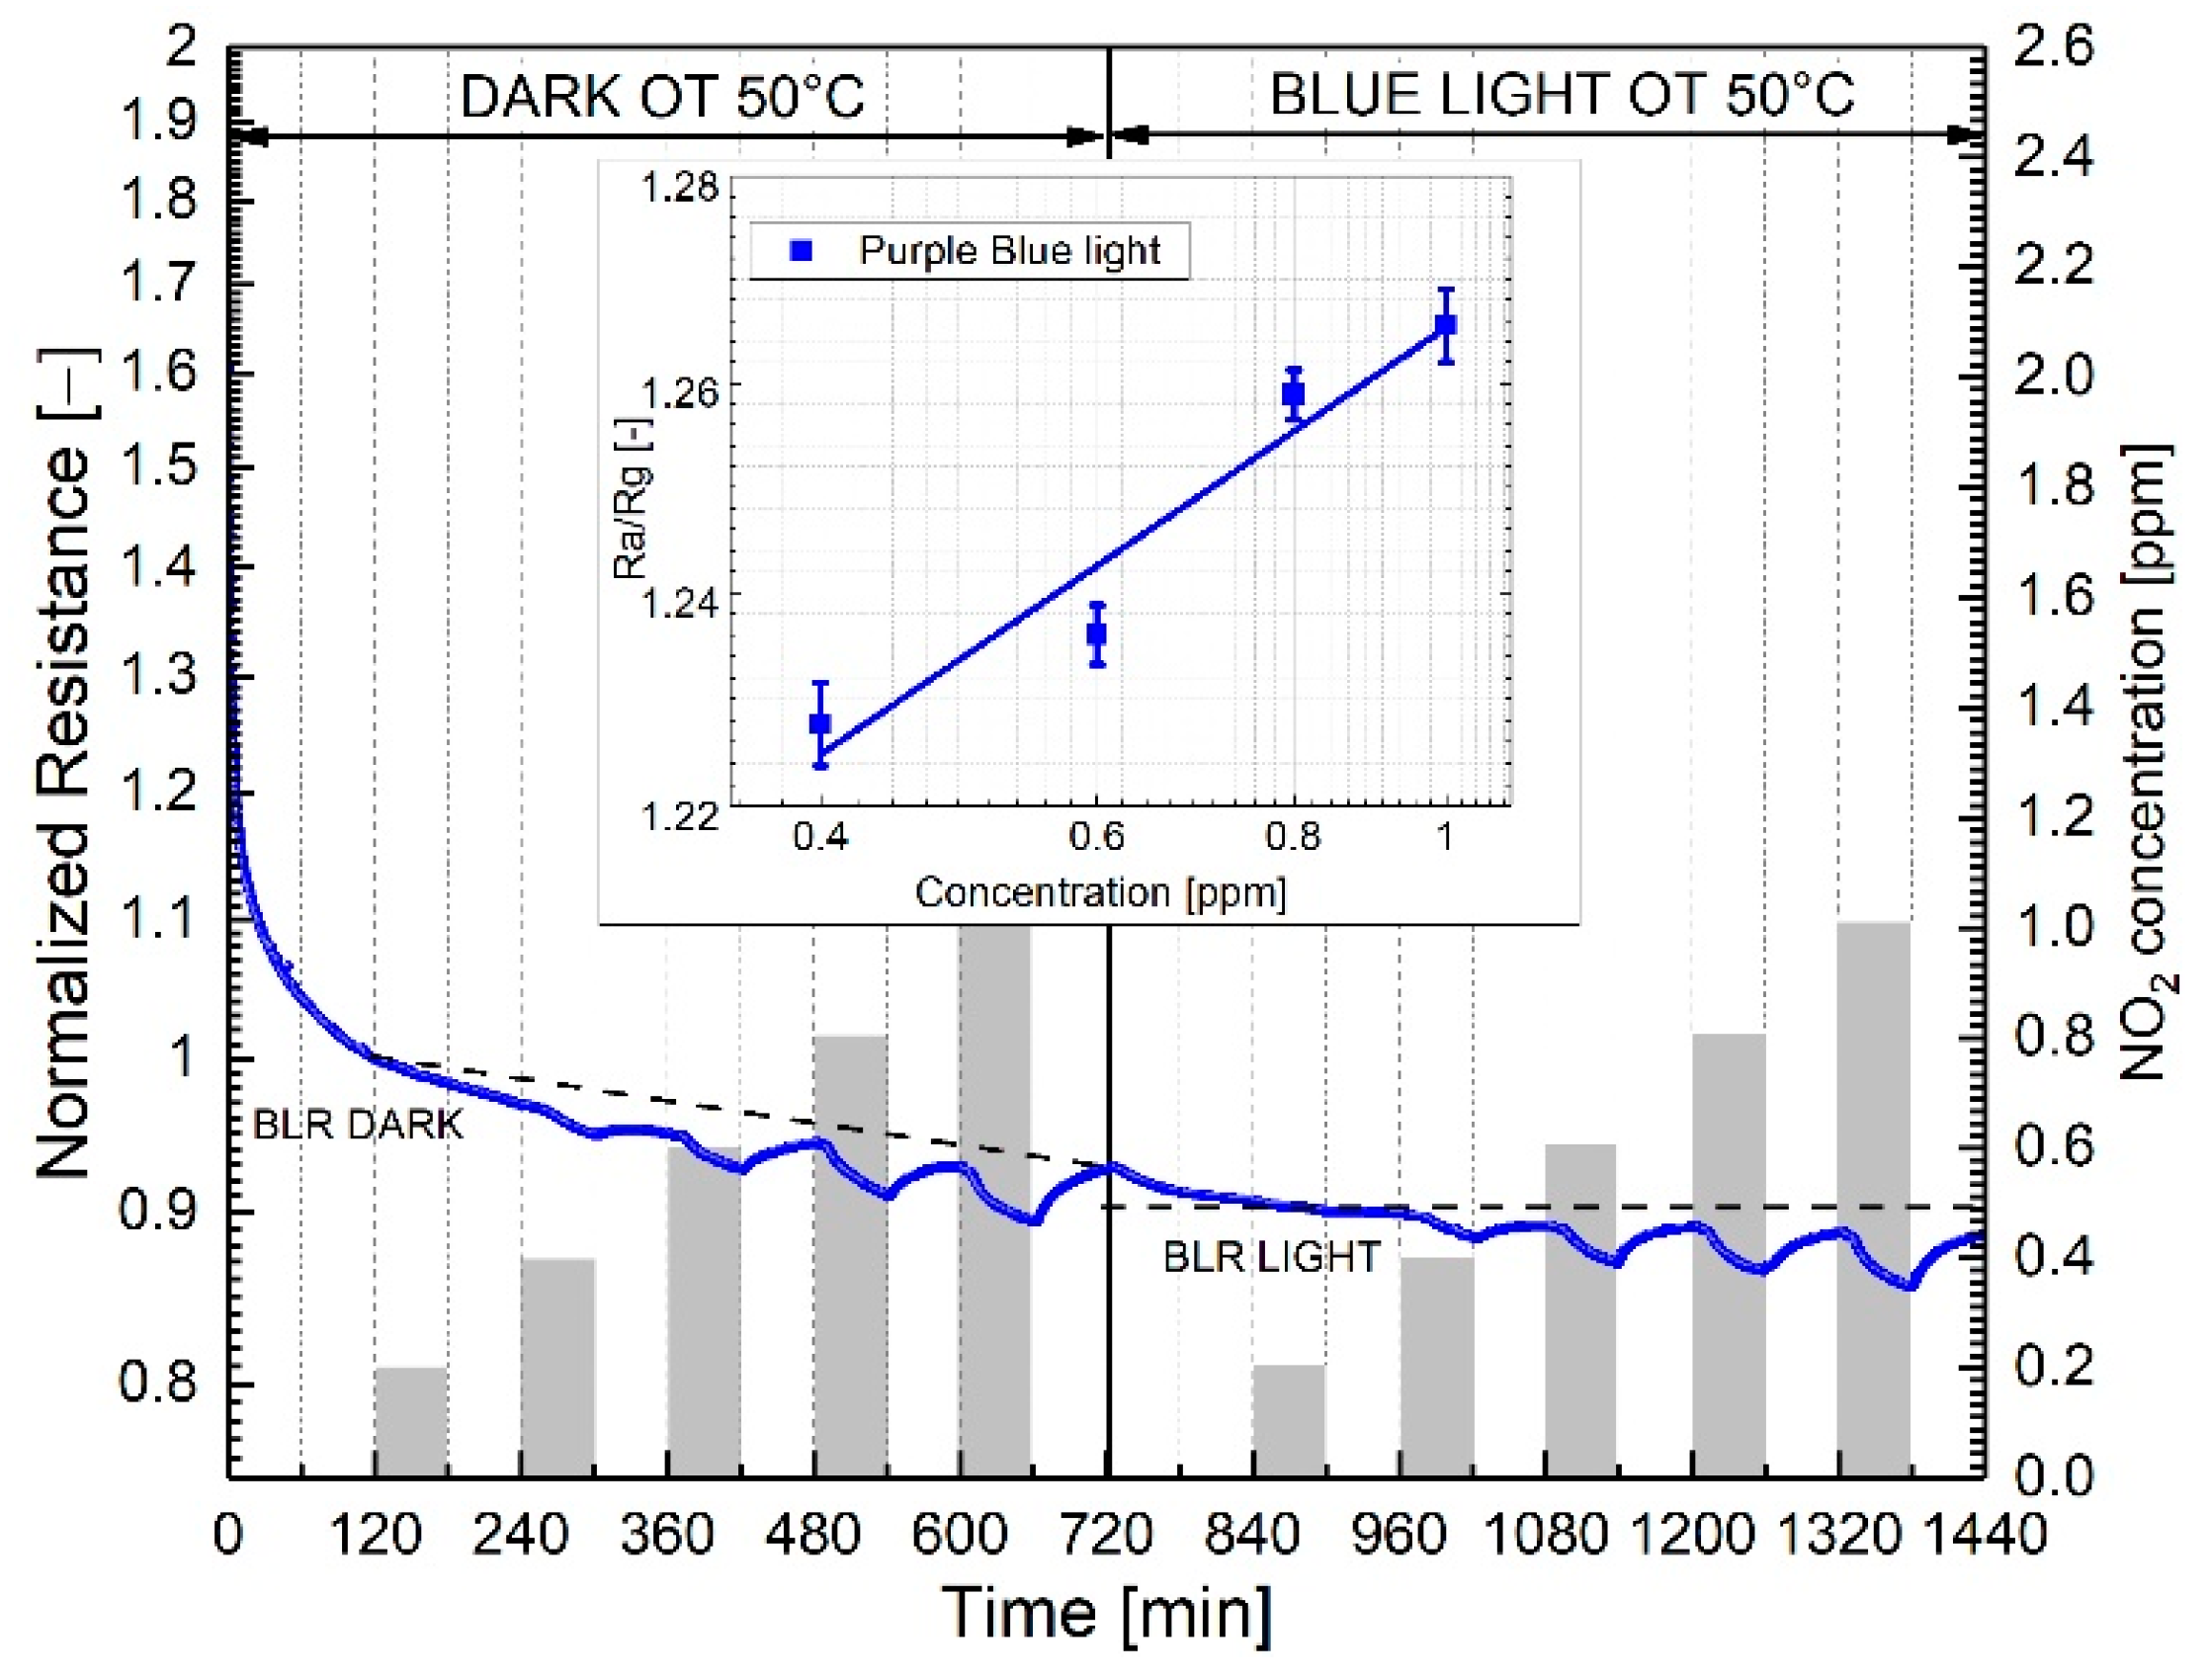
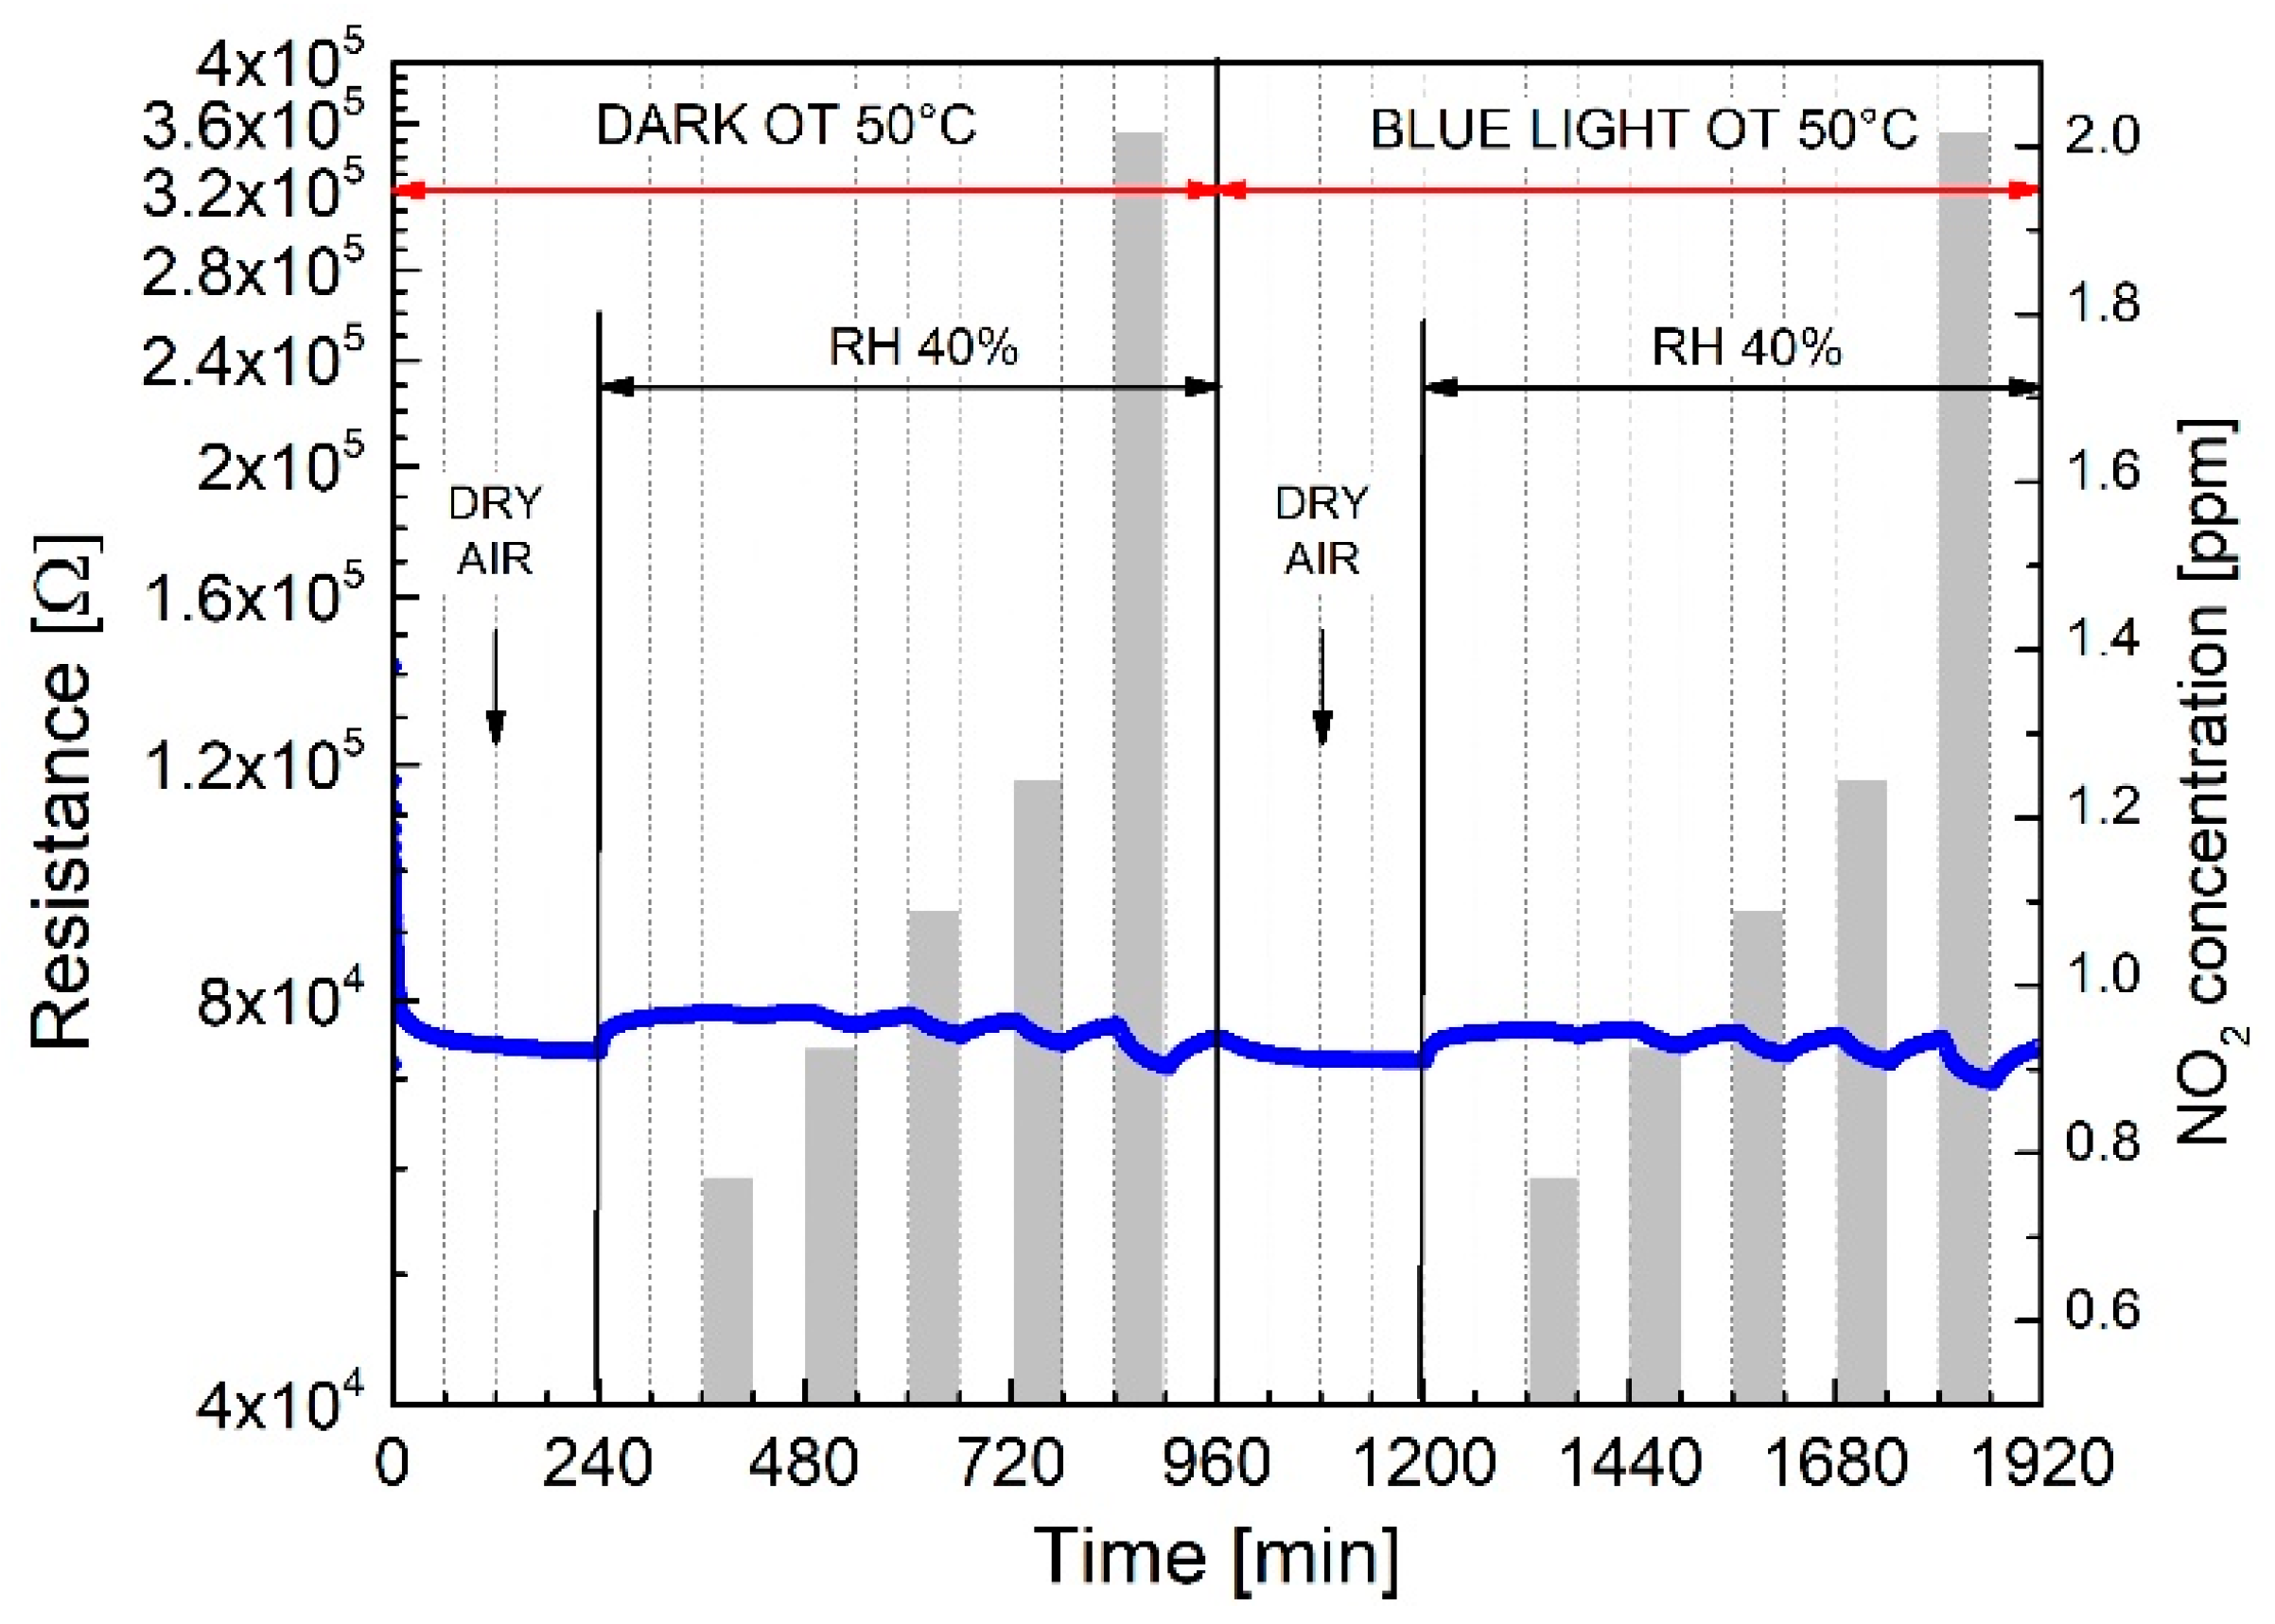
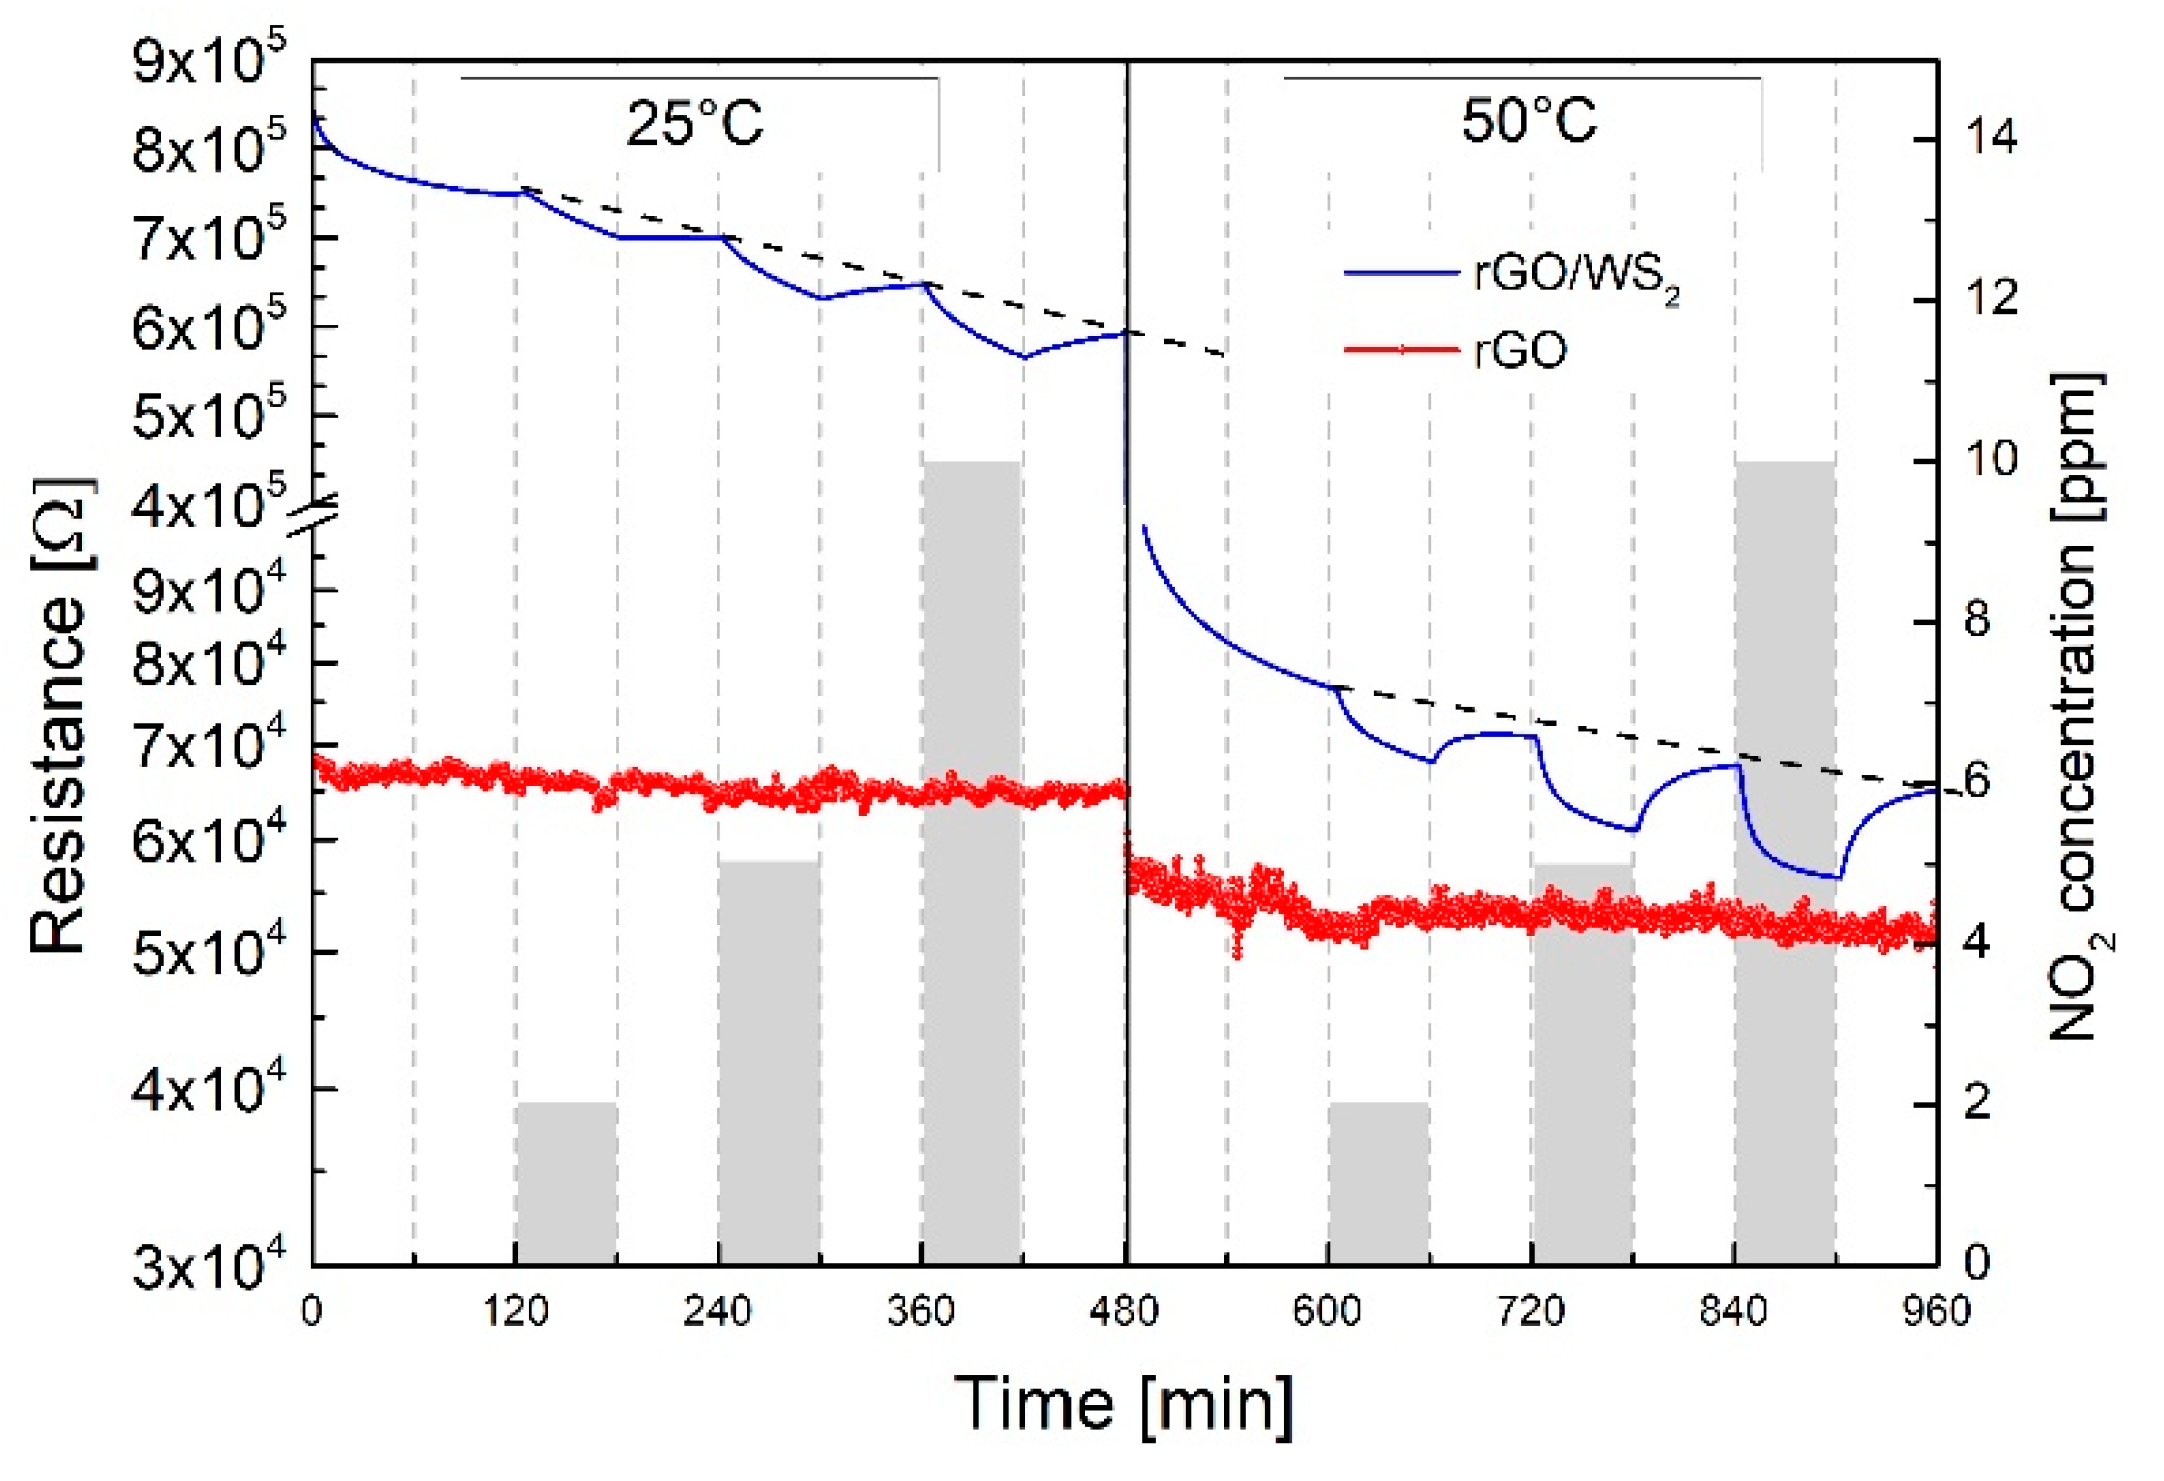
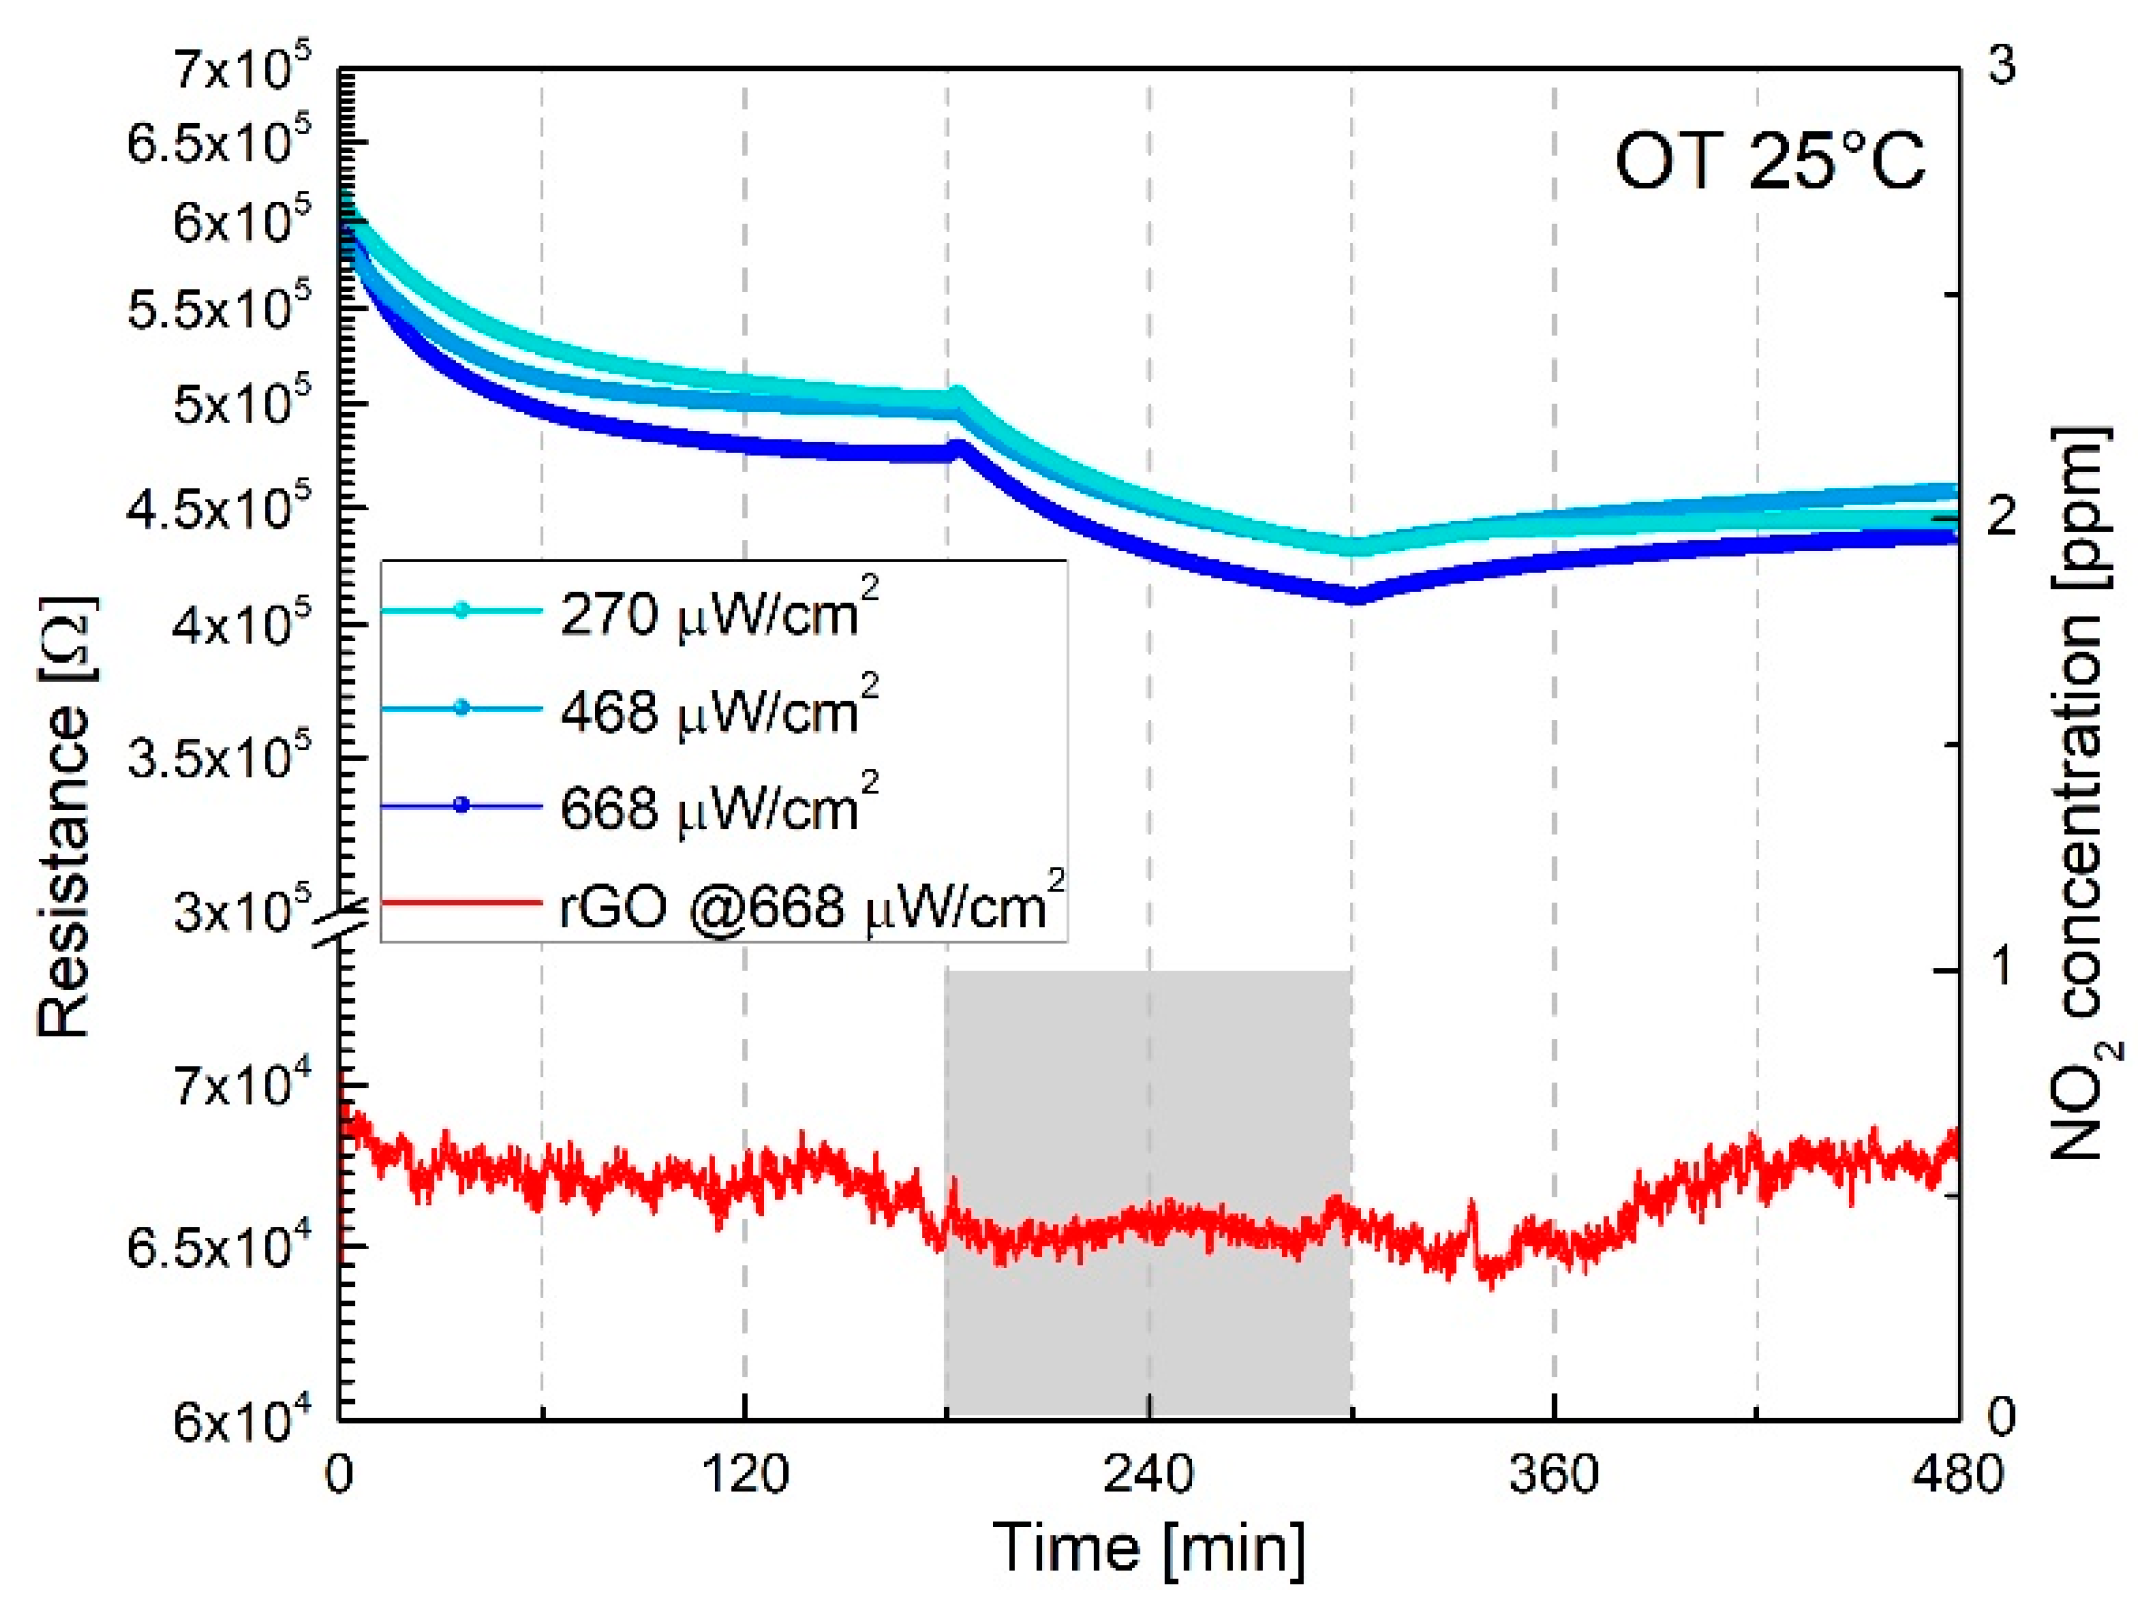
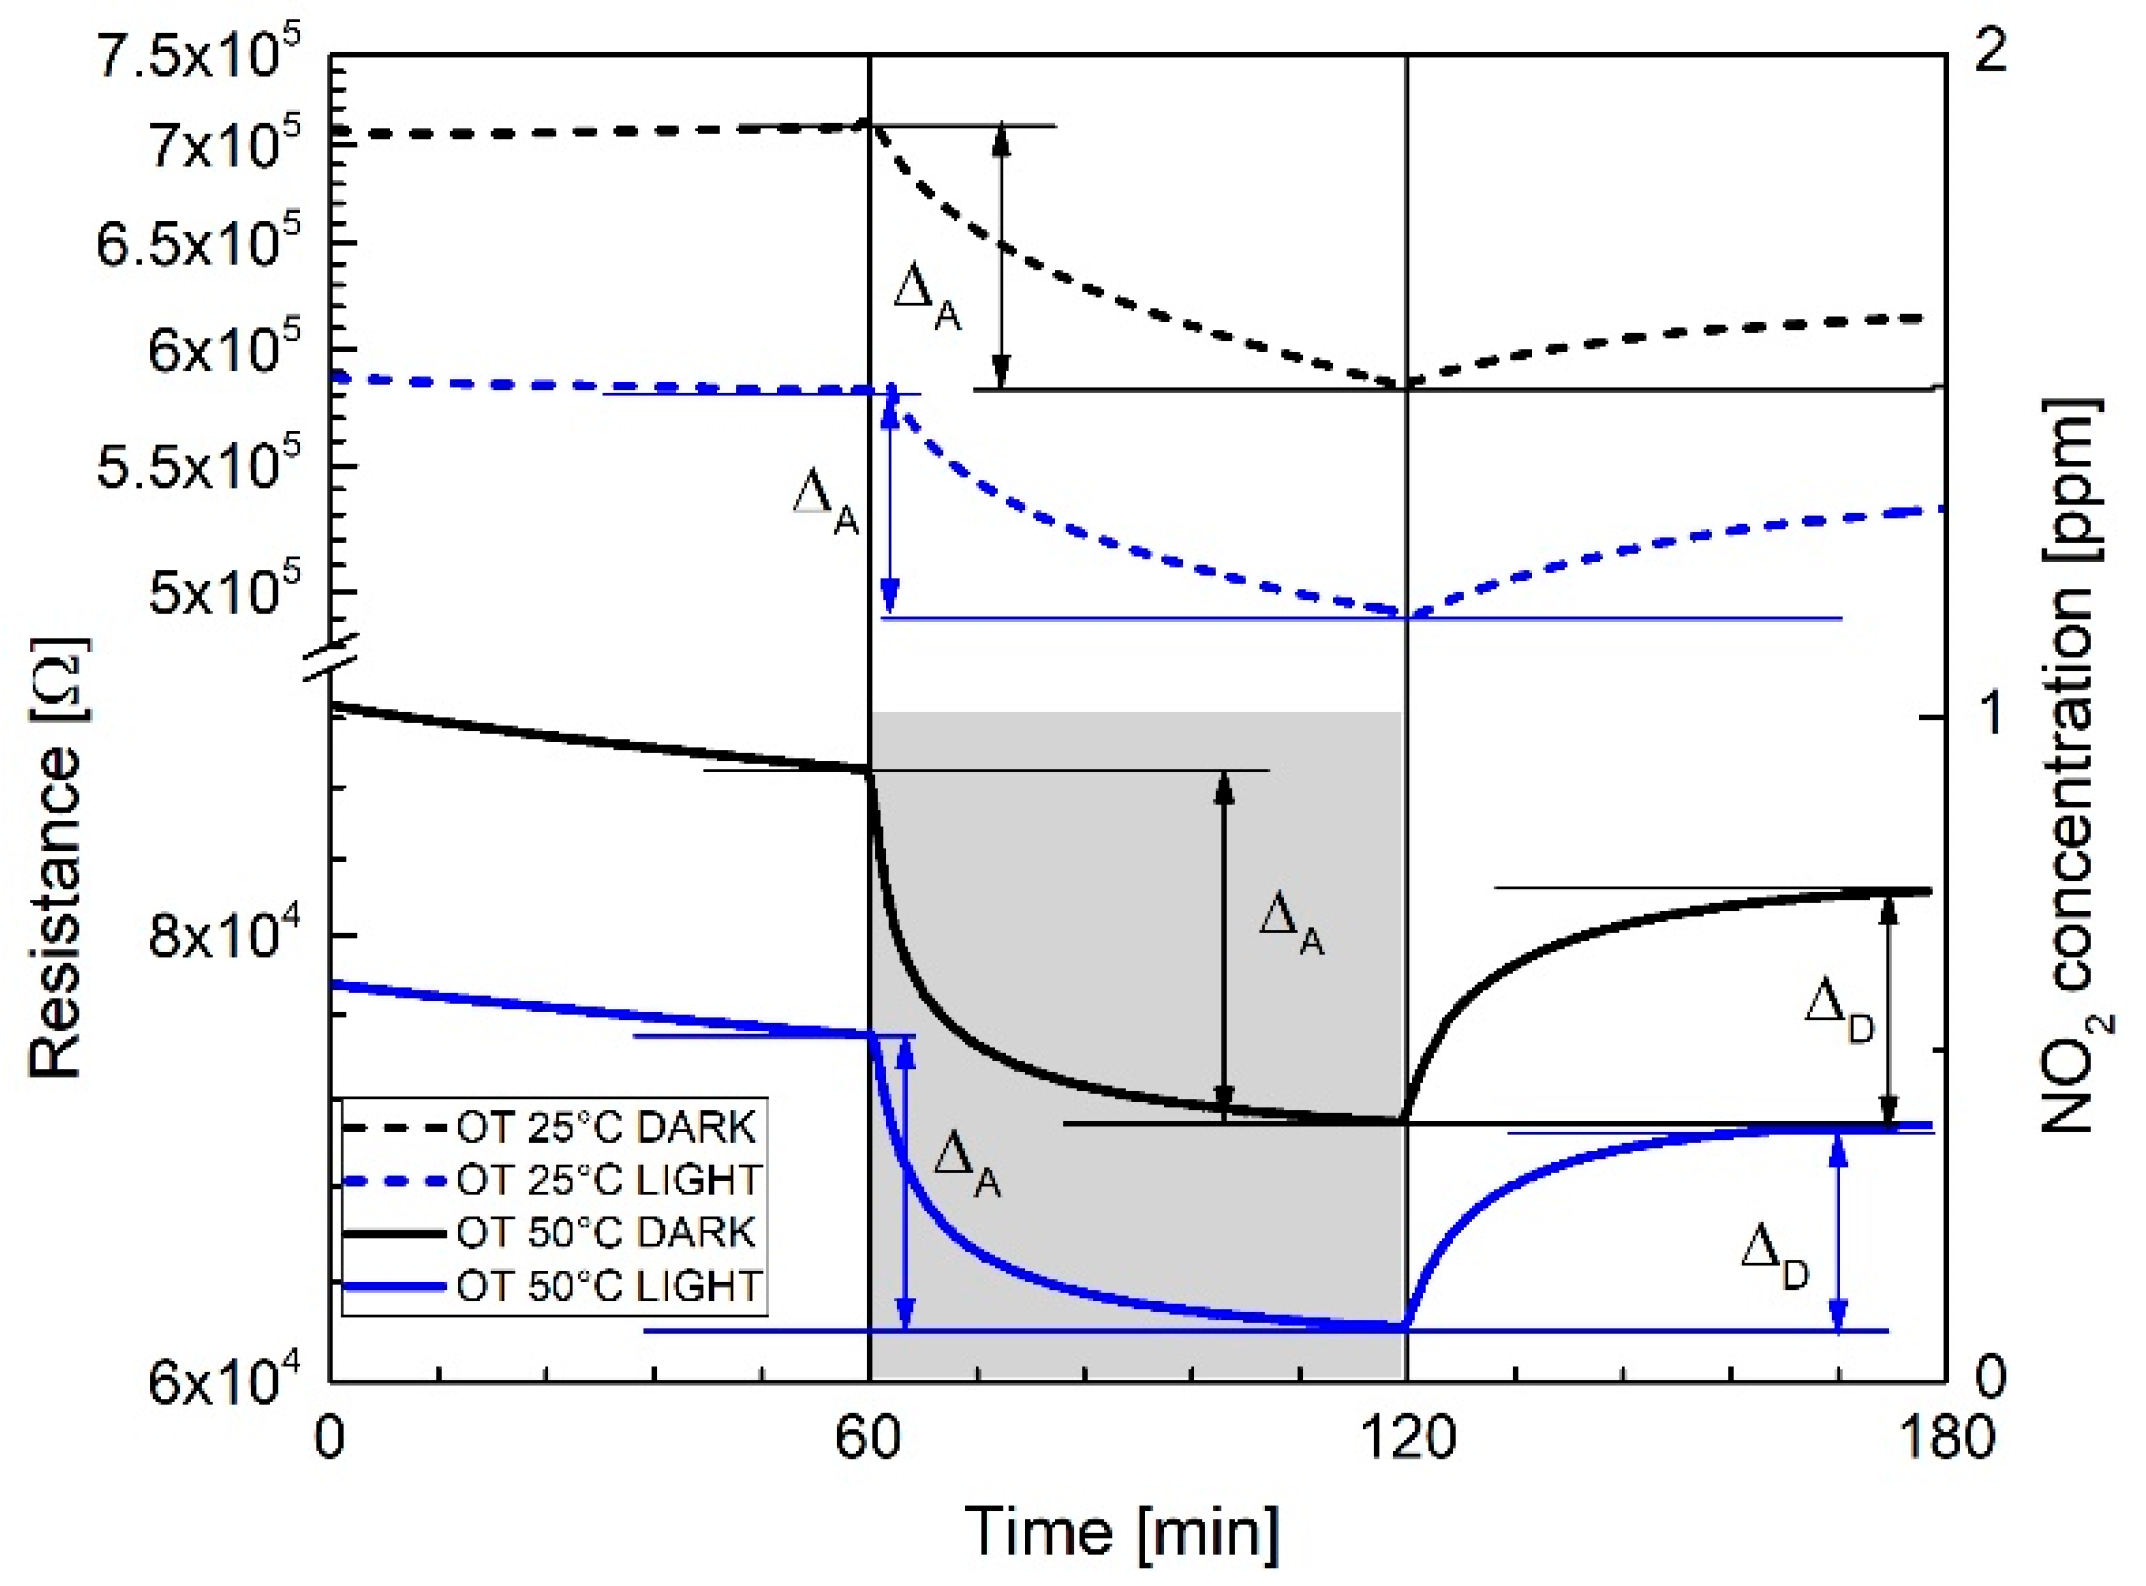
3.2. NO2 Gas Response

The reacting surface of the WS2-decorated rGO comprises, as attested by microstructural characterization, a flat underlying layer made of large and interconnected rGO flakes covered with dispersed, partially oxidized, WS2 flakes. Given that WS2 flakes do not form a continuous layer (see Figure 1a), it is the rGO layer which mostly determines the baseline resistance of the WS2–rGO hybrid. The NO2 gas responses in dry air of a single rGO film and a WS2-decorated rGO film at 25 °C and 50 °C operating temperatures (OT) are compared in Figure 5.
By increasing the OT to 50 °C, the baseline resistance (BLR) of the WS2-decorated rGO (dotted lines in the figure) decreases almost of one decade as compared to rGO, attesting the substantial contribution of the WS2 semiconductor to the overall resistance response. At 25 °C OT, by increasing the NO2 gas concentration, it is noted that: (i) the baseline resistance (BLR) is not recovered after gas desorption; (ii) baseline resistance steadily drifts, decreasing its resistance; (iii) the electrical signal never reaches equilibrium under adsorption/desorption conditions within the time schedule of the experiment (i.e., 60 min). Conversely, by increasing the OT to 50 °C, WS2-decorated rGO shows a faster response, improved equilibrium conditions and reduced baseline drift. Besides the positive effects related to the OT, it may be concluded that irreversible adsorption and baseline drift phenomena are still evident at 50 °C OT, representing a serious drawback for the exploitation of near room temperature WS2–rGO hybrids sensors.
According to previous research which demonstrated the positive effect of the combined action of light irradiation and thermal activation on the NO2 response of WO3 and NiO semiconductor sensors [12,13], Figure 6 shows the rGO’s and WS2–rGO hybrid’s NO2 gas responses at 25 °C in dry air under Purple Blue light (PB λ = 430 nm @ 2.88 eV) and different power densities at 270 μW/cm2, 468 μW/cm2 and 668 μW/cm2. Bare rGO exhibits neither significant changes of the electrical response at different power densities (in Figure 6 the response at 668 μW/cm2 is shown) nor any appreciable gas response to 1 ppm NO2. WS2-decorated rGO yields relative responses (RR = Ra/Rg at 1ppm NO2) of approximately 1.21, more or less independent of the power density. Response and recovery times, in contrast, improve with increasing the power density.
By selecting the 668 μW/cm2 light power density, Figure 7 shows the electrical response of the WS2-decorated rGO to 1 ppm NO2 in dry air under “dark” and “purple–blue” conditions at 25 °C and 50 °C OT respectively.
If we now define the recovery percentage (RP) as the percentage ratio (ΔDA) × 100, where ΔD and ΔA (see Figure 7) are the desorption/adsorption resistances’ variations (Δ), measured at the end of each desorption/adsorption cycle (i.e., 60 min), it turns out that light illumination strongly enhances the recovery of the baseline resistance during desorption.
As shown in Figure 7 and Table 1, recovery percentage (RP) values increase from 23% (dark) to 65% (light) at 25 °C OT, and from 60% (dark) to 70% (light) at 50 °C OT. Moreover, considering features and shapes of the curves displayed in Figure 7, at 25 °C OT regardless of “dark” or “light” exposures, no equilibrium conditions are achieved within the timescale of the experiment (i.e., 60 min). In contrast, as attested by the horizontal slopes of the two bottom curves of Figure 7, equilibrium conditions are achieved under adsorption/desorption conditions when light irradiation is performed and when the OT is increased to 50 °C. Notably, according to Table 1, given the associated uncertainty of the measurement (± 0.02), no substantial changes of the relative responses’ values are recorded with respect to 25 °C, either by increasing the OT to 50 °C or by illuminating the sensor with purple blue light.
The results shown in Table 1 are in line, both in terms of sensitivity, using comparable definitions, and time constants with those reported in literature for hybrid graphene/MoS2 structures for NO2 sensing [18,19] working in dark conditions and at higher operating temperatures (at least 150 °C).
Figure 8 compares the normalized dynamic gas responses of the WS2–rGO sensor at 50 °C OT under dark and light conditions, respectively. By increasing the NO2 concentration from 200 ppb to 1 ppm, purple blue light irradiation promotes full baseline recovery after each NO2 pulse, as demonstrated by the horizontal slope of the dotted line of Figure 8. WS2-decorated rGO exhibits an experimental detection limit of 400 ppb NO2 in dry air. The inset of Figure 8 shows the sensitivity plot of the response under PB illumination, with associated standard deviations. Reproducibility tests of the electrical response under pulse and cumulative NO2 adsorption/desorption exposures, shown in the supporting Figure S3, exhibit no substantial irreversible adsorption phenomena, as well as a fairly good reproducibility of the electrical response. Additionally, long-term stability properties of the baseline and saturation resistances to 1 ppm NO2 over a period of 12 months were also recorded. Supporting Figure S4 shows baseline resistances (upper curve) and saturation resistances corresponding to 1 ppm (lower curve), randomly collected over a period of 52 weeks, with associated standard deviations calculated over a set of five consecutive measurements. No remarkable fluctuations of both baseline and resistances at saturation are detectable, demonstrating good long-term stability properties of the WS2 films.
The effect of 40% relative humidity (RH) to the NO2 response, under dark and light conditions, at 50 °C OT, is shown in Figure 9. Regardless of the illumination: (i) the baseline resistance slightly increases from dry to humid (40% RH) conditions; (ii) the NO2 relative responses (Ra/Rg) at 40% RH, do not change appreciably neither under dark or light conditions; (iii) the baseline resistance is fully recovered after each adsorption/desorption cycle. This behavior demonstrates that humidity, regardless of the illumination conditions, does not appreciably interfere with the NO2 gas adsorption mechanism, suggesting, as it will be discussed in the next paragraph, that NO2 preferentially adsorbs on WS2, since energetically favored as respect to water vapor.
Finally, the sensors’ selectivity among other interfering gases such as H2, NH3, acetone and ethanol has been recorded and the results shown in Supporting Figure S5. The WS2-decorated rGO sensor exhibits an excellent selectivity for NO2 gas as compared to the other investigated species, making it suitable for being a selective NO2 sensor.

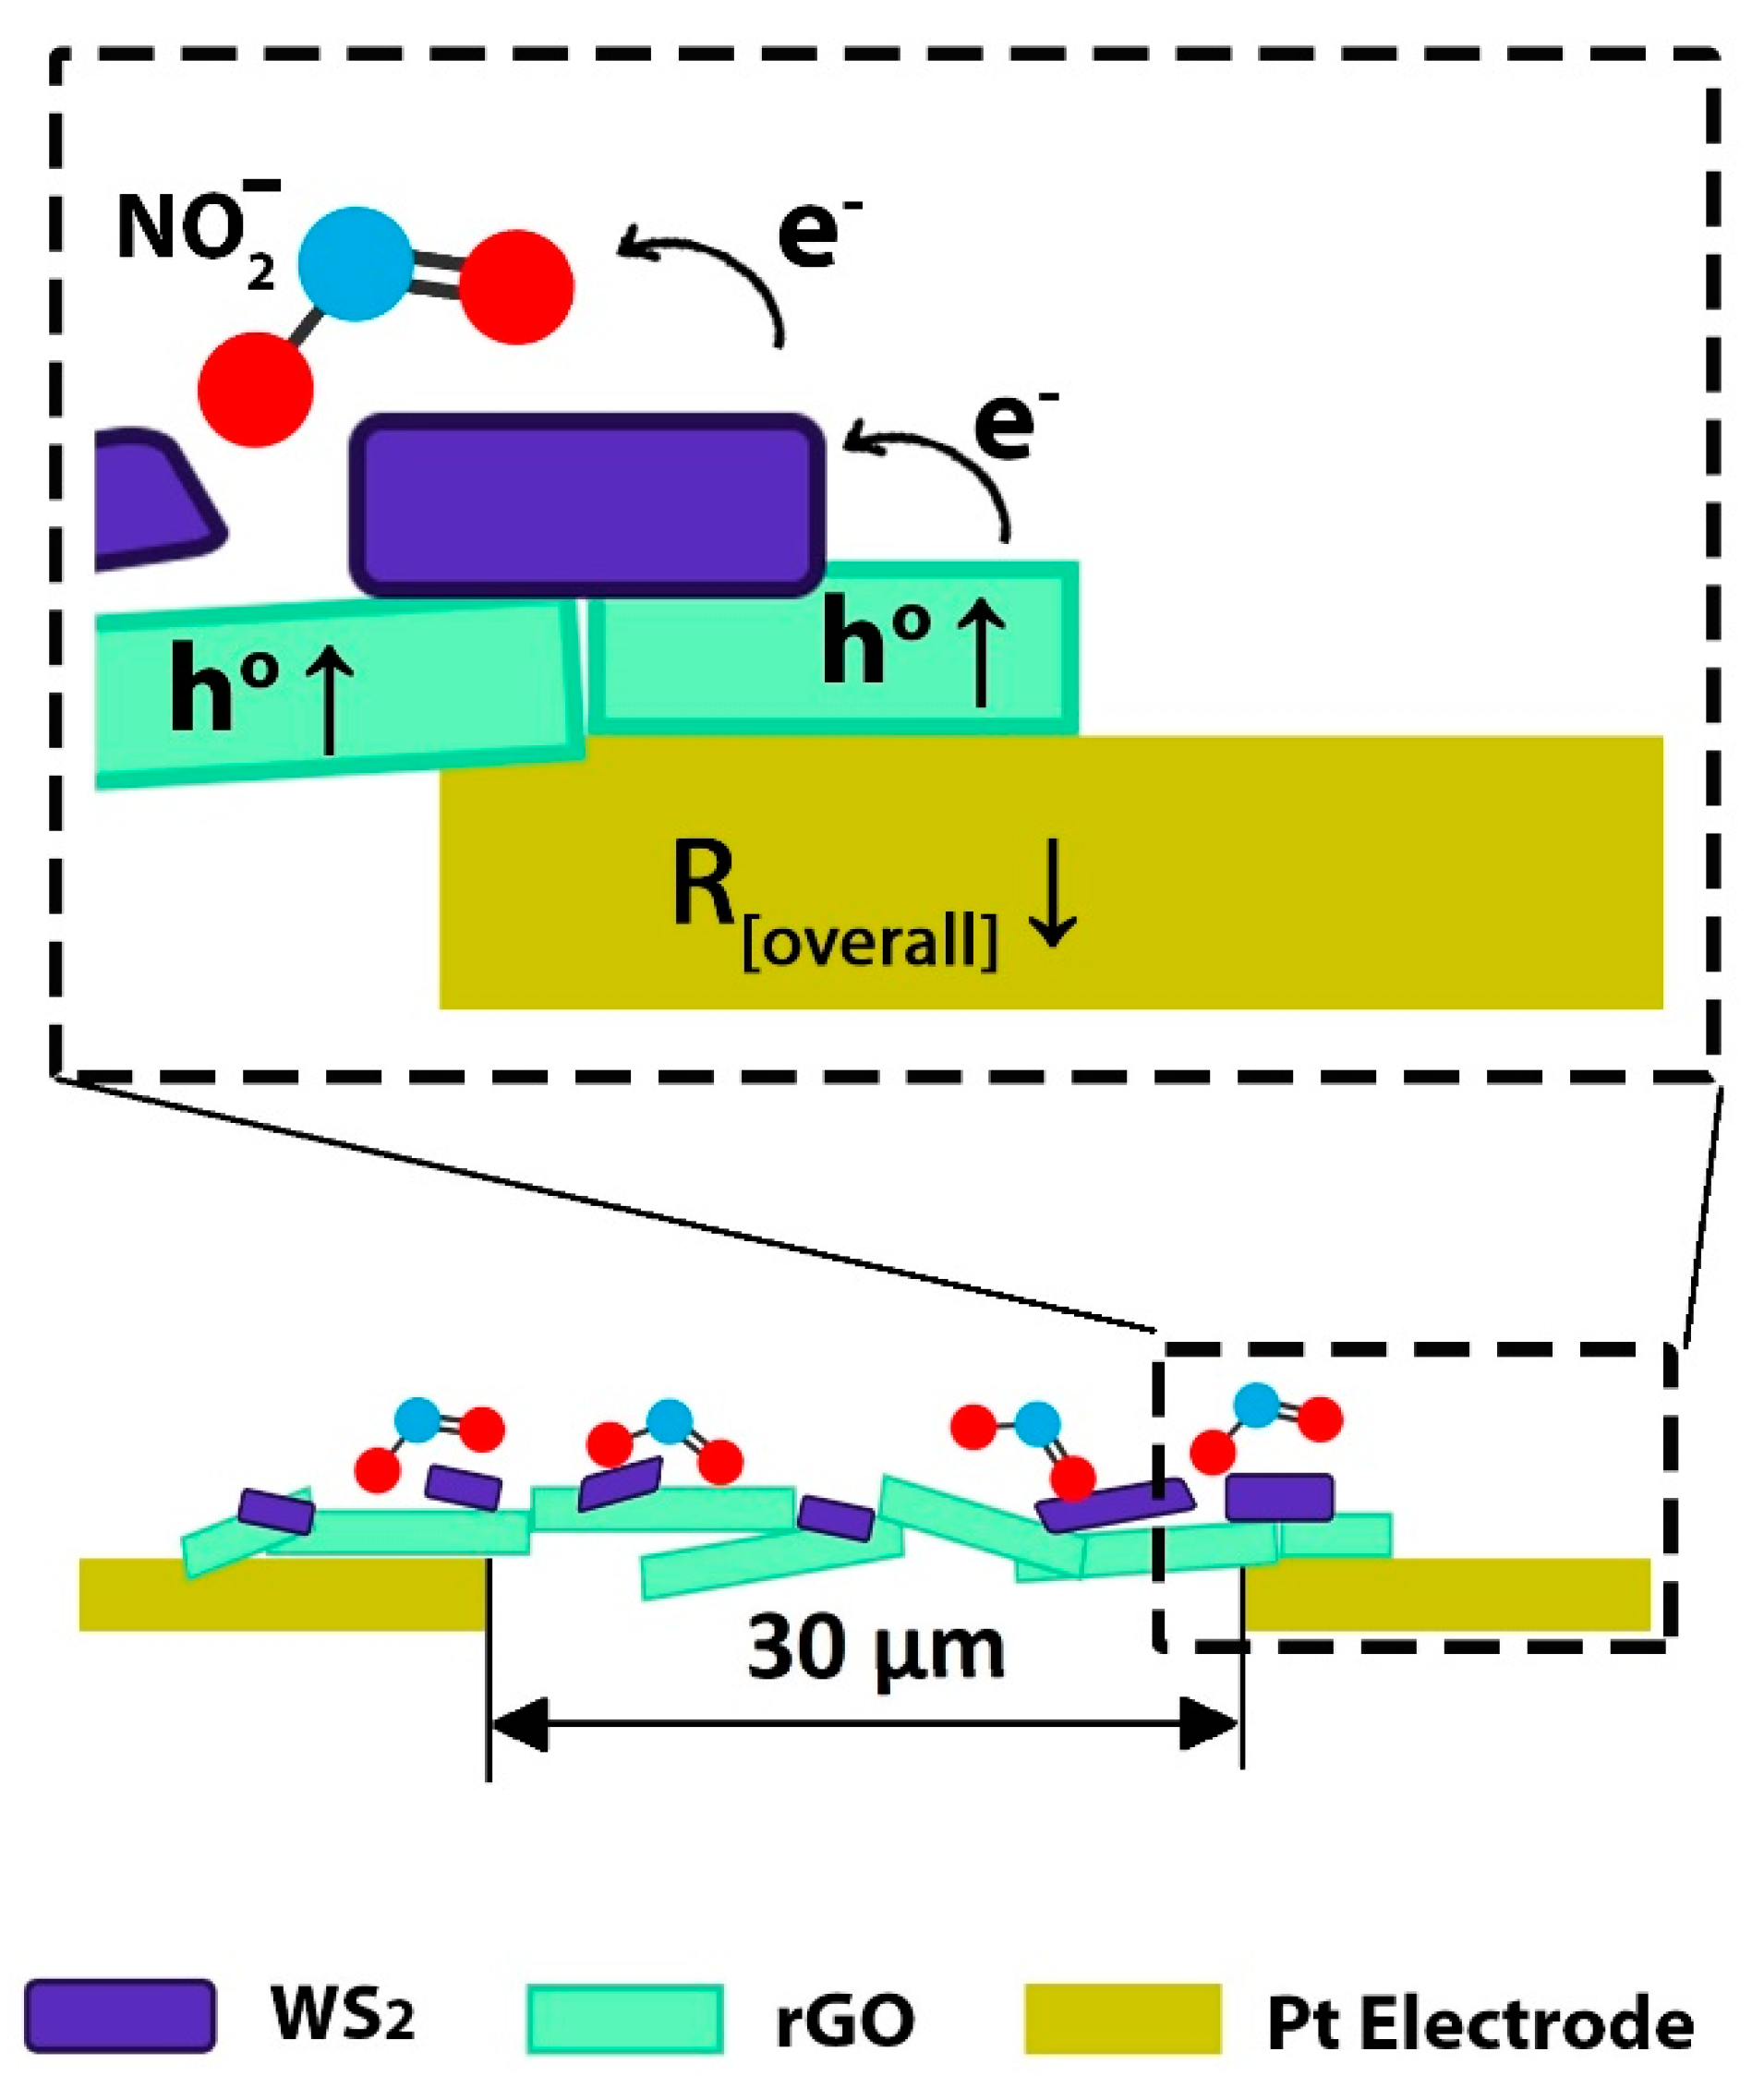
Gas Sensing Mechanism

Discussing the gas sensing mechanism of the WS2–rGO hybrid sensor with respect to water vapor and NO2, the single contribution of the rGO and WS2 species and WS2–rGO hybrid to the overall gas response have to be considered.
Regarding the single rGO in our previous work [29] we demonstrated that both as-deposited GO and partially reduced rGO (annealed in vacuum at 200 °C) exhibit a p-type response to NO2, resulting in a decrease of the resistance in the operating temperature range of 25–150 °C. Considering that the rGO prepared in this work shows a degree of reduction, located halfway between these two extremes, we would have expected a decrease of the resistance in Figure 5, rather than no response when exposing bare rGO film to NO2 gas. The lack of any gas response may not be entirely attributed to the decrease of functional groups induced by the mild reduction process (i.e., air annealed at 70 °C), but mostly to a substantially smaller amount of the deposited rGO, which amounts to approximately 1/10 of the quantity previously utilized [29]. It may be concluded that the deposition procedure adopted here yields an rGO film which does not significantly contribute to the NO2 response, while it guarantees the formation of a continuous, conductive layer “bridging” distant platinum finger-type electrodes.
Regarding single WS2, which is reported to increase its resistance to NO2, exhibiting an n-type response [7,16], some considerations apply. According to the XPS section, WS2 flakes deposited on rGO partially oxide to amorphous WO3 (approx 18%). Amorphous WO3, as previously discussed [7,16], acts as a non-conductive phase, eventually inhibiting the charge–carrier transfer mechanism within the flakes. It turns out that the formation of WO3, while not contributing to the overall gas response, has the merely negative effect of partially covering the underlying reacting surface of the WS2 flakes, eventually decreasing the relative gas response.
Regarding crystalline WS2, the variation of the electrical resistance induced by Air–NO2 mixtures, is part of a complex mechanism involving the combined effects physisorption, chemisorption, the role of edges and surface defects and the transduction mechanism. First principle calculations on MoS2 sulphur-vacancy-defective monolayers [32,33] demonstrated that O2 firstly chemisorbs on existing sulphur vacancies, secondly, that sulphur vacancies are passivated (i.e., “healed”) by the dissociative chemisorption of O2 molecules, leading to the formation of two Mo-O bonds. In case of direct NO2 molecules interaction with sulphur vacancies, a dissociative chemisorption of NO2 takes place, leading to oxygen atoms passivating the vacancies (i.e., “secondary healing”) and NO molecules eventually to be physisorbed on the MoS2 surface. Considering that both MoS2 and WS2, are susceptible to spontaneous oxidation in air [11], the mechanism of sulphur vacancies suppression operated by O2 and NO2 claimed for MoS2, can be reasonably extended to sulphur defective WS2. Under these circumstances, literature reports based on first principle calculations on “healed” WS2 surfaces pointed out that O2, NO2 and H2O physisorb on defect-free monolayer WS2 surfaces [34,35].
Regarding WS2 –rGO hybrids, they decrease their overall resistance when exposed to NO2 (see Figure 5), exhibiting, as reported for MoS2/Graphene composites [18,20], an overall p-type response. Bearing in mind that the WS2–rGO hybrid’s gas response depends on both charge transfer values (positive charge transfer values between adsorbing molecules and the material surface stand for electrons withdrawal from the material) and adsorption energies (negative adsorption energy means that the adsorption process is exothermic and energetically favourable), the following discussion applies.
According to Table 2, adsorption of a single NO2 molecule on rGO yields charge transfer values of approximately 0.029e and associated adsorption energies of −0.80 eV [32,34,35]. By contrast, the adsorption of a single NO2 molecule on defect free WS2 indicate that NO2 physisorbs on WS2 yielding charge transfer values of 0.178e and associated adsorption energies of −0.41 eV [34,35].
Considering that calculated NO2 charge transfer values are 0.029e for rGO and 0.178e for WS2, it turns out that WS2 yields a net charge transfer 6.14 times higher than on of rGO per NO2 physisorbed molecule. Given these premises, the electrical response of WS2-decorated rGO as compared to single rGO shown in Figure 5, accounts for the larger WS2′s charge carrier exchange with respect to rGO.
Figure 10, which is a schematic illustration of the WS2-decorated rGO film, deposited between two platinum electrodes 30 µm apart, highlights that NO2 molecules adsorbs on both rGO and WS2 causing electrons to withdraw from both materials. Considering the smaller charge transfer induced by NO2 adsorption on rGO (i.e., 0.029e) with respect to WS2 (i.e., 0.178e), by exposing the WS2–rGO hybrid to NO2 gas, the NO2 gas molecule withdraws electrons mainly from the WS2 surface. As a consequence, electron-depleted n-type WS2 flakes drain electrons from the underlying p-type rGO, thanks to a rapid electron transport from the highly conducting rGO to the less-conducting WS2 [19,22]. The increase of hole concentration in p-type rGO due to physisorption of NO2 molecules on WS2 flakes, explains the decrease of the overall resistance of the p-type WS2-decorated rGO shown in Figure 5. It may be concluded that rGO flakes, with excellent transport capability, serve as highly conductive channels bridging distant electrodes, whereas WS2 decoration eventually modulates the NO2 gas response.
Regarding the influence of purple–blue light, it is well known that response and recovery rates depend on the adsorption energy of the adsorbed gas molecules (see Table 2). Light irradiation and thermal activation represent, therefore, two alternative or complementary modes to improve response/recovery rates [13]. By irradiating WS2-decorated rGO with purple–blue light (PB λ = 430 nm) the associated photon energy of 2.88 eV and power density of 668 μW/cm2 provide: (i) a large quantity of photo generated electrons/holes; (ii) the required energy to desorb physisorbed O2, NO2 and H2O molecules from both rGO and WS2 flakes. Under NO2 gas and PB light illumination, physisorbed oxygen partially desorbs from its adsorption site (☐) according to Reaction (1) while NO2 physisorbs on free sites (☐) left behind from oxygen desorption according to Reaction (2). At equilibrium the overall reaction is represented by Equation (3).
( O 2 ) + h + + e O 2 + + e
N O 2 + + e ( N O 2 )
( O 2 ) + h + + e ( N O 2 ) + O 2
Considering that NO2 molecules withdraw electrons with an associated charge transfer of 0.178e as compared to that of Oxygen of 0.136e [34], under NO2 adsorption, Equation (3) is shifted to the right, meaning an excess of holes, which explains the overall resistance decrease of the WS2–rGO hybrid. Moreover, the improved recovery percentages and response times of Figure 7, account for the extra light-photogenerated carriers which speed up the time to reach equilibrium (Equation (3)) both during gas exposure and recovery.
Regarding water interaction with WS2–rGO hybrid the reason why humidity, regardless of the illumination conditions, does not appreciably interfere with the NO2 gas response, can be tentatively explained (see Table 2) evaluating that the adsorption energy of a NO2 molecule on WS2 is approximately twice (−0.41 eV) the corresponding energy of water (−0.23 eV), indicating a stronger attitude of NO2 molecules to adsorb on WS2 compared to water. Finally, the initial resistance increase of the WS2–rGO when exposed to humid air can be explained taking into consideration that water is a reducing agent, which adsorbs on both rGO and WS2 injecting electrons, thus decreasing the hole concentration in rGO and WS2, causing an overall resistance increase of the WS2–rGO hybrid.

4. Conclusions

We have exfoliated, by a combined grinding and sonication technique, WS2 commercial powders into mono-to few-layer flakes of WS2, with an average dimension of 200 nm, which have been successfully dispersed with rGO flakes with average dimensions of 700 nm, to yield WS2-decorated rGO as chemo-resistive NO2 thin film sensor. Operating at near room temperature conditions and providing an extra source of energy, by purple–blue light illumination, we have proposed a possible strategy to improve adsorption/desorption rates and to suppress water vapour cross sensitivity. The deposition procedure adopted here yields WS2 flakes which mostly drive the NO2 gas response, while the underlying rGO film guarantees the formation of a continuous, conductive layer “bridging” distant platinum finger-type electrodes. By retrieving literature data about charge carriers and adsorption energies deriving from the interaction of NO2, O2 and water molecules with WS2 and rGO, we have proposed a gas sensing mechanism which accounts for the overall gas response of the WS2–rGO hybrids.

Supplementary Materials

The following are available online at https://www.mdpi.com/1424-8220/19/11/2617/s1, Figure S1: Schematic illustration of WS2 exfoliation process, Figure S2: Grazing incidence XRD spectrum of WS2-decorated rGO film, Figure S3: Reproducibility and base line recovery features of the WS2-decorated rGO by exposing the film to both dynamic and cumulative NO2 concentrations (5–10 ppm) under light irradiation (purple blue), Figure S4. Long term stability properties of the WS2/rGO hybrid sensor, Selectivity response of the the WS2/rGO hybrid sensor to different oxidizing and reducing gases, measured at 50 °C operating temperature under purple-blue illumination.

Author Contributions

Conceptualization, L.O., C.C and V.P.; investigation, V.P. and S.M.E.; data curation, V.P.; Methodology, L.O. and C.C.; Formal analysis, V.P.; writing—original draft preparation, C.C. and V.P.; writing—review and editing, L.O., C.C.

Funding

This research was funded by REGIONE ABRUZZO Dipartimento Sviluppo Economico, Politiche del Lavoro, Istruzione, Ricerca e Università Servizio Ricerca e Innovazione Industriale for financial support throug progetto POR FESR Abruzzo 2018-2020 Azione 1.1.1 e 1.1.4—“Studio di soluzioni innovative di prodotto e di processo basate sull’utilizzo industriale dei materiali avanzati” CUP n. C17H18000100007.

Conflicts of Interest

The authors declare no conflict of interest.

References

  1. Yang, W.; Gan, L.; Li, H.; Zhai, T. Two-dimensional layered nanomaterials for gas-sensing applications. Inorg. Chem. Front. 2016, 3, 433–451. [Google Scholar] [CrossRef]
  2. Donarelli, M.; Ottaviano, L. 2D Materials for Gas Sensing Applications: A Review on Graphene Oxide, MoS2, WS2 and Phosphorene. Sensors 2018, 18, 3638. [Google Scholar] [CrossRef]
  3. Late, D.J.; Huang, Y.K.; Liu, B.; Acharya, J.; Shirodkar, S.N.; Luo, J.; Yan, A.; Charles, D.; Waghmare, U.V.; Dravid, V.P.; et al. Sensing behavior of atomically thin-layered MoS2 transistors. ACS Nano 2013, 7, 4879–4891. [Google Scholar] [CrossRef] [PubMed]
  4. Liu, B.; Chen, L.; Liu, G.; Abbas, A.N.; Fathi, M.; Zhou, C. High-Performance Chemical Sensing Using Schottky-Contacted Chemical Vapor Deposition Grown Monolayer MoS2 Transistors. ACS Nano 2014, 8, 5304–5314. [Google Scholar] [CrossRef] [PubMed]
  5. Donarelli, M.; Prezioso, S.; Perrozzi, F.; Bisti, F.; Nardone, M.; Giancaterini, L.; Cantalini, C.; Ottaviano, L. Response to NO2 and other gases of resistive chemically exfoliated MoS2-based gas sensors. Sens. Actuators B Chem. 2015, 207, 602–613. [Google Scholar] [CrossRef]
  6. Kuru, C.; Choi, D.; Kargar, A.; Liu, C.H.; Yavuz, S.; Choi, C.; Jin, S.; Bandaru, P.R. High-performance flexible hydrogen sensor made of WS2 nanosheet–Pd nanoparticle composite film. Nanotechnology 2016, 27, 195501. [Google Scholar] [CrossRef] [PubMed]
  7. Perrozzi, F.; Emamjomeh, S.M.M.; Paolucci, V.; Taglieri, G.; Ottaviano, L.; Cantalini, C. Thermal stability of WS2 flakes and gas sensing properties of WS2/WO3 composite to H2, NH3 and NO2. Sens. Actuators B Chem. 2017, 243, 812–822. [Google Scholar] [CrossRef]
  8. Baek, J.; Yin, D.; Liu, N.; Omkaram, I.; Jung, C.; Im, H.; Hong, S.; Kim, S.M.; Hong, Y.K.; Hur, J.; et al. A highly sensitive chemical gas detecting transistor based on highly crystalline CVD-grown MoSe2 films. Nano Res. 2017, 10, 1861–1871. [Google Scholar] [CrossRef]
  9. Feng, Z.; Xie, Y.; Chen, J.; Yu, Y.; Zheng, S.; Zhang, R.; Li, Q.; Chen, X.; Sun, C.; Zhang, H.; et al. Highly sensitive MoTe2 chemical sensor with fast recovery rate through gate biasing. 2D Mater. 2017, 4, 025018. [Google Scholar] [CrossRef]
  10. Cho, B.; Hahm, M.G.; Choi, M.; Yoon, J.; Kim, A.R.; Lee, Y.-J.J.; Park, S.-G.G.; Kwon, J.-D.D.; Kim, C.S.; Song, M.; et al. Charge-transfer-based gas sensing using atomic-layer MoS2. Sci. Rep. 2015, 5, 8052. [Google Scholar] [CrossRef]
  11. Gao, J.; Li, B.; Tan, J.; Chow, P.; Lu, T.M.; Koratkar, N. Aging of Transition Metal Dichalcogenide Monolayers. ACS Nano 2016, 10, 2628–2635. [Google Scholar] [CrossRef] [PubMed]
  12. Giancaterini, L.; Emamjomeh, S.M.; De Marcellis, A.; Palange, E.; Resmini, A.; Anselmi-Tamburini, U.; Cantalini, C. The influence of thermal and visible light activation modes on the NO2 response of WO3 nanofibers prepared by electrospinning. Sens. Actuators B Chem. 2016, 229, 387–395. [Google Scholar] [CrossRef]
  13. Geng, X.; Lahem, D.; Zhang, C.; Li, C.-J.; Olivier, M.-G.; Debliquy, M. Visible light enhanced black NiO sensors for ppb-level NO2 detection at room temperature. Ceram. Int. 2019, 45, 4253–4261. [Google Scholar] [CrossRef]
  14. Hu, J.; Zou, C.; Su, Y.; Li, M.; Ye, X.; Cai, B.; Kong, E.S.-W.; Yang, Z.; Zhang, Y. Light-assisted recovery for a highly-sensitive NO2 sensor based on RGO-CeO2 hybrids. Sens. Actuators B Chem. 2018, 270, 119–129. [Google Scholar] [CrossRef]
  15. Berholts, A.; Kahro, T.; Floren, A.; Alles, H.; Jaaniso, R. Photo-activated oxygen sensitivity of graphene at room temperature. Appl. Phys. Lett. 2014, 105, 163111. [Google Scholar] [CrossRef]
  16. Huo, N.; Yang, S.; Wei, Z.; Li, S.-S.; Xia, J.-B.; Li, J. Photoresponsive and Gas Sensing Field-Effect Transistors based on Multilayer WS2 Nanoflakes. Sci. Rep. 2015, 4, 5209. [Google Scholar] [CrossRef]
  17. Ottaviano, L.; Palleschi, S.; Perrozzi, F.; D’Olimpio, G.; Priante, F.; Donarelli, M.; Benassi, P.; Nardone, M.; Gonchigsuren, M.; Gombosuren, M.; et al. Mechanical exfoliation and layer number identification of MoS2 revisited. 2D Mater. 2017, 4, 045013. [Google Scholar] [CrossRef]
  18. Cho, B.; Yoon, J.; Lim, S.K.; Kim, A.R.; Kim, D.-H.; Park, S.-G.; Kwon, J.-D.; Lee, Y.-J.; Lee, K.-H.; Lee, B.H.; et al. Chemical Sensing of 2D Graphene/MoS2 Heterostructure device. ACS Appl. Mater. Interfaces 2015, 7, 16775–16780. [Google Scholar] [CrossRef]
  19. Long, H.; Harley-Trochimczyk, A.; Pham, T.; Tang, Z.; Shi, T.; Zettl, A.; Carraro, C.; Worsley, M.A.; Maboudian, R. High Surface Area MoS2/Graphene Hybrid Aerogel for Ultrasensitive NO2 Detection. Adv. Funct. Mater. 2016, 26, 5158–5165. [Google Scholar] [CrossRef]
  20. Niu, Y.; Jiao, W.C.; Wang, R.G.; Ding, G.M.; Huang, Y.F. Hybrid nanostructures combining graphene-MoS2 quantum dots for gas sensing. J. Mater. Chem. A 2016, 4, 8198–8203. [Google Scholar] [CrossRef]
  21. Yang, J.; Voiry, D.; Ahn, S.J.; Kang, D.; Kim, A.Y.; Chhowalla, M.; Shin, H.S. Two-dimensional hybrid nanosheets of tungsten disulfide and reduced graphene oxide as catalysts for enhanced hydrogen evolution. Angew. Chem. Int. Ed. 2013, 52, 13751–13754. [Google Scholar] [CrossRef] [PubMed]
  22. Zhang, J.; Wang, Q.; Wang, L.; Li, X.; Huang, W. Layer-controllable WS2-reduced graphene oxide hybrid nanosheets with high electrocatalytic activity for hydrogen evolution. Nanoscale 2015, 7, 10391–10397. [Google Scholar] [CrossRef] [PubMed]
  23. Jha, R.K.; Burman, D.; Santra, S.; Guha, P.K. WS2/GO Nanohybrids for Enhanced Relative Humidity Sensing at Room Temperature. IEEE Sens. J. 2017, 17, 7340–7347. [Google Scholar] [CrossRef]
  24. Wang, X.; Gu, D.; Li, X.; Lin, S.; Zhao, S.; Rumyantseva, M.N.; Gaskov, A.M. Reduced graphene oxide hybridized with WS2 nanoflakes based heterojunctions for selective ammonia sensors at room temperature. Sens. Actuators B Chem. 2019, 282, 290–299. [Google Scholar] [CrossRef]
  25. Treossi, E.; Melucci, M.; Liscio, A.; Gazzano, M.; Samorì, P.; Palermo, V. High-Contrast Visualization of Graphene Oxide on Dye-Sensitized Glass, Quartz, and Silicon by Fluorescence Quenching. J. Am. Chem. Soc. 2009, 131, 15576–15577. [Google Scholar] [CrossRef] [PubMed]
  26. Mao, X.; Xu, Y.; Xue, Q.; Wang, W.; Gao, D. Ferromagnetism in exfoliated tungsten disulfide nanosheets. Nanoscale Res. Lett. 2013, 8, 1–6. [Google Scholar] [CrossRef] [PubMed]
  27. Stankovich, S.; Dikin, D.A.; Piner, R.D.; Kohlhaas, K.A.; Kleinhammes, A.; Jia, Y.; Wu, Y.; Nguyen, S.B.T.; Ruoff, R.S. Synthesis of graphene-based nanosheets via chemical reduction of exfoliated graphite oxide. Carbon N. Y. 2007. [Google Scholar] [CrossRef]
  28. Park, S.; Lee, K.S.; Bozoklu, G.; Cai, W.; Nguyen, S.B.T.; Ruoff, R.S. Graphene oxide papers modified by divalent ions—Enhancing mechanical properties via chemical cross-linking. ACS Nano 2008. [Google Scholar] [CrossRef]
  29. Prezioso, S.; Perrozzi, F.; Giancaterini, L.; Cantalini, C.; Treossi, E.; Palermo, V.; Nardone, M.; Santucci, S.; Ottaviano, L. Graphene Oxide as a Practical Solution to High Sensitivity Gas Sensing. J. Phys. Chem. C 2013, 117, 10683–10690. [Google Scholar] [CrossRef]
  30. Di Paola, A.; Palmisano, L.; Venezia, A.M.; Augugliaro, V. Coupled Semiconductor Systems for Photocatalysis. Preparation and Characterization of Polycrystalline Mixed WO3/WS2 Powders. J. Phys. Chem. B 1999, 103, 8236–8244. [Google Scholar] [CrossRef]
  31. Wong, K.C.; Lu, X.; Cotter, J.; Eadie, D.T.; Wong, P.C.; Mitchell, K.A.R. Surface and friction characterization of MoS2 and WS2 third body thin films under simulated wheel/rail rolling-sliding contact. Wear 2008, 264, 526–534. [Google Scholar] [CrossRef]
  32. Li, H.; Huang, M.; Cao, G. Markedly different adsorption behaviors of gas molecules on defective monolayer MoS2: A first-principles study. Phys. Chem. Chem. Phys. 2016, 18, 15110–15117. [Google Scholar] [CrossRef] [PubMed]
  33. Ma, D.; Wang, Q.; Li, T.; He, C.; Ma, B.; Tang, Y.; Lu, Z.; Yang, Z. Repairing sulfur vacancies in the MoS2 monolayer by using CO, NO and NO2 molecules. J. Mater. Chem. C 2016, 4, 7093–7101. [Google Scholar] [CrossRef]
  34. Zhou, C.; Yang, W.; Zhu, H. Mechanism of charge transfer and its impacts on Fermi-level pinning for gas molecules adsorbed on monolayer WS2. J. Chem. Phys. 2015, 142, 1–8. [Google Scholar] [CrossRef] [PubMed]
  35. Bui, V.Q.; Pham, T.T.; Le, D.A.; Thi, C.M.; Le, H.M. A first-principles investigation of various gas (CO, H2O, NO, and O2) absorptions on a WS2monolayer: Stability and electronic properties. J. Phys. Condens. Matter 2015, 27, 305005. [Google Scholar] [CrossRef] [PubMed]
  36. Bagsican, F.R.; Winchester, A.; Ghosh, S.; Zhang, X.; Ma, L.; Wang, M.; Murakami, H.; Talapatra, S.; Vajtai, R.; Ajayan, P.M.; et al. Adsorption energy of oxygen molecules on graphene and two-dimensional tungsten disulfide. Sci. Rep. 2017, 7, 1774. [Google Scholar] [CrossRef] [PubMed]
  37. Guo, L.; Jiang, H.; Shao, R.; Zhang, Y.; Xie, S. Two-beam-laser interference mediated reduction, patterning and nanostructuring of graphene oxide for the production of a flexible humidity sensing device. Carbon N. Y. 2011, 50, 1667–1673. [Google Scholar] [CrossRef]
Figure 1. (a) Low-resolution TEM image of WS2-decorated GO deposited on a lacey grid. WS2 flakes (darker regions) distributed over interconnected rGO flakes (light-grey background). The occurrence of grey lines (highlighted by yellow arrows) attest the formation of rGO folded edges; (b) Lateral size distribution of WS2 flakes and corresponding Log Normal fit.
Sensors 19 02617 g001
Figure 2. High-resolution TEM of WS2-decorated rGO showing: (a) light-grey background of interconnected GO flakes. Darker grey lines (yellow arrow) corresponding to folded GO edges and some WS2 flakes vertically placed on GO flakes (needless inside the red circle); (b) a big hexagonal WS2 flake. The inset shows a magnification of the flake’s edges with related SAED analysis pattern.
Sensors 19 02617 g002
Figure 3. STEM elemental mapping of the flake shown in Figure 2b showing the atomic distribution of: (a) sulfur, (b) tungsten, (c) carbon and (d) oxygen.
Sensors 19 02617 g003
Figure 4. XPS spectra of the WS2-decorated rGO showing (a) C1s core level spectrum of rGO flakes and (b) W 4f core level spectrum of WS2.
Sensors 19 02617 g004
Figure 5. Electrical responses of single rGO (red line) and WS2-decorated rGO films (blue line) in dry air and NO2 concentrations in the range 2–10 ppm at 25 °C and 50 °C operating temperature.
Sensors 19 02617 g005
Figure 6. Response to 1 ppm NO2 in dry air of WS2-decorated rGO and bare rGO film (red curve) irradiated by Purple–Blue (λ = 430 nm) light at different power densities (270 μW/cm2, 468 μW/cm2, 668 μW/cm2).
Sensors 19 02617 g006
Figure 7. The 1 ppm NO2 gas responses of the WS2-decorated rGO under “dark” and “light” conditions (dotted lines) at 25 °C operating temperatures compared to the “dark” and light” conditions (solid lines) at 50 °C operating temperature.
Sensors 19 02617 g007
Figure 8. Comparison of WS2-decorated rGO’s electrical responses to increasing NO2 concentrations at 50 °C operating temperature under dark and light conditions respectively. The inset shows the sensitivity plot corresponding to light conditions. The bars in the inset represent the standard deviation calculated over a set of five measurements performed for each gas concentration. Dotted lines indicate the baseline resistance in dry air.
Sensors 19 02617 g008
Figure 9. The influence of 40% Relative Humidity (40% RH) on the NO2 response of WS2-decorated rGO under dark and light illumination at 50 °C operating temperature.
Sensors 19 02617 g009
Figure 10. Schematic illustration of the proposed sensing mechanism of WS2-decorated rGO hybrid during NO2 exposure.
Sensors 19 02617 g010
Table 1. Comparison of RR, RP, τads and τdes to to 1 ppm NO2 in dark conditions and PB light illumination (λ = 430 nm at 668 µW/cm2) at different OT (25–50 °C). Notably (-) means that no equilibrium conditions have been reached within the time scale of the experiment.
Response TO 1 ppm NO2
Operating ConditionsRR
Ra/Rg
RP
ΔDA
τ adsτ des
(–)(%)(min)(min)
25 °C DARK1.18 ± 0.0223--
25 °C LIGHT1.21 ± 0.0265--
50 °C DARK1.20 ± 0.02602226
50 °C LIGHT1.27 ± 0.02701618
Table 2. Adsorption energy on rGO and WS2 of O2, NO2 and H2O molecules. Note that negative adsorption energy means that the adsorption process is exothermic and energetically favorable.
Physisorbed MoleculesAdsorption Energy on rGO (eV)ReferenceAdsorption Energy on WS2 (eV)Reference
O2−0.16[36]−0.24[36]
NO2−0.80[32,34,35]−0.41[34,35]
H2O−0.04[37]−0.23[34]

