Sugar Concentration Measurement System Using Radiofrequency Sensor

 , , ,
, , ,  ,
,  , and
, and 
Abstract
1. Introduction
2. Materials and Methods
2.1. Sample Preparation
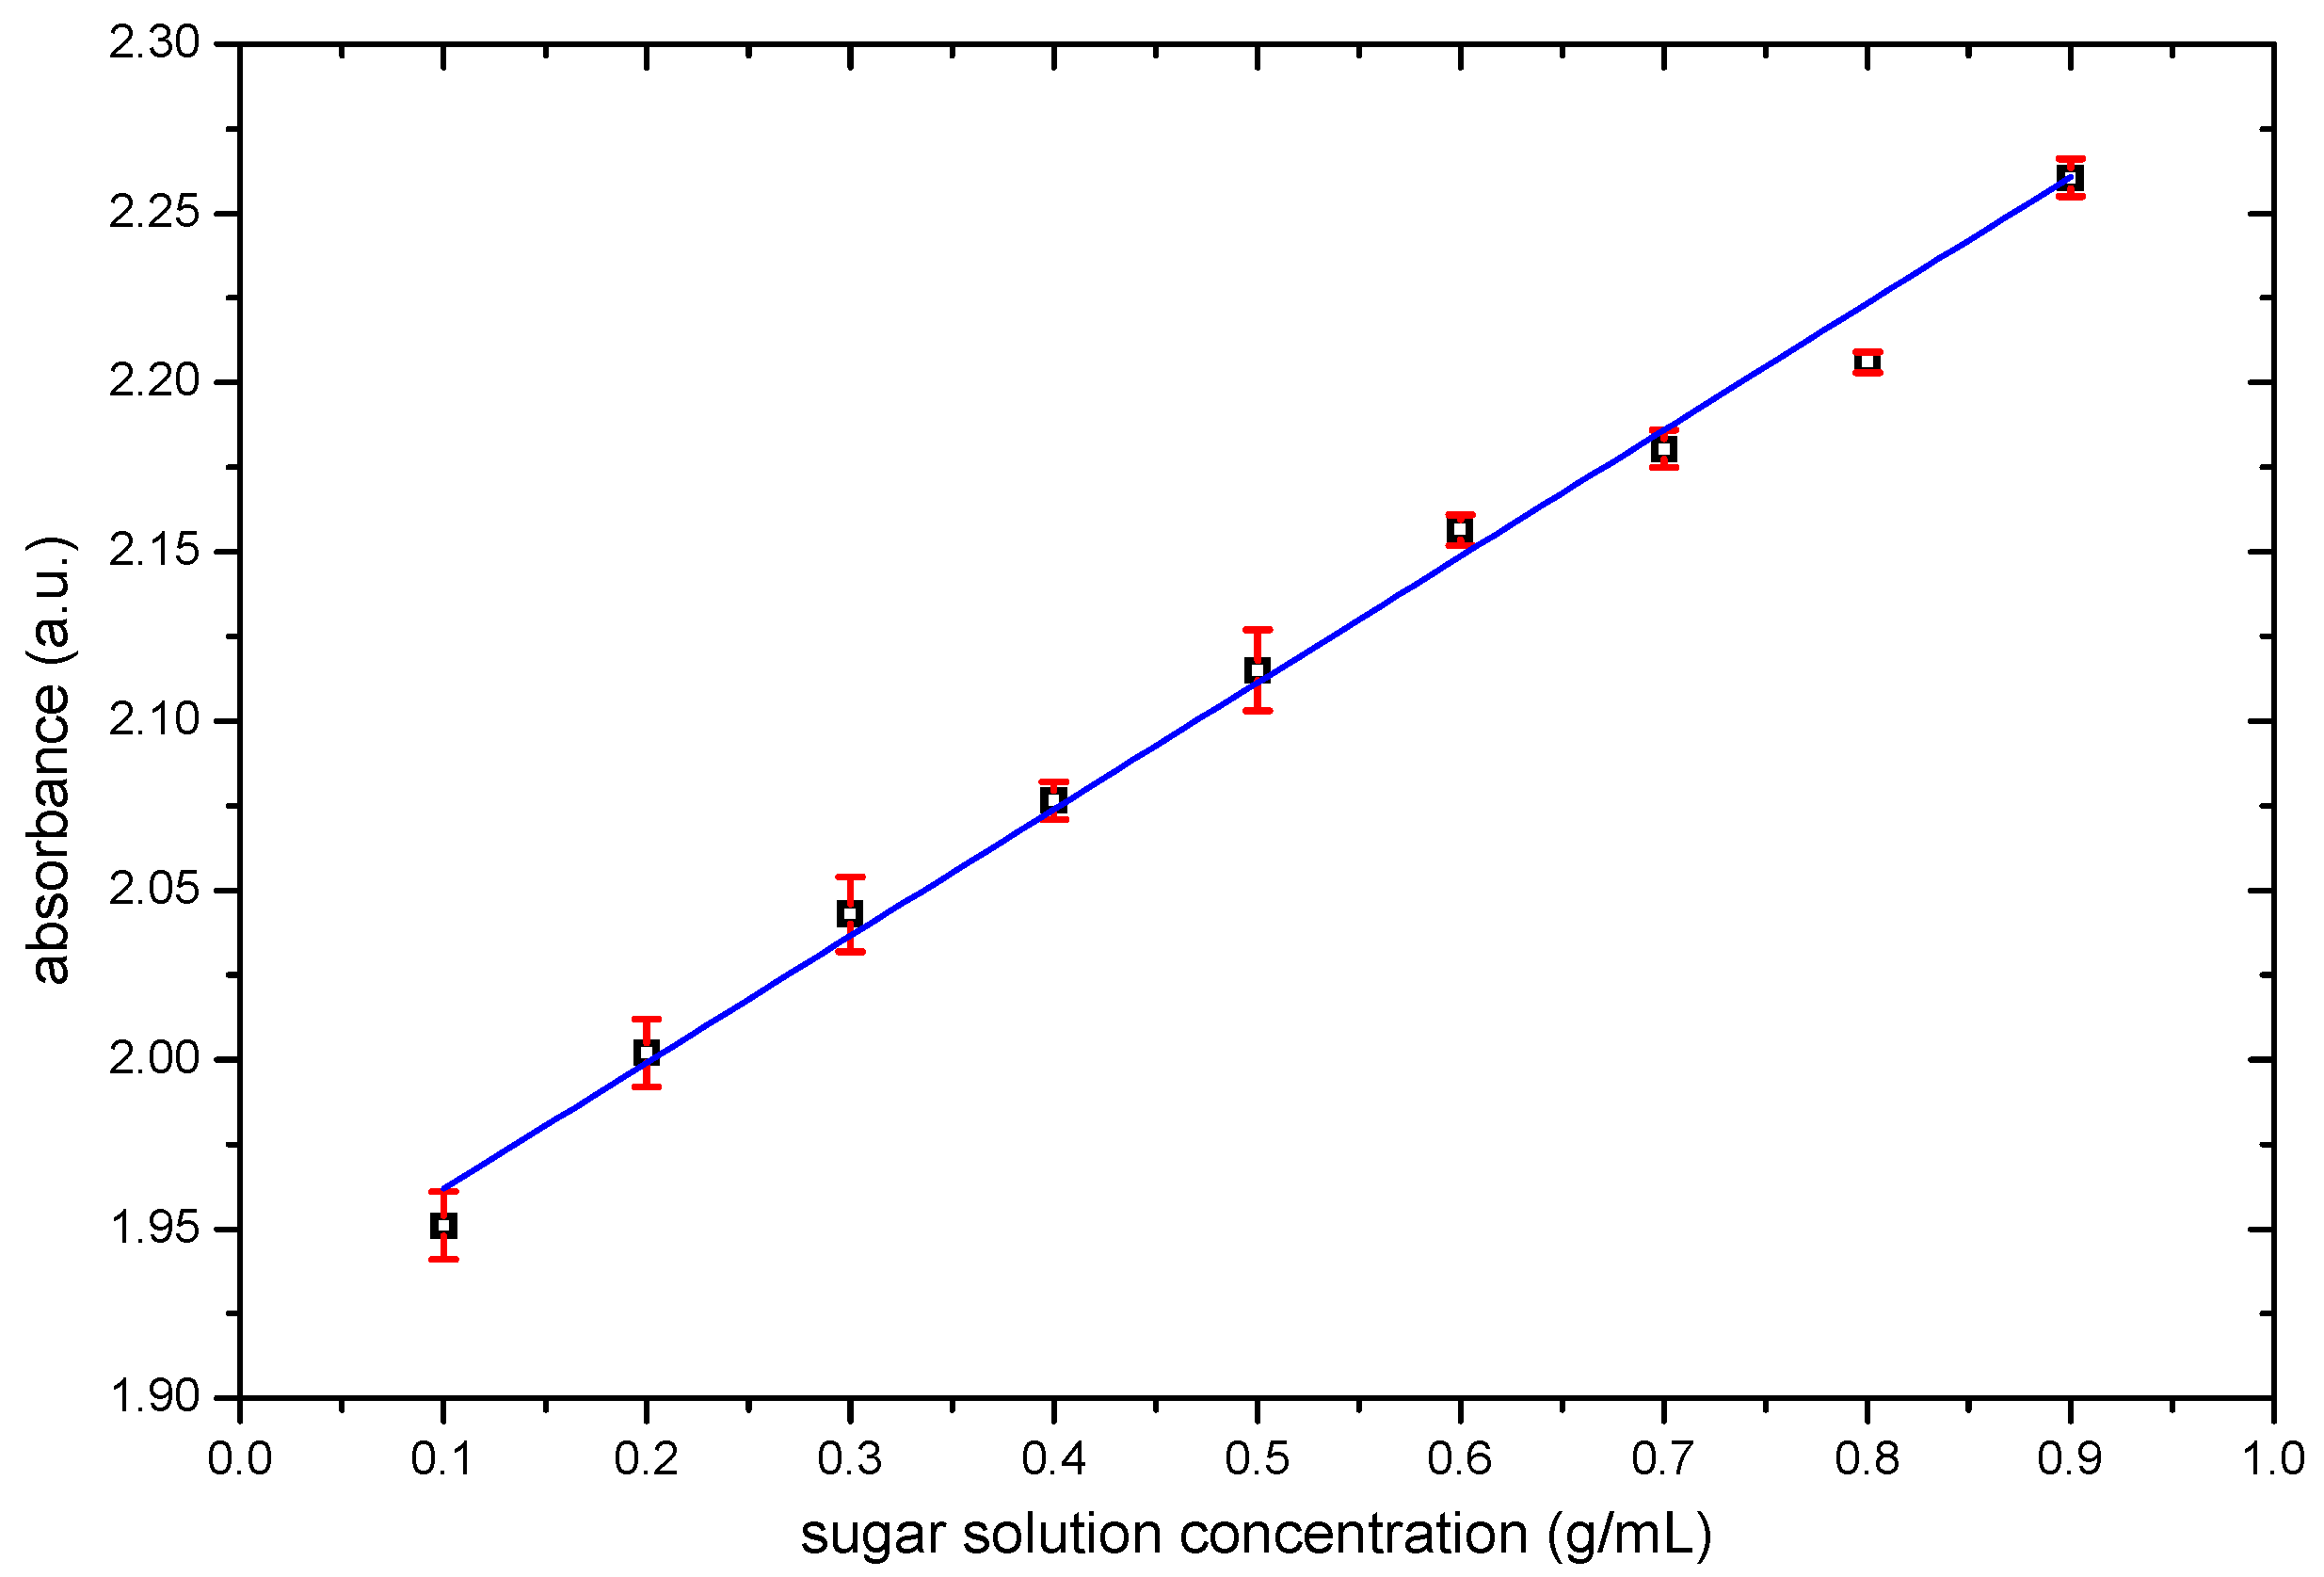
2.2. Sample Concentration Cross-Validation
2.3. Alternating Current (ac) Conductivity and Loss Tangent (Tand δ) Measurements.
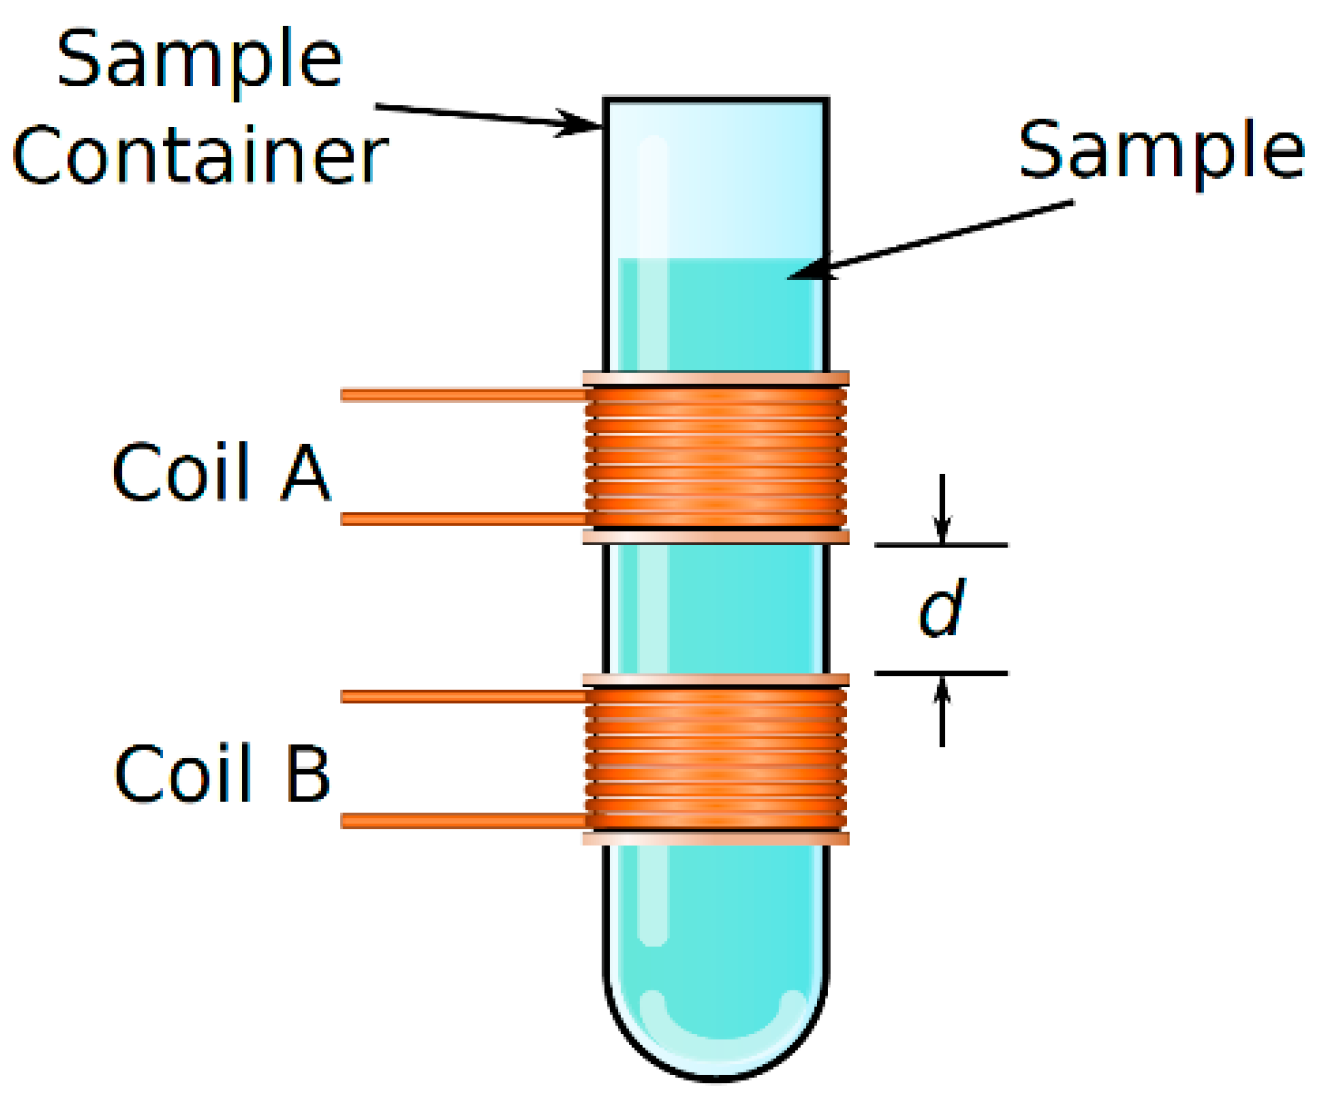
2.4. Sensor
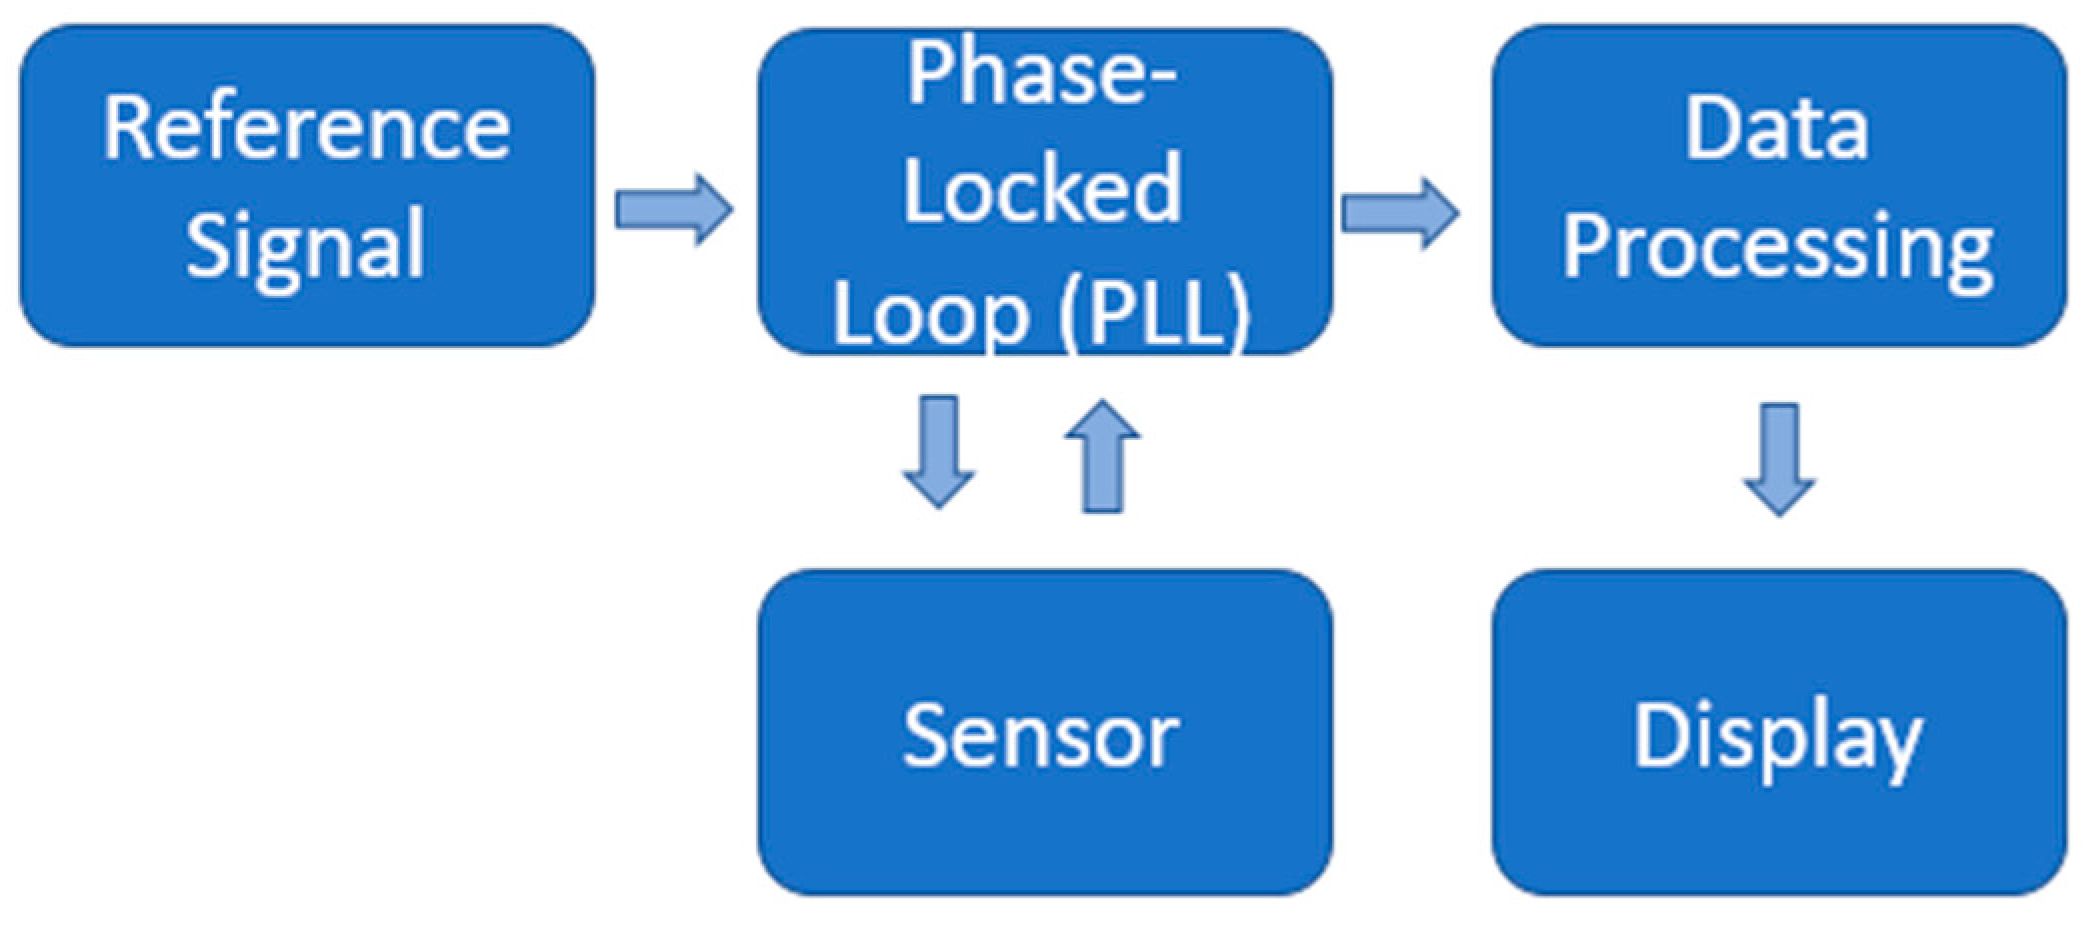
2.5. Sensing System
2.6. Statistical Data Processing
3. Results
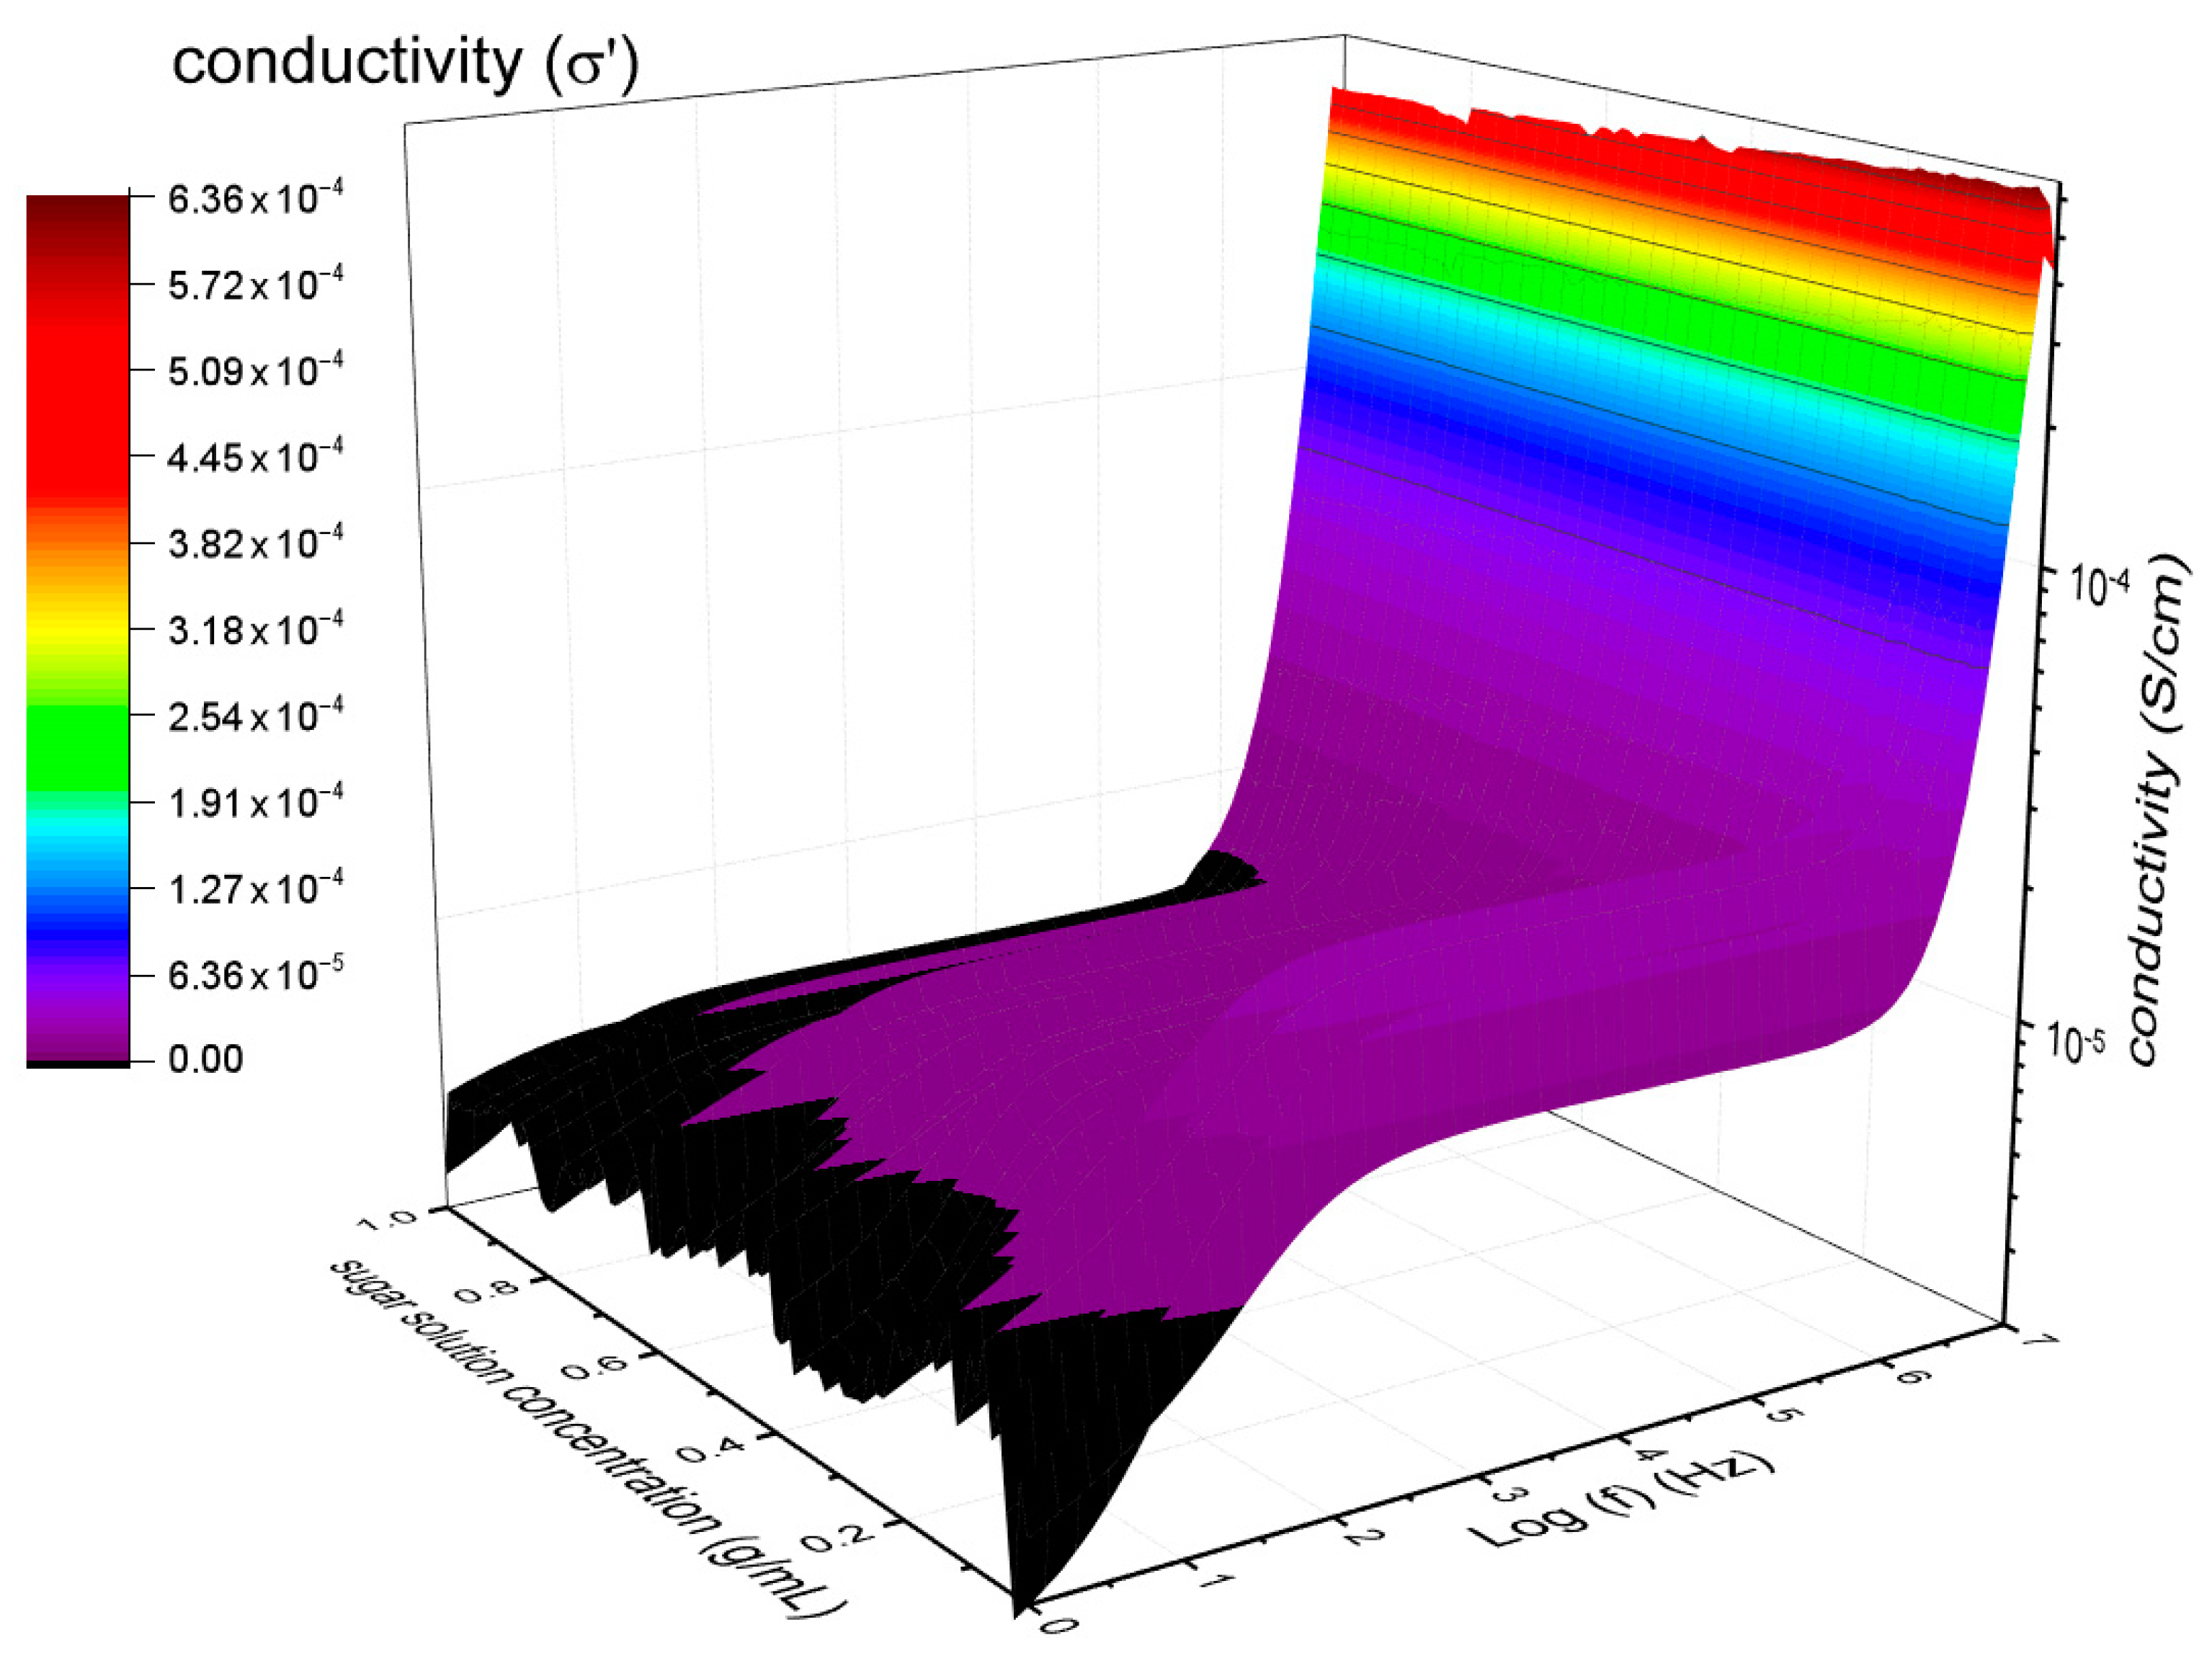
3.1. Alternating Current (AC) Conductivity
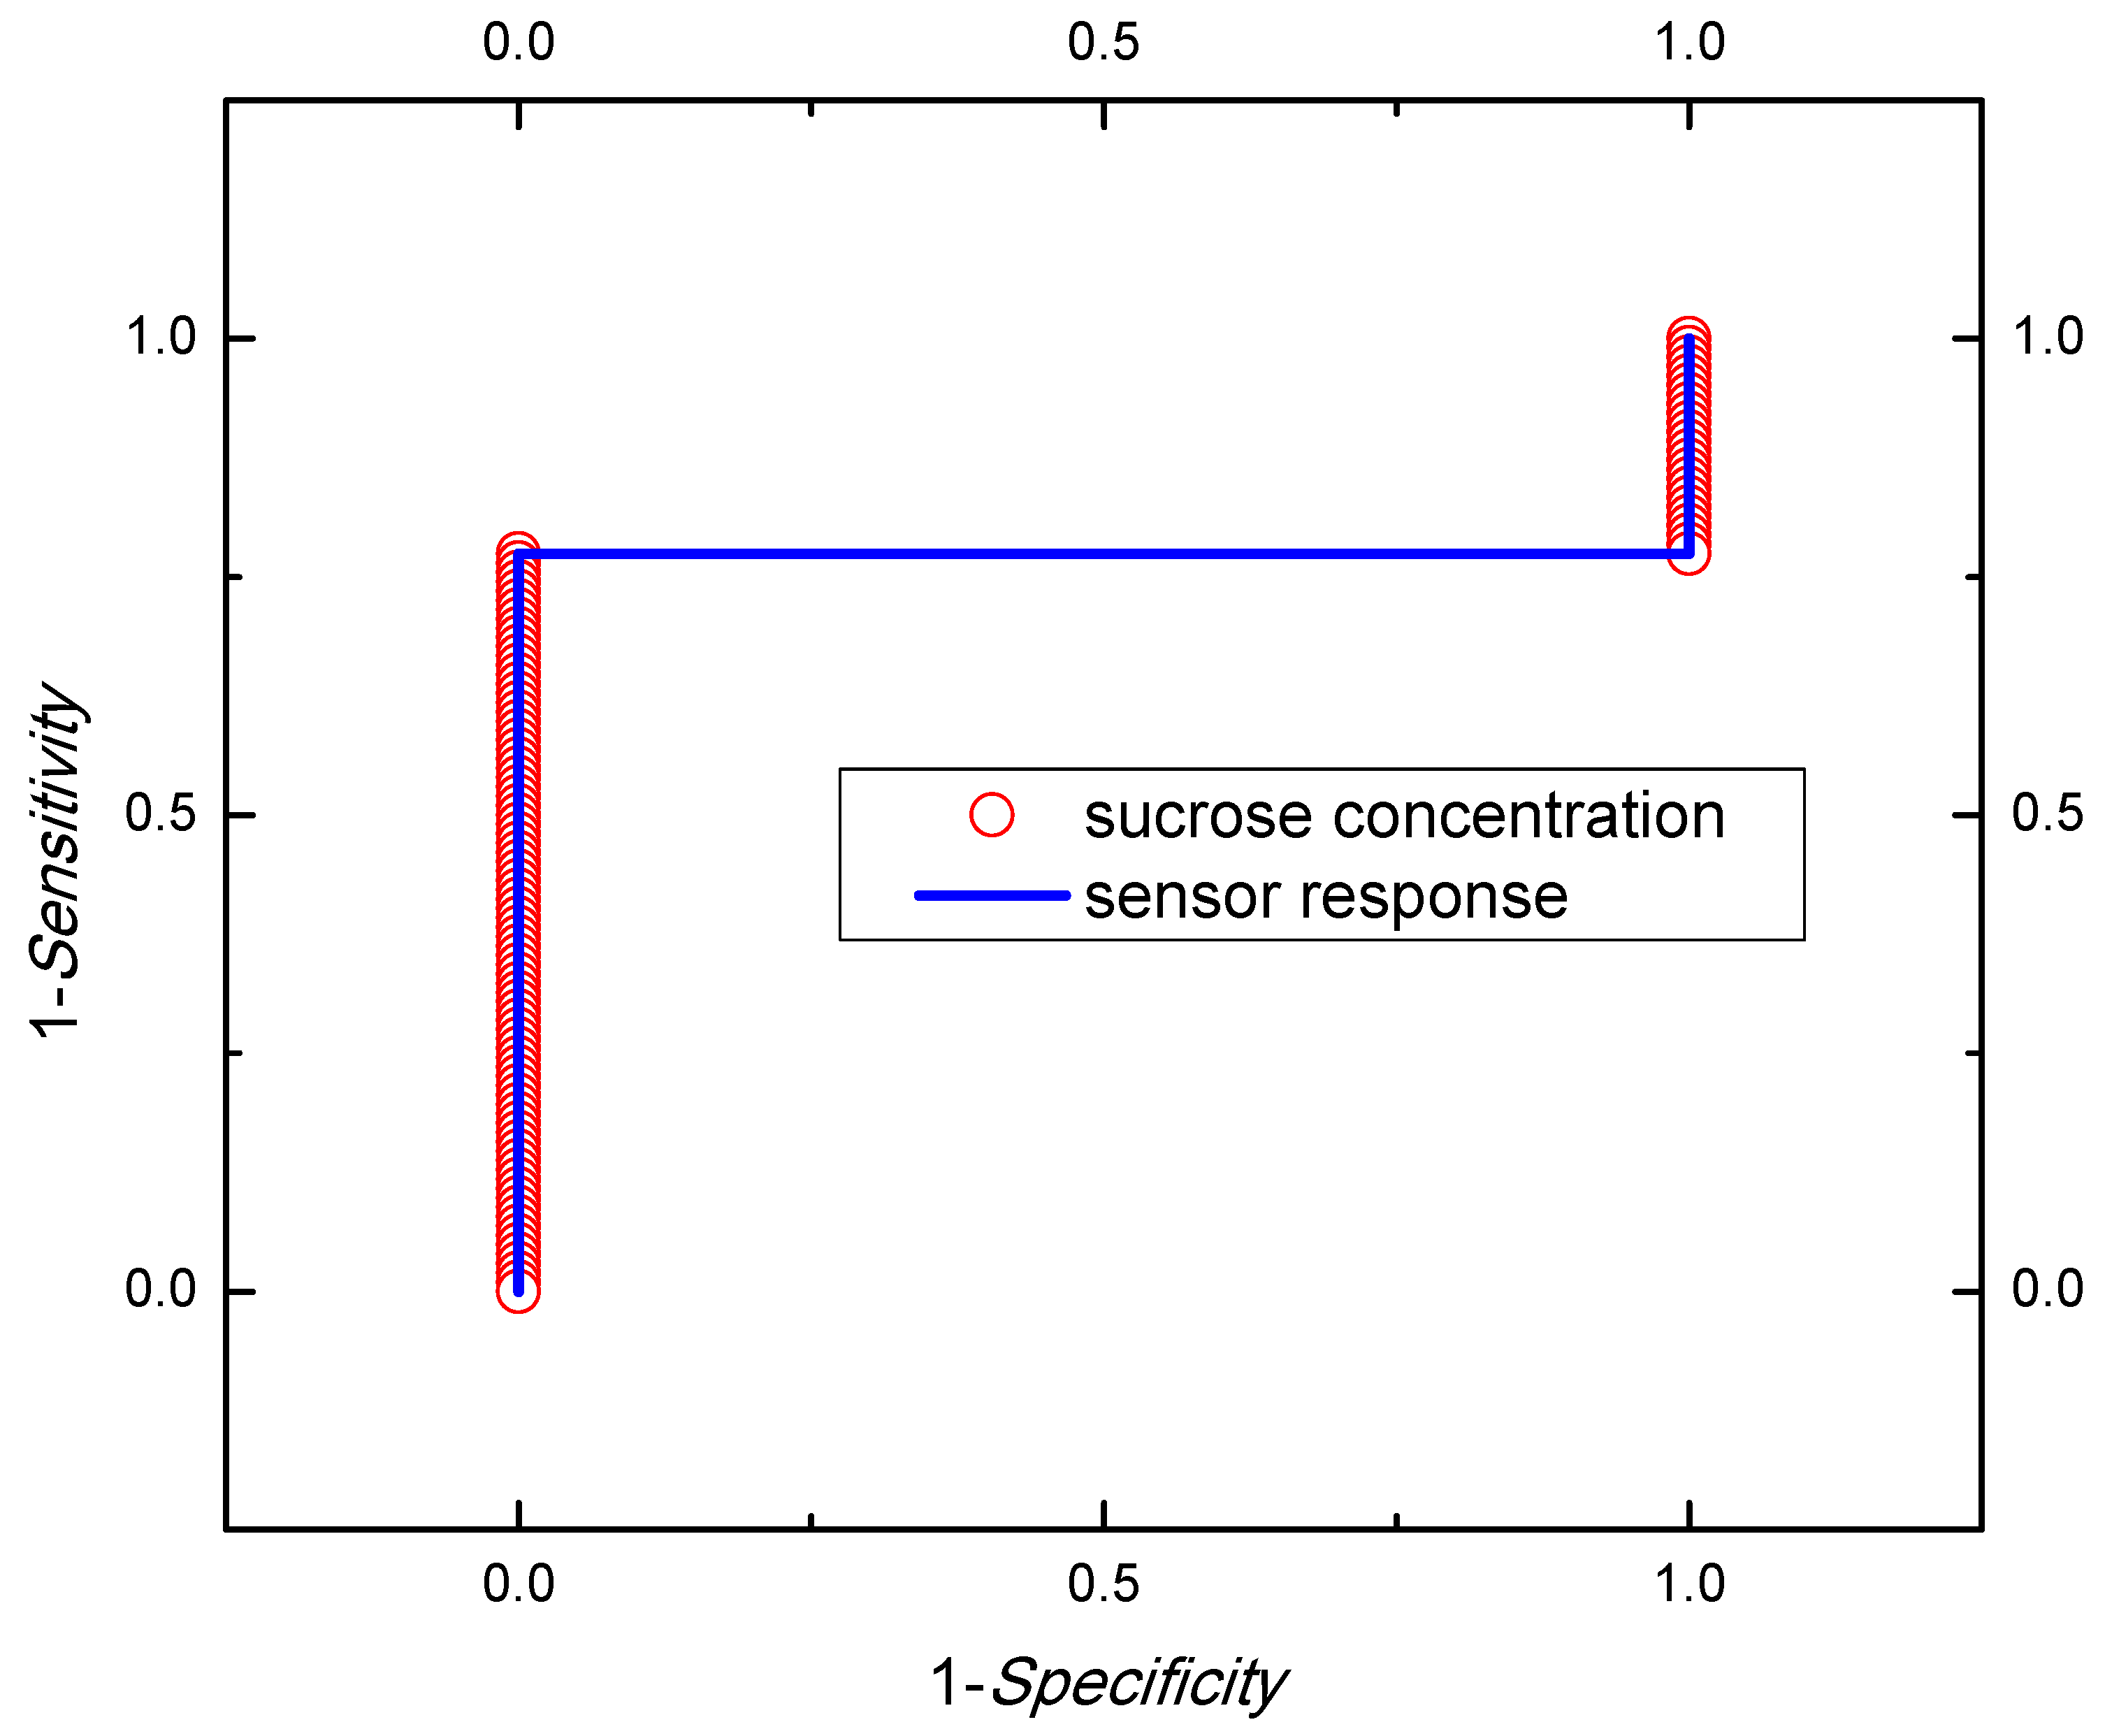
3.2. Sensor Response
4. Conclusions
Author Contributions
Funding
Acknowledgments
Conflicts of Interest
References
- Brown, G.M.; Levy, H.A. Sucrose: Precise Determination of Crystal and Molecular Structure by Neutron Diffraction. Science 1963, 141, 921–923. [Google Scholar] [CrossRef] [PubMed]
- Ruan, Y.-L. Sucrose Metabolism: Gateway to Diverse Carbon Use and Sugar Signaling. Annu. Rev. Plant Biol. 2014, 65, 33–67. [Google Scholar] [CrossRef] [PubMed]
- Michael, L.S.; Kargi, F. Major Methabolics Pathways. In Bioprocess Engineering: Basic Concepts; Prentice Hall: Upper Saddle Rive, NY, USA, 2002; p. 137. [Google Scholar]
- Rippe, J.M.; Angelopoulos, T.J. Sucrose, High-Fructose Corn Syrup, and Fructose, Their Metabolism and Potential Health Effects: What Do We Really Know? Adv. Nutr. 2013, 4, 236–245. [Google Scholar] [CrossRef]
- Schulze, M.B.; Manson, J.E.; Ludwig, D.S.; Colditz, G.A.; Stampfer, M.J.; Willett, W.C.; Hu, F.B. Sugar-sweetened beverages, weight gain, and incidence of type 2 diabetes in young and middle-aged women. JAMA 2004, 292, 927–934. [Google Scholar] [CrossRef]
- Nöthlings, U.; Murphy, S.P.; Wilkens, L.R.; Henderson, B.E.; Kolonel, L.N. Dietary glycemic load, added sugars, and carbohydrates as risk factors for pancreatic cancer: The Multiethnic Cohort Study. Am. J. Clin. Nutr. 2007, 86, 1495–1501. [Google Scholar] [CrossRef]
- Malik, V.S.; Schulze, M.B.; Hu, F.B. Intake of sugar-sweetened beverages and weight gain: A systematic review. Am. J. Clin. Nutr. 2006, 84, 274–288. [Google Scholar] [CrossRef]
- Welsh, J.; Dietz, W. Sugar-Sweetened Beverage Consumption Is Associated with Weight Gain and Incidence of Type 2 Diabetes. Clinical Diabetes 2005, 23, 150–152. [Google Scholar] [CrossRef]
- Keener, D.; Goodman, K.; Lowry, A.; Zaro, S.; Kettel Khan, L. Recommended Community Strategies and Measurements to Prevent Obesity in the United States: Implementation and Measurement Guide; U.S. Department of Health and HumanServices, Centers for Disease Control and Prevention: Atlanta, GA, USA, 2009.
- Institute of Medicine of the National Academies; National Research Council of the National Academies. Local Government Actions to Prevent Childhood Obesity; The National Academies Press: Washington, DC, USA, 2009; p. 138. [Google Scholar]
- Ley del Impuesto Especial Sobre Producción y Servicios; Congreso de los Estados Unidos Mexicanos: Ciudad de México, Mexico, 2018.
- Wang, Y.C.; Coxson, P.; Shen, Y.-M.; Goldman, L.; Bibbins-Domingo, K. A Penny-Per-Ounce Tax On Sugar-Sweetened Beverages Would Cut Health And Cost Burdens Of Diabetes. Health Affairs 2012, 31, 199–207. [Google Scholar] [CrossRef]
- Scott, F.W.; Trick, K.D. Carbohydrate content and caloric values of carbonated soft drinks. Food Chem. 1980, 5, 237–242. [Google Scholar] [CrossRef]
- Ventura, E.E.; Davis, J.N.; Goran, M.I. Sugar Content of Popular Sweetened Beverages Based on Objective Laboratory Analysis: Focus on Fructose Content. Obesity 2011, 19, 868–874. [Google Scholar] [CrossRef]
- Tura, A.; Sbrignadello, S.; Cianciavicchia, D.; Pacini, G.; Ravazzani, P. A Low Frequency Electromagnetic Sensor for Indirect Measurement of Glucose Concentration: In Vitro Experiments in Different Conductive Solutions. Sensors 2010, 10, 5346–5358. [Google Scholar] [CrossRef]
- Bruulsema, J.T.; Hayward, J.E.; Farrell, T.J.; Patterson, M.S.; Heinemann, L.; Berger, M.; Koschinsky, T.; Sandahl-Christiansen, J.; Orskov, H.; Essenpreis, M.; et al. Correlation between blood glucose concentration in diabetics and noninvasively measured tissue optical scattering coefficient. Opt. Lett. 1997, 22, 190–192. [Google Scholar] [CrossRef] [PubMed]
- Berger, A.J.; Itzkan, I.; Feld, M.S. Feasibility of measuring blood glucose concentration by near-infrared Raman spectroscopy. Spectrochim. Acta Part A 1997, 53, 287–292. [Google Scholar]
- Lara Hernandez, G.; Cruz Orea, A.; Suaste Gomez, E.; Flores Cuautle, J.J.A. Glucose in aqueous solution thermal characterization by photopyroelectric techniques. Rev. Mex. Fis. 2017, 63, 4. [Google Scholar]
- Guo, X.; Mandelis, A.; Zinman, B. Noninvasive glucose detection in human skin using wavelength modulated differential laser photothermal radiometry. Biomed. Opt. Express 2012, 3, 3012–3021. [Google Scholar] [CrossRef]
- Pleitez, M.A.; Hertzberg, O.; Bauer, A.; Seeger, M.; Lieblein, T.; Lilienfeld-Toal, H.V.; Mäntele, W. Photothermal deflectometry enhanced by total internal reflection enables non-invasive glucose monitoring in human epidermis. Analyst 2015, 140, 483–488. [Google Scholar] [CrossRef]
- Torii, T.; Chiba, H.; Tanabe, T.; Oyama, Y. Measurements of glucose concentration in aqueous solutions using reflected THz radiation for applications to a novel sub-THz radiation non-invasive blood sugar measurement method. Digit. Health 2017, 3. [Google Scholar] [CrossRef] [PubMed]
- Suhandy, D.; Suzuki, T.; Ogawa, Y.; Kondo, N.; Naito, H.; Ishihara, T.; Takemoto, Y.; Liu, W. A Quantitative Study for Determination of Glucose Concentration Using Attenuated Total Reflectance Terahertz (ATR-THz) Spectroscopy. Eng. Agric. Environ. Food 2012, 5, 90–95. [Google Scholar] [CrossRef]
- Cherkasova, O.; Nazarov, M.; Shkurinov, A. Noninvasive blood glucose monitoring in the terahertz frequency range. Opt. Quantum Electron. 2016, 48, 217. [Google Scholar] [CrossRef]
- Robaina, R.R.; Trujillo, H.; Plaza, J. Design and characterization of a versatile and high sensitive differential electromagnetic sensor. Procedia Chem. 2009, 1, 919–922. [Google Scholar] [CrossRef]
- Jonscher, A.K. Dielectric relaxation in solids. J. Phys. D Appl. Phys. 1999, 32, R57–R70. [Google Scholar] [CrossRef]
- Arias, N.P.; Dávila, M.T.; Giraldo, O. Electrical behavior of an octahedral layered OL-1-type manganese oxide material. Ionics 2013, 19, 201–214. [Google Scholar] [CrossRef]
- Alatorre, L.C.; Sánchez-Andres, R.; Cirujano, S.; Beguería, S.; Sánchez-Carrillo, S. Identification of Mangrove Areas by Remote Sensing: The ROC Curve Technique Applied to the Northwestern Mexico Coastal Zone Using Landsat Imagery. Remote Sens. 2011, 3, 1568–1583. [Google Scholar] [CrossRef]
- Leroy, P.; Revil, A.; Kemna, A.; Cosenza, P.; Ghorbani, A. Complex conductivity of water-saturated packs of glass beads. J. Colloid Interface Sci. 2008, 321, 103–117. [Google Scholar] [CrossRef]
- Jonscher, A.K. Analysis of the alternating current properties of ionic conductors. J. Mater. Sci. 1978, 132, 553–562. [Google Scholar] [CrossRef]
- Ludueña, G.A.; Kühne, T.D.; Sebastiani, D. Mixed Grotthuss and Vehicle Transport Mechanism in Proton Conducting Polymers from Ab initio Molecular Dynamics Simulations. Chem. Mater. 2011, 23, 1424–1429. [Google Scholar] [CrossRef]
- Takeo, M.; Marco, R. Grotthuss mechanisms: from proton transport in proton wires to bioprotonic devices. J. Phys. Condens. Matter 2016, 28, 023001. [Google Scholar]
- Gharsallaoui, A.; Rogé, B.; Génotelle, J.; Mathlouthi, M. Relationships between hydration number, water activity and density of aqueous sugar solutions. Food Chem. 2008, 106, 1443–1453. [Google Scholar] [CrossRef]
- Stewart, J.J.P. Optimization of parameters for semiempirical methods VI: More modifications to the NDDO approximations and re-optimization of parameters. J. Mol. Model. 2013, 19, 1–32. [Google Scholar] [CrossRef]
- Ekdawi-Sever, N.C.; Conrad, P.B.; de Pablo, J.J. Molecular Simulation of Sucrose Solutions near the Glass Transition Temperature. J. Phys. Chem. A 2001, 105, 734–742. [Google Scholar] [CrossRef]
- Lupi, L.; Comez, L.; Paolantoni, M.; Perticaroli, S.; Sassi, P.; Morresi, A.; Ladanyi, B.M.; Fioretto, D. Hydration and Aggregation in Mono- and Disaccharide Aqueous Solutions by Gigahertz-to-Terahertz Light Scattering and Molecular Dynamics Simulations. J. Phys. Chem. A 2012, 116, 14760–14767. [Google Scholar] [CrossRef] [PubMed]


| Method | Range (g/mL) | Sensitivity (g/mL) | Working Frequency | Ref. |
|---|---|---|---|---|
| Electromagnetic | 0.78–6.25 | 0.3 | 40 kHz | [15] |
| Near-infrared Raman spectroscopy | 1.8–21.62 | 0.65 | - | [17] |
| Photopyroelectric | 1.3–3.1 | 0.3 | 1–100 Hz | [18] |
| Photothermal radiometry | 0.21–4.0 | 0.37 | - | [19] |
| Reflected terahertz radiation | 5 × 10⁻⁴–2 × 10⁻³ | - | THz | [20] |
| Terahertz time-domain spectroscopy | 7.5 × 10²–1.1 × 10³ | - | THz | [21] |
| Attenuated total reflectance terahertz | 5 × 10⁻³–4.3 × 10⁻¹ | - | THz | [22] |
| This work | 0.15–1 | 0.05 | 10 kHz |
| Observed | |||
|---|---|---|---|
| Predicted | Y1 | Y0 | |
| Y′1 | a | b | |
| Y′0 | c | d | |
© 2019 by the authors. Licensee MDPI, Basel, Switzerland. This article is an open access article distributed under the terms and conditions of the Creative Commons Attribution (CC BY) license (http://creativecommons.org/licenses/by/4.0/).
Share and Cite
Aguila Rodriguez, G.; Arias Duque, N.P.; Gonzalez Sanchez, B.E.; Sandoval Gonzalez, O.O.; Giraldo Osorio, O.H.; Trujillo Romero, C.J.; Wilches Torres, M.A.; Flores Cuautle, J.d.J.A. Sugar Concentration Measurement System Using Radiofrequency Sensor. Sensors 2019, 19, 2354. https://doi.org/10.3390/s19102354
Aguila Rodriguez G, Arias Duque NP, Gonzalez Sanchez BE, Sandoval Gonzalez OO, Giraldo Osorio OH, Trujillo Romero CJ, Wilches Torres MA, Flores Cuautle JdJA. Sugar Concentration Measurement System Using Radiofrequency Sensor. Sensors. 2019; 19(10):2354. https://doi.org/10.3390/s19102354
Chicago/Turabian StyleAguila Rodriguez, Gerardo, Nayda Patricia Arias Duque, Blanca Estela Gonzalez Sanchez, Oscar Osvaldo Sandoval Gonzalez, Oscar Hernan Giraldo Osorio, Citlalli Jessica Trujillo Romero, Miriam Andrea Wilches Torres, and Jose de Jesus Agustin Flores Cuautle. 2019. "Sugar Concentration Measurement System Using Radiofrequency Sensor" Sensors 19, no. 10: 2354. https://doi.org/10.3390/s19102354
APA StyleAguila Rodriguez, G., Arias Duque, N. P., Gonzalez Sanchez, B. E., Sandoval Gonzalez, O. O., Giraldo Osorio, O. H., Trujillo Romero, C. J., Wilches Torres, M. A., & Flores Cuautle, J. d. J. A. (2019). Sugar Concentration Measurement System Using Radiofrequency Sensor. Sensors, 19(10), 2354. https://doi.org/10.3390/s19102354