Design and Evaluation of an Aerosol Electrometer with Low Noise and a Wide Dynamic Range


Abstract
1. Introduction
2. Materials and Methods
2.1. Description of Aerosol Electrometer
2.2. Calibration of the Aerosol Electrometer
2.3. Experimental Setup for the Evaluation of the Aerosol Electrometer
3. Results
3.1. Calibration Results
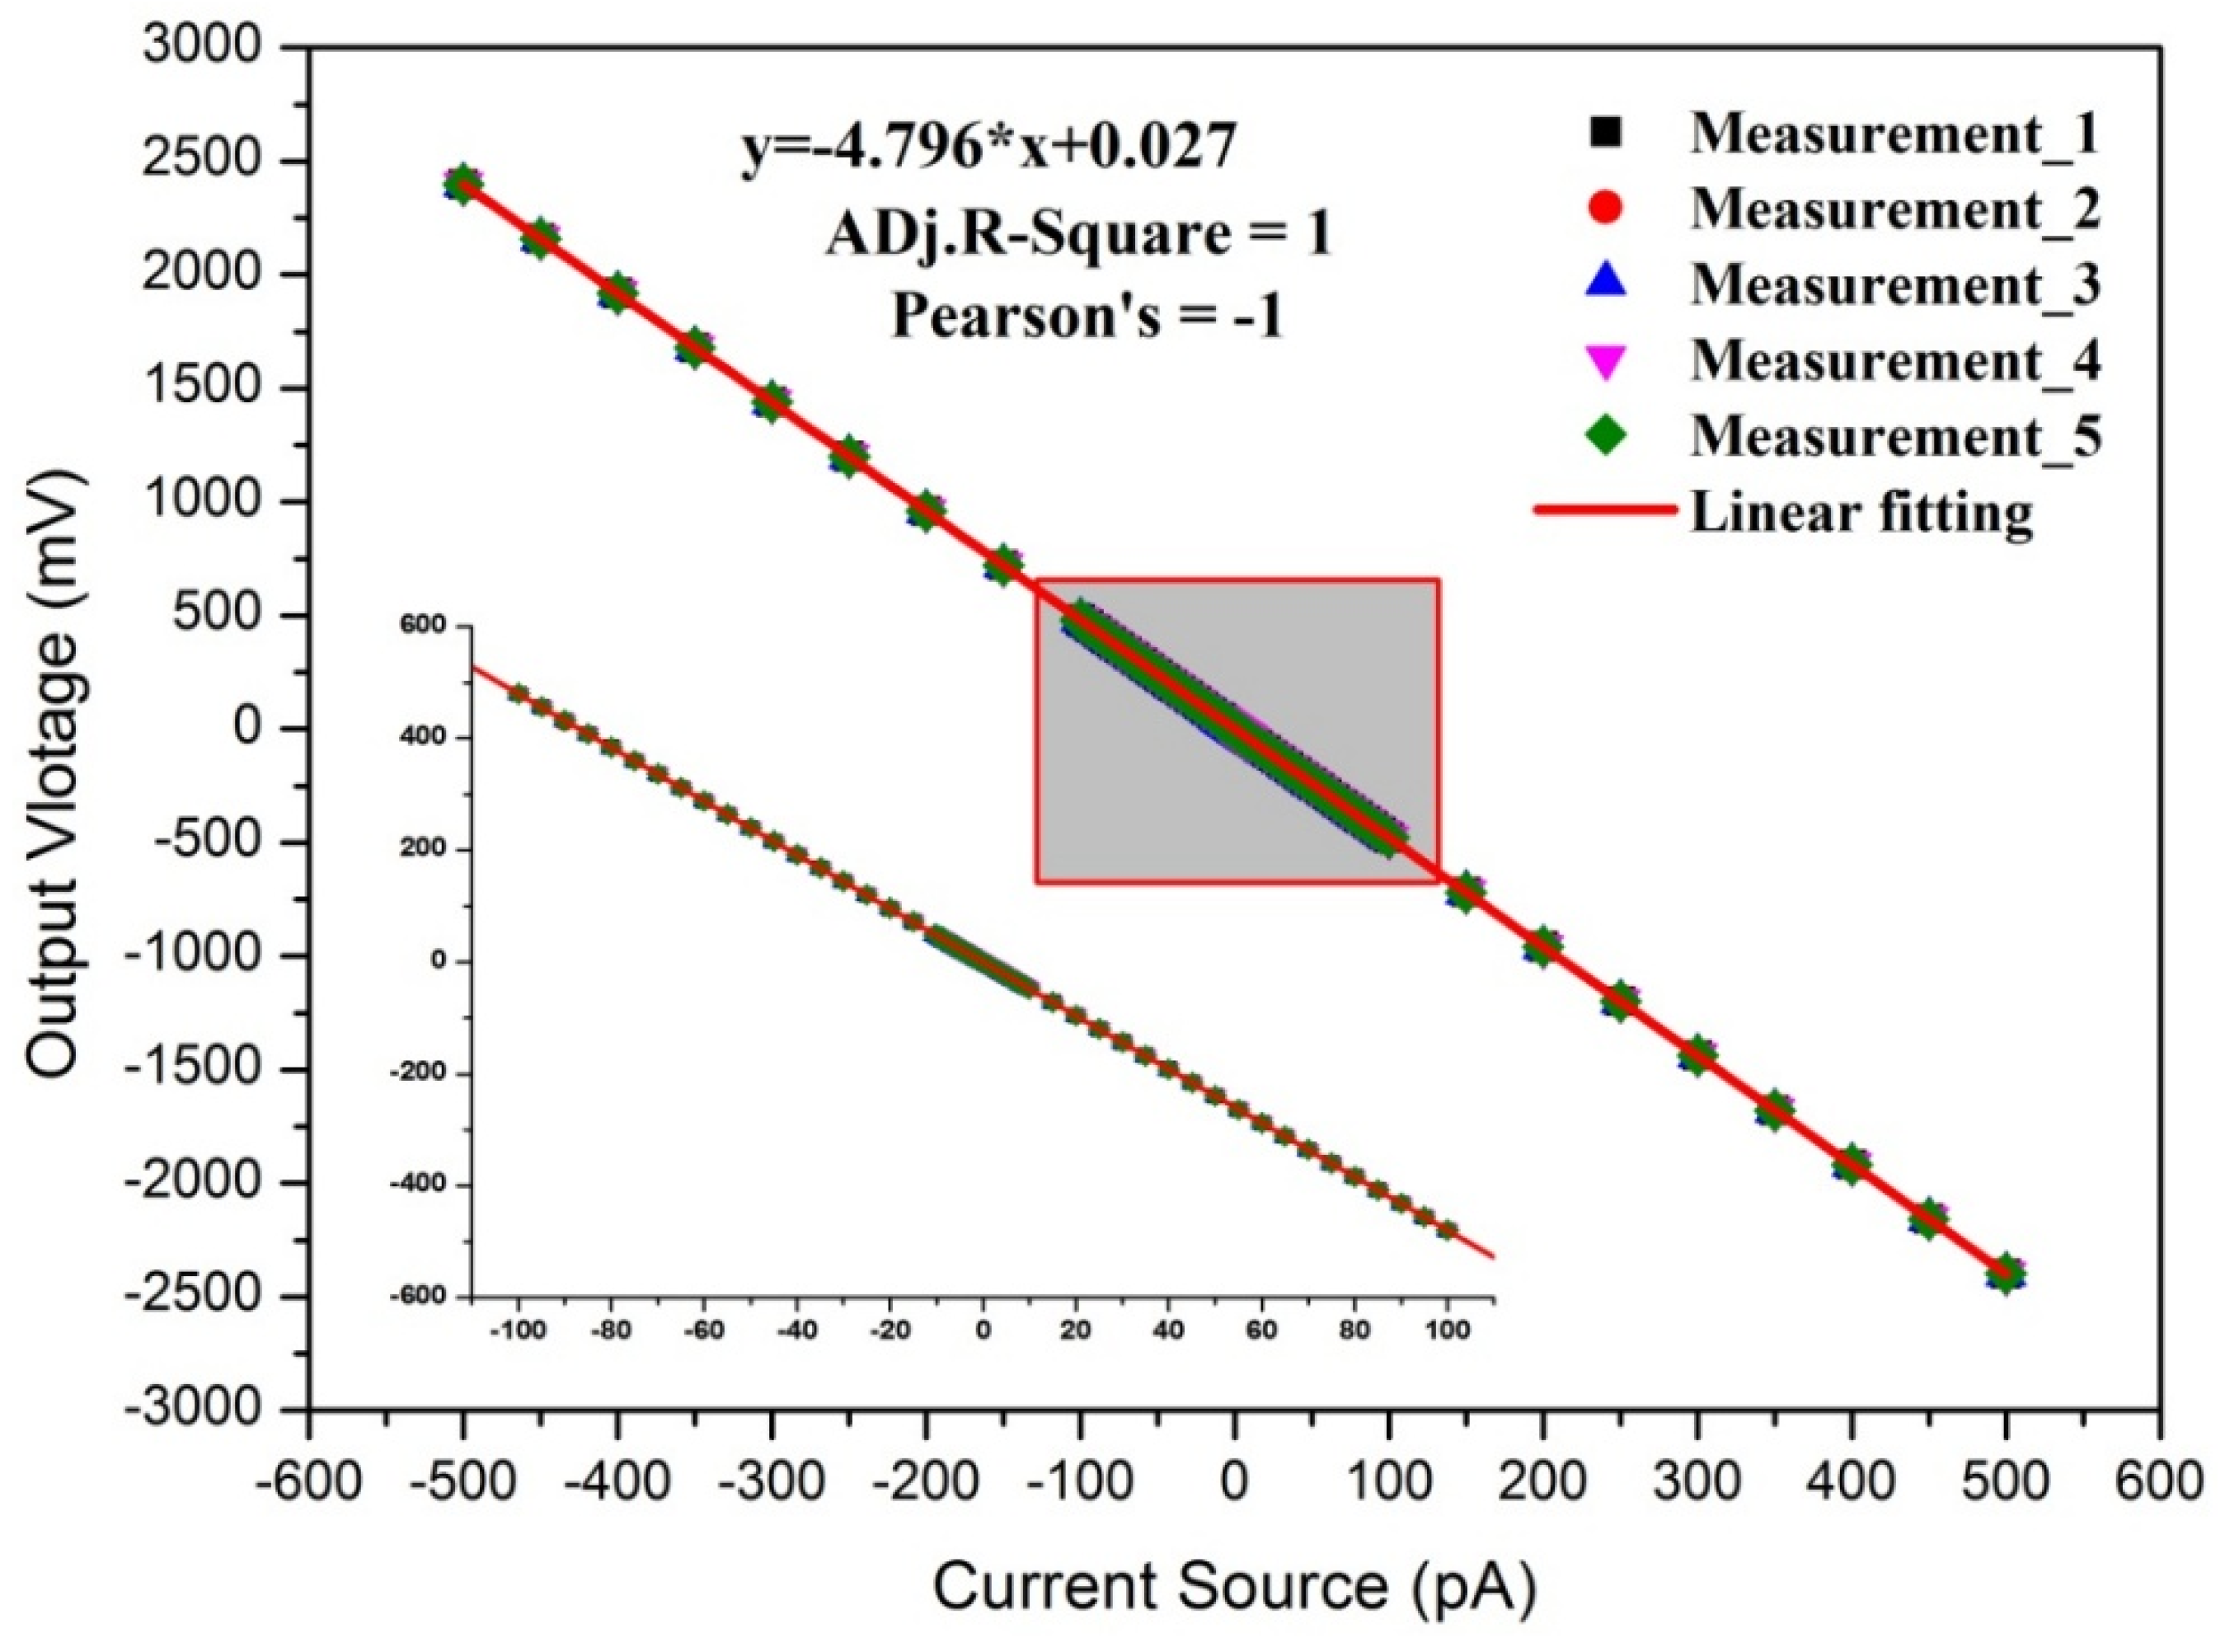
3.1.1. Linearity
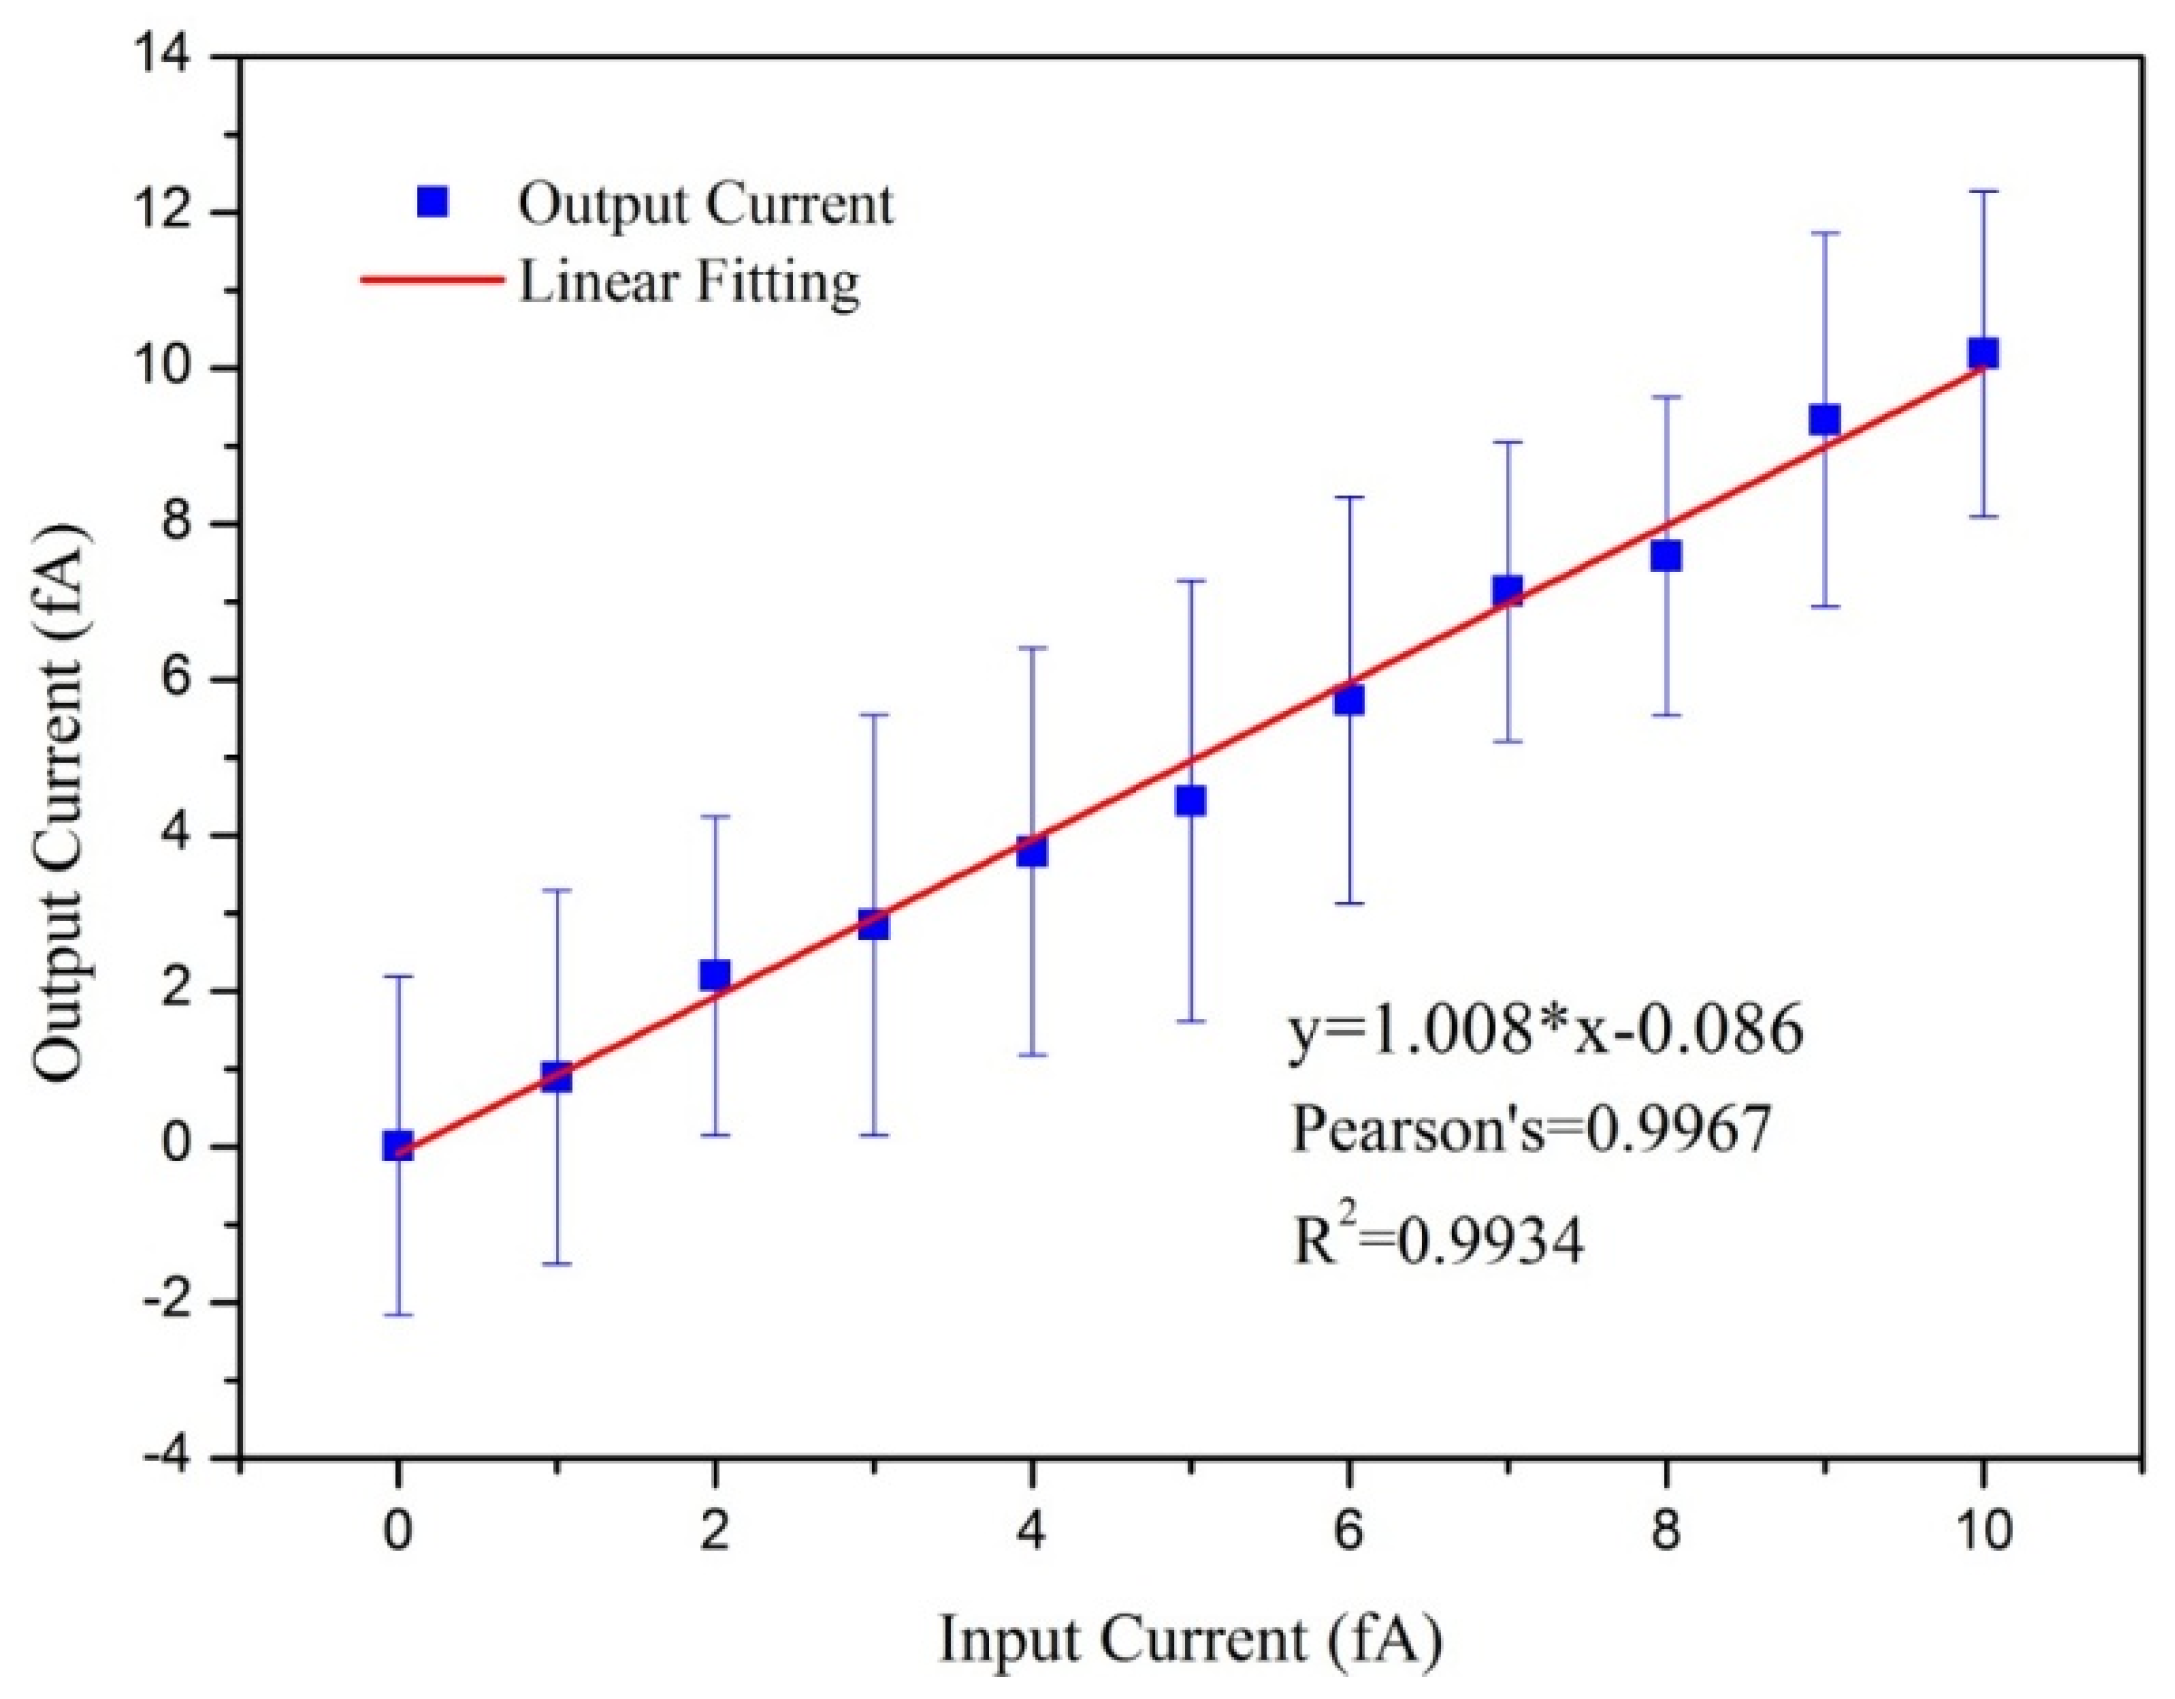
3.1.2. Sensitivity
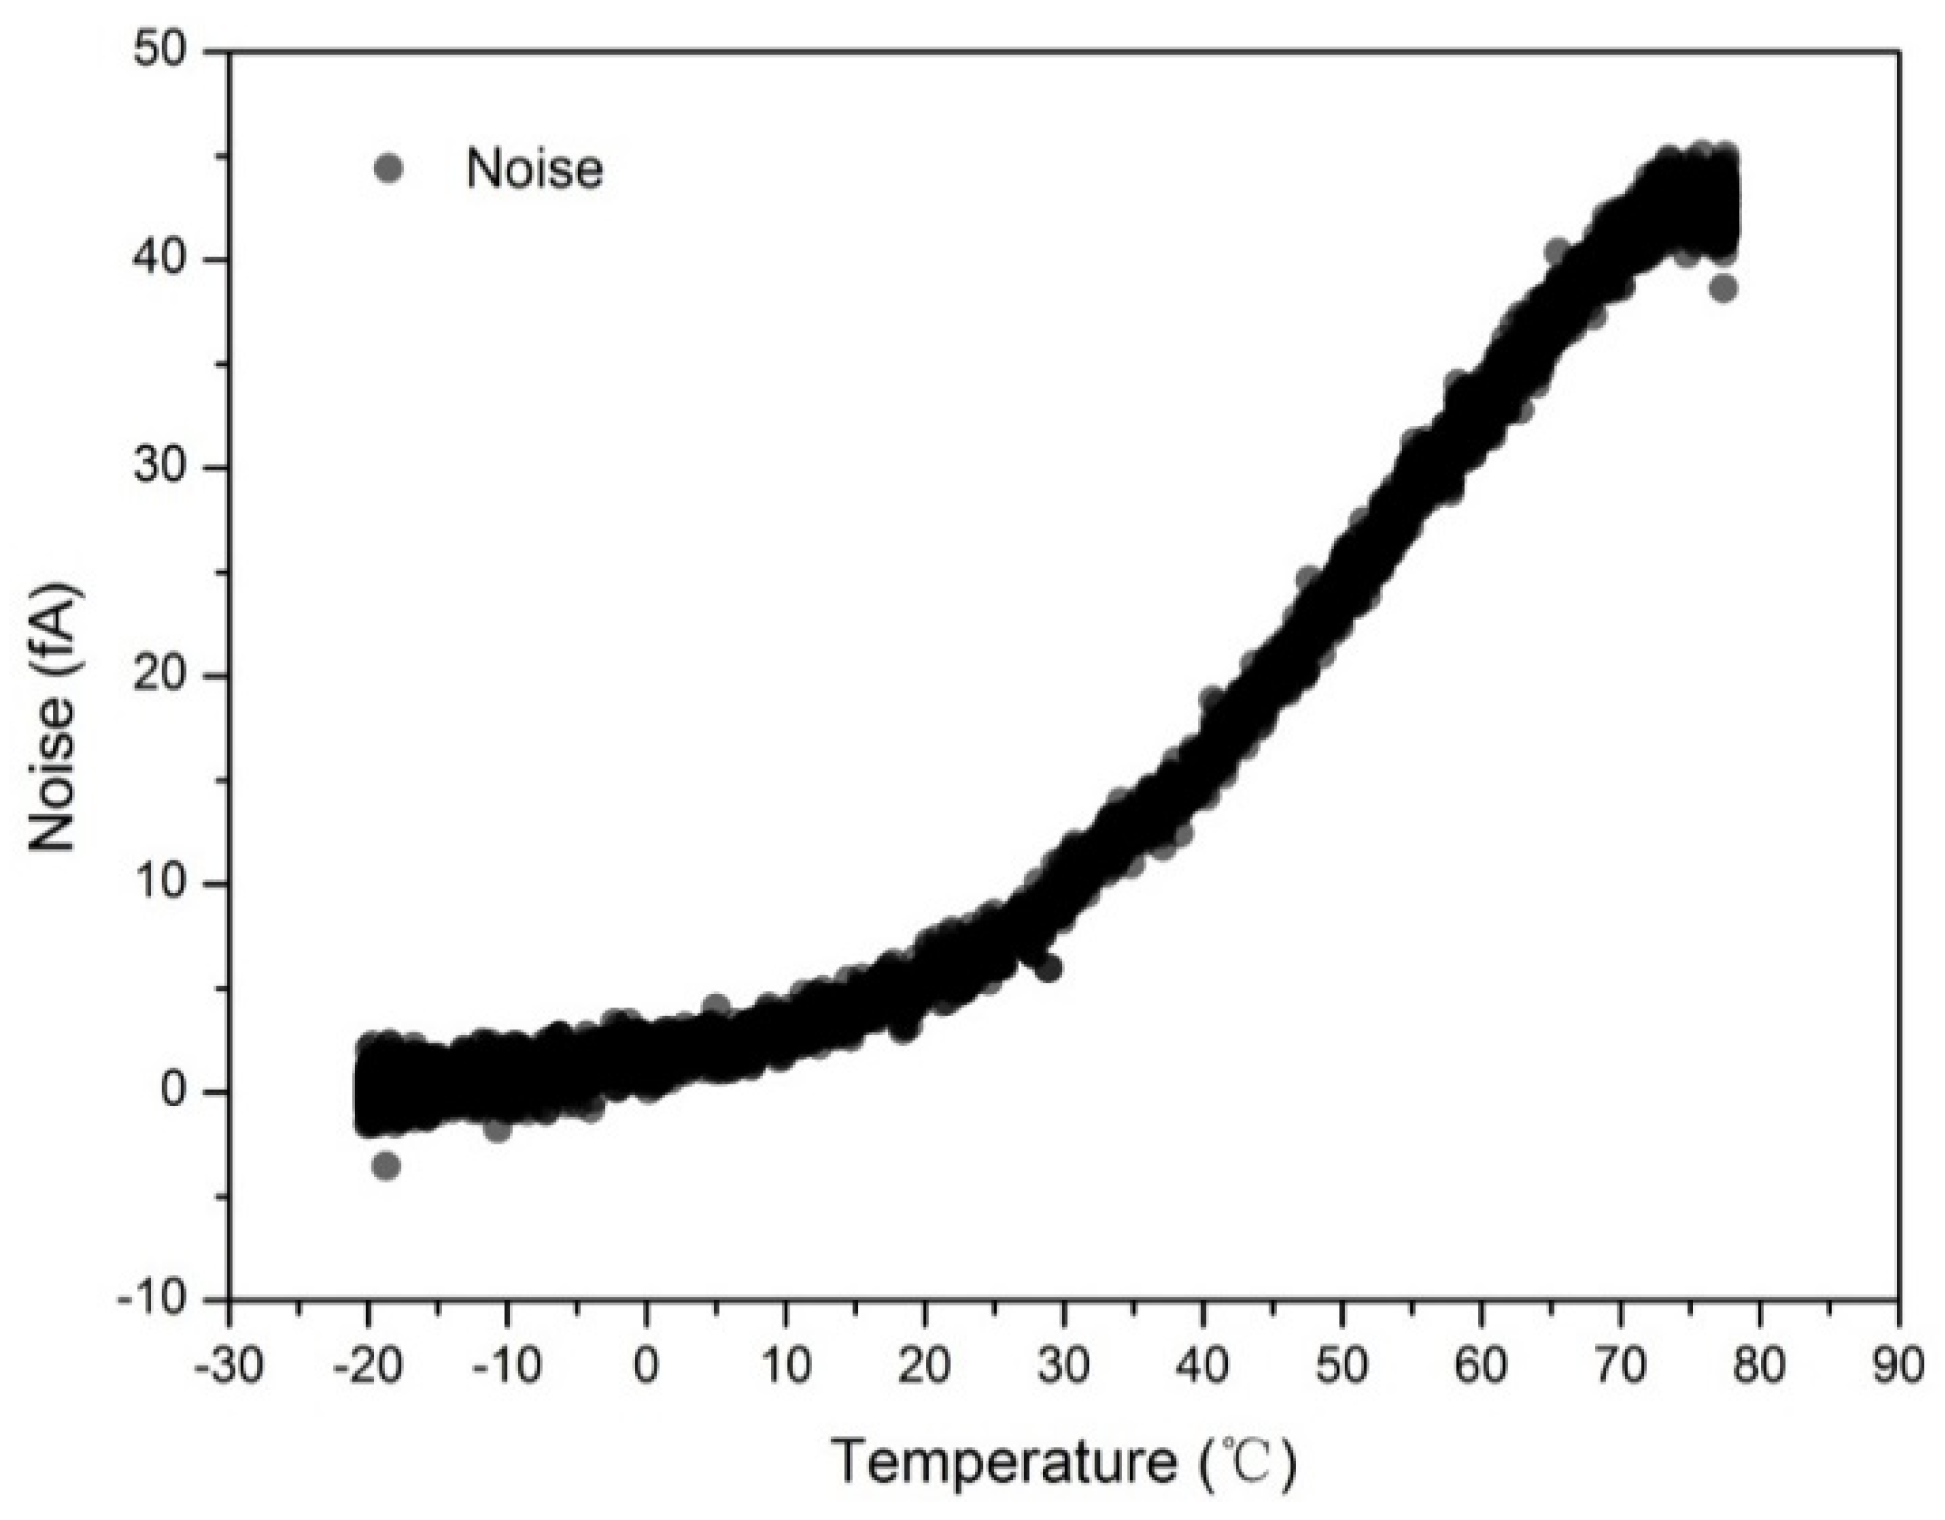
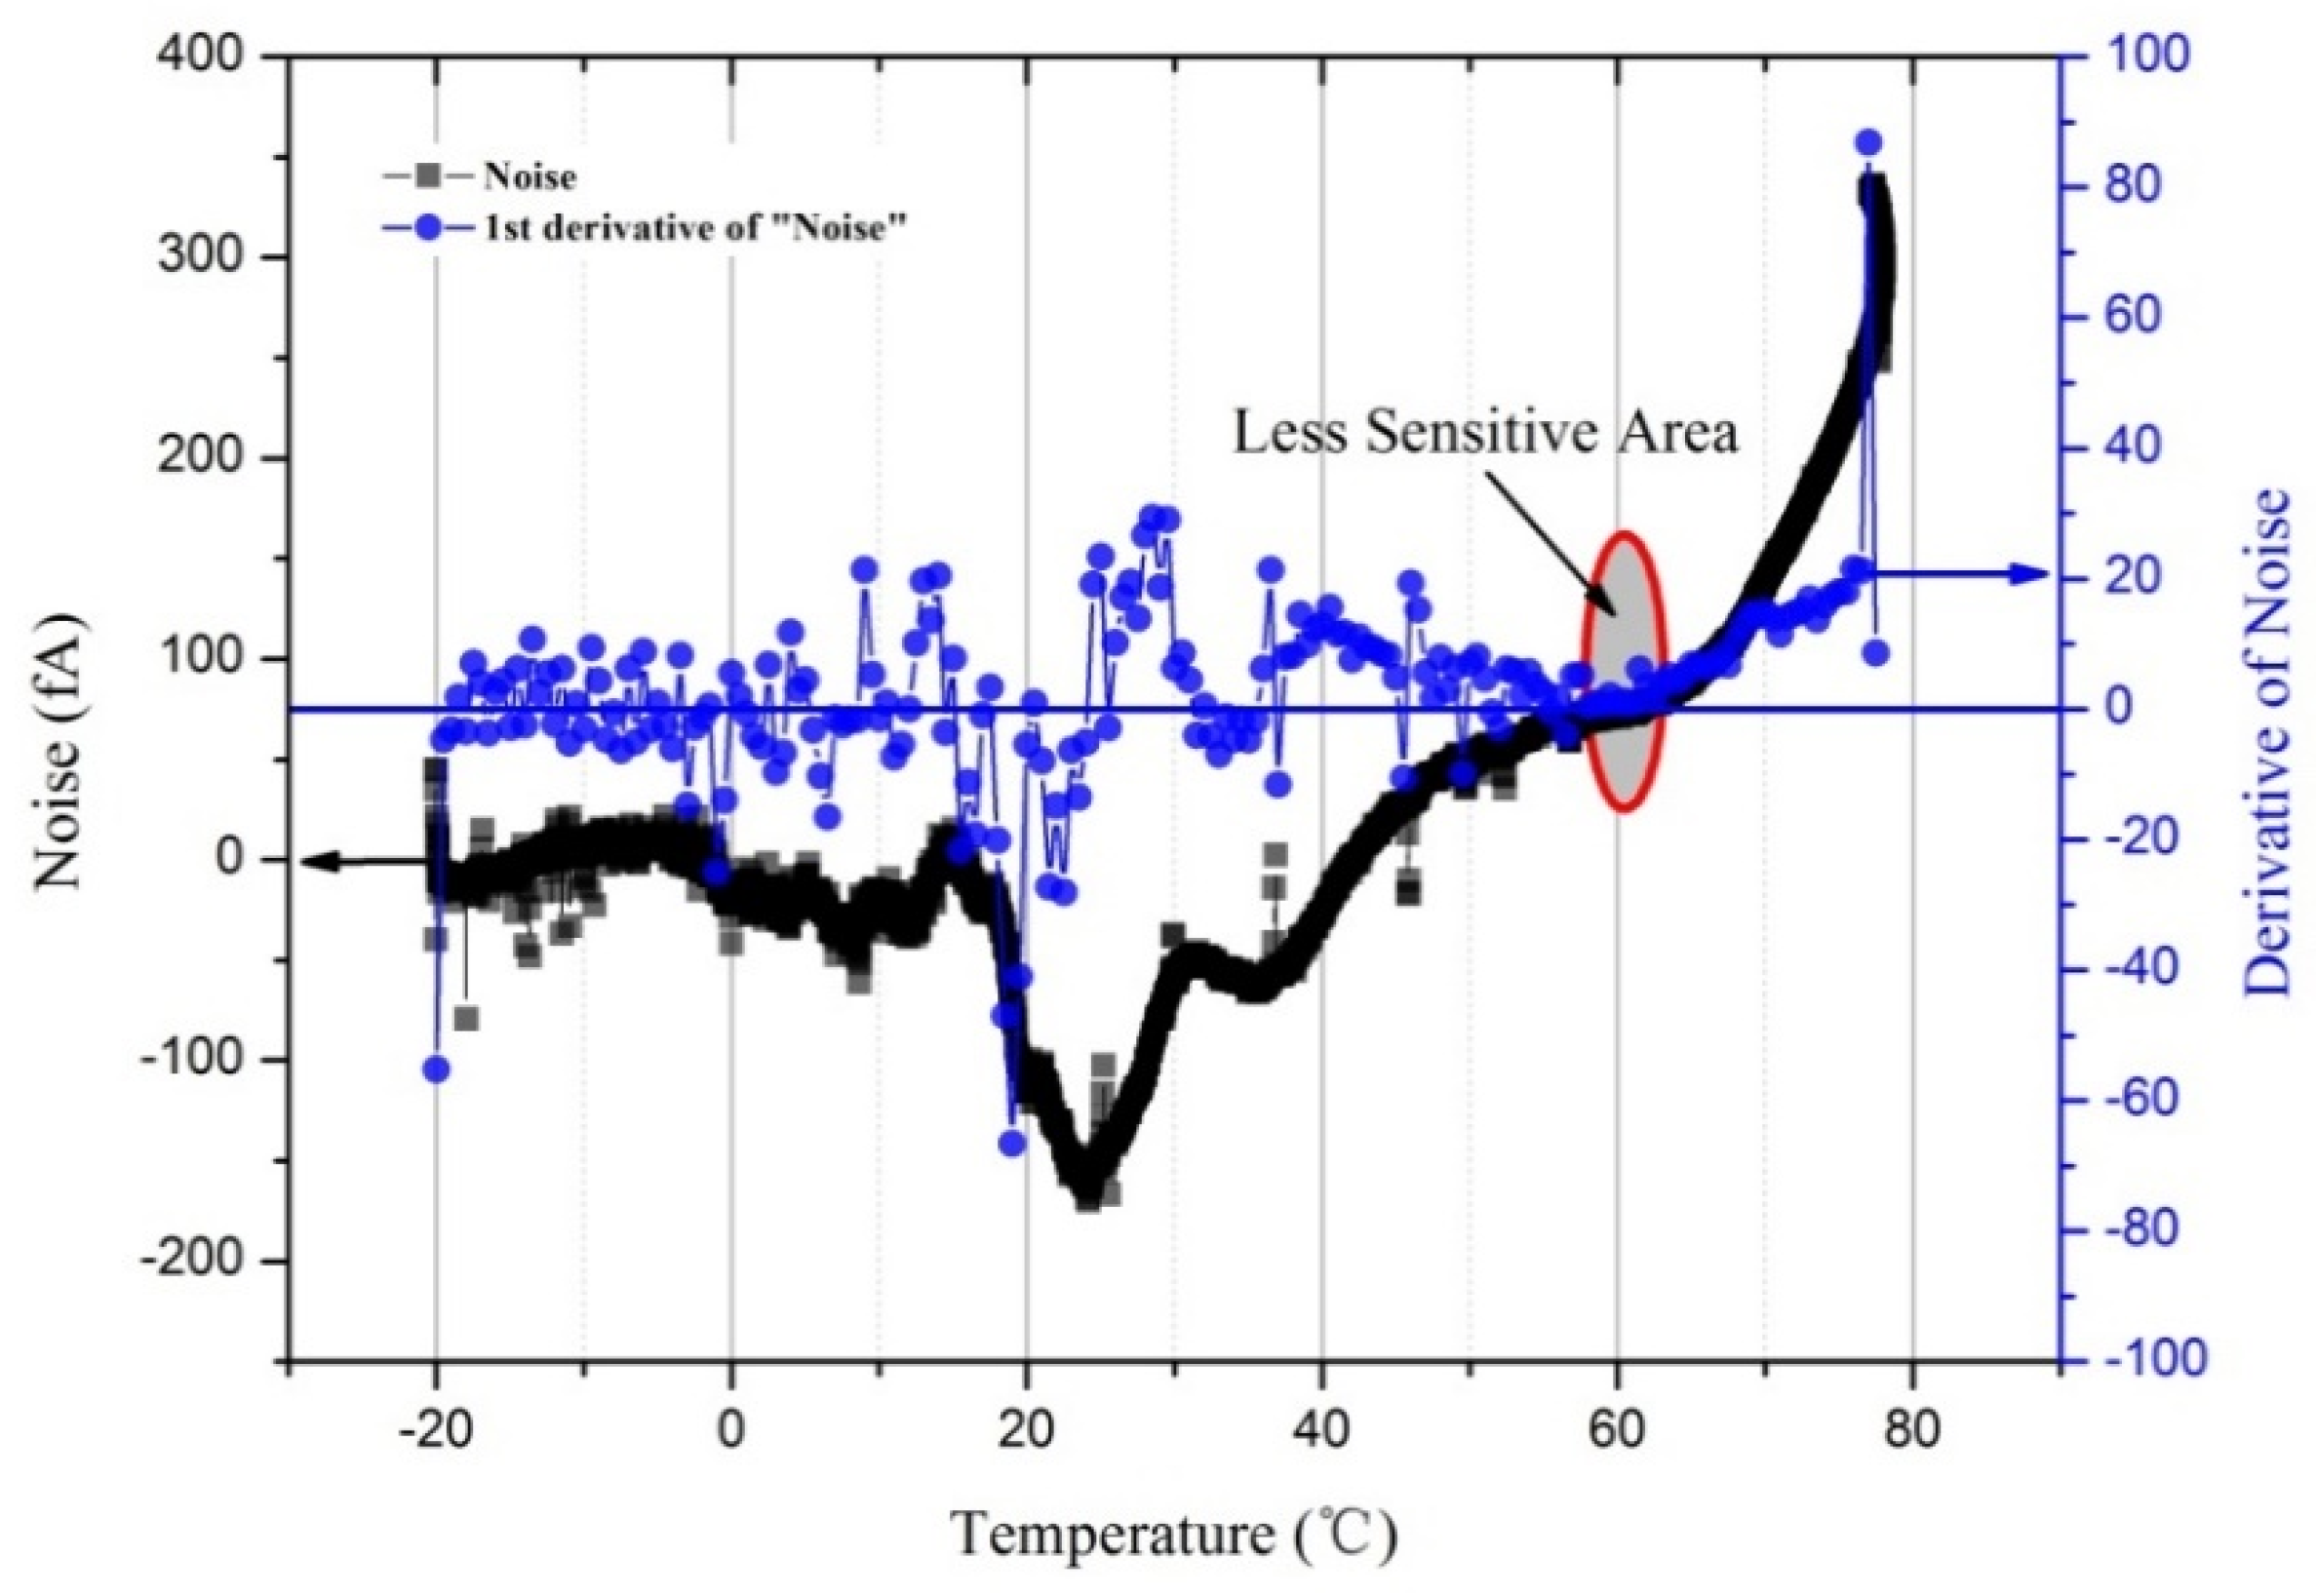
3.2. Effect of Temperature on the Noise of the Aerosol Electrometer
3.3. Results of the Evaluation of the Aerosol Electrometer
4. Conclusions
Author Contributions
Funding
Acknowledgments
Conflicts of Interest
References
- Liu, B.Y.H.; Pui, D.Y.H. On the performance of the electrical aerosol analyzer. J. Aerosol Sci. 1975, 6, 249–264. [Google Scholar] [CrossRef]
- Liu, B.Y.H.; Pui, D.Y.H. A submicron aerosol standard and the primary, absolute calibration of the condensation nuclei counter. J. Colloid Interface Sci. 1974, 47, 155–171. [Google Scholar] [CrossRef]
- Collins, A.M.; Dick, W.D.; Romay, F.J. A New Coincidence Correction Method for Condensation Particle Counters. Aerosol Sci. Technol. 2013, 47, 177–182. [Google Scholar] [CrossRef]
- Vanhanen, J.; Mikkilä, J.; Lehtipalo, K.; Sipilä, M.; Manninen, H.E.; Siivola, E.; Petäjä, T.; Kulmala, M. Particle Size Magnifier for Nano-CN Detection. Aerosol Sci. Technol. 2011, 45, 533–542. [Google Scholar] [CrossRef]
- Chen, L.; Ma, Y.; Guo, Y.; Zhang, C.; Liang, Z.; Zhang, X. Quantifying the effects of operational parameters on the counting efficiency of a condensation particle counter using response surface Design of Experiments (DoE). J. Aerosol Sci. 2016, 106, 11–23. [Google Scholar] [CrossRef]
- Park, S.S.; Lee, C.J.; Kim, S.W.; Lee, S.B.; Bae, G.N.; Moon, K.C. A novel ultrafine particle measurement system with an electrometer. In Proceedings of the IEEE 48th Midwest Symposium on Circuits and Systems, Covington, KY, USA, 7–10 August 2005; Volume 1, pp. 227–230. [Google Scholar]
- Stolzenburg, M.; Mcmurry, P. An Ultrafine Aerosol Condensation Nucleus Counter. Aerosol Sci. Technol. 1991, 14, 48–65. [Google Scholar] [CrossRef]
- Seto, T.; Nakamoto, T.; Okuyama, K.; Adachi, M.; Kuga, Y.; Takeuchi, K. Size distribution measurement of nanometer-sized aerosol particles using DMA under low-pressure conditions. J. Aerosol Sci. 1997, 28, 193–206. [Google Scholar] [CrossRef]
- Biskos, G.; Reavell, K.; Collings, N. Description and Theoretical Analysis of a Differential Mobility Spectrometer. Aerosol Sci. Technol. 2005, 39, 527–541. [Google Scholar] [CrossRef]
- Seol, K.S.; Tsutatani, Y.; Camata, R.P.; Yabumoto, J.; Isomura, S.; Okada, Y.; Okuyama, K.; Takeuchi, K. A differential mobility analyzer and a Faraday cup electrometer for operation at 200–930 Pa pressure. J. Aerosol Sci. 2000, 31, 1389–1395. [Google Scholar] [CrossRef]
- Shimada, M.; Iskandar, F.; Okuyama, K. Development of DMA-Faraday Cup Electrometer system for measurement of submicron aerosol particles. AIP Conf. Proc. 2000, 534, 773–776. [Google Scholar]
- J-Fatokun, F.O.; Jamriska, L.M.; Jayaratne, E.R. Application of Aerosol Electrometer for Ambient Particle Charge Measurements. Atmos. Environ. 2008, 42, 8827–8830. [Google Scholar] [CrossRef]
- Intra, P.; Tippayawong, N. Development and Evaluation of a Faraday Cup Electrometer for Measuring and Sampling Atmospheric Ions and Charged Aerosols. Part. Sci. Technol. 2015, 33, 257–263. [Google Scholar] [CrossRef]
- Intra, P.; Tippayawong, N. Measurements of ion current from a corona-needle charger using a Faraday cup electrometer. Chiang Mai J. Sci. 2009, 36, 110–119. [Google Scholar]
- Pihlava, K.; Keskinen, J.; Yliojanperä, J. Improving the signal-to-noise ratio of Faraday cup aerosol electrometer-based aerosol instrument calibrations. Aerosol Sci. Technol. 2016, 50, 373–379. [Google Scholar] [CrossRef]
- Harrison, R.G.; Marlton, G.J.; Nicoll, K.A.; Airey, M.W.; Williams, P.D. Note: A self-calibrating wide range electrometer for in-cloud measurements. Rev. Sci. Instrum. 2017, 88, 126109. [Google Scholar] [CrossRef] [PubMed]
- Jaramillo, G.; Buffa, C.; Li, M.; Brechtel, F.J.; Langfelder, G.; Horsley, D.A. MEMS Electrometer with Femtoampere Resolution for Aerosol Particulate Measurements. IEEE Sens. J. 2013, 13, 2993–3000. [Google Scholar] [CrossRef]
- Mora, J.F.D.L.; Perez-Lorenzo, L.J.; Arranz, G.; Amo-Gonzalez, M.; Burtscher, H. Fast high-resolution nanoDMA measurements with a 25 ms response time electrometer. Aerosol Sci. Technol. 2017, 51, 724–734. [Google Scholar] [CrossRef]
- AEROSOL ELECTROMETER 3068B. Available online: http://www.tsi.com/Aerosol-Electrometer-3068B/ (accessed on 10 April 2018).
- Keithley. Low Level Measurements Handbook, 7th ed.; Keithley: Solon, OH, USA, 2014; pp. 2-55–2-62. [Google Scholar]
- Yu, T.; Yang, Y.; Liu, J.; Gui, H.; Zhang, J.; Cheng, Y.; Du, P.; Wang, J.; Wang, W.; Wang, H. Design and evaluation of a unipolar aerosol particle charger with built-in electrostatic precipitator. Instrum. Sci. Technol. 2018, 46, 326–347. [Google Scholar] [CrossRef]
- Barker, R.W.J. Modern electrometer techniques. Proc. Inst. Electr. Eng. 2010, 126, 1053–1068. [Google Scholar] [CrossRef]
- Liu, Q. Ultrafine Particle Generation and Measurement. Ph.D. Thesis, Virginia Commonwealth University, Richmond, VA, USA, 2015. [Google Scholar]


© 2018 by the authors. Licensee MDPI, Basel, Switzerland. This article is an open access article distributed under the terms and conditions of the Creative Commons Attribution (CC BY) license (http://creativecommons.org/licenses/by/4.0/).
Share and Cite
Yang, Y.; Yu, T.; Zhang, J.; Wang, W.; Gui, H.; Du, P.; Liu, J. Design and Evaluation of an Aerosol Electrometer with Low Noise and a Wide Dynamic Range. Sensors 2018, 18, 1614. https://doi.org/10.3390/s18051614
Yang Y, Yu T, Zhang J, Wang W, Gui H, Du P, Liu J. Design and Evaluation of an Aerosol Electrometer with Low Noise and a Wide Dynamic Range. Sensors. 2018; 18(5):1614. https://doi.org/10.3390/s18051614
Chicago/Turabian StyleYang, Yixin, Tongzhu Yu, Jiaoshi Zhang, Wenyu Wang, Huaqiao Gui, Peng Du, and Jianguo Liu. 2018. "Design and Evaluation of an Aerosol Electrometer with Low Noise and a Wide Dynamic Range" Sensors 18, no. 5: 1614. https://doi.org/10.3390/s18051614
APA StyleYang, Y., Yu, T., Zhang, J., Wang, W., Gui, H., Du, P., & Liu, J. (2018). Design and Evaluation of an Aerosol Electrometer with Low Noise and a Wide Dynamic Range. Sensors, 18(5), 1614. https://doi.org/10.3390/s18051614