A Novel Method of Autonomous Inspection for Transmission Line based on Cable Inspection Robot LiDAR Data


Abstract
:1. Introduction
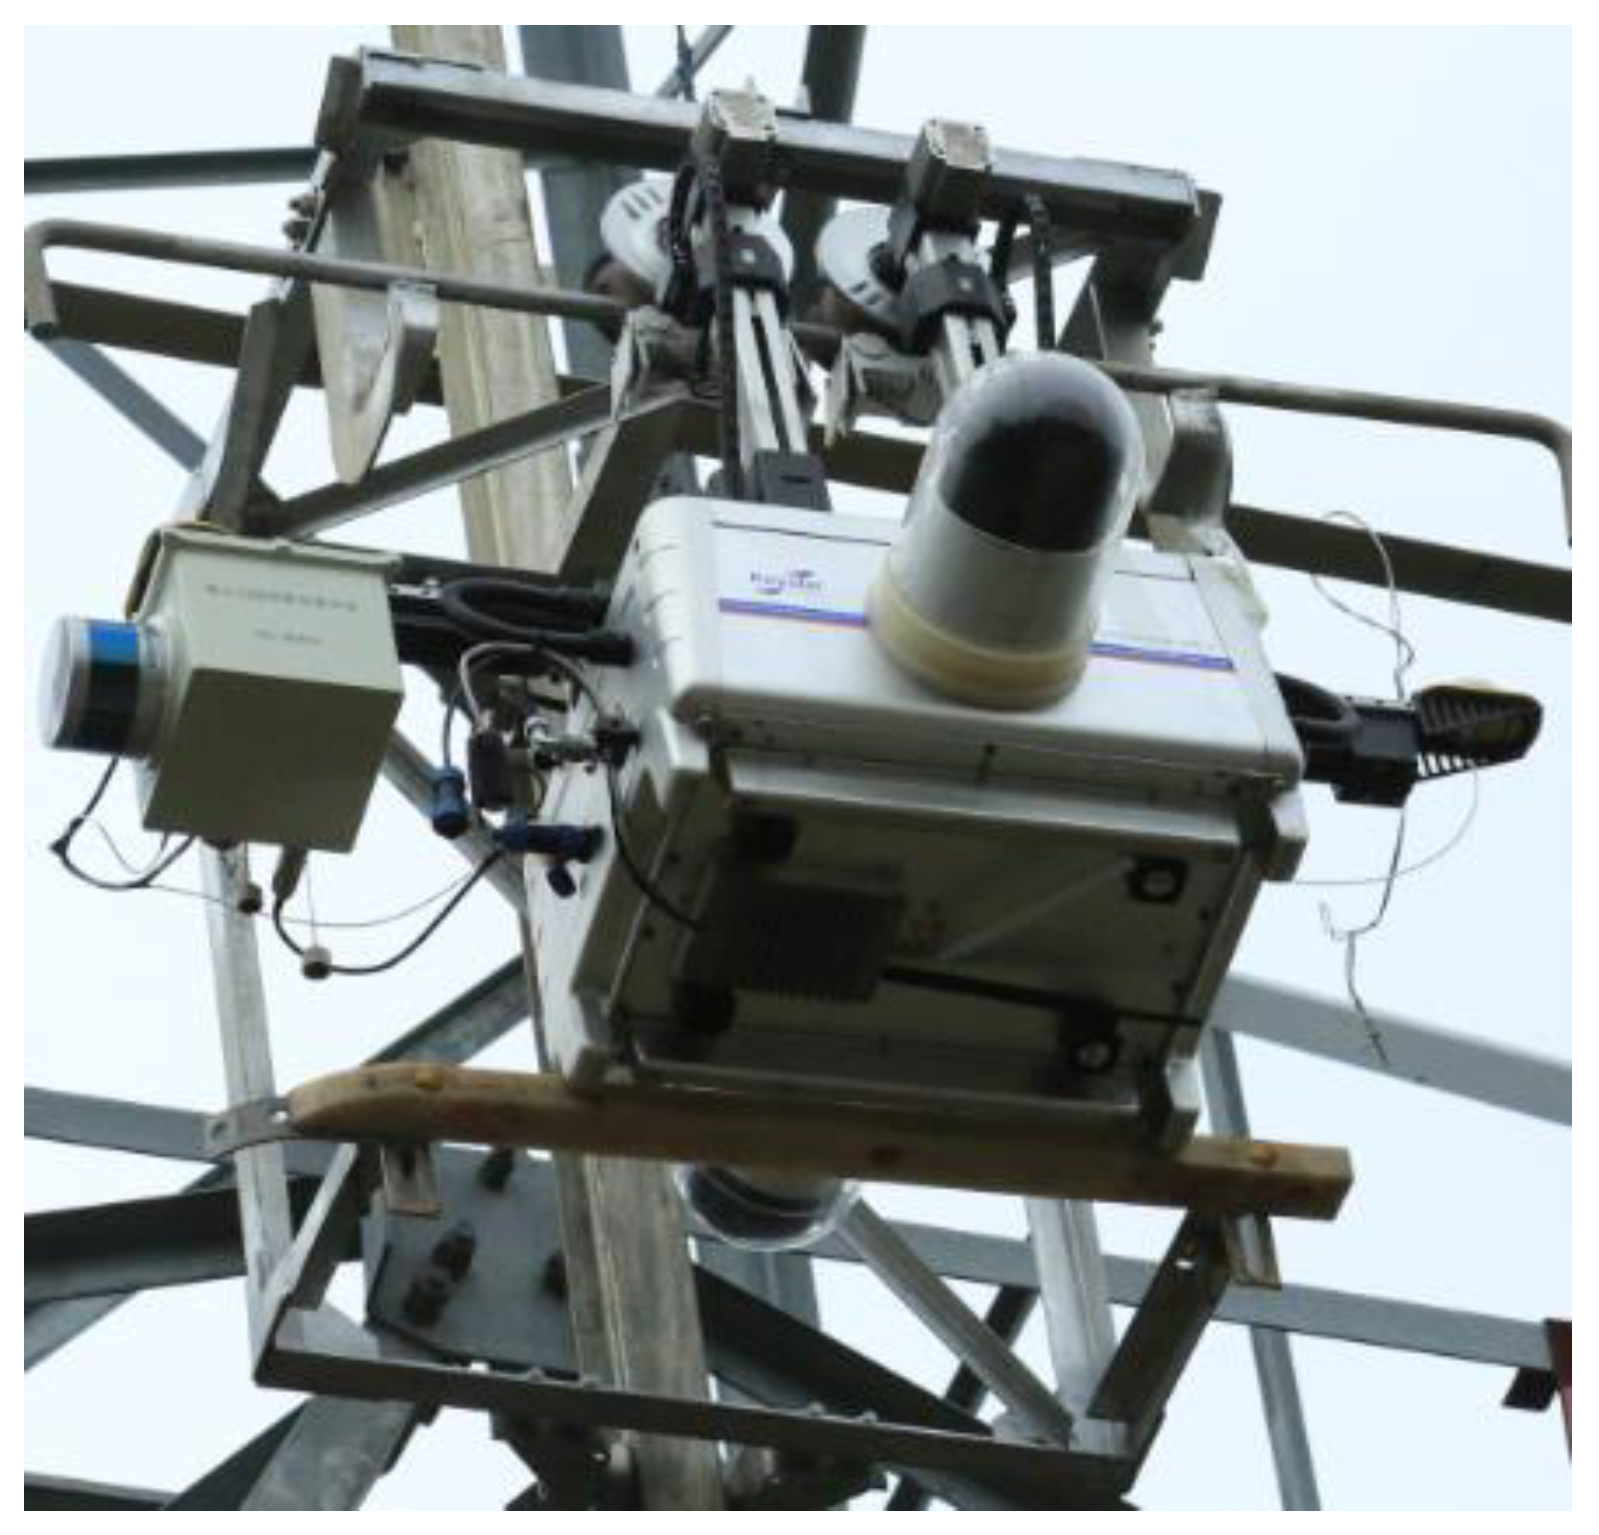
- Integrate advanced LiDAR technology and CIR technology to get unique CIR LiDAR data. CIR LiDAR, along a ground wire, would not be subject to topographic restriction like airborne LiDAR; CIR LiDAR can also scan objects at a closer range to obtain more fine-scale LiDAR data like vehicle-borne LiDAR. CIR LiDAR can also provide high-precision POS data that could represent the orientation and shape of power lines in a span segment.
- Propose an autonomous inspection method based on CIR LiDAR data, combine the spatial information superiority of LiDAR and texture information advantage of image, and solve the practical problems in the autonomous inspection of transmission line at present.
- Automatically identify inspection targets using point cloud and image processing technology in preliminary inspection, operate CIR along a ground wire to the specified positions based on 3D precise information of inspection targets, transfer angles or directions of the PZT camera to take high-quality images, and save the inspection information of targets into the inspection database. This will greatly improve the efficiency and accuracy of inspection, providing a theoretical foundation for intelligent inspection.
2. Hardware
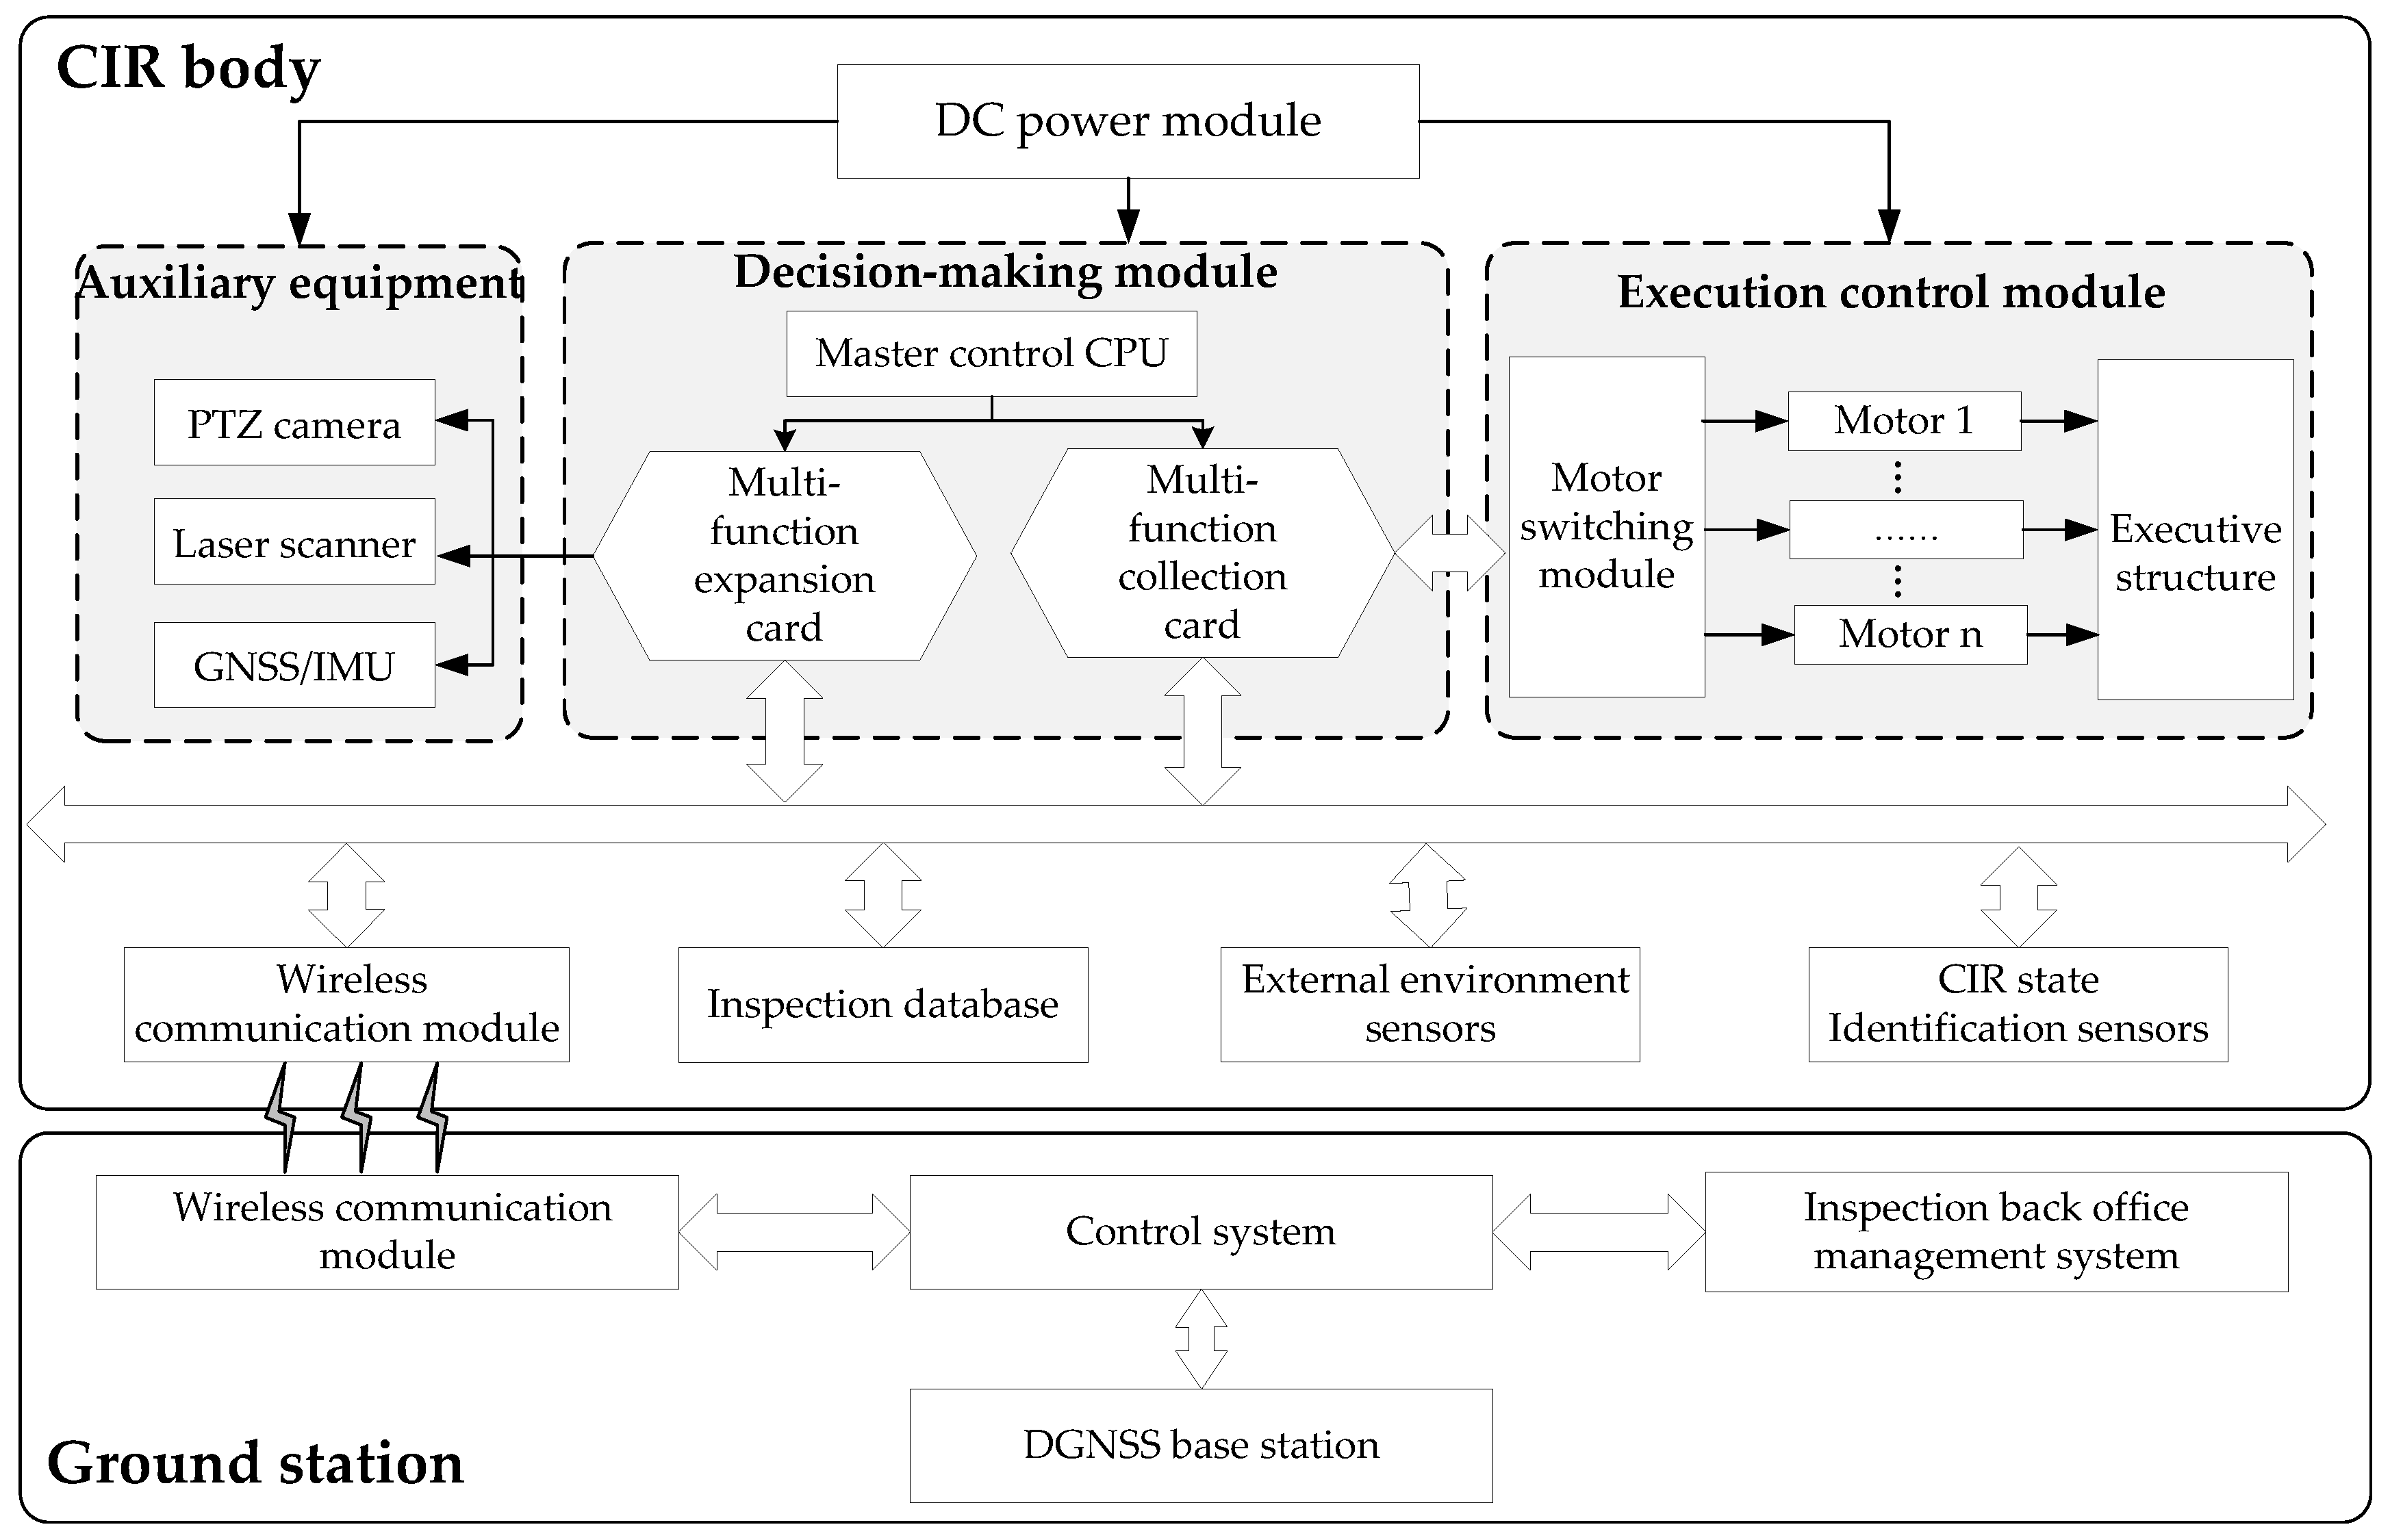
2.1. System Structure
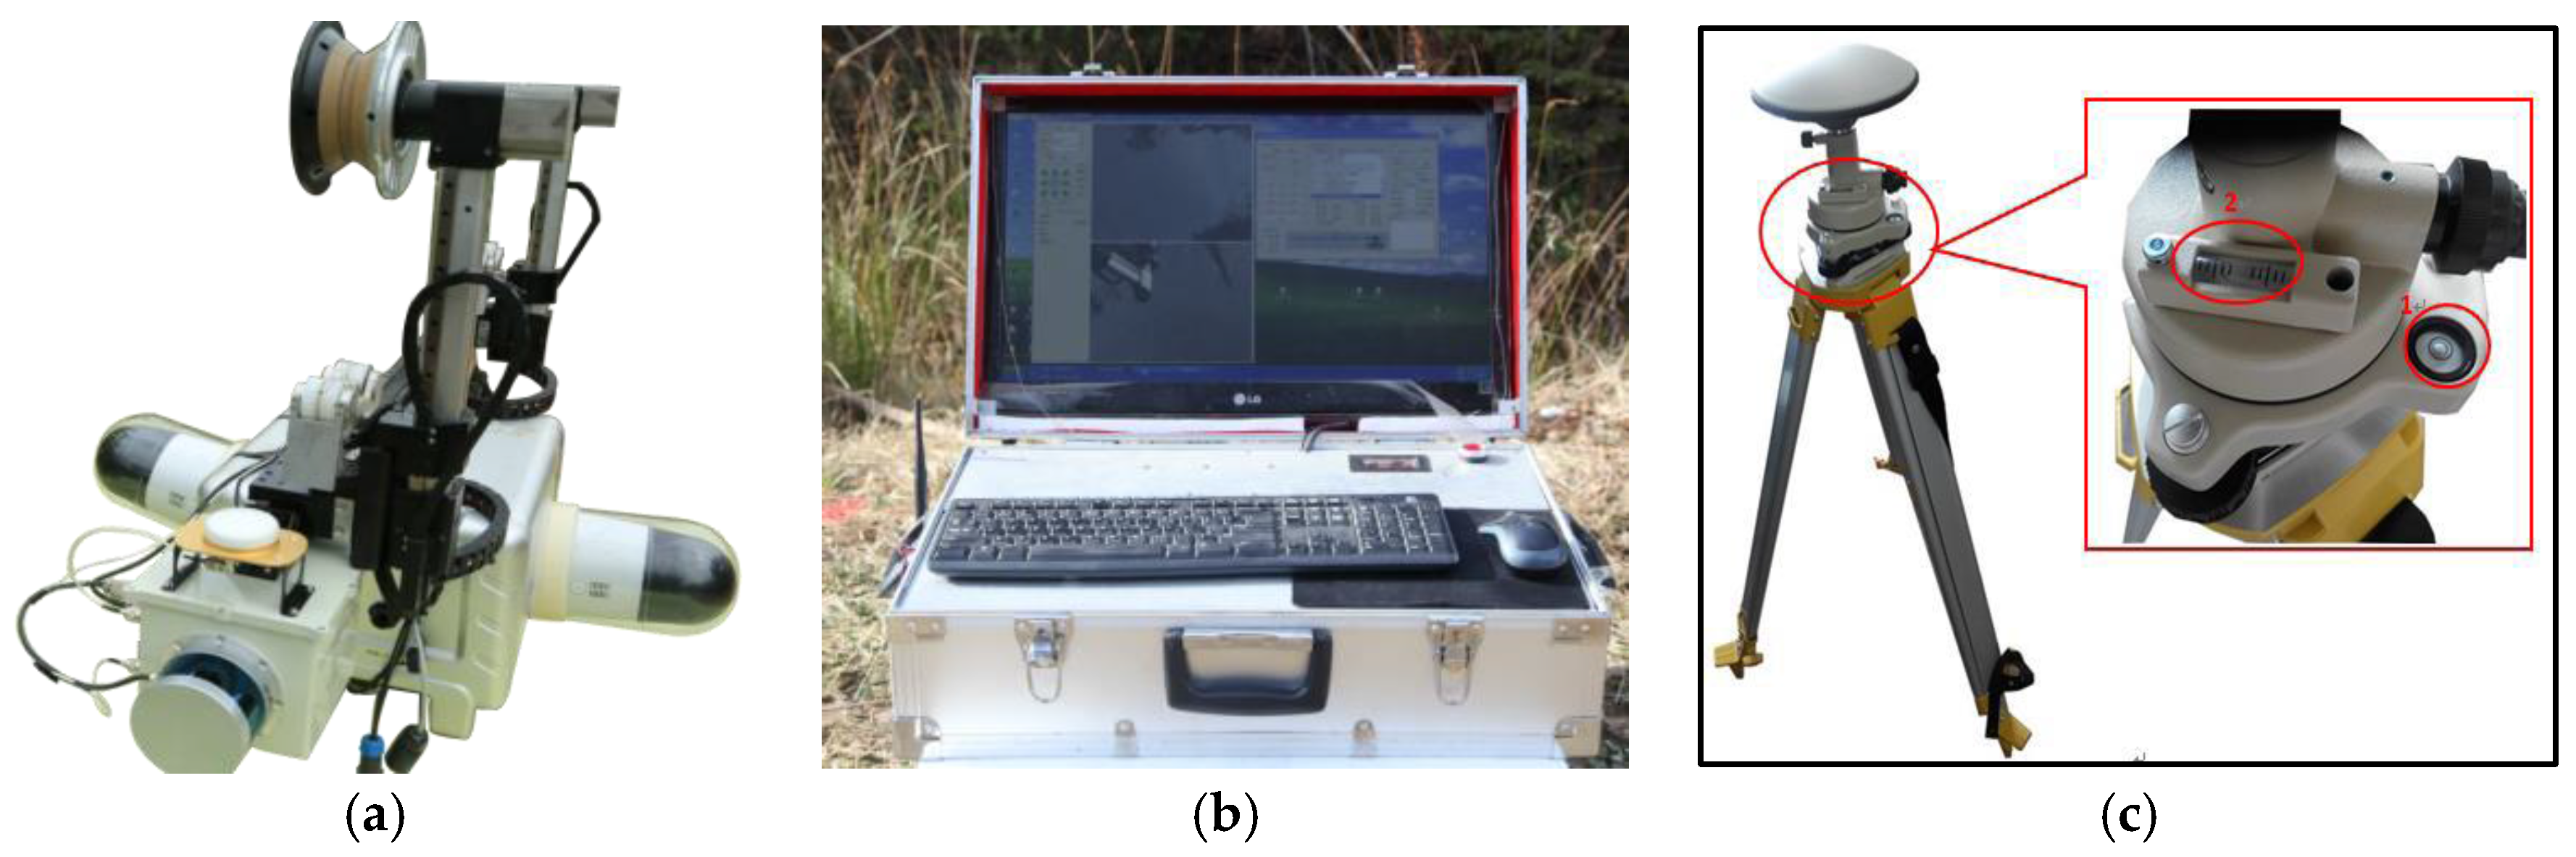
2.2. System Integration
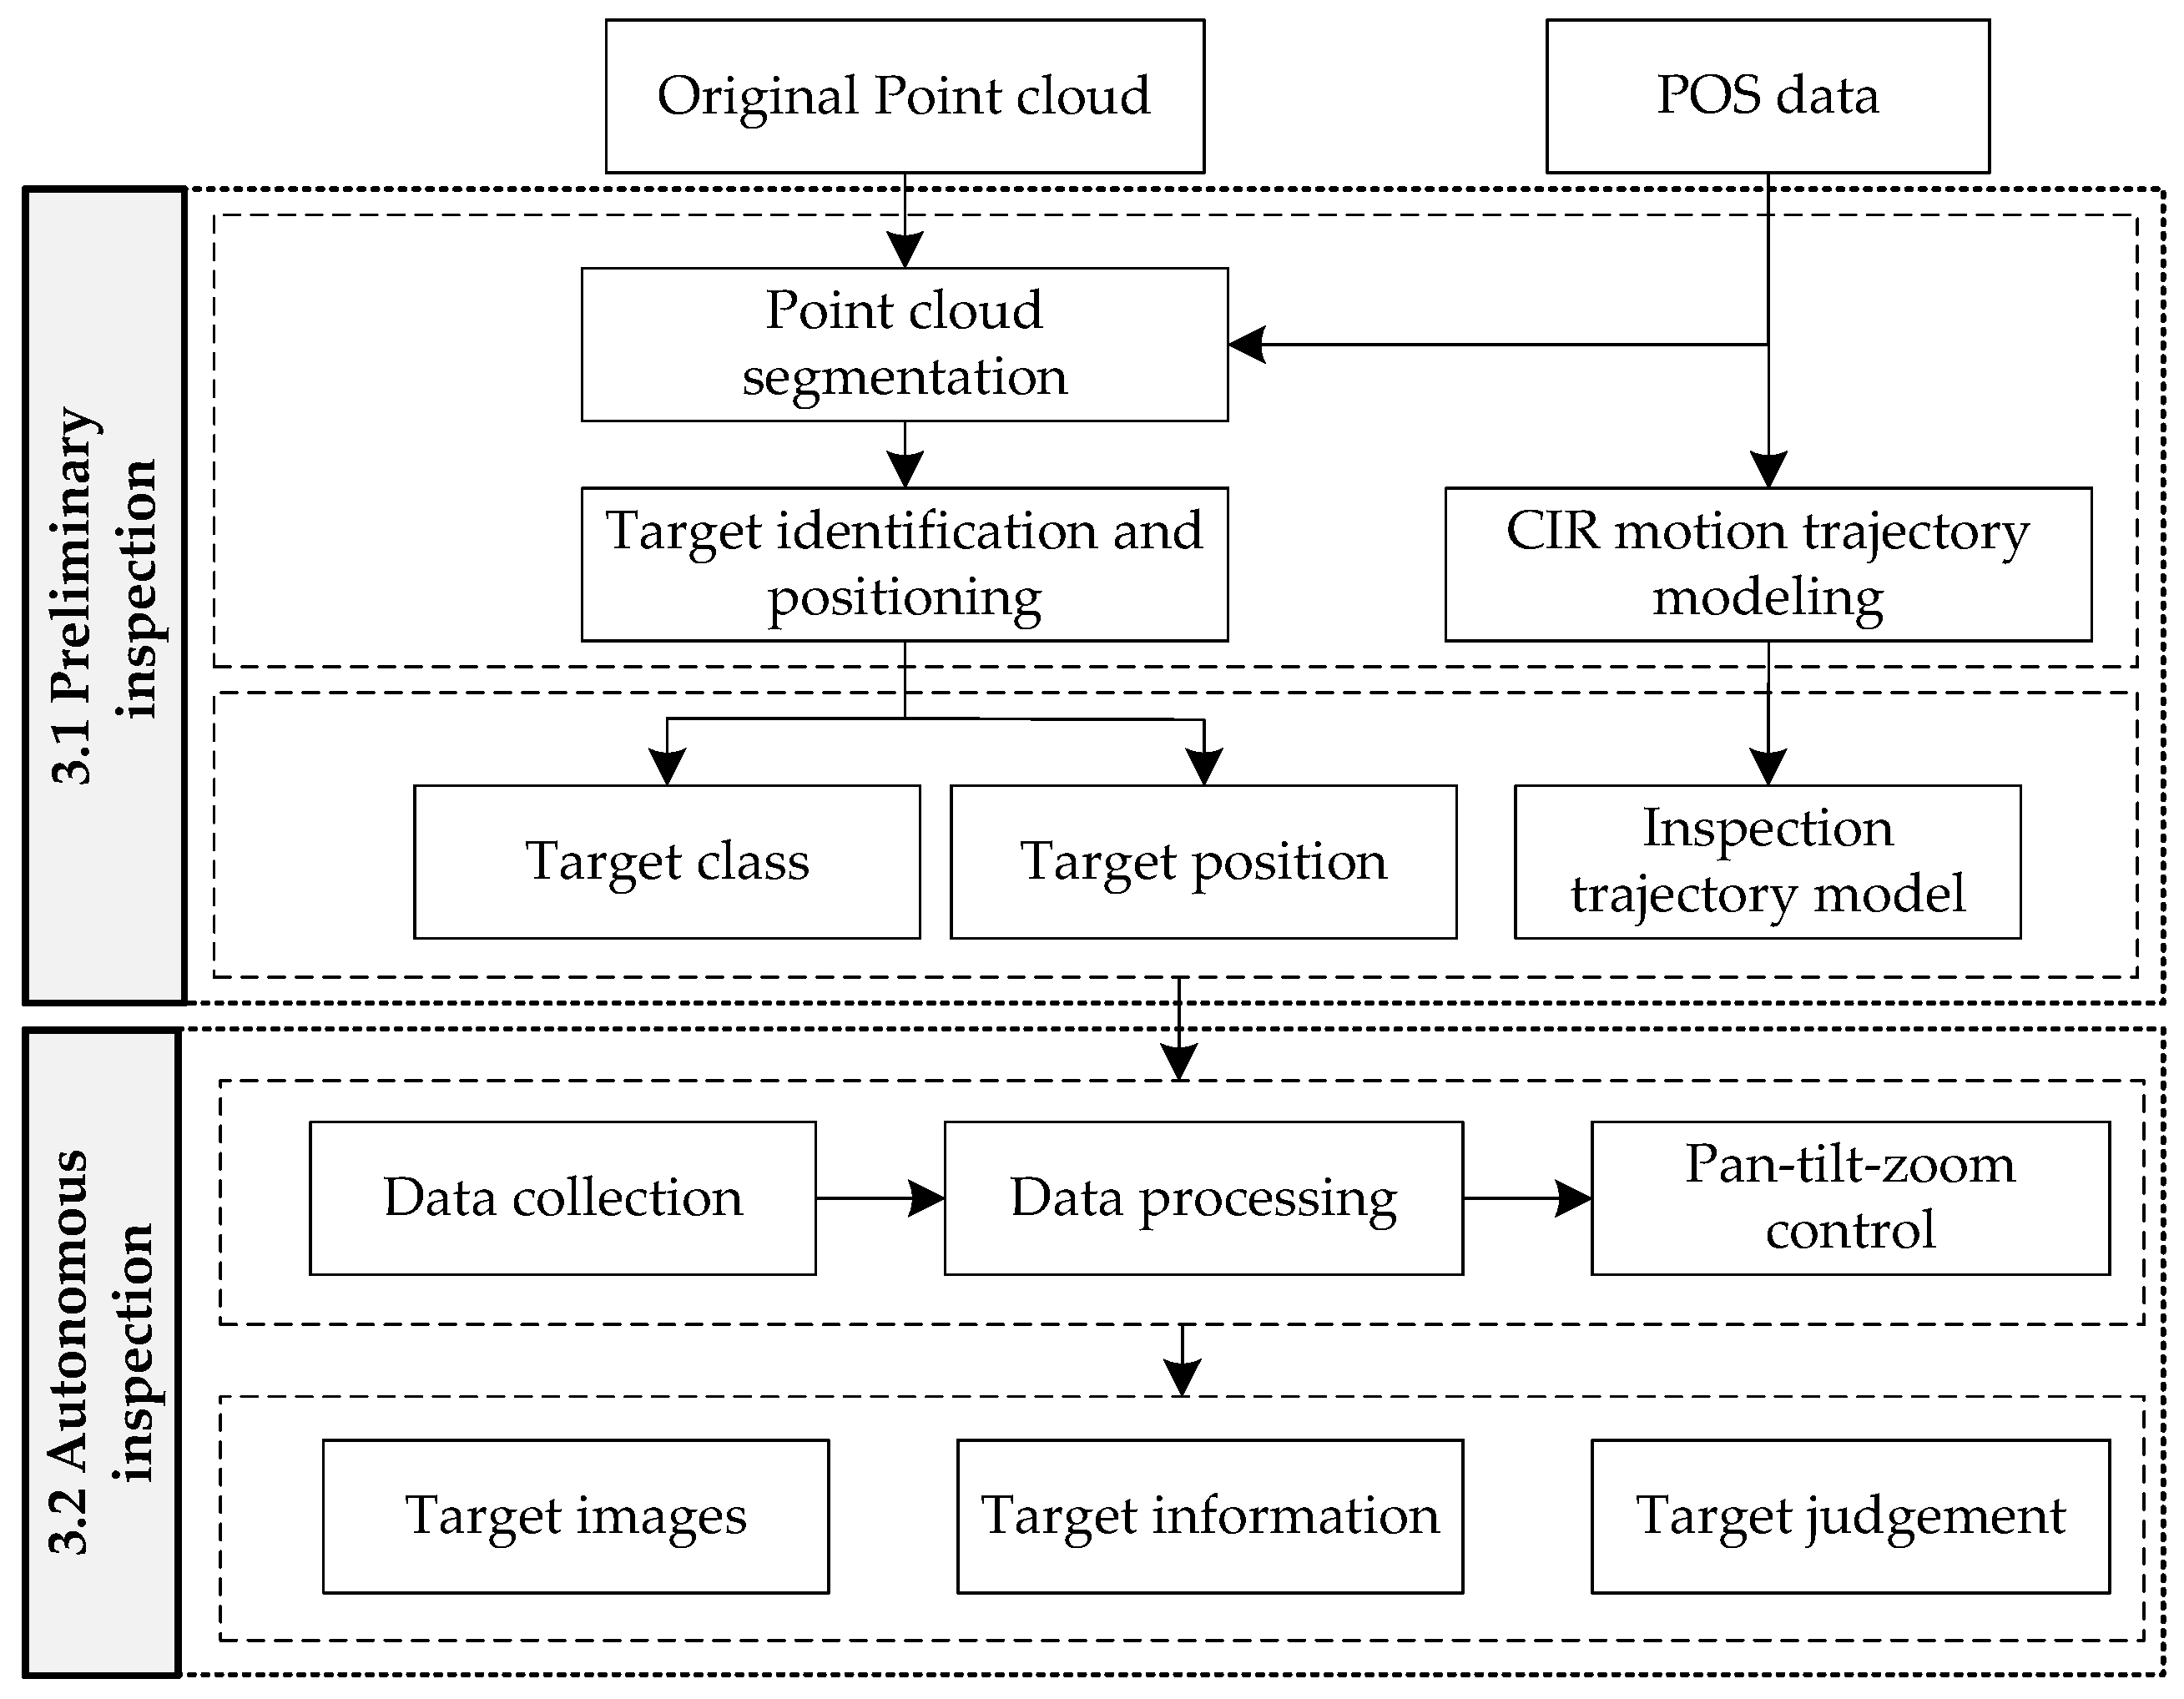
3. Methodology
3.1. Preliminary Inspection
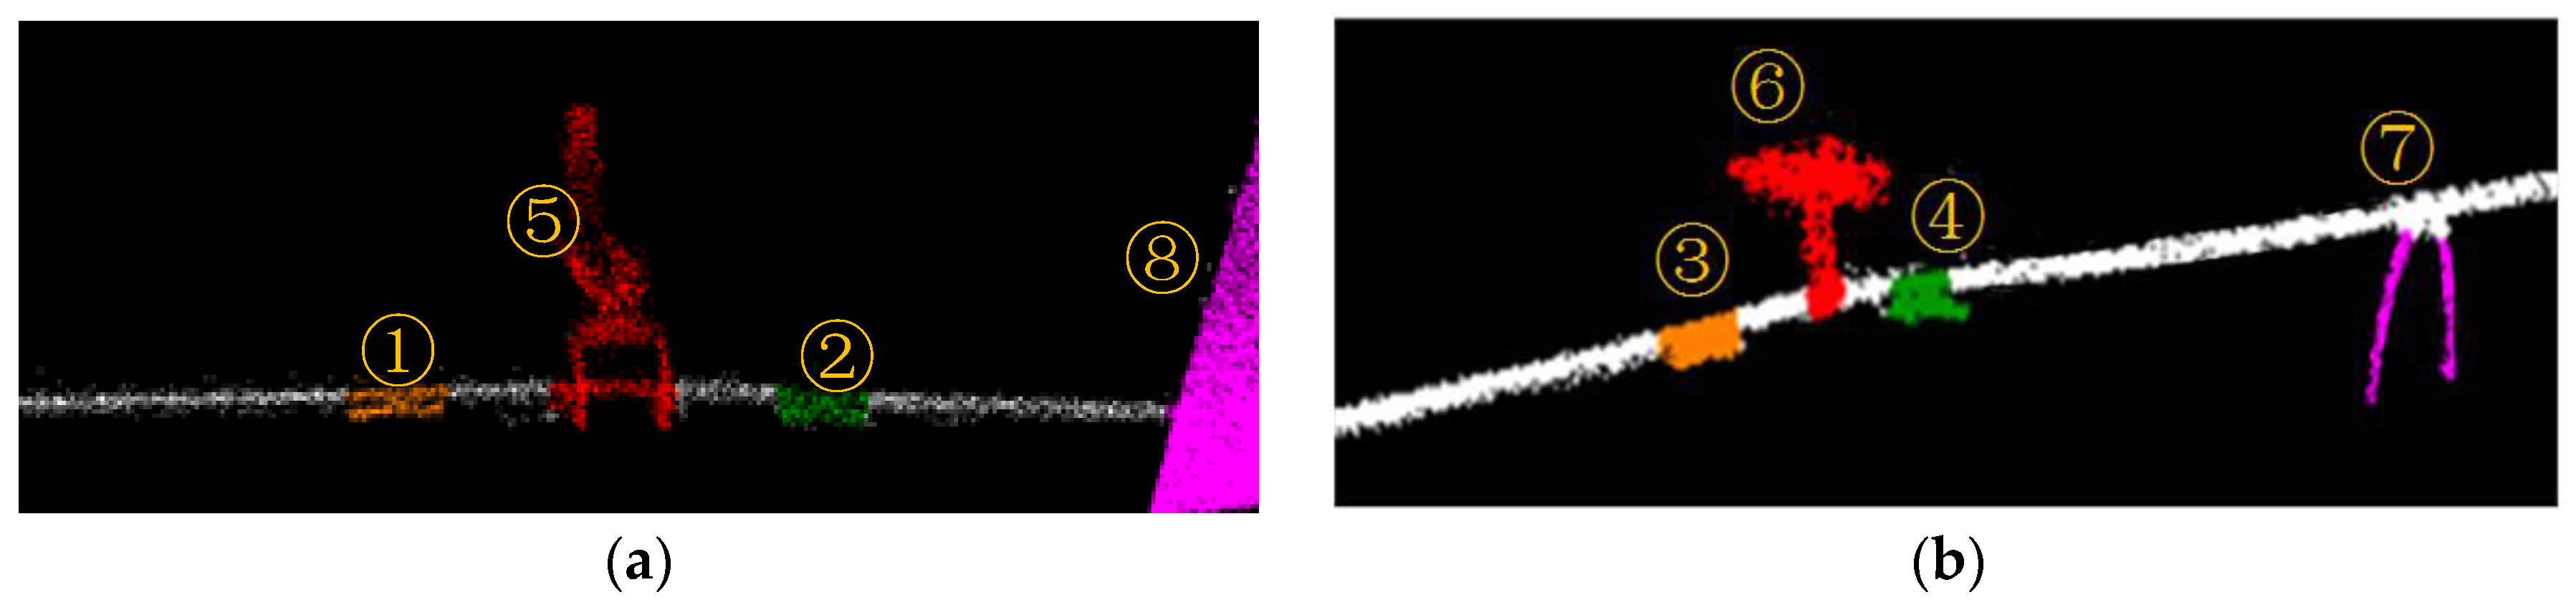
3.1.1. Point Cloud Segmentation
- (1)
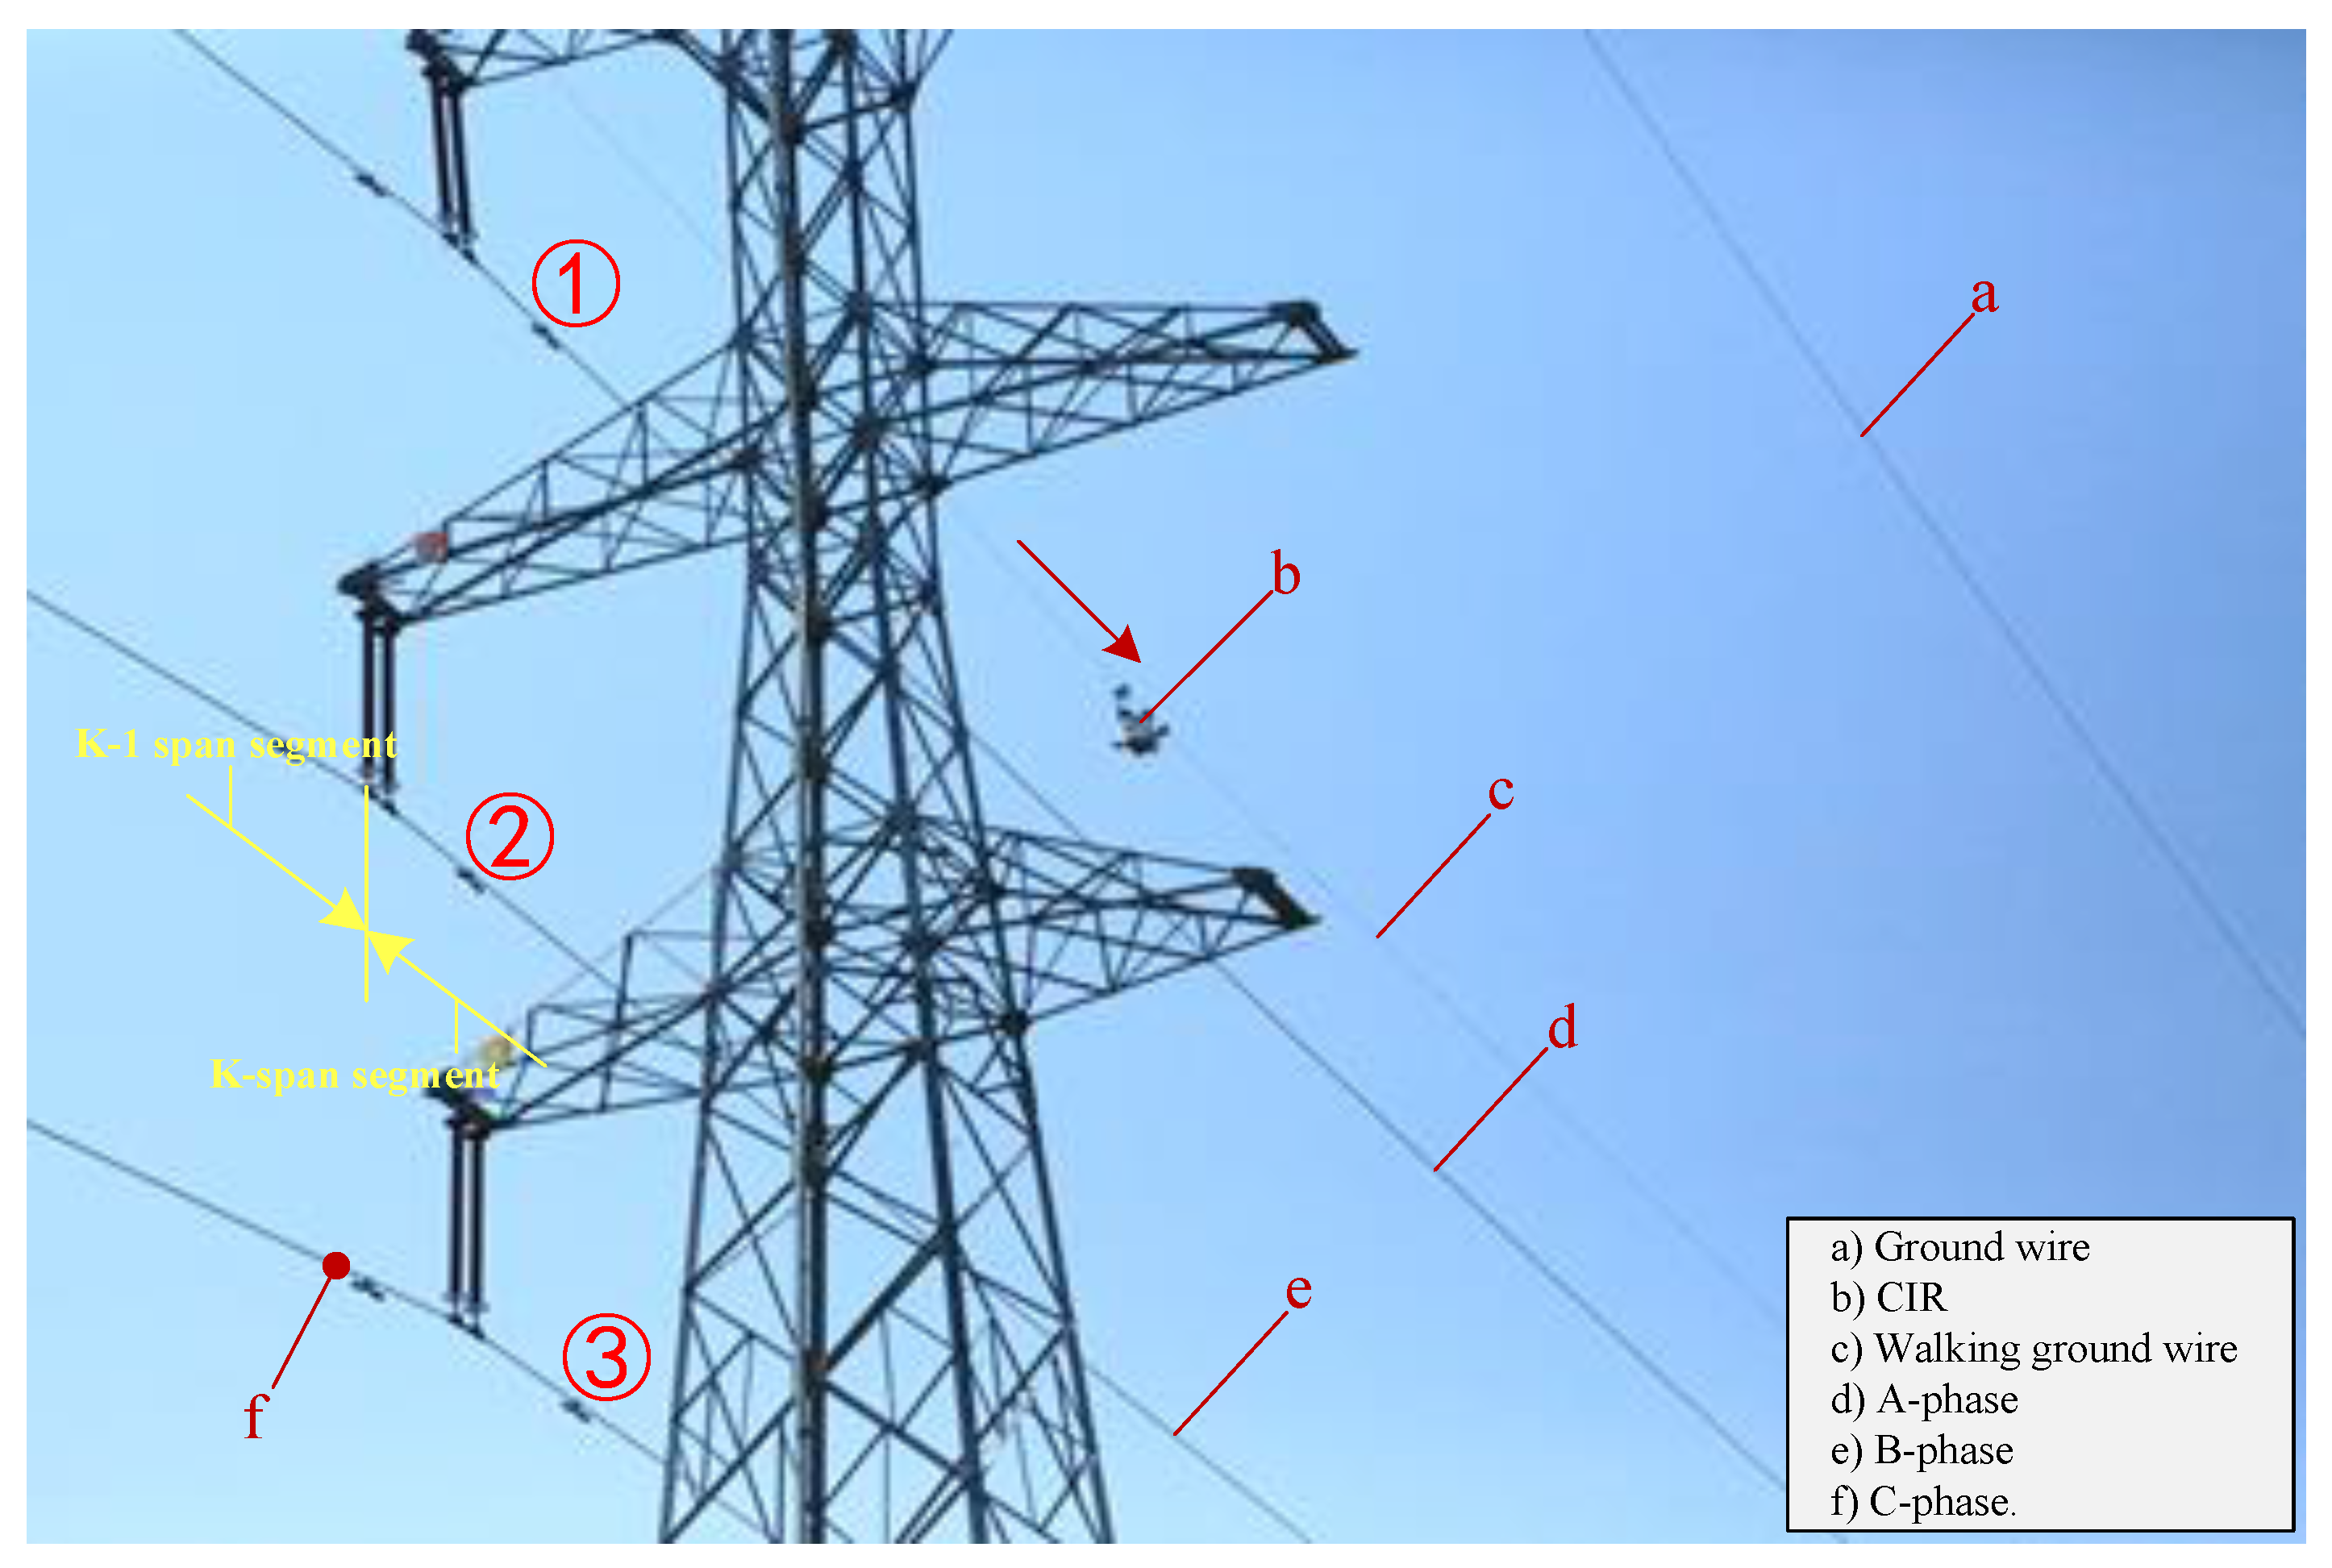
- Point cloud partition of a span segment based on POS data. In the process of inspection, the motion of CIR presents uphill–downhill–uphill. According to work characteristics and body angle data measured by obliquity sensors, suspension points of ground wire are assigned. In this way, multi-segment transmission lines can be partitioned into single segment transmission lines in point cloud data.
- (2)
- Ground point filtering by the elevation threshold value of POS. In addition to transmission line points of a span segment, there are also a few ground points and remaining surface points. The transmission line points in a span segment are generally higher than the ground points, so the POS elevation threshold is defined to quickly remove all ground points and most of the remaining surface points.
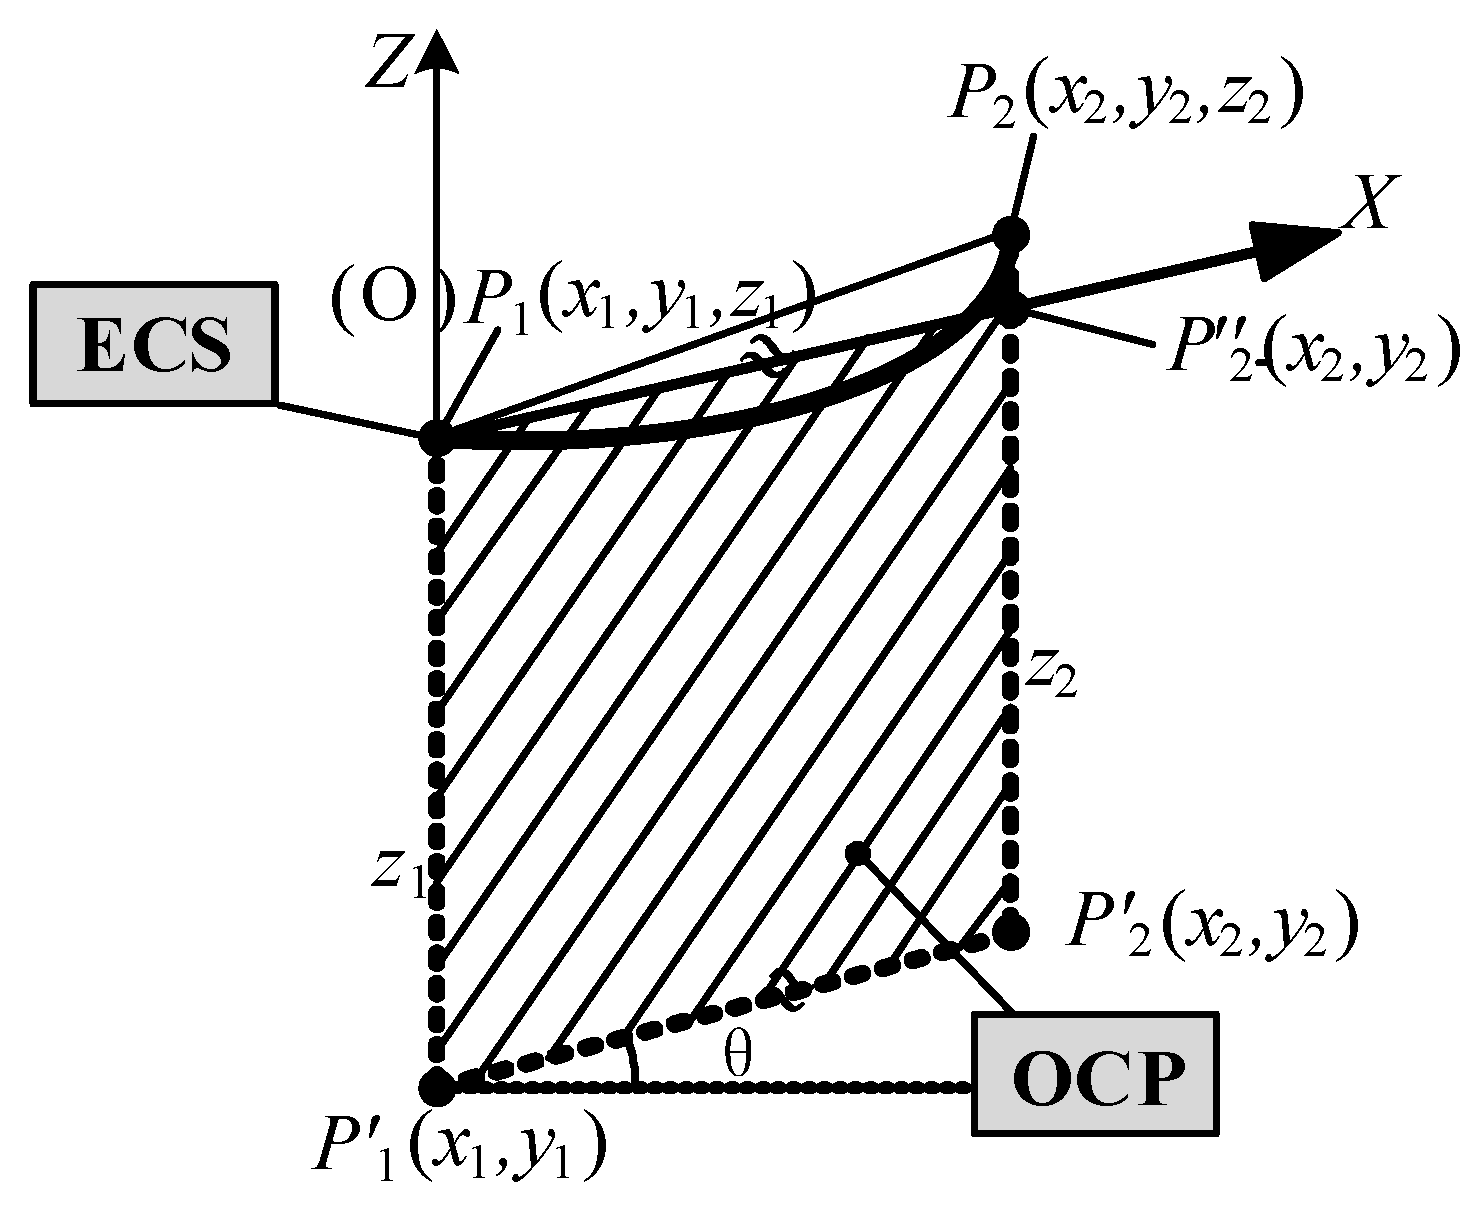
- (3)
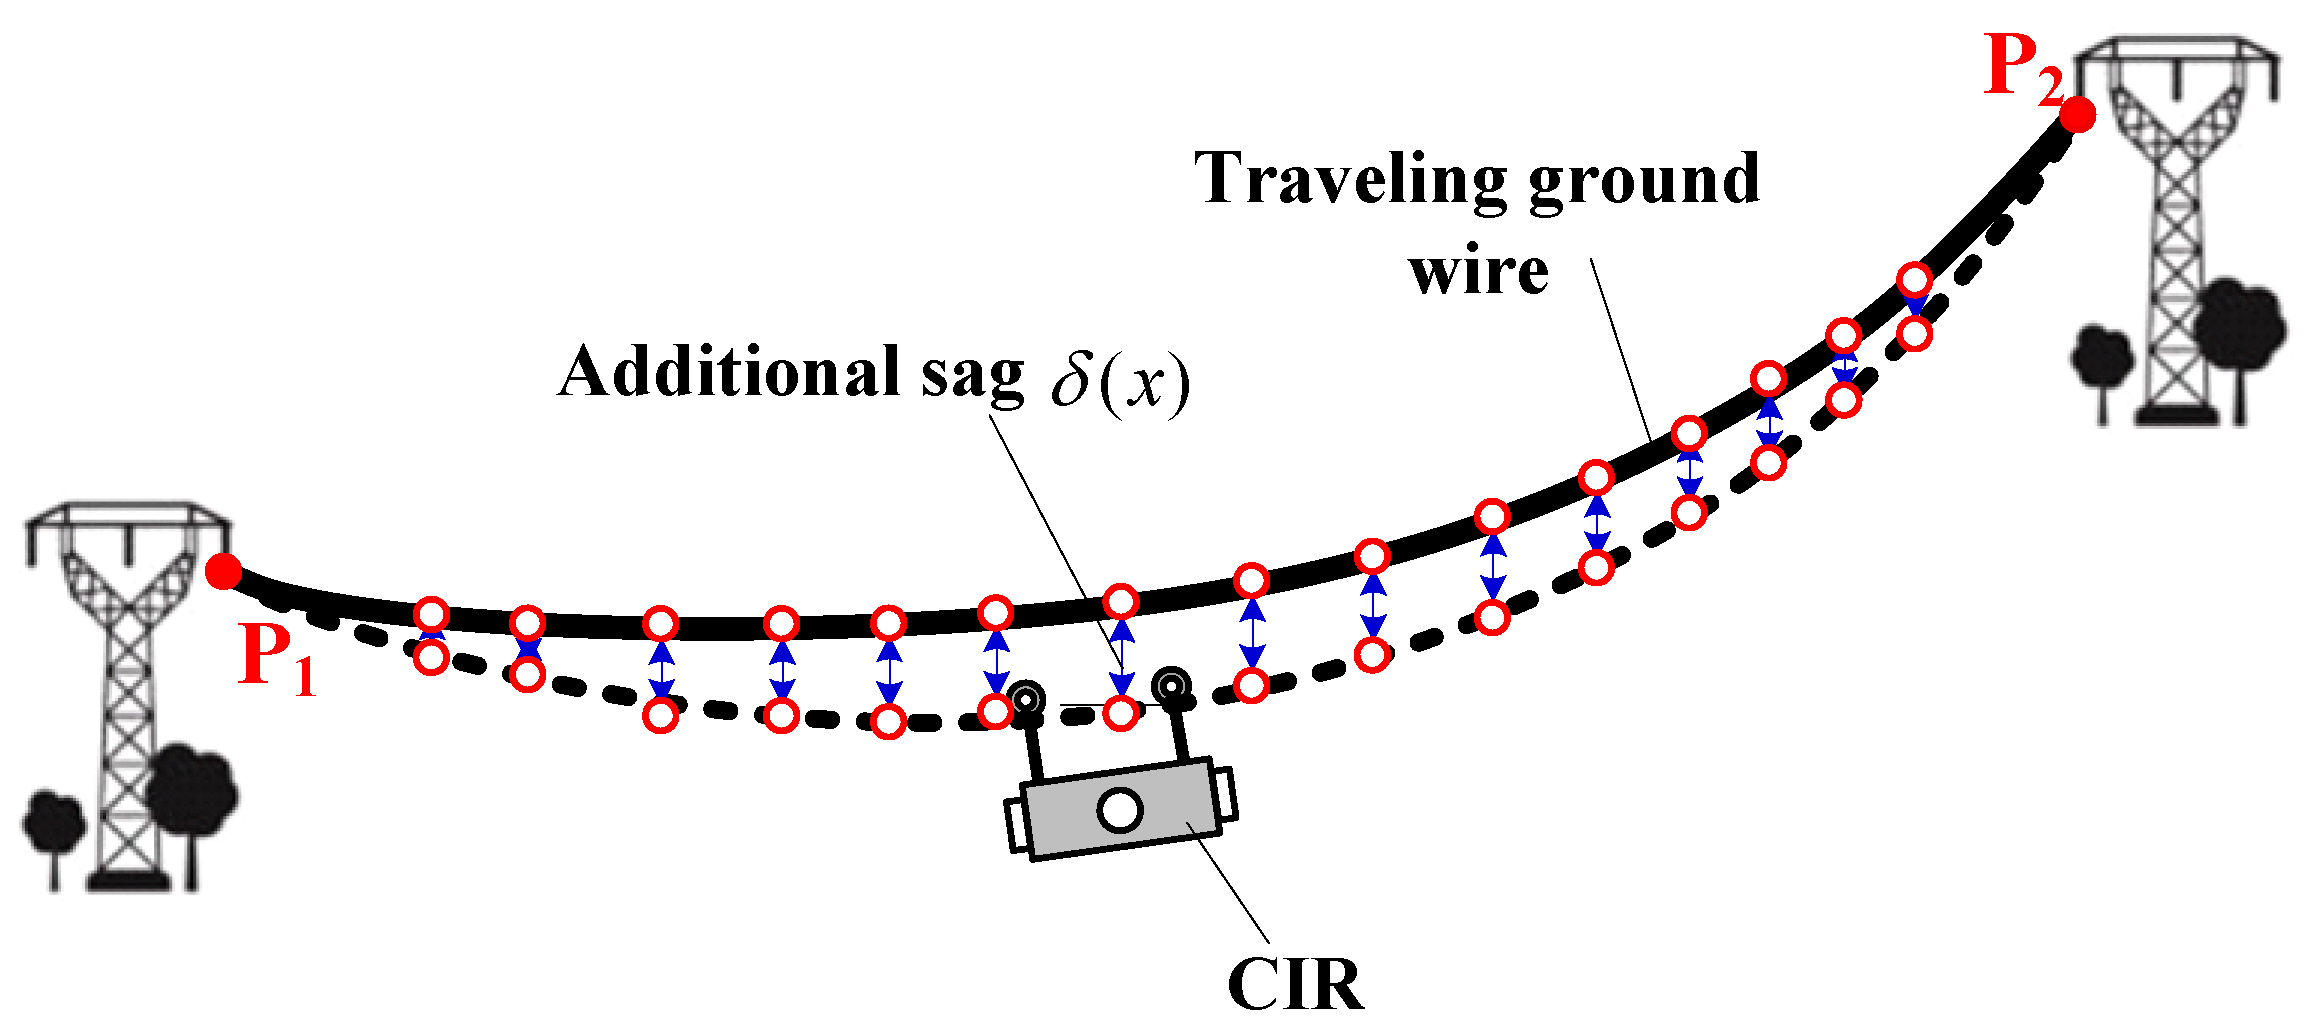
- POS-based structured partition. The filtered transmission line point cloud and POS data are projected to the optimal coordinate plane (OCP) by the coordinate transformation. Then, we establish the extraction model by fitting POS data. The ground wire is subject to additional sag due to the additional weight of CIR, as illustrated in Figure 4. The fitting POS-based model is revised with the additional sag function, [32]. Through the POS extraction model, transmission line point clouds are divided into single lines in a span segment, at the same time retaining waiting inspection target point clouds around the line.
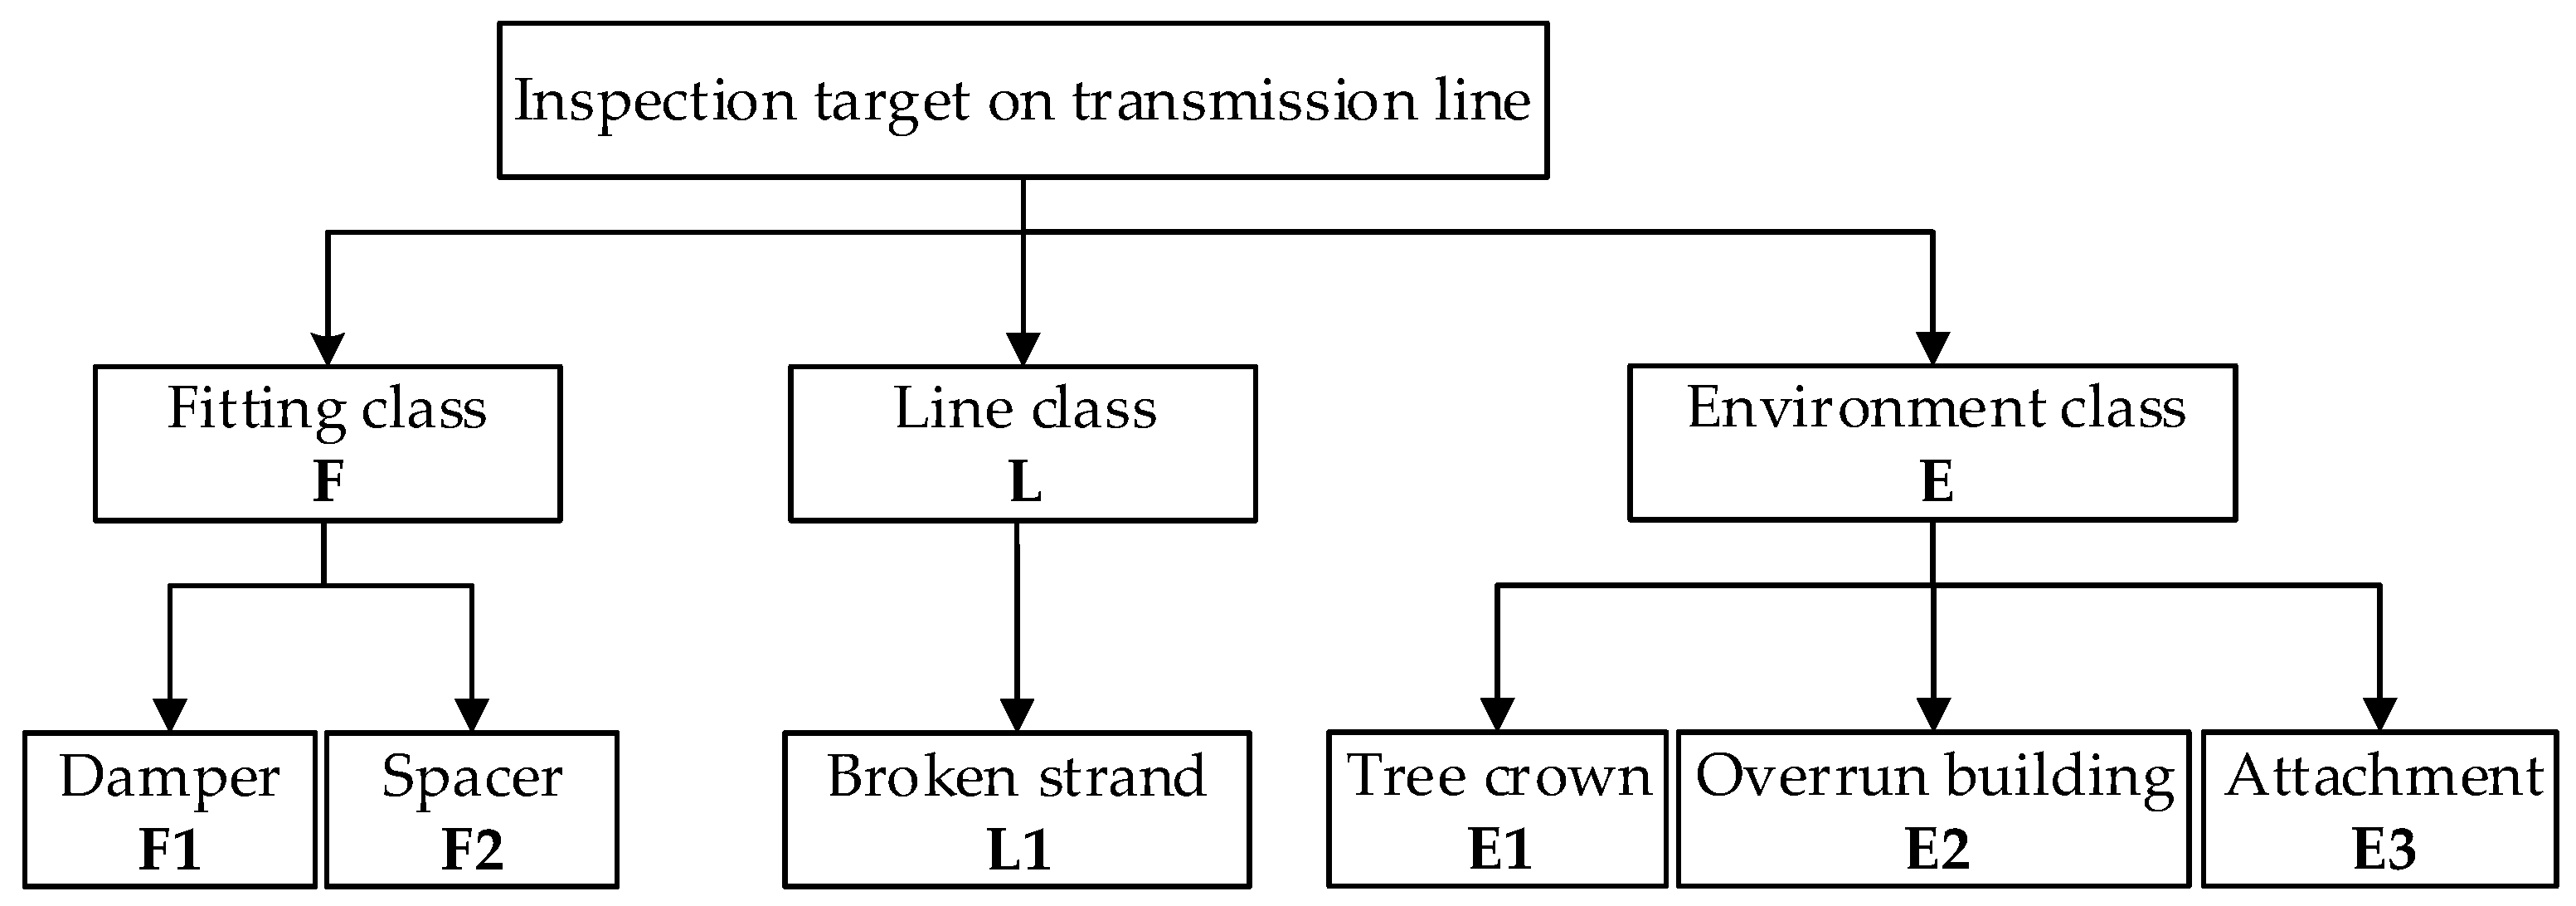
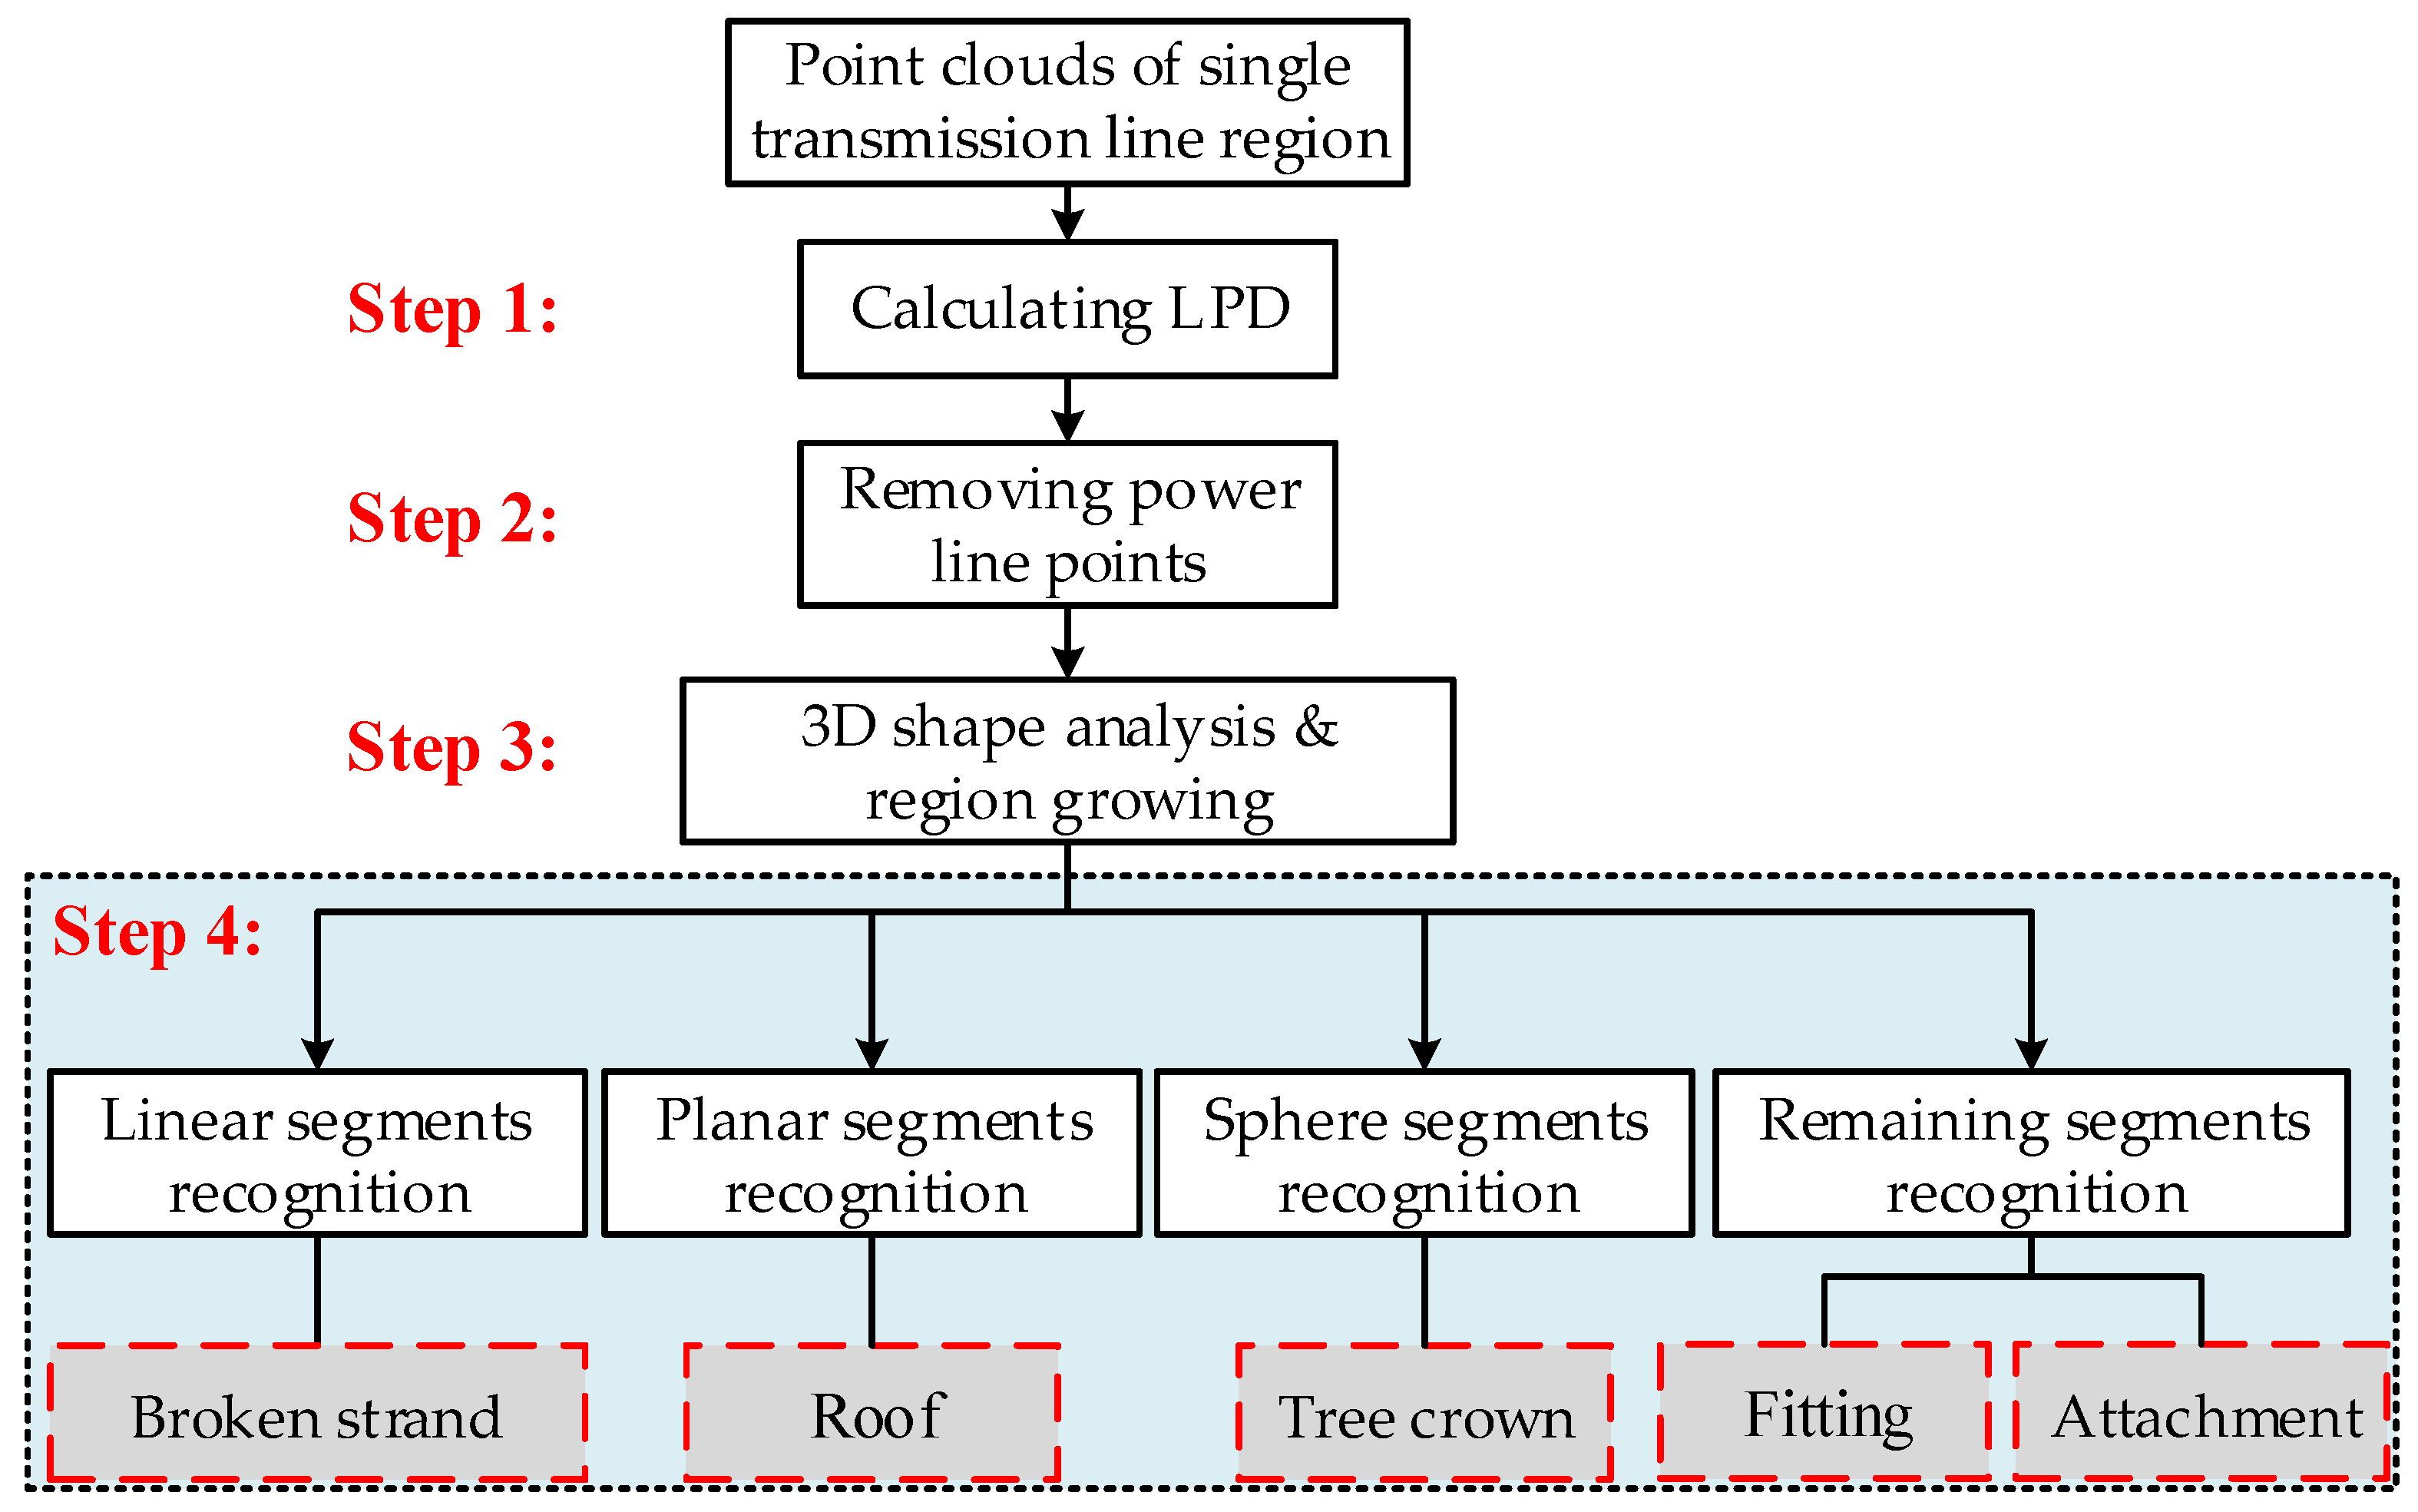
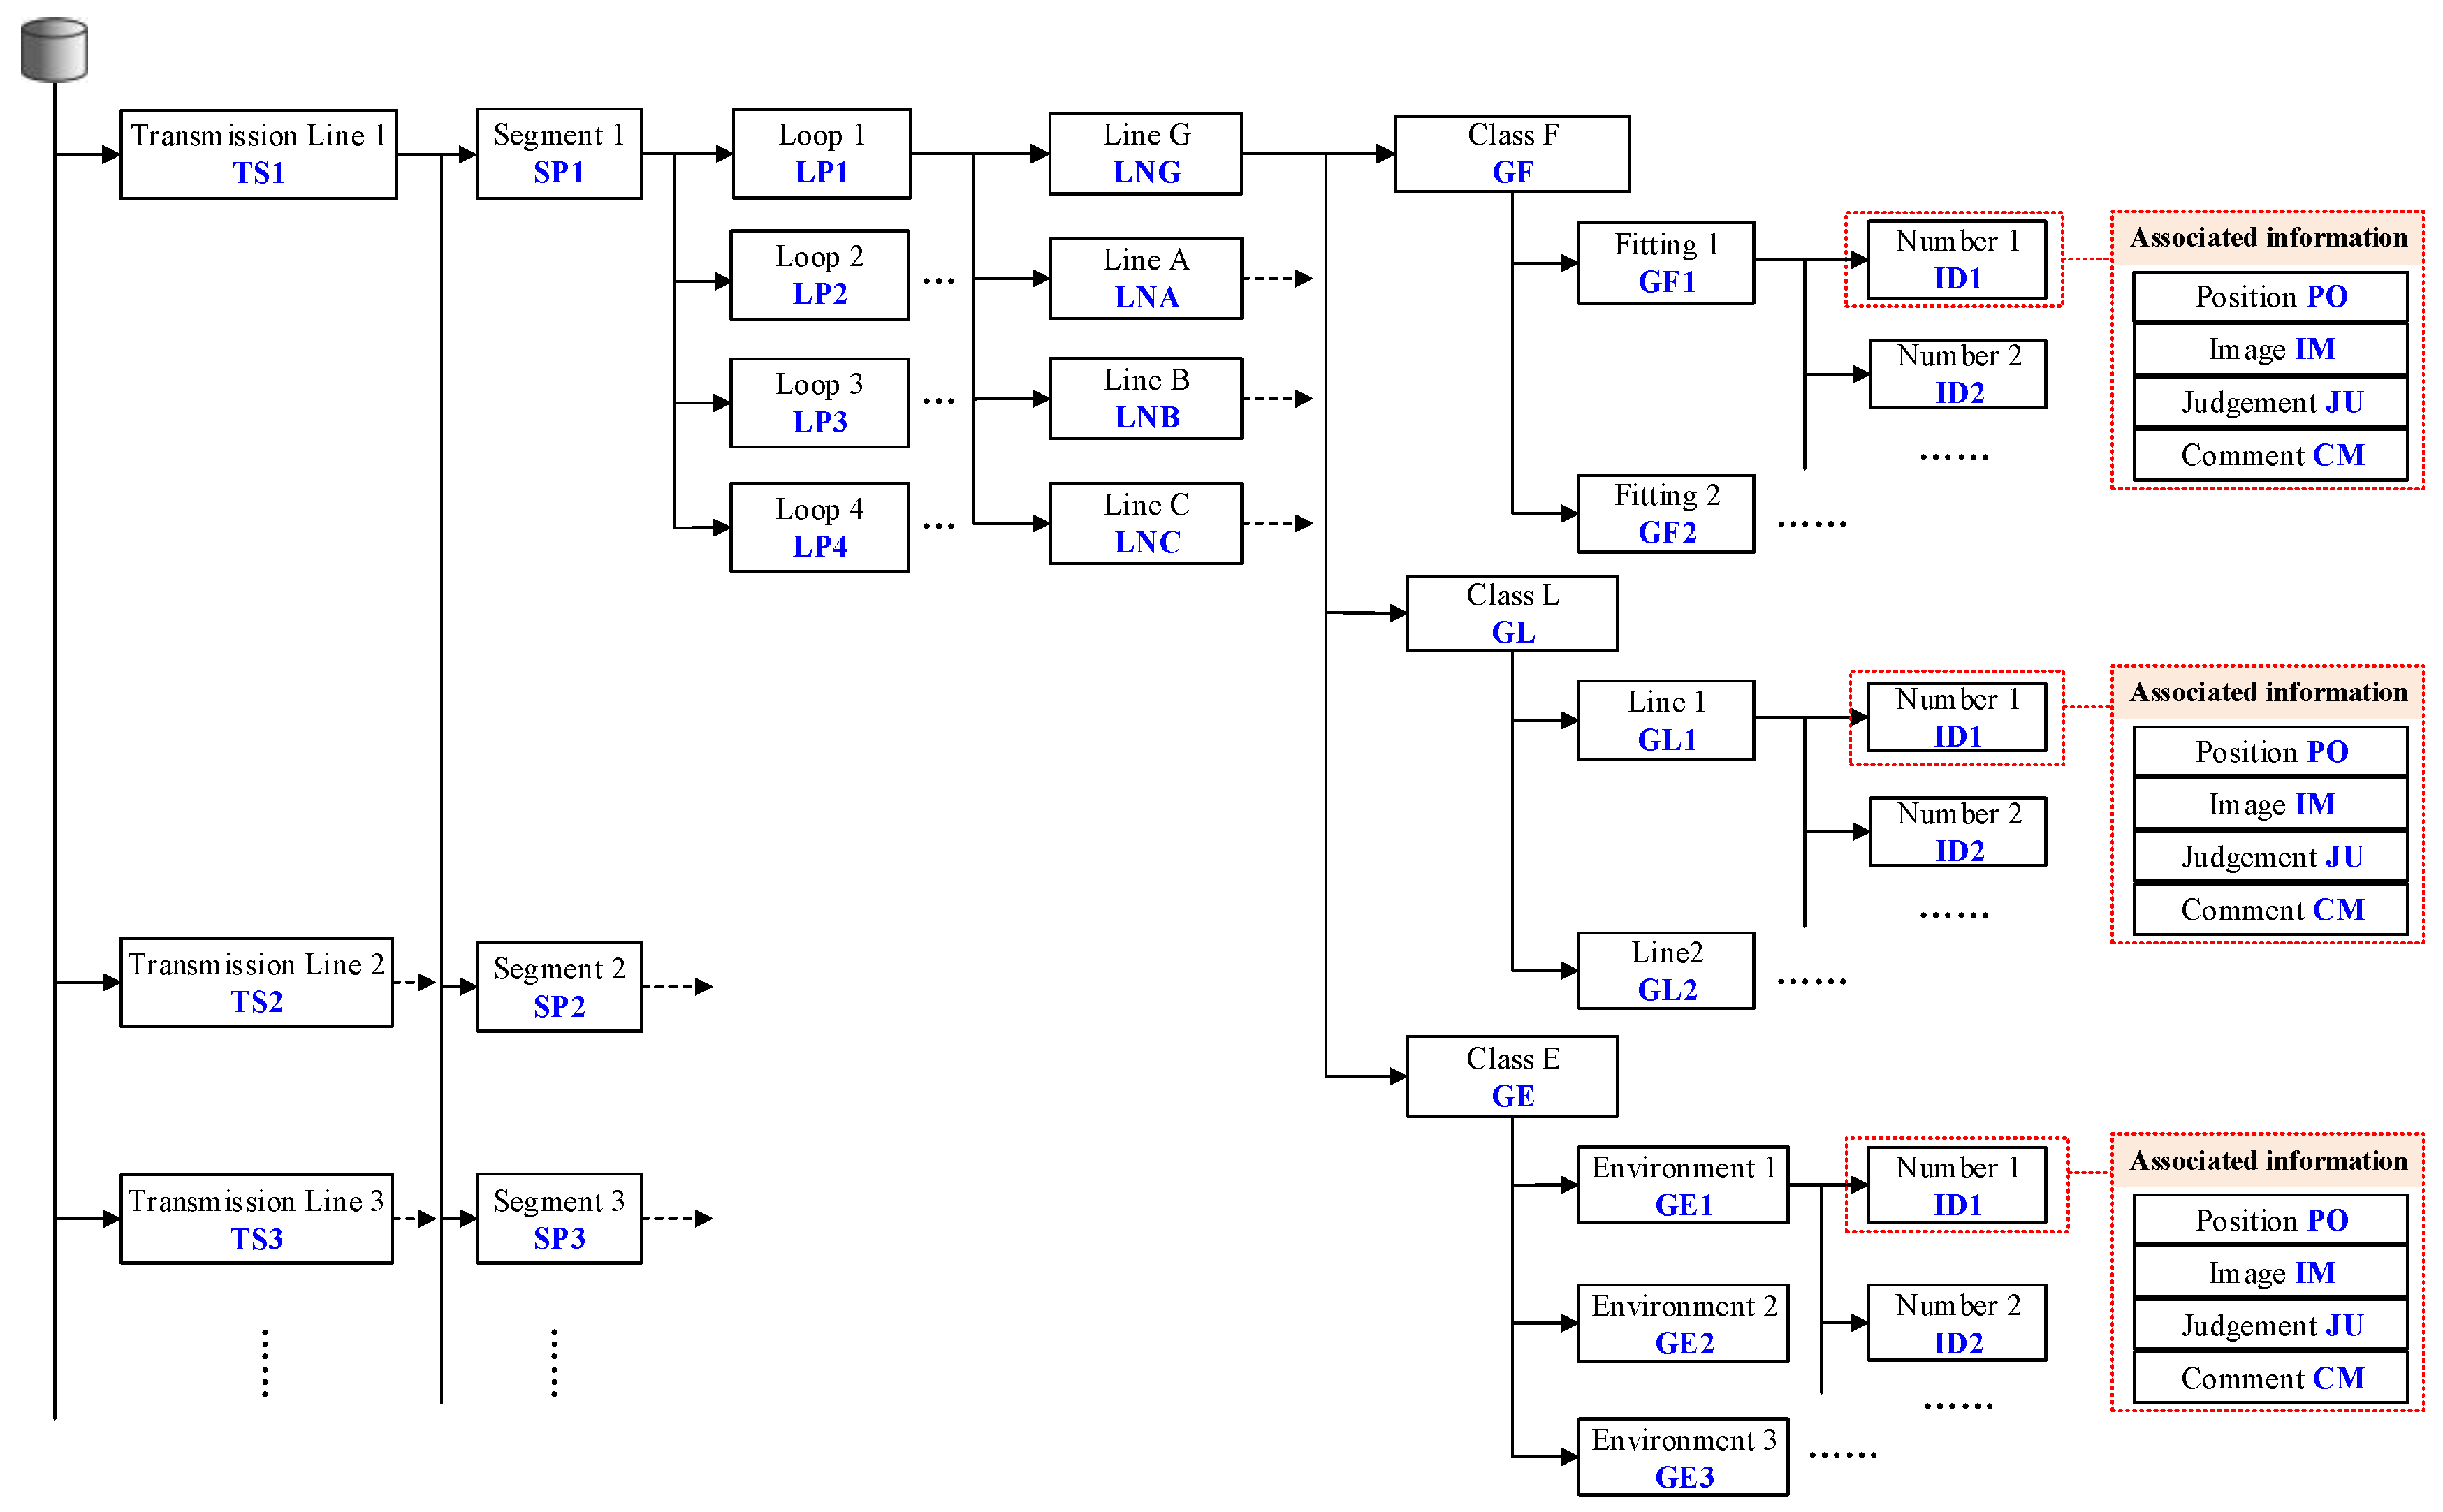
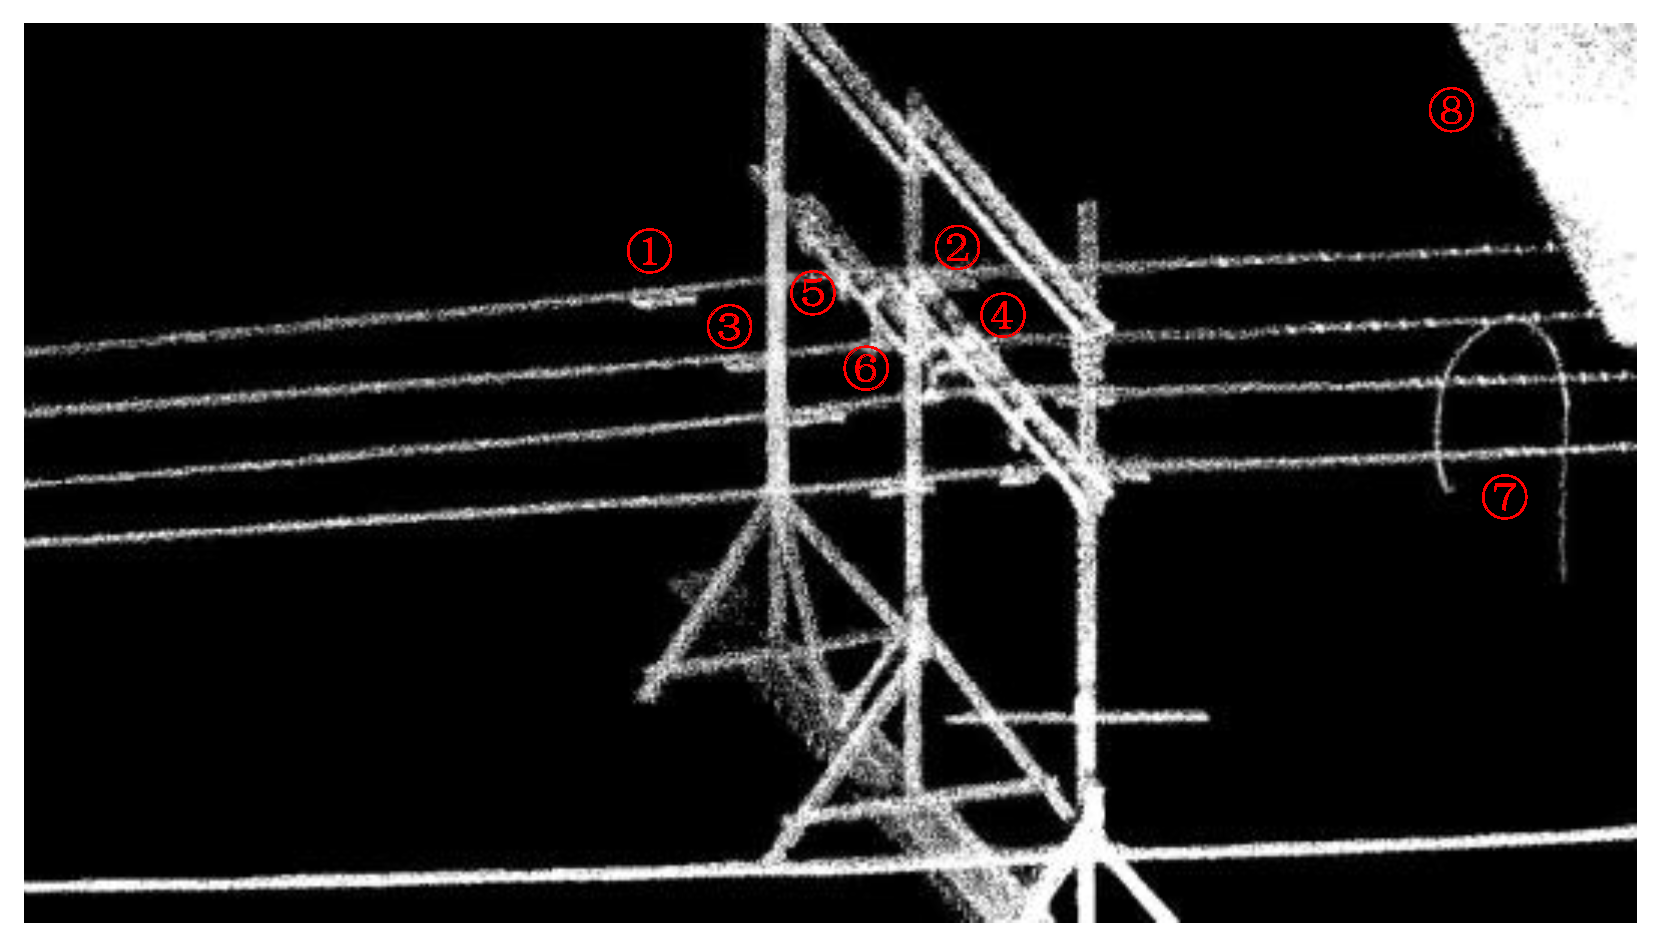
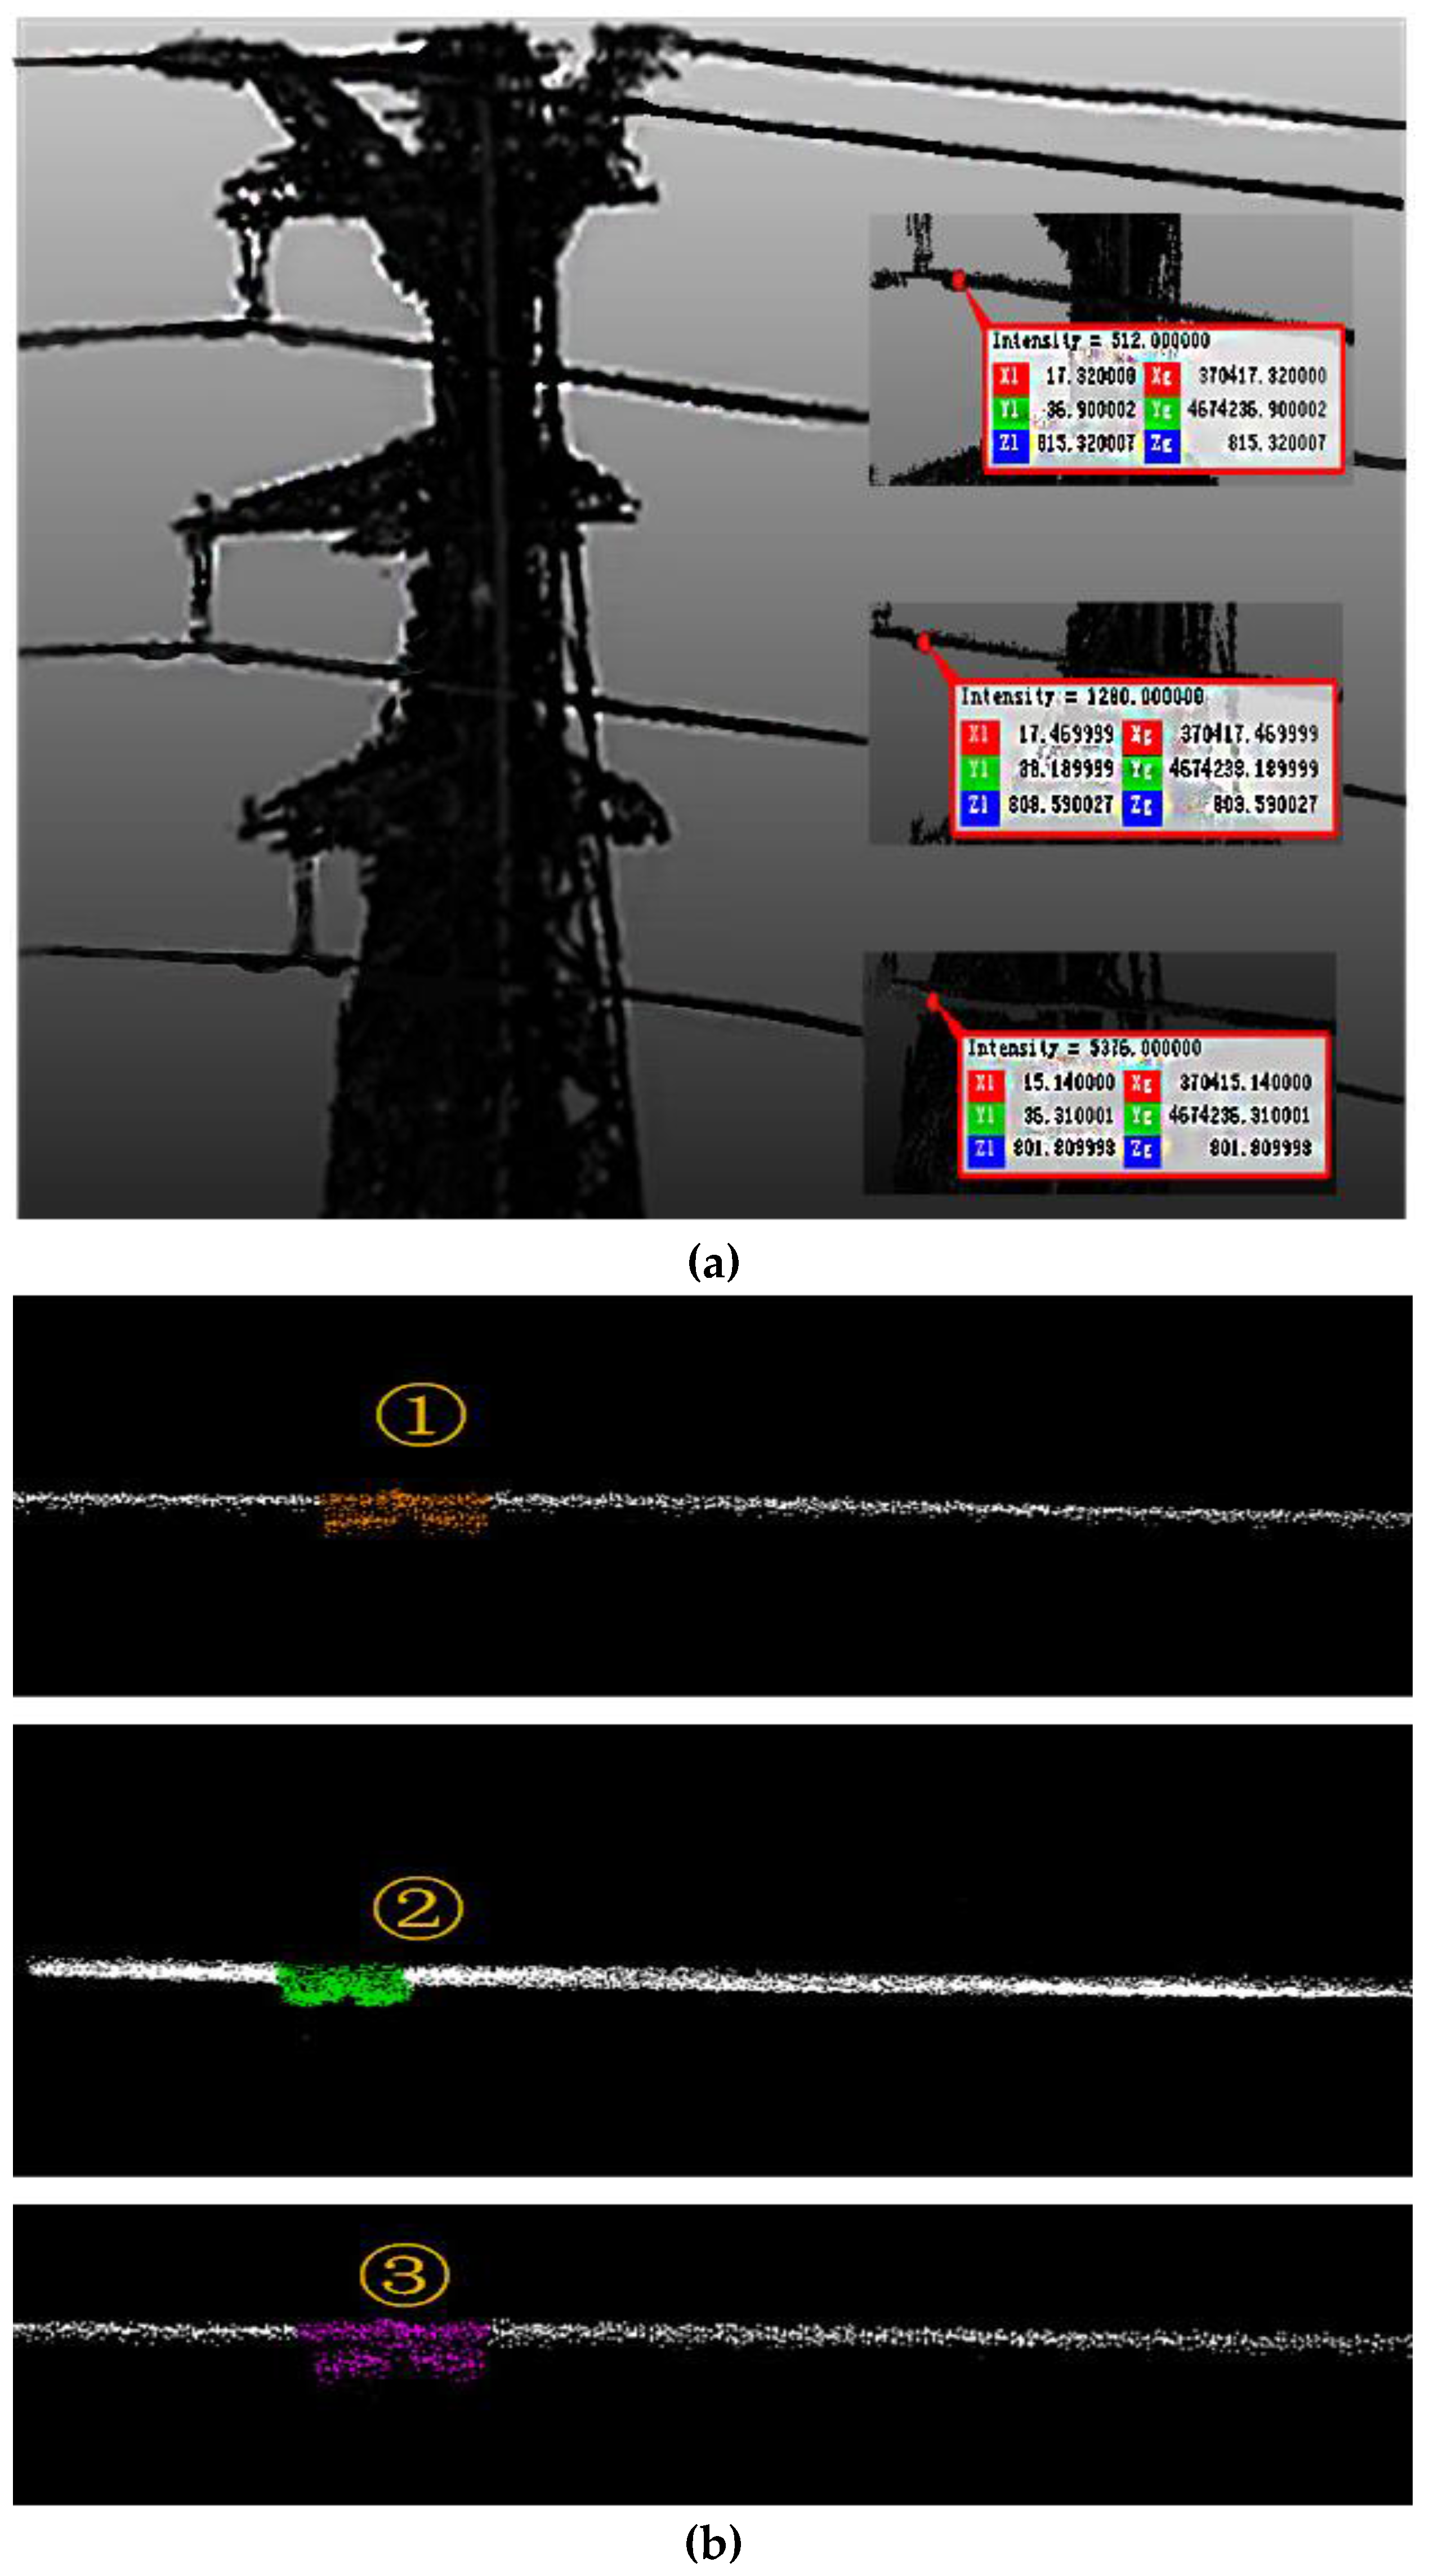
3.1.2. Target Identification and Positioning
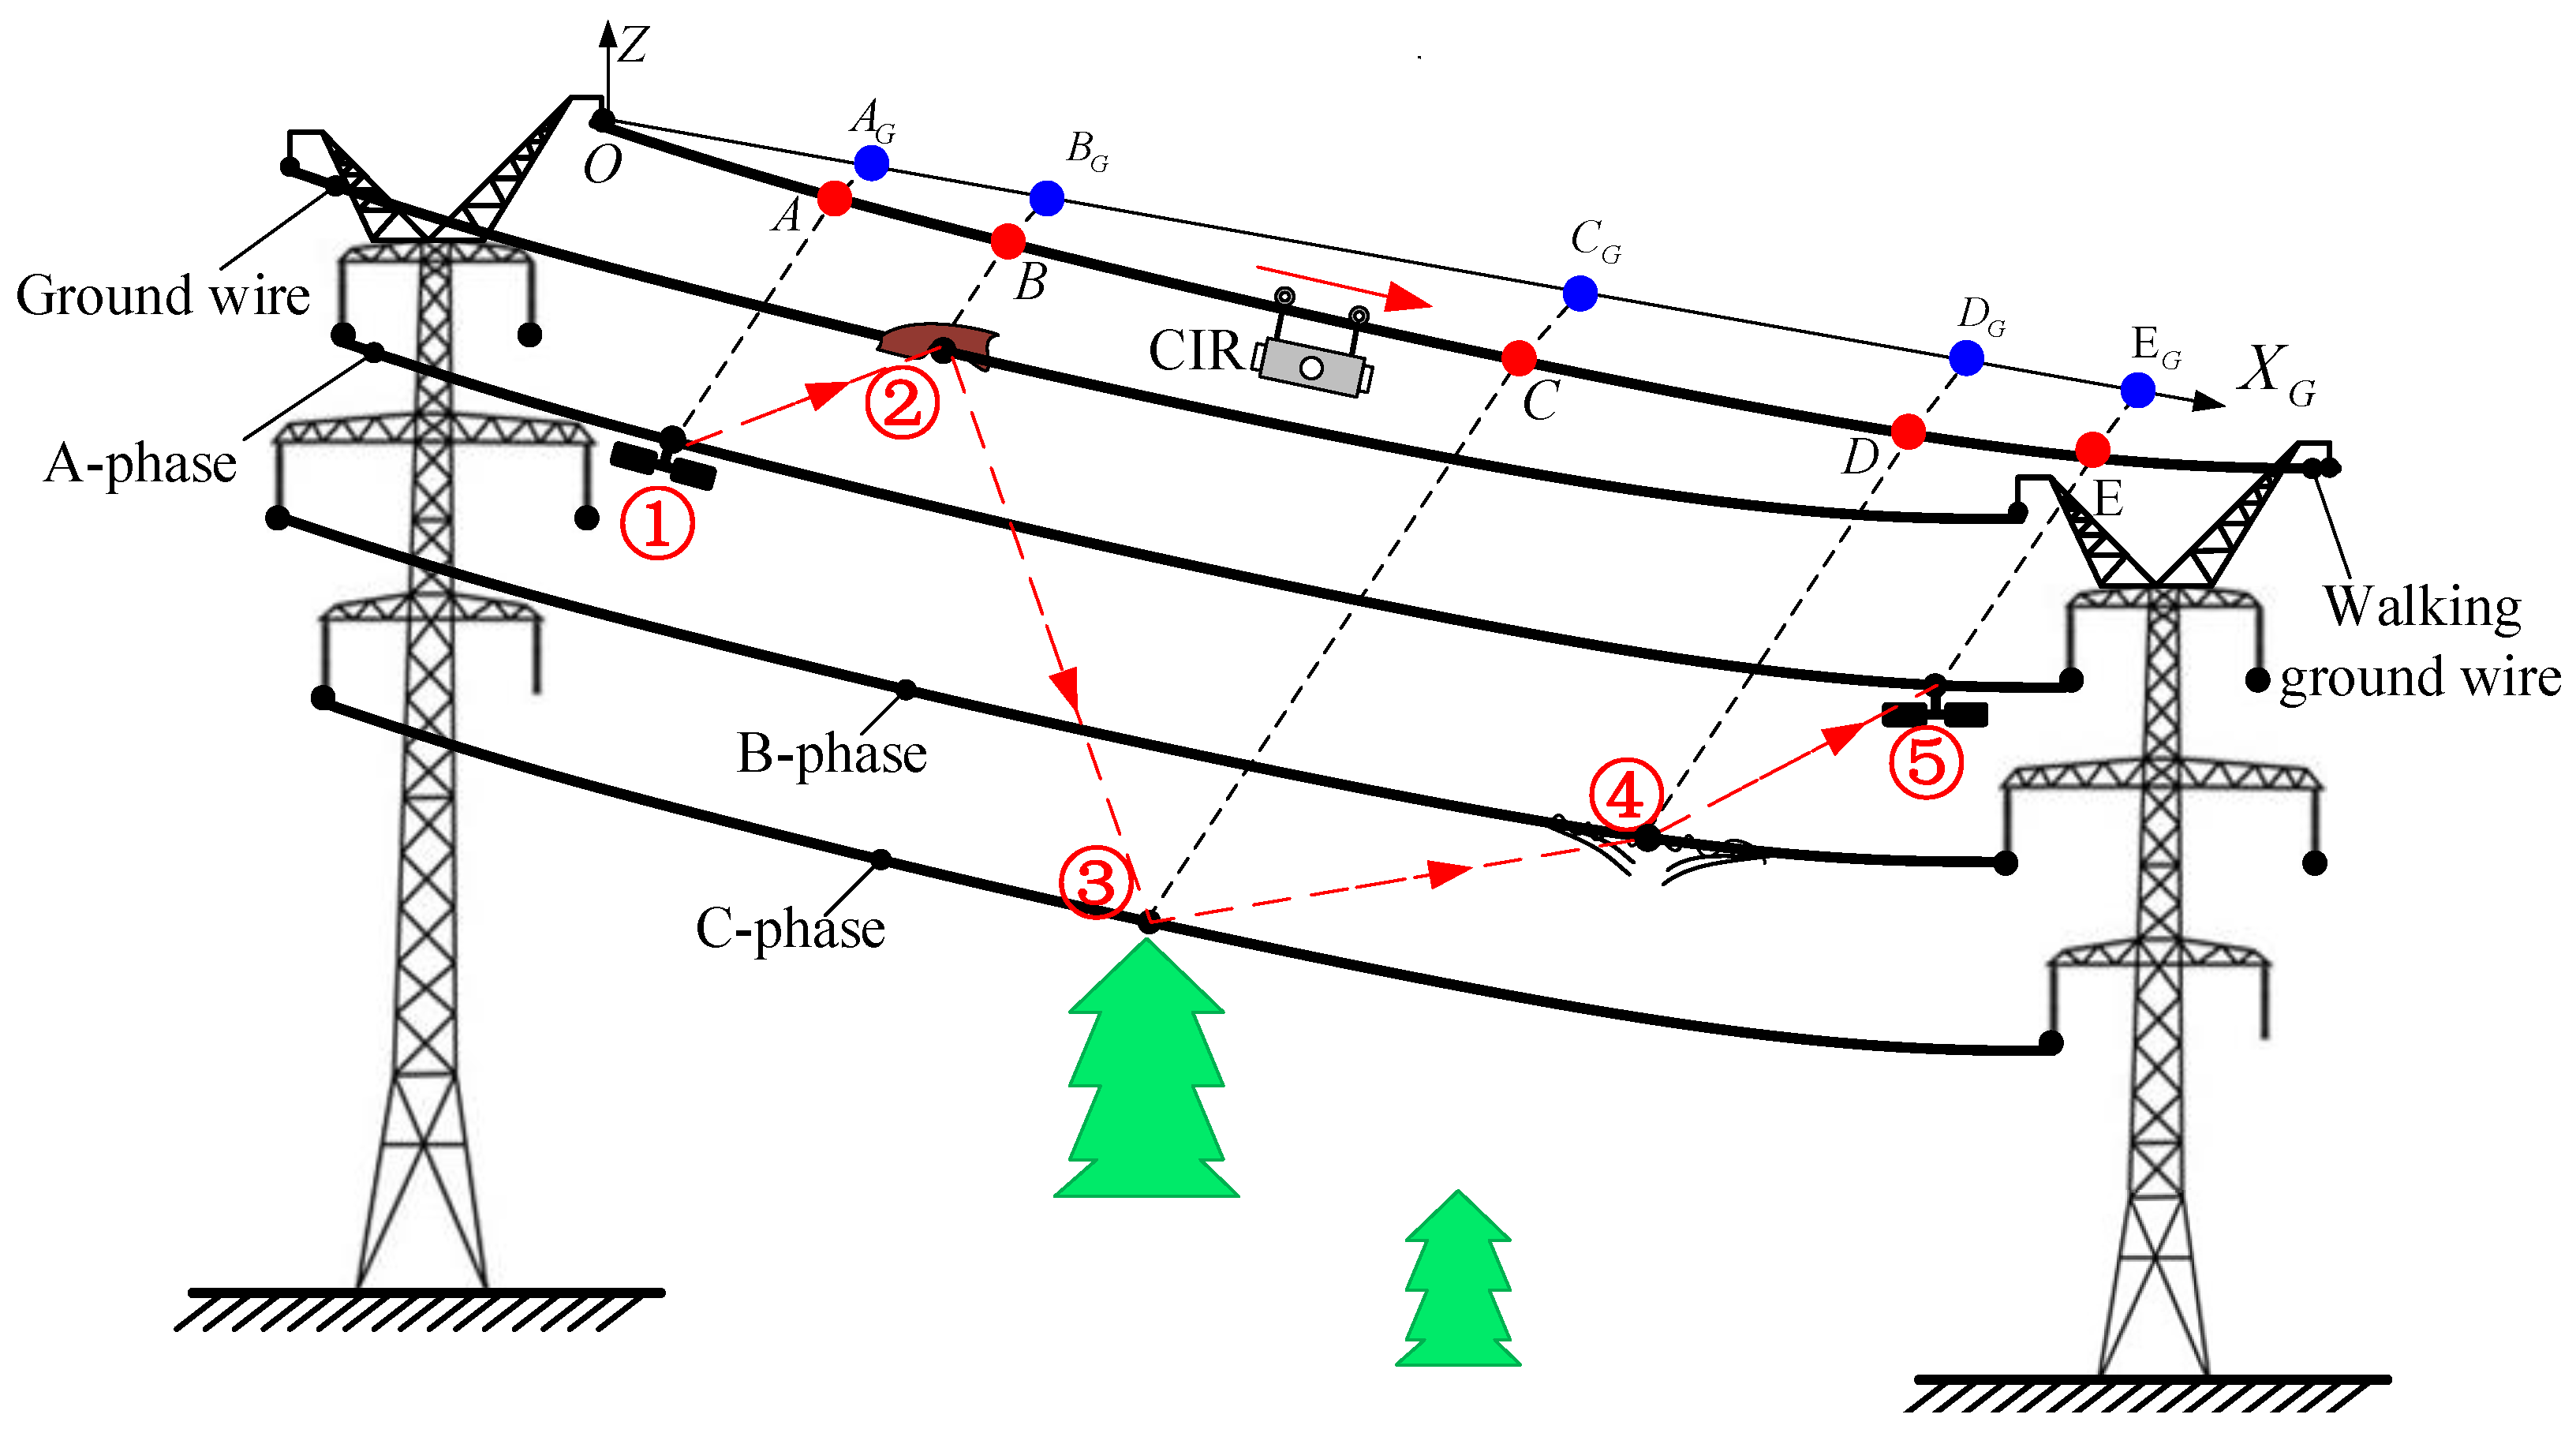
3.1.3. CIR Motion Trajectory Modeling
- How many waiting-inspection targets (refers to these inspection targets that need to be inspected again in the autonomous inspection) on transmission lines are there?
- Each waiting-inspection target belongs to one transmission line;
- The identification result and space position of each inspection target;
- The trajectory model of the ground wire.
3.2. Autonomous Inspection
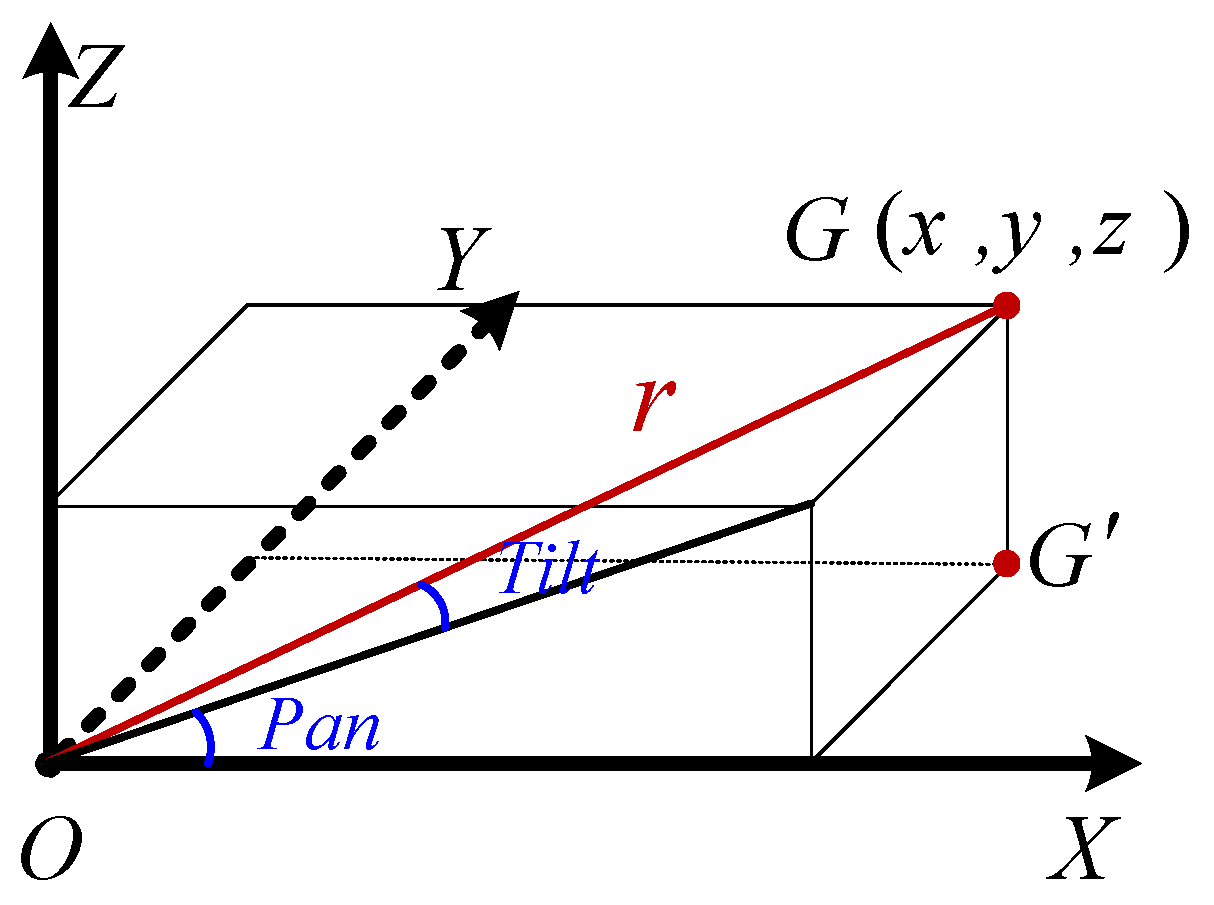
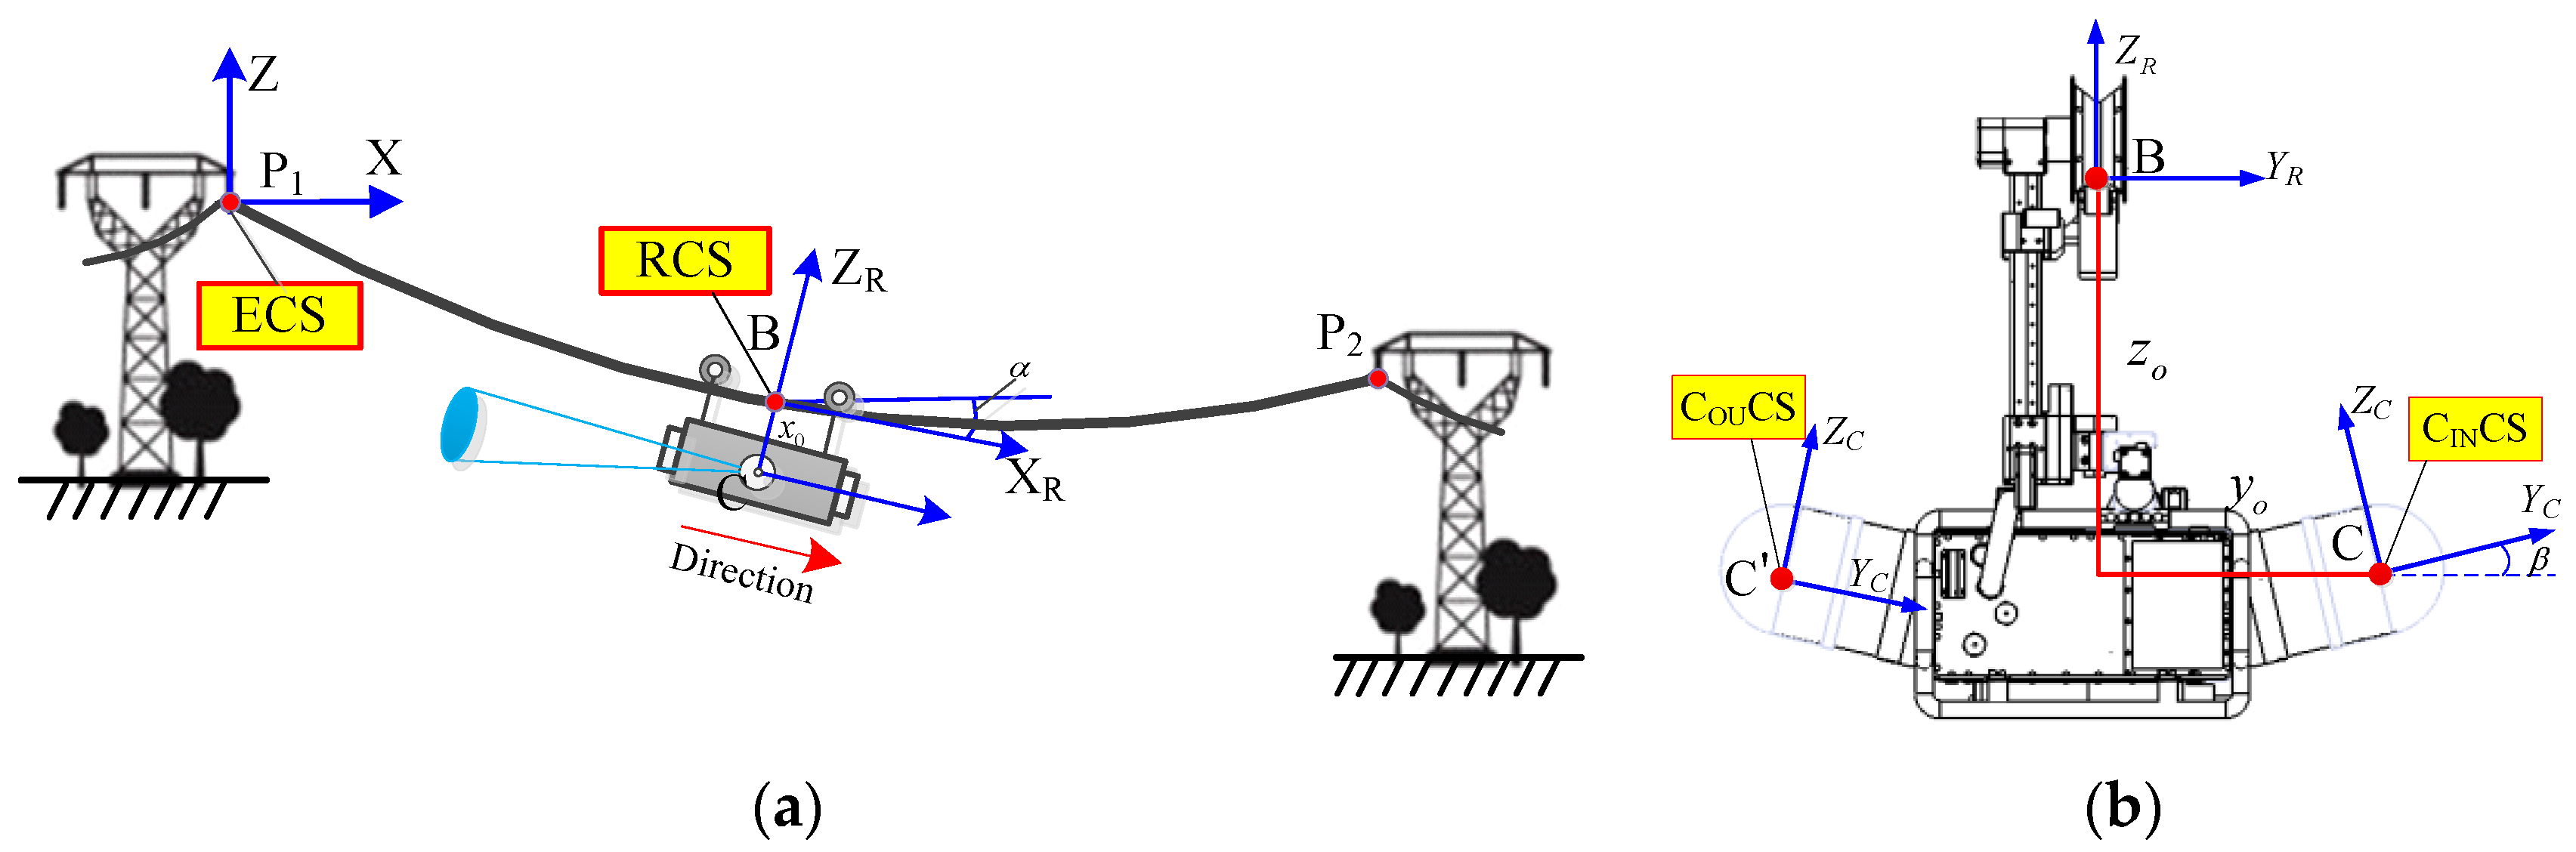
3.2.1. Coordinate System Modeling
3.2.2. Autonomous Inspection Planning
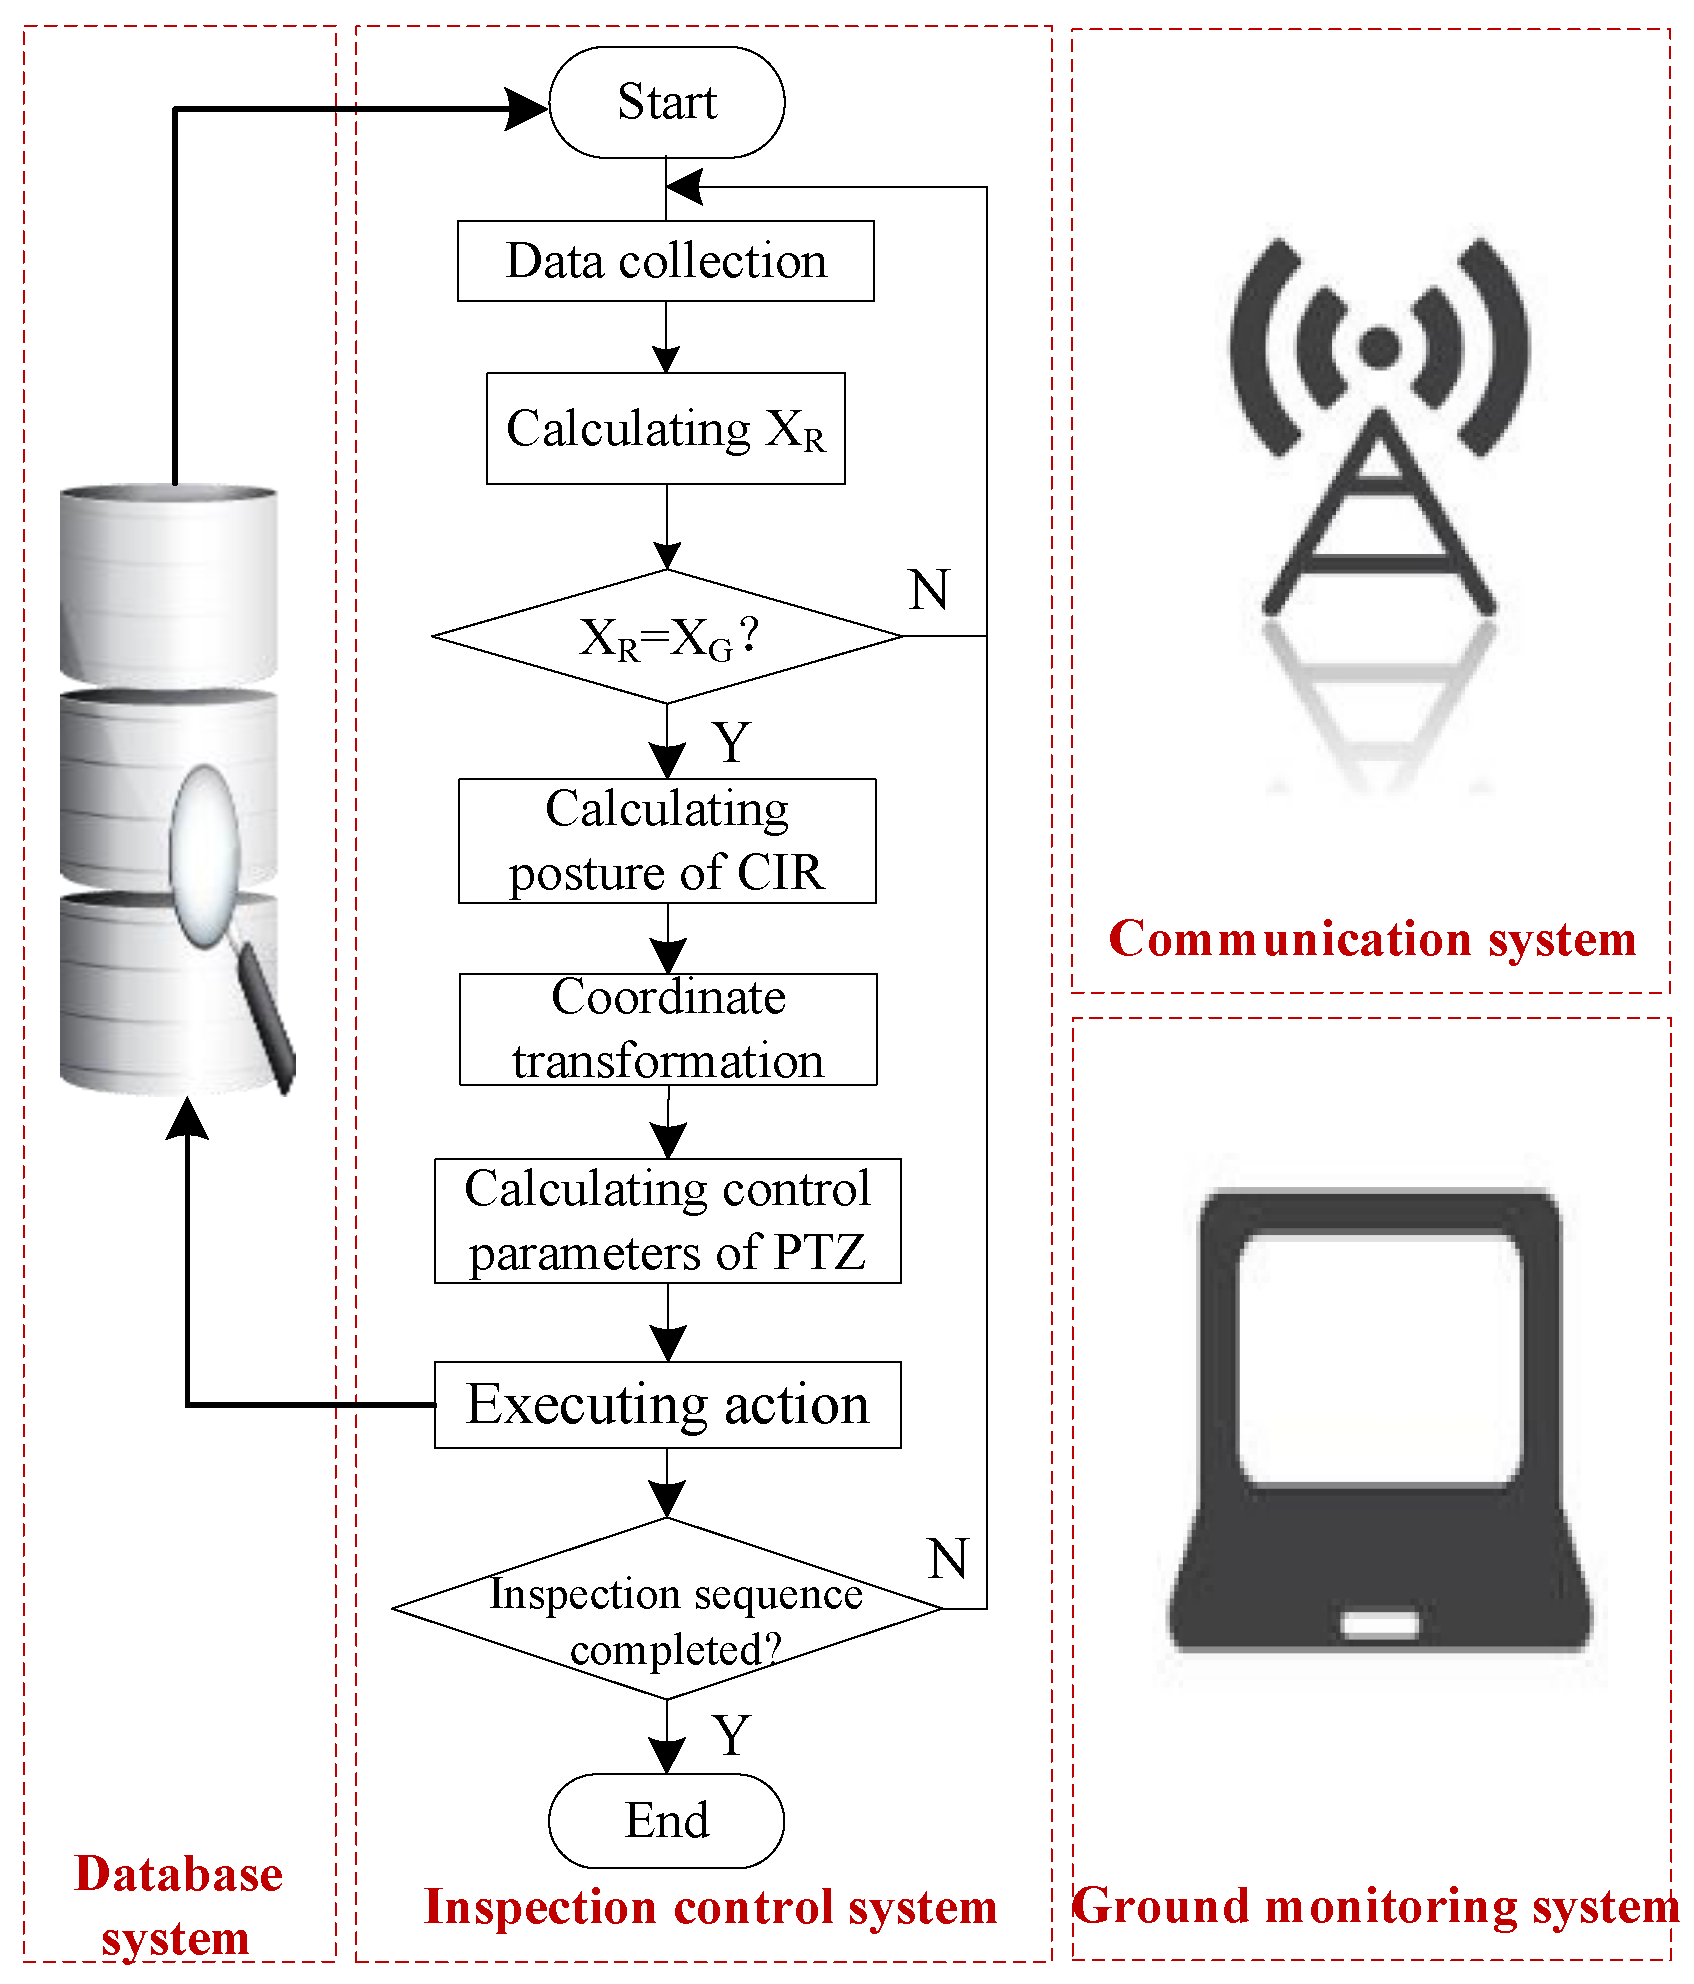
3.2.3. Autonomous Inspection Procedure
4. Results
4.1. Test Site Experiment
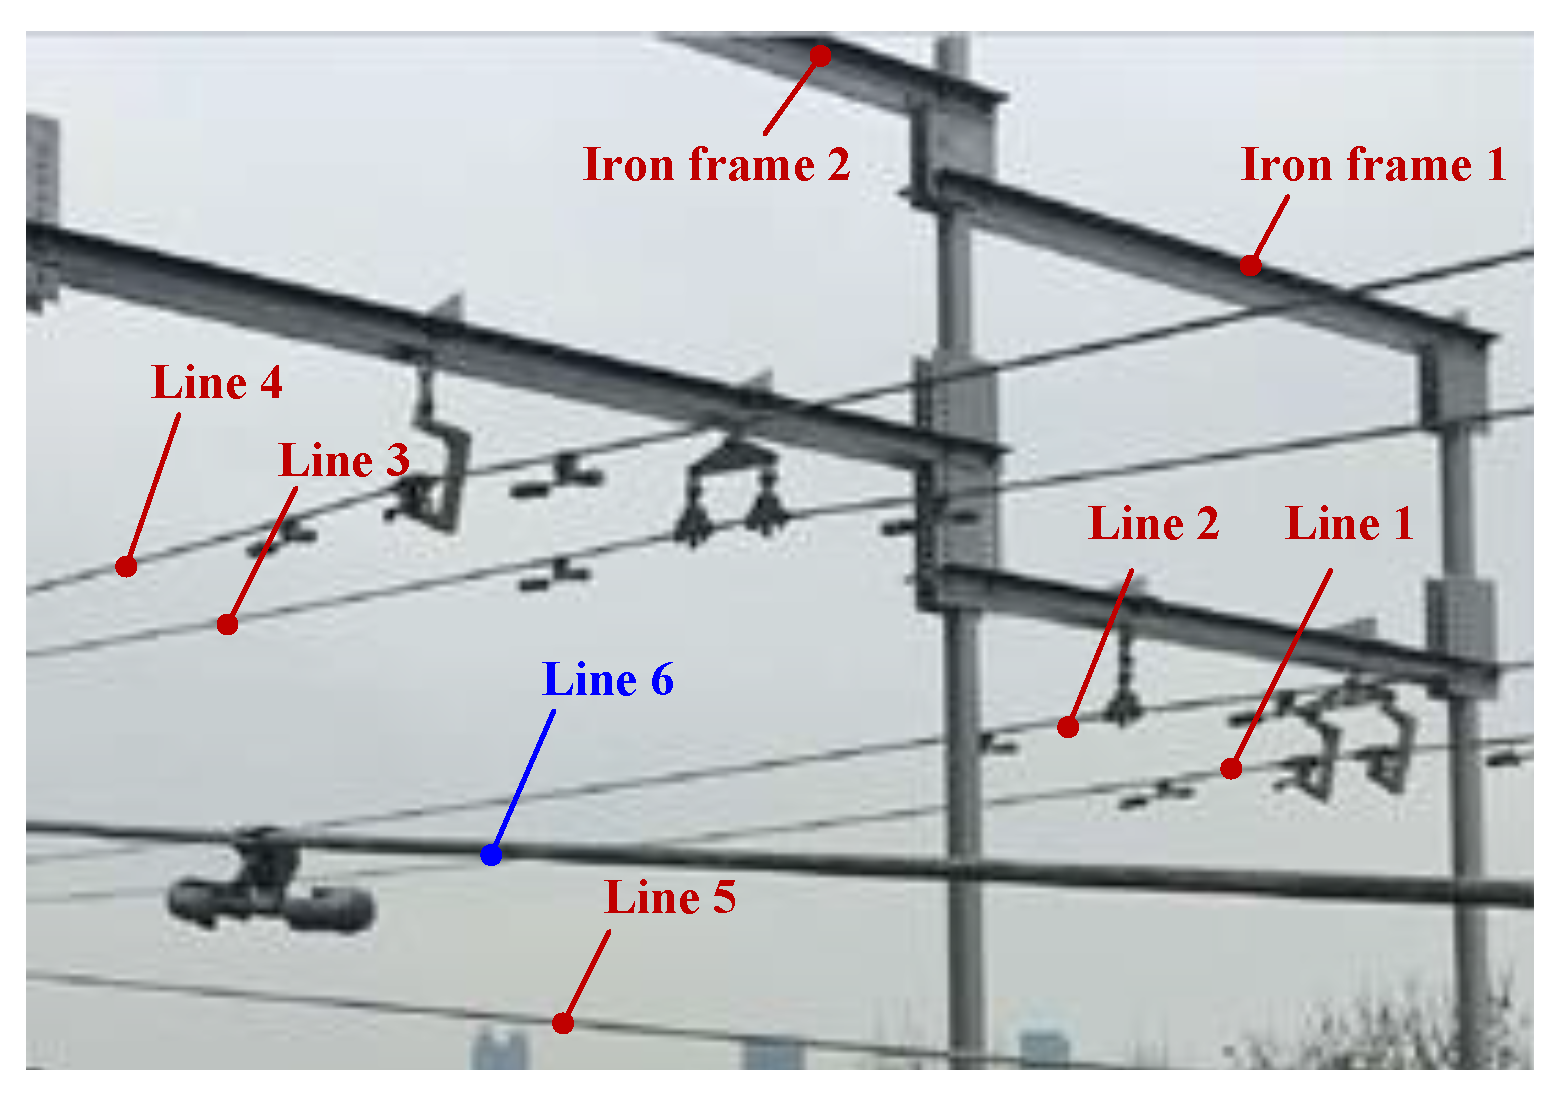
4.2. Actual Line Experiment
5. Discussion
6. Conclusions
- (1)
- CIR can become a new type of carrying platform to collect LiDAR data. Because CIR always moves along the ground wire, the POS data can be used to deal with a transmission line point cloud and build up a CIR motion trajectory model. In addition, CIR can closely scan transmission line corridors, so the point cloud is very dense. The abnormal points can be clearly presented in the transmission line point cloud.
- (2)
- The proposed method mainly includes two inspection steps. The preliminary inspection can find the abnormal points through point cloud distribution, and use a hierarchical classification strategy to determine their classes and 3D positions. The autonomous inspection can generate the inspection sequences according to the inspection target information obtained in preliminary inspection, operate CIR to reach the specified points in accordance with inspection planning, and take images of the inspection targets with the PTZ cameras. Therefore, in the post-processing phase, it is no longer necessary to extract useful information from the many inspection images or videos, but only to make a final judgement by contrasting images at specified points and preliminary inspection results. This method can effectively improve the intelligence level of the current transmission line inspection, greatly reducing manpower and improving inspection accuracy.
- (3)
- In test site experiments, we designed eight inspection targets including three classes of transmission line inspection. Experimental results show that CIR can move to the specified set points in turn and take clear images to assist the artificial judgement for the wrong classifications or hard identifications, which verifies the effectiveness of the proposed method. Actual line experiments prove that the autonomous inspection system can collect the required data. CIR can inspect the three dampers in the span segment and transfer the PTZ cameras to take images, which verifies the feasibility of the proposed method.
Acknowledgments
Author Contributions
Conflicts of Interest
References
- Aggarwal, R.K.; Johns, A.T.; Jayasinghe, J.A.S.B.; Su, W. An overview of the condition monitoring of overhead lines. Electr. Power Syst. Res. 2000, 53, 15–22. [Google Scholar] [CrossRef]
- Qin, Y.; Xiao, X.; Dong, J.; Zhang, G.; Shimada, M.; Liu, J.; Li, C.; Kou, W.; Moore, B., III. Forest cover maps of China in 2010 from multiple approaches and data sources: PALSAR, Landsat, MODIS, FRA, and NFI. ISPRS J. Photogramm. Remote Sens. 2015, 109, 1–16. [Google Scholar] [CrossRef]
- Mazur, K.; Wydra, M.; Ksiezopolski, B. Secure and Time-Aware Communication of Wireless Sensors Monitoring Overhead Transmission Lines. Sensors 2017, 17, 1610. [Google Scholar] [CrossRef] [PubMed]
- Miller, R.; Abbasi, F.; Mohammadpour, J. Power line robotic device for overhead line inspection and maintenance. Ind. Robot 2017, 44, 75–84. [Google Scholar] [CrossRef]
- Wanik, D.W.; Parent, J.R.; Anagnostou, E.N.; Hartman, B.M. Using vegetation management and LiDAR-derived tree height data to improve outage predictions for electric utilities. Electr. Power Syst. Res. 2017, 146, 236–245. [Google Scholar] [CrossRef]
- Sun, C.; Jones, R.; Talbot, H.; Wu, X.; Cheong, K.; Richard, B.; Michael, B.; Mark, B. Measuring the distance of vegetation from powerlines using stereo vision. ISPRS J. Photogramm. Remote Sens. 2006, 60, 269–283. [Google Scholar] [CrossRef]
- Ahmad, J.; Malik, A.S.; Xia, L.; Ashikin, N. Vegetation encroachment monitoring for transmission lines right-of-ways: A survey. Electr. Power Syst. Res. 2013, 95, 339–352. [Google Scholar] [CrossRef]
- Huang, J.; Xu, J.; Meng, L. The Comprehensive Benefit Evaluation Model of Manual Inspection in Transmission Line. In Proceedings of the 6th International Conference on Electronic, Mechanical, Information and Management Society, Shenyang, China, 1–3 April 2016; pp. 1541–1548. [Google Scholar]
- Ou, T.; Geng, X.; Yang, B. Application of vehicle-borne data acquisition system to power line detection. J. Geod. Geodyn. 2009, 29, 149–151. [Google Scholar]
- Zhang, Y.; Yuan, X.; Li, W. Automatic Power Line Inspection Using UAV Images. Remote Sens. 2017, 9, 824. [Google Scholar] [CrossRef]
- Katrasnik, J.; Pernus, F.; Likar, B. A Survey of Mobile Robots for Distribution Power Line Inspection. IEEE Trans. Power Deliv. 2010, 25, 485–493. [Google Scholar] [CrossRef]
- Khawaja, A.; Huang, Q.; Khan, Z. Monitoring of Overhead Transmission Lines: A Review from the Perspective of Contactless Technologies. Sens. Imaging 2017, 18, 24. [Google Scholar] [CrossRef]
- Jaakkola, A.; Hyyppä, J.; Kukko, A.; Yu, X.; Kaartinen, H.; Lehtomäki, M.; Lin, Y. A low-cost multi-sensoral mobile mapping system and its feasibility for tree measurements. ISPRS J. Photogramm. Remote Sens. 2010, 65, 514–522. [Google Scholar] [CrossRef]
- Graham, L. Mobile mapping systems overview. Photogramm. Eng. Remote Sens. 2010, 76, 222–228. [Google Scholar]
- Cheng, L.; Tong, L.; Wang, Y.; Li, M. Extraction of Urban Power Lines from Vehicle-Borne LiDAR Data. Remote Sens. 2014, 6, 3302–3320. [Google Scholar] [CrossRef]
- Zhang, X.; Chen, G.; Long, W.; Cheng, Z.; Zhang, K. Current status and prospects of helicopter power line inspection tour with LiDAR. Electr. Power Constr. 2008, 29, 40–43. [Google Scholar]
- Yu, D.; Wu, Y.; Chen, F. Application of helicopter patrol technology in UHV AC transmission line. Power Syst. Technol. 2010, 34, 29–32. [Google Scholar]
- Zhang, Y.; Yuan, X.; Fang, Y. UAV Low Altitude Photogrammetry for Power Line Inspection. ISPRS Int. J. Geo-Inf. 2017, 6, 14. [Google Scholar] [CrossRef]
- Jiang, S.; Jiang, W.; Huang, W. UAV-Based Oblique Photogrammetry for Outdoor Data Acquisition and Offsite Visual Inspection of Transmission Line. Remote Sens. 2017, 9, 278. [Google Scholar] [CrossRef]
- Liu, P.; Yuan, X.; Chen, A.Y.; Huang, Y. A review of rotorcraft Unmanned Aerial Vehicle (UAV) developments and applications in civil engineering. Smart Struct. Syst. 2014, 13, 1065–1094. [Google Scholar] [CrossRef]
- Wang, S.; Yang, E.; Wang, X.; Huang, Y. Development of a Novel Live-Line Inspection Robot System for Post Insulators at 220-kV Substations. Adv. Robot. 2010, 24, 559–583. [Google Scholar] [CrossRef]
- Zhang, Y.; Liang, Z.; Tan, M. Mobile Robot for Overhead Power Line Inspection: A review. Robot 2004, 26, 467–473. [Google Scholar]
- Byambasuren, B.; Kim, D.; Oyun-Erdene, M. Inspection Robot Based Mobile Sensing and Power Line Tracking for Smart Grid. Sensors 2016, 16, 250. [Google Scholar] [CrossRef] [PubMed]
- Wang, W.; Wu, G.; Bai, Y. Hand-eye-vision based control for an inspection robot’s autonomous line grasping. J. Cent. South Univ. 2014, 21, 2216–2227. [Google Scholar] [CrossRef]
- Cao, H.; Wu, G.; Zheng, T. Obstacle detection and locating method of an autonomous inspection robot on high voltage transmission line. Eng. J. Wuhan Univ. 2012, 45, 229–234. [Google Scholar]
- Yue, X.; Wang, H.; Jiang, Y. A novel 110 kV power line inspection robot and its climbing ability analysis. Int. J. Adv. Robot. Syst. 2017, 14. [Google Scholar] [CrossRef]
- Mostashfi, A.; Fakhari, A.; Badri, M. A novel design of inspection robot for high-voltage power lines. Ind. Robot 2014, 41, 166–175. [Google Scholar] [CrossRef]
- Li, Z.; Ruan, Y. Autonomous Inspection Robot for Power Transmission Lines Maintenance While Operating on the Overhead Ground Wires. Int. J. Adv. Robot. Syst. 2010, 7, 107–112. [Google Scholar] [CrossRef]
- Peng, X.; Chen, C.; Rao, Z.; Yang, B.; Mai, X.; Wang, K. Safety Inspection and Intelligent Diagnosis of Transmission Line Based on Unmanned Helicopter of Multi Sensor Data Acquisition. High Volt. Eng. 2015, 41, 159–166. [Google Scholar]
- Arastounia, M.; Lichti, D. Automatic Object Extraction from Electrical Substation Point Clouds. Remote Sens. 2015, 7, 15605–15629. [Google Scholar] [CrossRef]
- Peng, X.; Qian, J.; Wu, G.; Mai, X. Full Automatic Inspection System and Its Demonstration Application Based on Robot for Overhead Transmission Lines. High Volt. Eng. 2017, 43, 2582–2591. [Google Scholar]
- Qin, X.; Wu, G.; Ye, X.; Huang, L.; Lei, J. A Novel Method to Reconstruct Overhead High-Voltage Power Lines Using Cable Inspection Robot LiDAR Data. Remote Sens. 2017, 9, 753. [Google Scholar] [CrossRef]
- Yang, B.; Dong, Z.; Wei, Z.; Fang, L.; Li, H. Extracting complex building facades from mobile laser scanning data. Acta Geod. Cartogr. Sin. 2013, 42, 411–417. [Google Scholar]
- Lalonde, J.F.; Vandapel, N.; Huber, D.F.; Hebert, M. Natural terrain classification using three-dimensional ladar data for ground robot mobility. J. Field Robot. 2006, 23, 839–861. [Google Scholar] [CrossRef]
- Yang, B.; Dong, Z.; Zhao, G.; Dai, W. Hierarchical extraction of urban objects from mobile laser scanning data. ISPRS J. Photogramm. Remote Sens. 2015, 99, 45–57. [Google Scholar] [CrossRef]
- Ghosh, A.; Petkov, N. Robustness of shape descriptors to incomplete contour representations. IEEE Trans. Pattern Anal. Mach. Intell. 2005, 27, 1793–1804. [Google Scholar] [CrossRef] [PubMed]
- Ferrari, V.; Fevrier, L.; Schmid, C. Groups of adjacent contour segments for object detection. IEEE Trans. Pattern Anal. Mach. Intell. 2008, 30, 36–51. [Google Scholar] [CrossRef] [PubMed]
- Zhu, M.; Han, J.; Lu, D.; Ban, X. Object recognition method based on local contour feature in natural scenario. Comput. Eng. Appl. 2016, 52, 162–167. [Google Scholar]
- Han, J.; Zhang, J.; Wang, B. Method on recognizing the structure of transmission line based on perceptual organization. Infrared Laser Eng. 2013, 42, 3458–3463. [Google Scholar]


| Component Name | Mode | Amount | ||
|---|---|---|---|---|
| CIR | CIR body | Walking through mode | 1 | |
| PTZ camera | SNC-WR630 | 2 | ||
| LiDAR | Laser scanner | VLP-16 | 1 | |
| POS system | APX-15UAV | 1 | ||
| Mobile-end antenna | HX-CA7606A | 2 | ||
| Direction-finding receiver | FLEX6-D2S-Z00-00N | 1 | ||
| Memory card | 128 G | 1 | ||
| CIR base station | CIR base station | Customization | 1 | |
| GNSS base station | Reference station receiver | SDI-228 | 1 | |
| Reference station antenna | HY-BGLRC08R | 1 | ||
| Class Name | Inspection Target | Feature Description | Density | Contour Feature | |
|---|---|---|---|---|---|
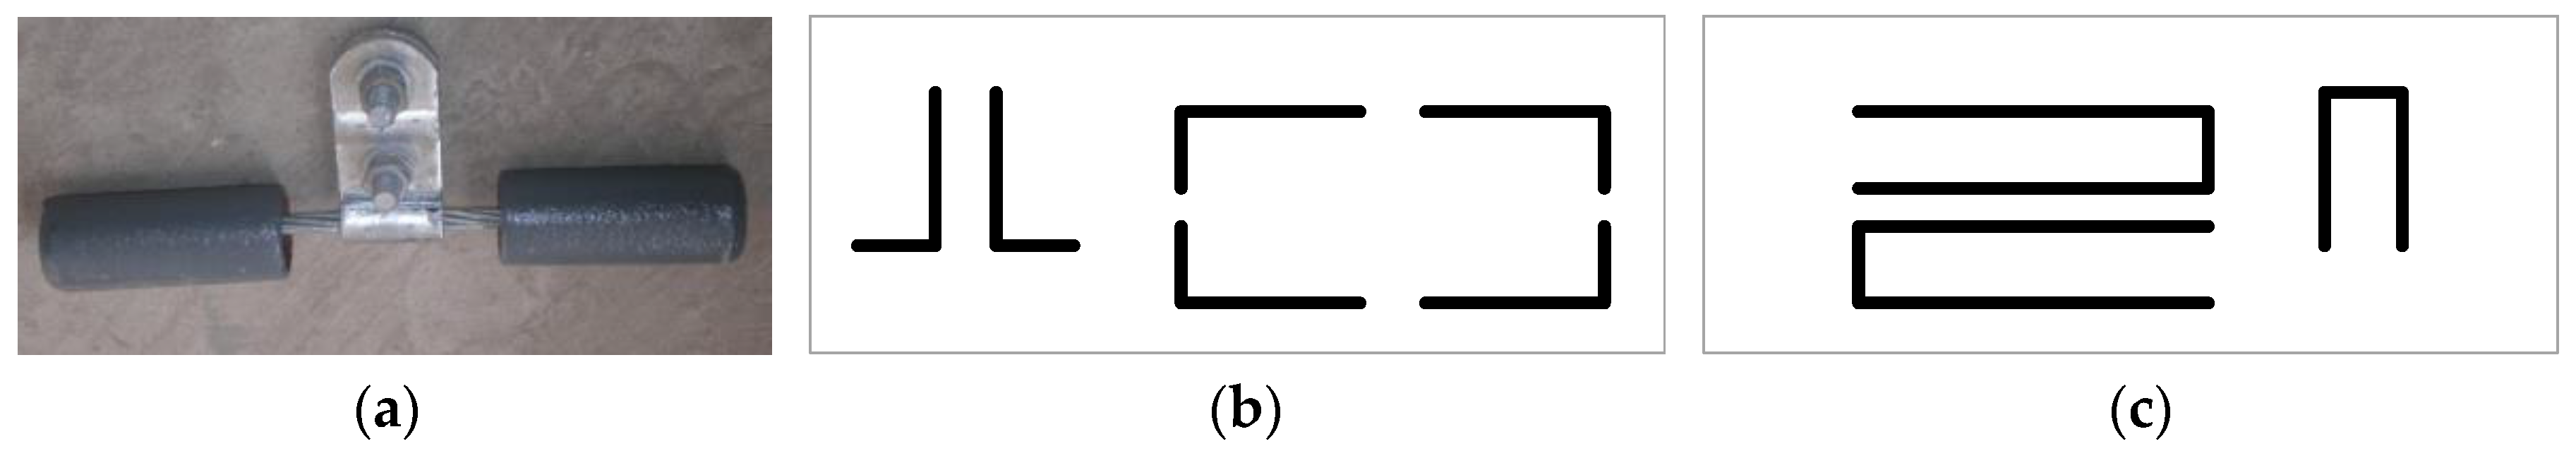
| Fitting (F) | Damper | F1 | Artificial facility Attached to the power line | Dense | “T” shape |
| Spacer | F2 | Artificial facility Attached to the power line | Dense | “X” shape | |
| Line (L) | Broken strand | L1 | Attached to the power line | Dense | Curve shape |
| Environment (E) | Tree crown | E1 | Under the power line Large size | Dense | Sphere shape |
| Overrun building | E2 | Under the power line Large size | Dense | Planar shape | |
| Attachment | E3 | Attached to the power line Small size | Dense | Irregular shape | |
| Number | Line Number | Inspection Point | Coordinate in ECS | Class | Inspection Sequence |
|---|---|---|---|---|---|
| ① | A-phase | A | AG | F1 | LP1-LNA-GF1-ID1 |
| ② | Ground wire | B | BG | E3 | LP1-LNG-GE3-ID2 |
| ③ | C-phase | C | CG | E1 | LP1-LNC-GE1-ID3 |
| ④ | B-phase | D | DG | L1 | LP1-LNB-GL1-ID4 |
| ⑤ | A-phase | E | EG | F1 | LP1-LNA-GF1-ID5 |
| Target | Relative Coordinate (m) | Preliminary Result | Inspection Sequence | PTZ Camera Pan/tilt | Image | Judgement | |||
|---|---|---|---|---|---|---|---|---|---|
| ⑧ | 6.5 | 1.58 | −0.11 | GE2 | LP1-LNA-GE2-ID1 | −96.0 | 6.53 |  | Y |
| ⑦ | 5.62 | 0.74 | −1.57 | GL1 | LP1-LNB-GL1-ID2 | −93.6 | 5.20 |  | N |
| ② | 6.57 | 1.68 | −5.22 | GM1 | LP1-LNA-GM1-ID3 | −117.0 | −18.10 |  | Y |
| ④ | 5.37 | 1.75 | −5.31 | GM1 | LP1-LNB-GM1-ID4 | −122.7 | −12.73 |  | Y |
| ⑤ | 6.65 | 1.95 | −6.04 | GE3 | LP1-LNA-GE3-ID5 | −130.0 | −21.86 |  | Y |
| ⑥ | 5.64 | 1.93 | −6.19 | GE3 | LP1-LNB-GE3-ID1 | −135.2 | −18.15 |  | Y |
| ① | 6.74 | 1.84 | −7.10 | GM1 | LP1-LNA-GM1-ID2 | −147.9 | −27.28 |  | Y |
| ③ | 0.76 | 1.89 | −7.11 | GM1 | LP1-LNB-GM1-ID3 | −152.2 | −21.06 |  | Y |
| Target | Relative Coordinate (m) | Preliminary Result | Inspection Sequence | PTZ Camera Pan/tilt | Image | Judgement | |||
|---|---|---|---|---|---|---|---|---|---|
| ② | 2.05 | −12.4 | −0.80 | GM1 | LP1-LNB-GM1-ID1 | −26.1 | 49.3 |  | Y |
| ① | 0.55 | −5.7 | −0.85 | GM1 | LP1-LNA-GM1-ID2 | −53.6 | 51.7 |  | Y |
| ③ | 1.05 | −18.9 | −0.88 | GM1 | LP1-LNC-GM1-ID3 | −80.2 | 41.8 |  | Y |
© 2018 by the authors. Licensee MDPI, Basel, Switzerland. This article is an open access article distributed under the terms and conditions of the Creative Commons Attribution (CC BY) license (http://creativecommons.org/licenses/by/4.0/).
Share and Cite
Qin, X.; Wu, G.; Lei, J.; Fan, F.; Ye, X.; Mei, Q. A Novel Method of Autonomous Inspection for Transmission Line based on Cable Inspection Robot LiDAR Data. Sensors 2018, 18, 596. https://doi.org/10.3390/s18020596
Qin X, Wu G, Lei J, Fan F, Ye X, Mei Q. A Novel Method of Autonomous Inspection for Transmission Line based on Cable Inspection Robot LiDAR Data. Sensors. 2018; 18(2):596. https://doi.org/10.3390/s18020596
Chicago/Turabian StyleQin, Xinyan, Gongping Wu, Jin Lei, Fei Fan, Xuhui Ye, and Quanjie Mei. 2018. "A Novel Method of Autonomous Inspection for Transmission Line based on Cable Inspection Robot LiDAR Data" Sensors 18, no. 2: 596. https://doi.org/10.3390/s18020596
APA StyleQin, X., Wu, G., Lei, J., Fan, F., Ye, X., & Mei, Q. (2018). A Novel Method of Autonomous Inspection for Transmission Line based on Cable Inspection Robot LiDAR Data. Sensors, 18(2), 596. https://doi.org/10.3390/s18020596