Laser-Based Monitoring of CH4, CO2, NH3, and H2S in Animal Farming—System Characterization and Initial Demonstration


Abstract
1. Introduction
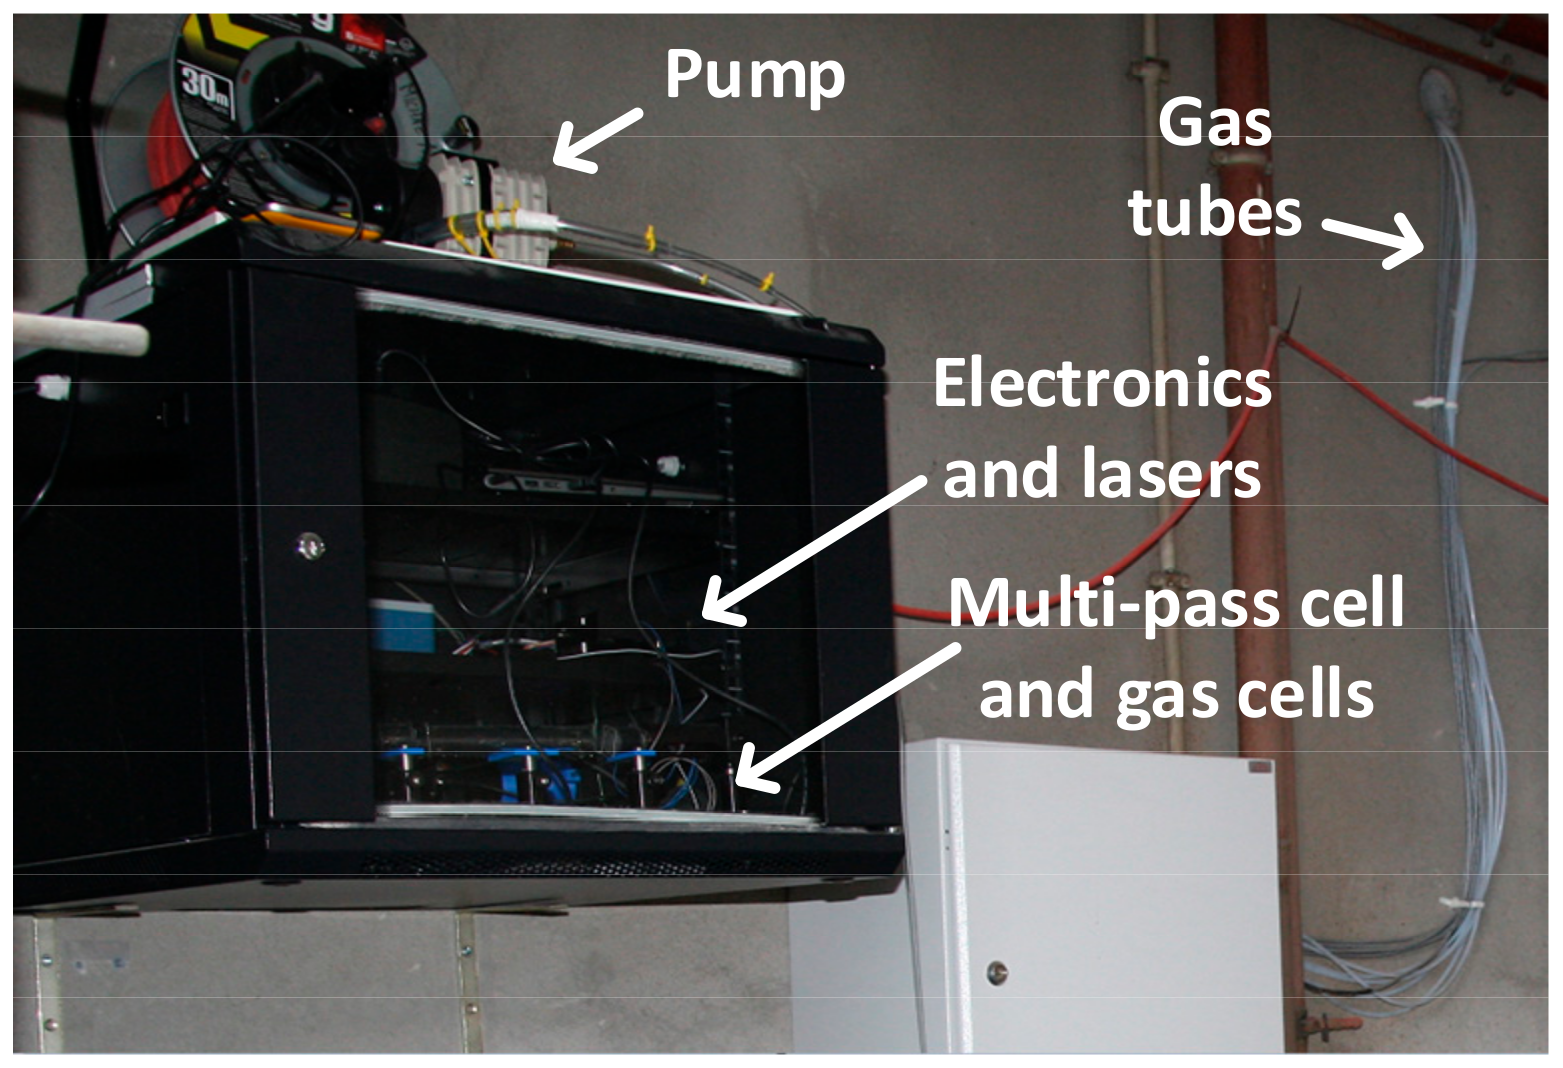
2. System Design
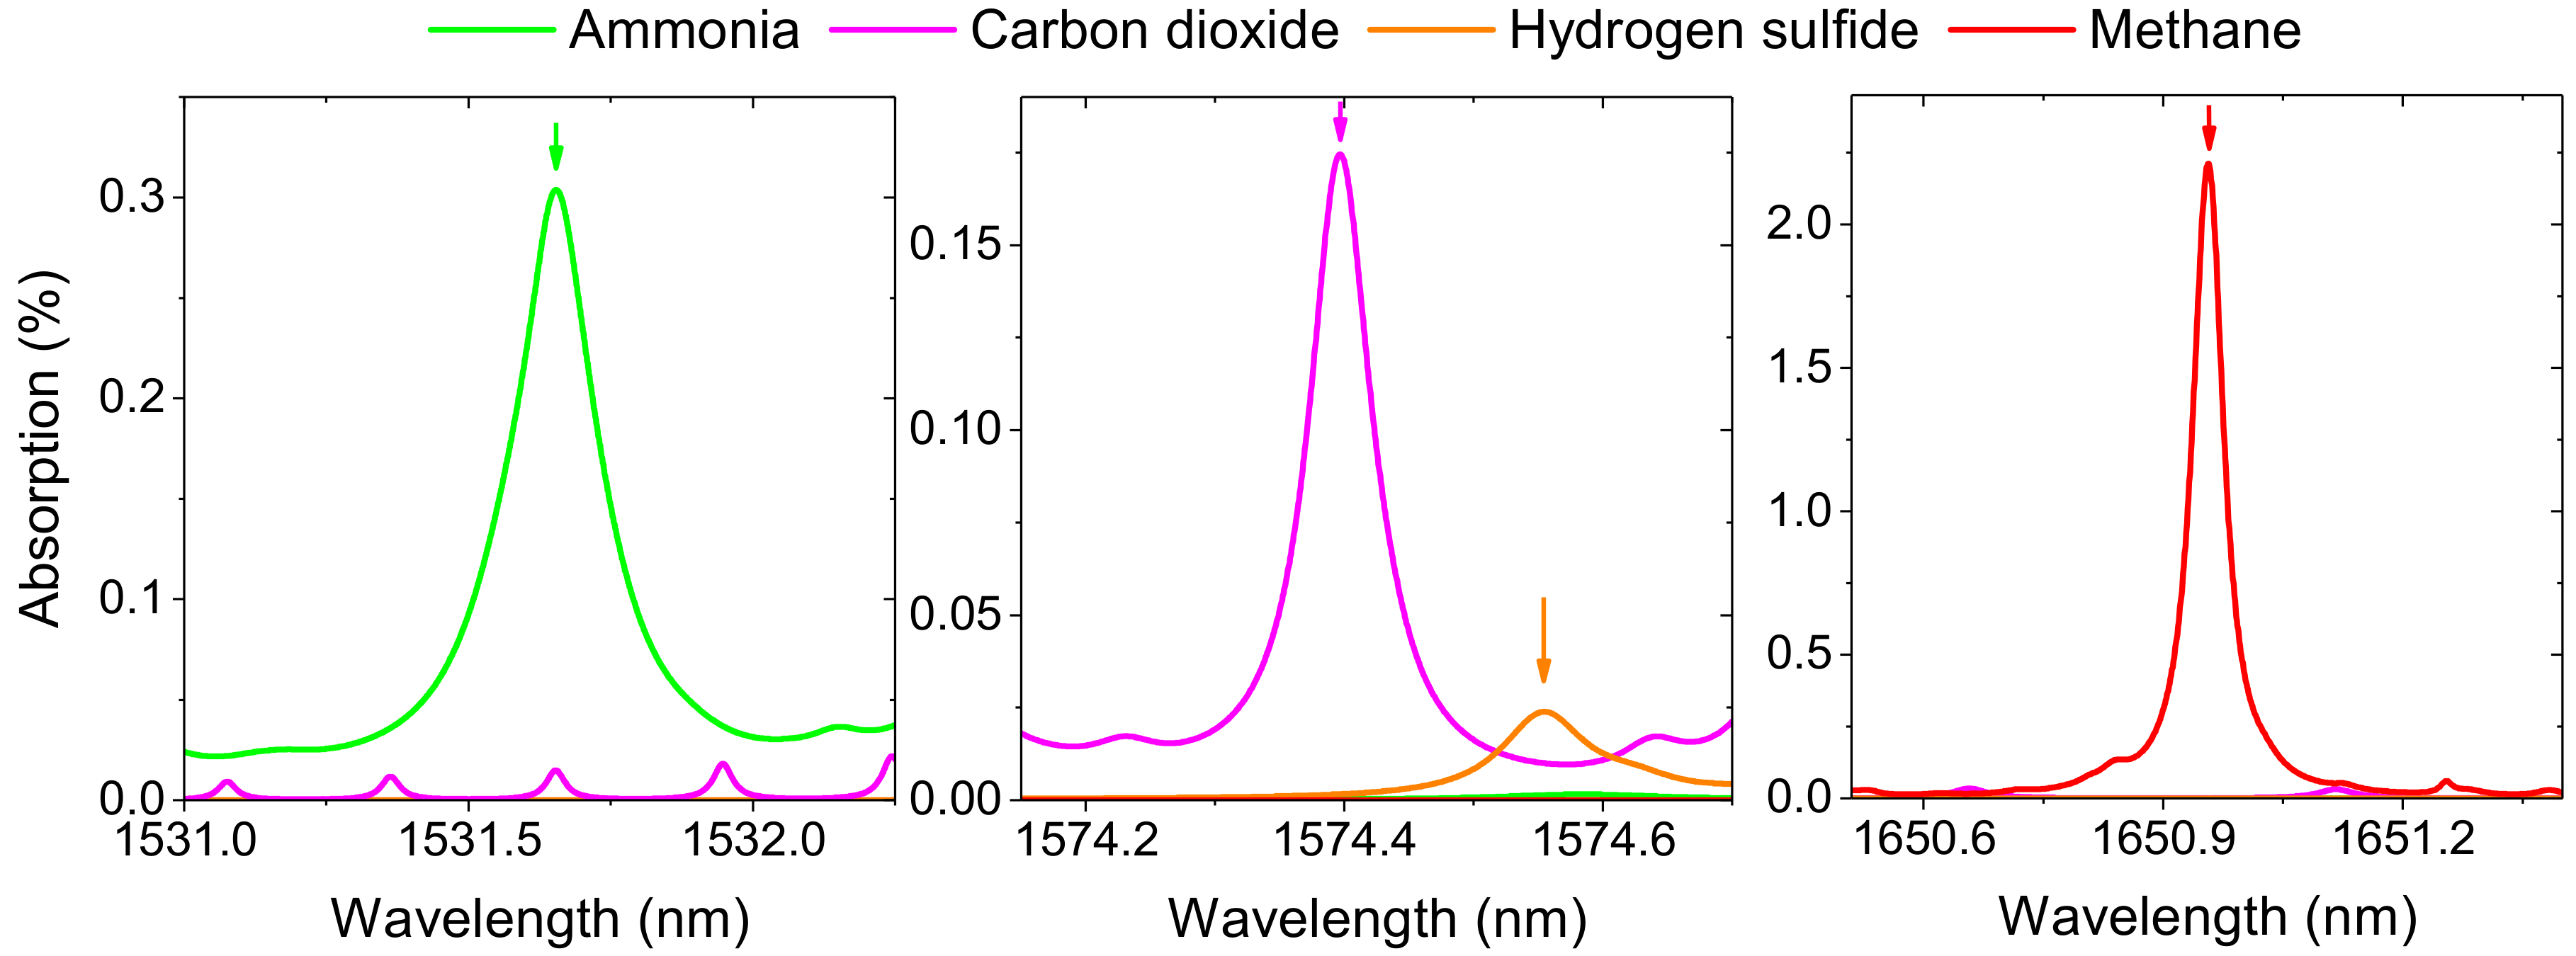
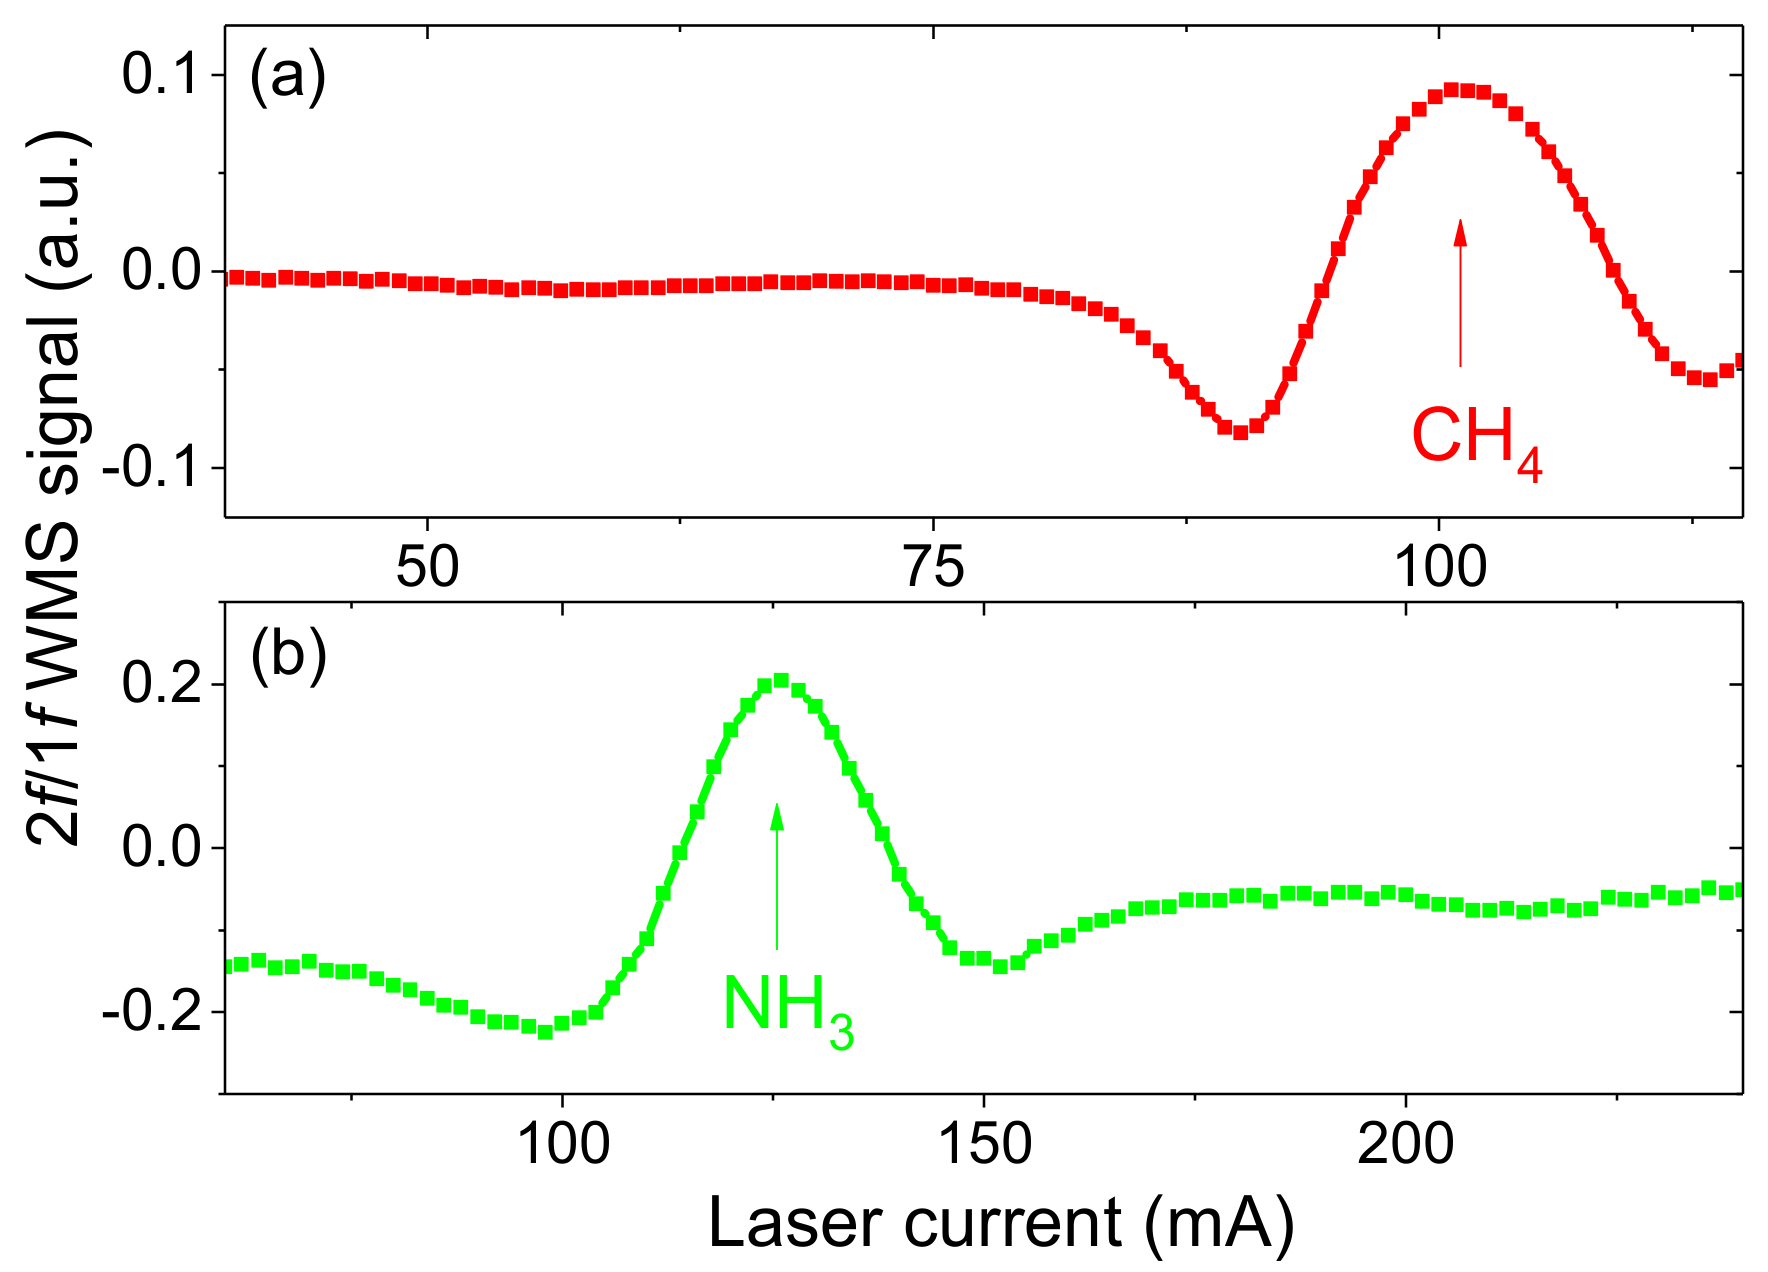
2.1. Methane and Ammonia Detection
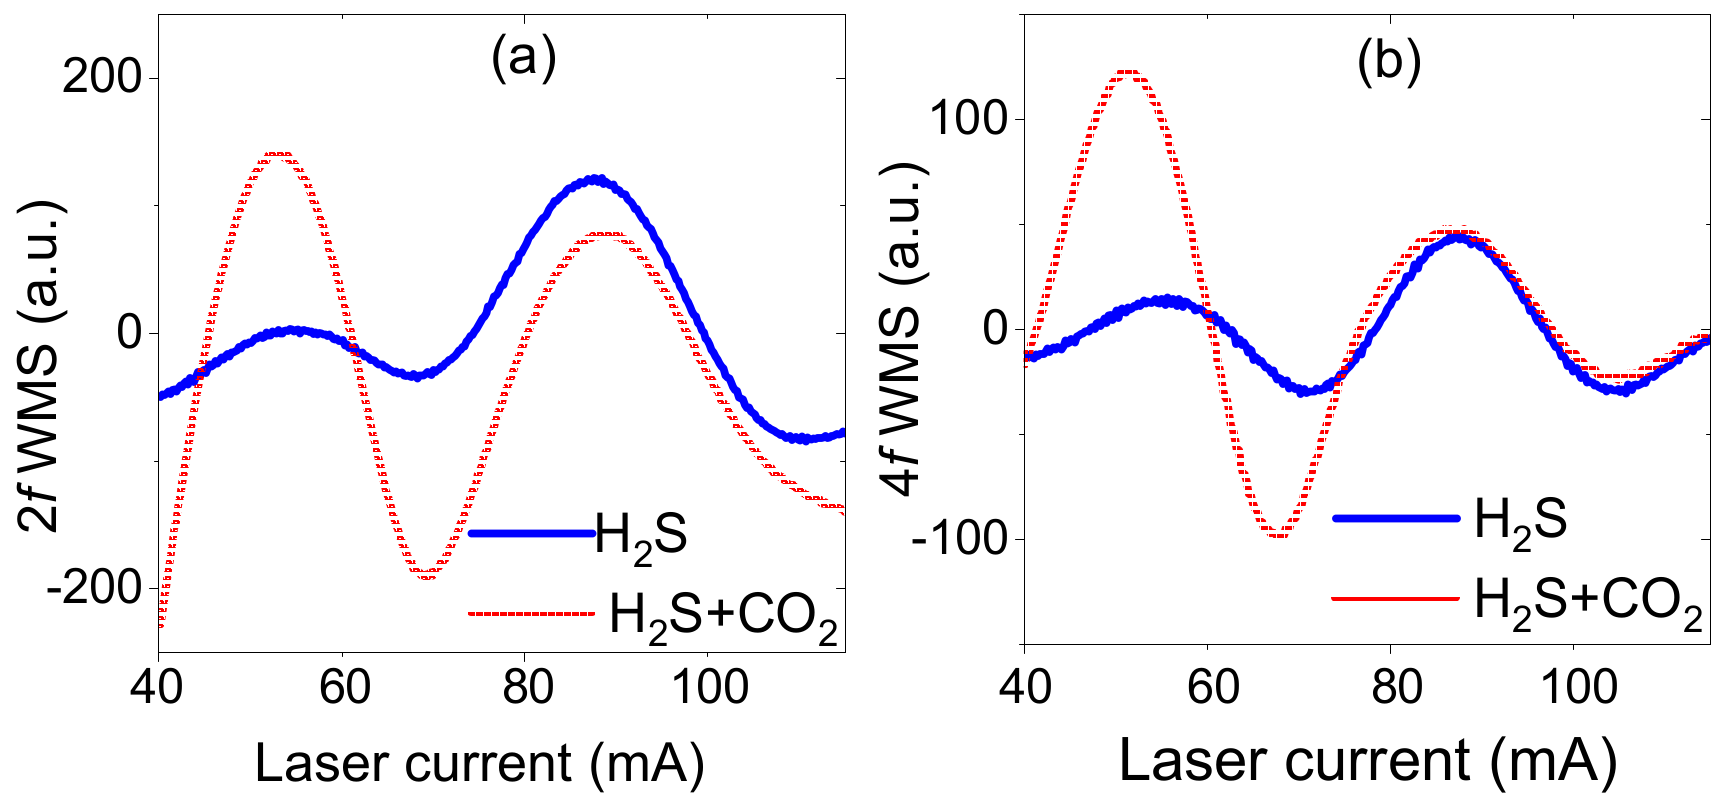
2.2. Carbon Dioxide and Hydrogen Sulfide Detection
3. System Characterization
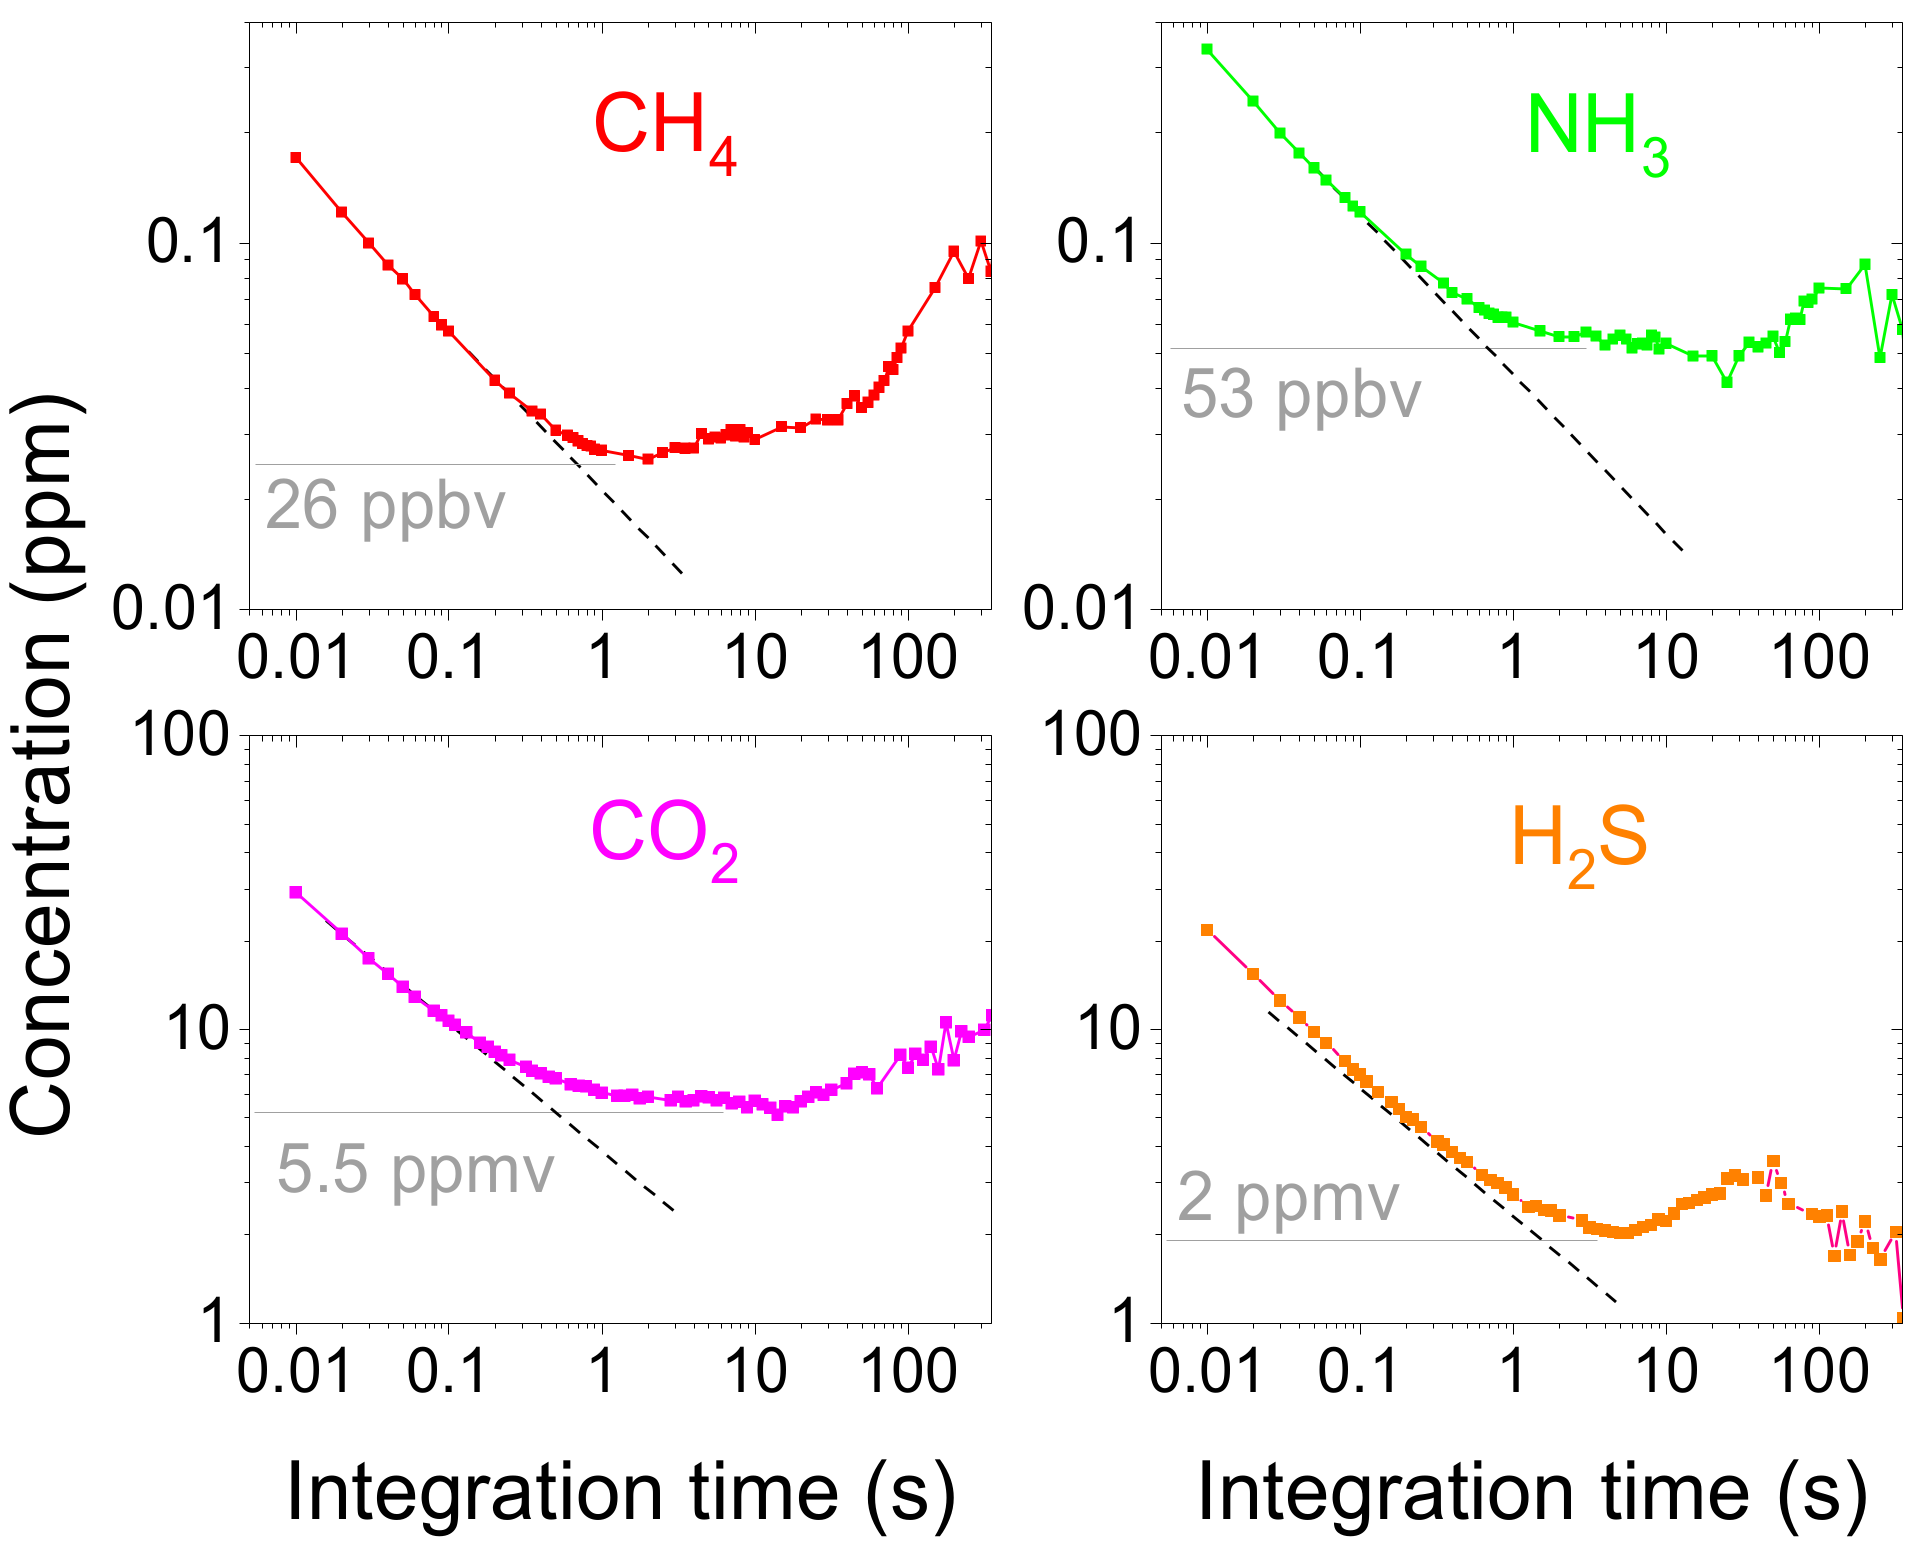
3.1. Minimum Detection Limits
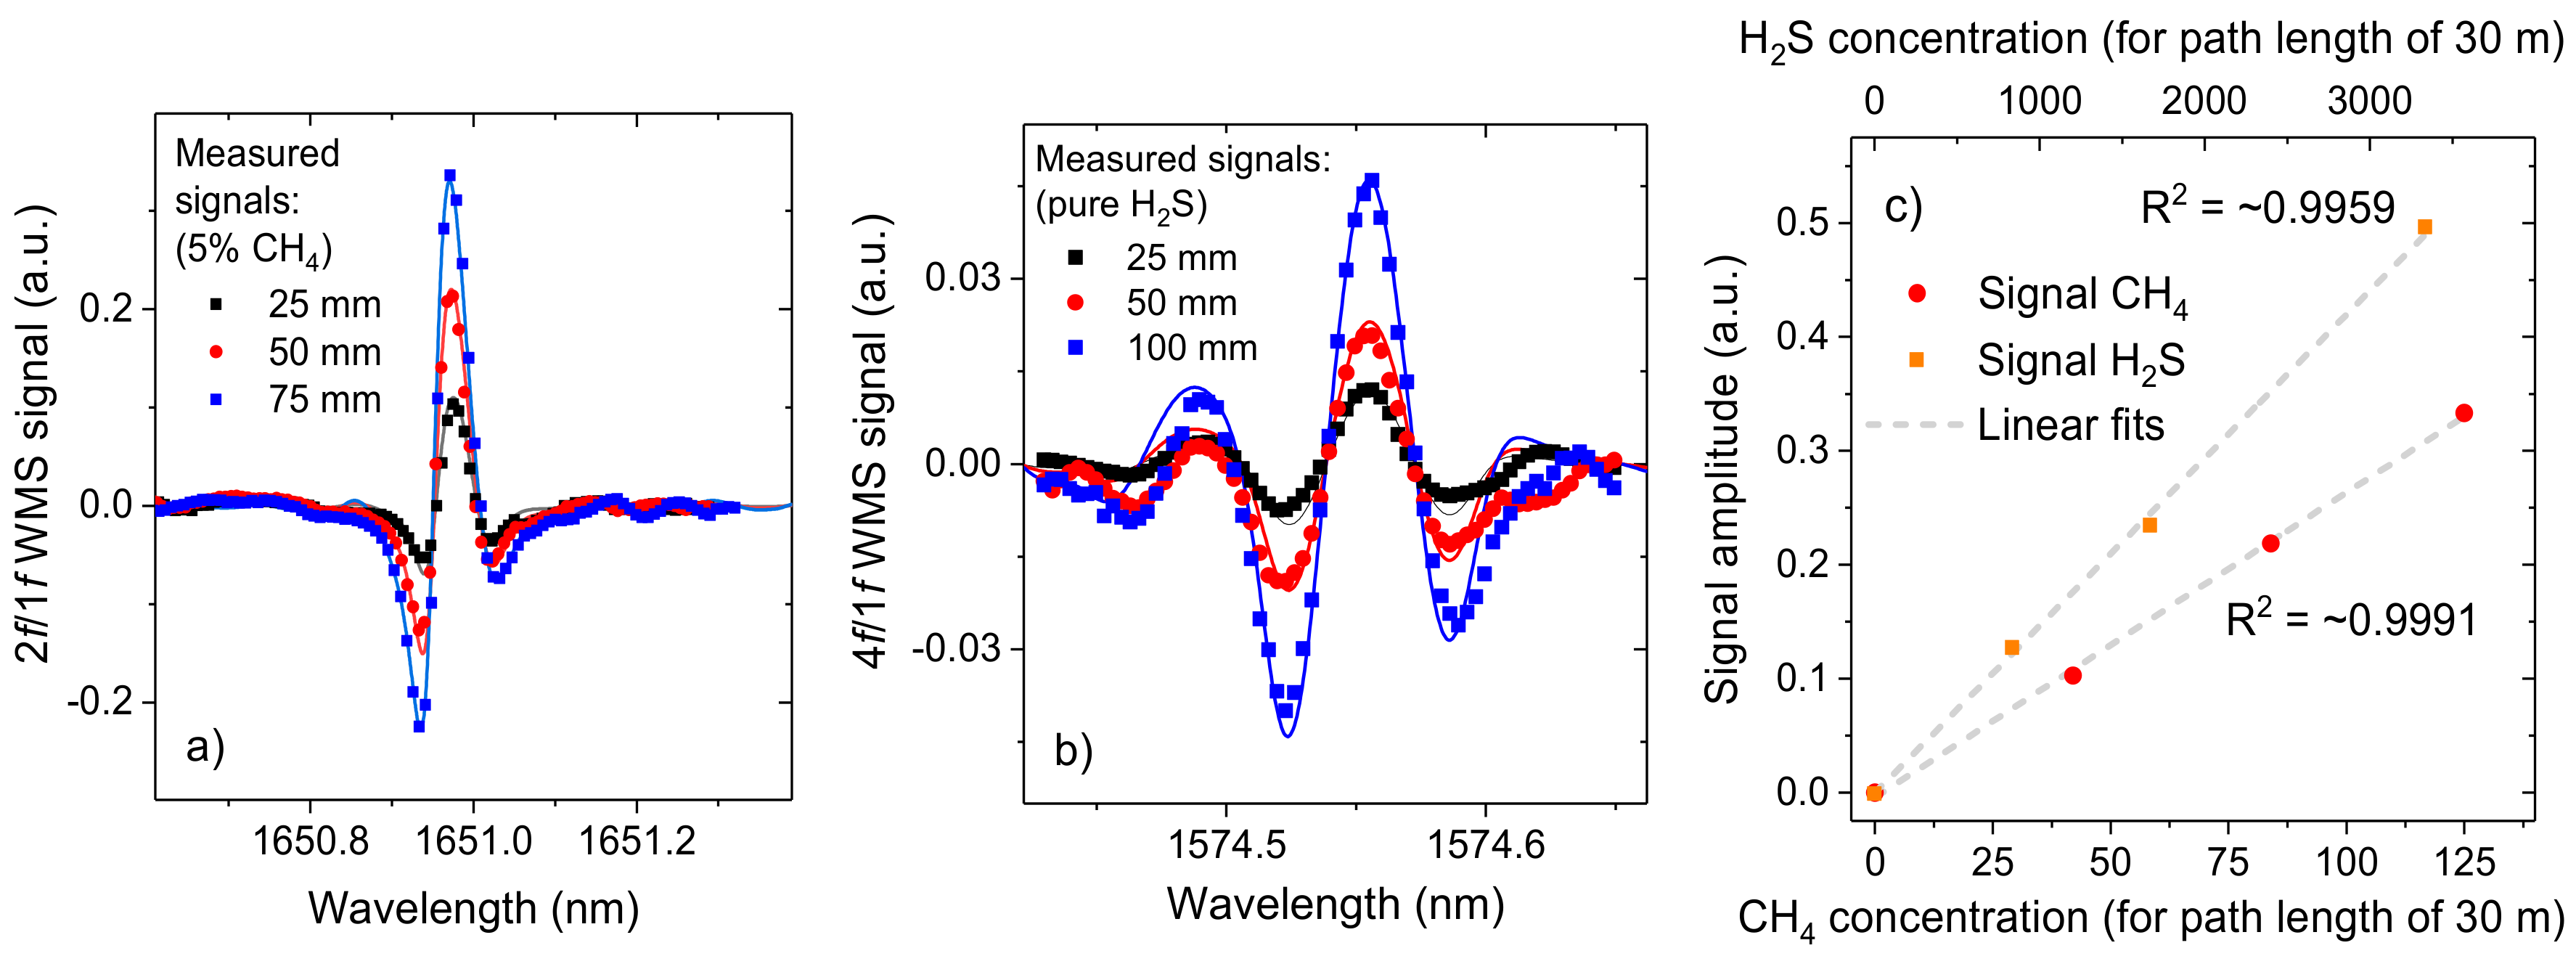
3.2. Linearity
4. System Performance
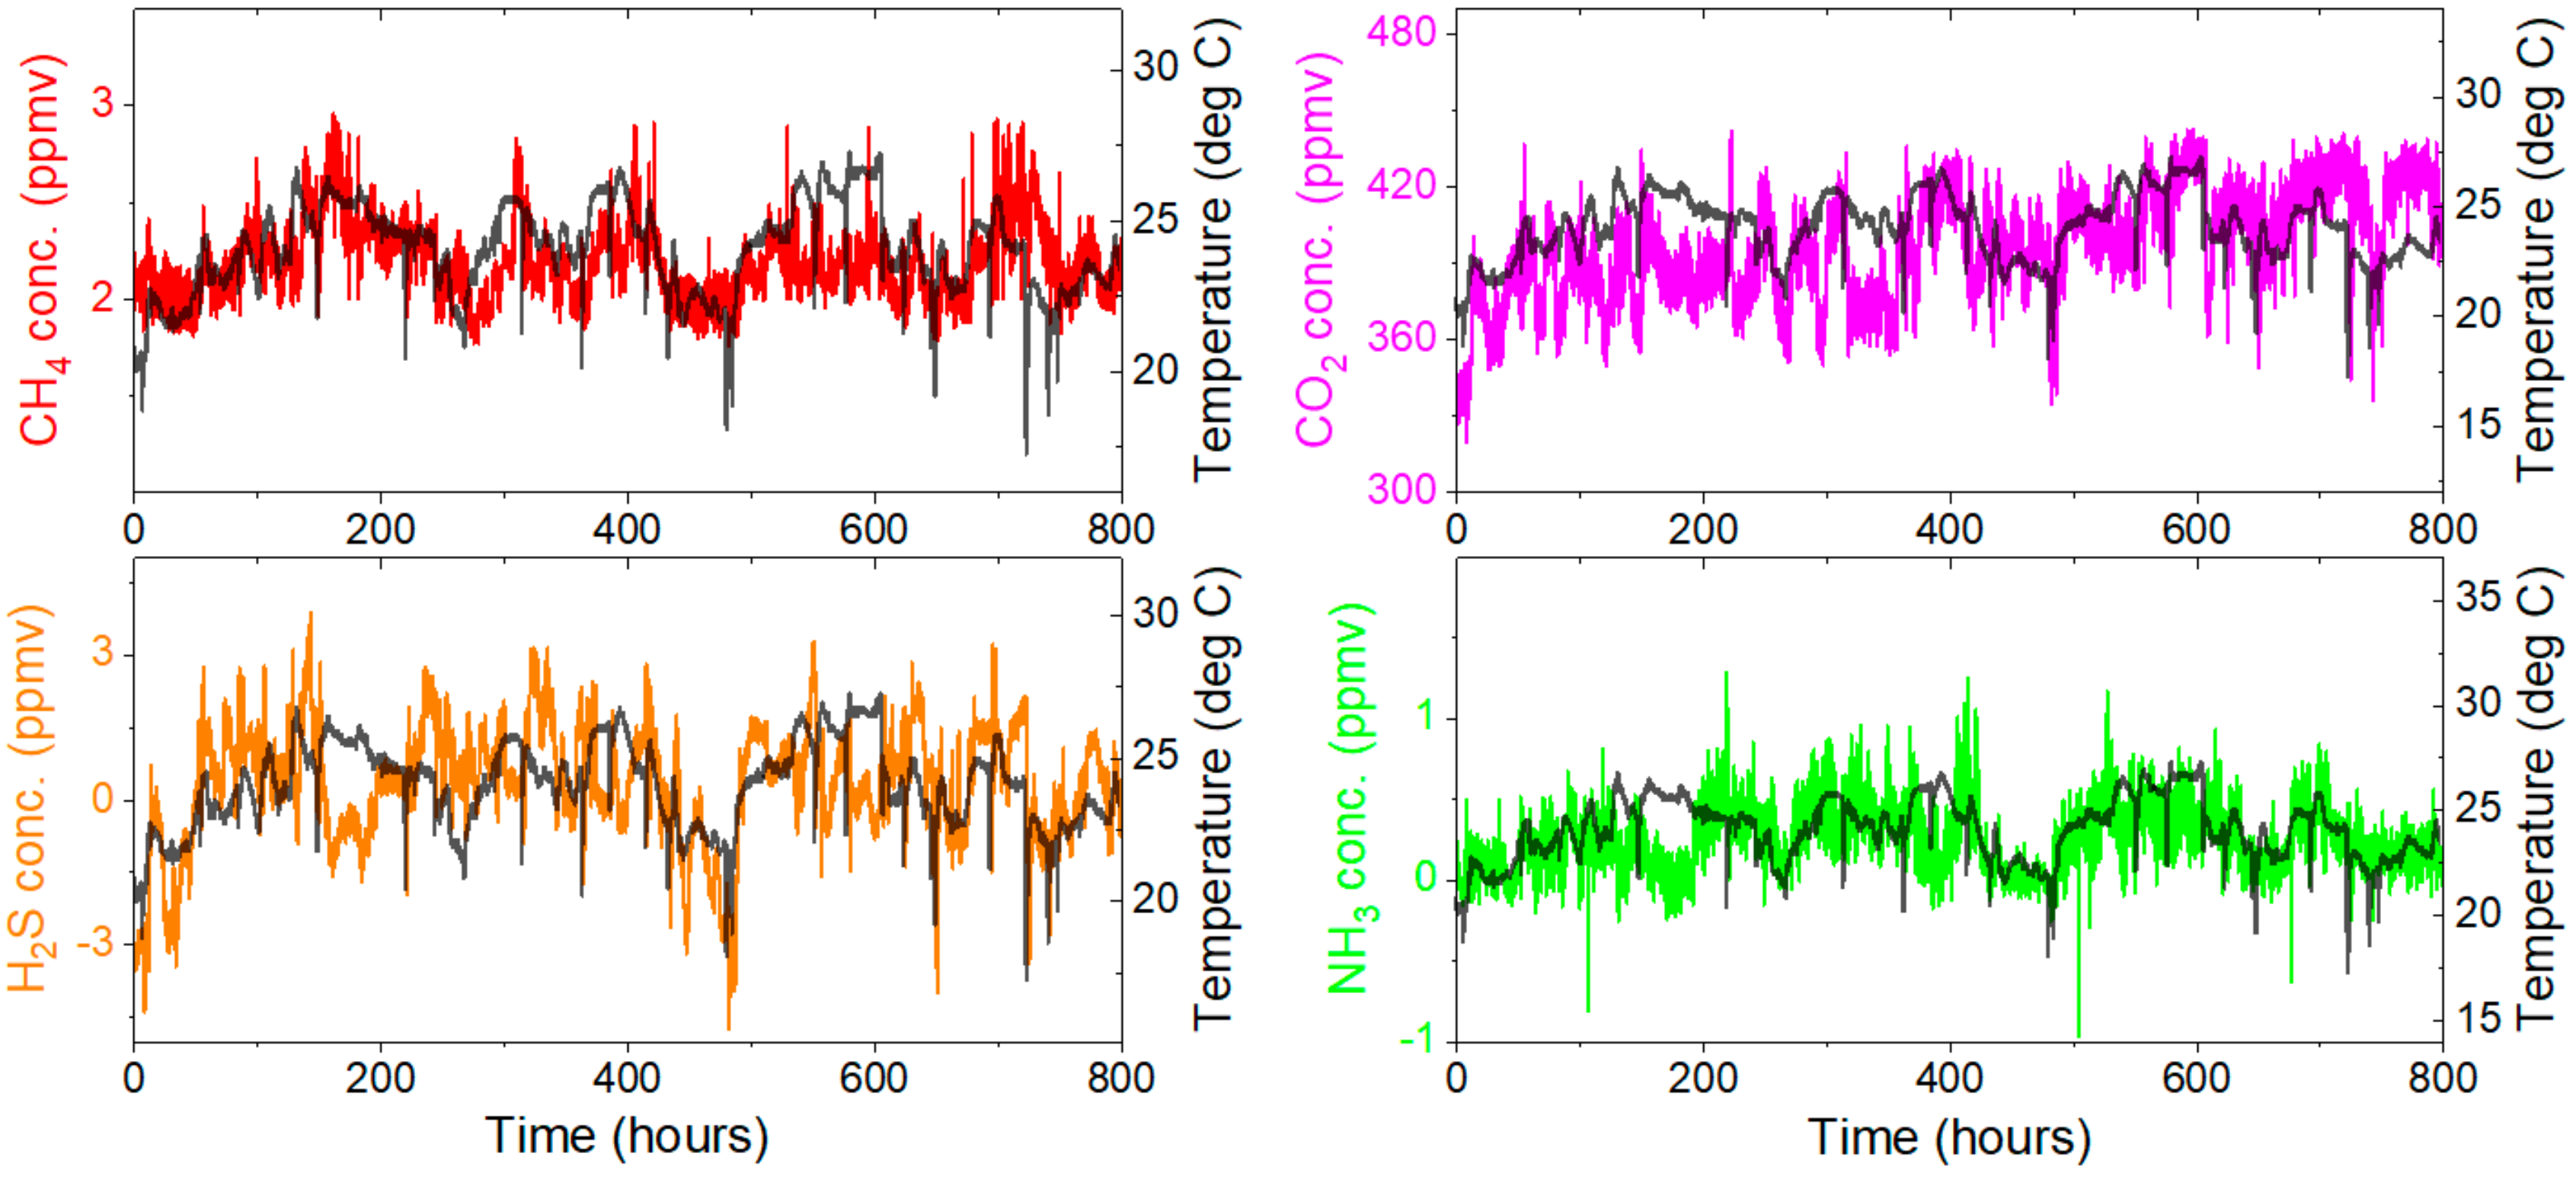
4.1. Stability Test
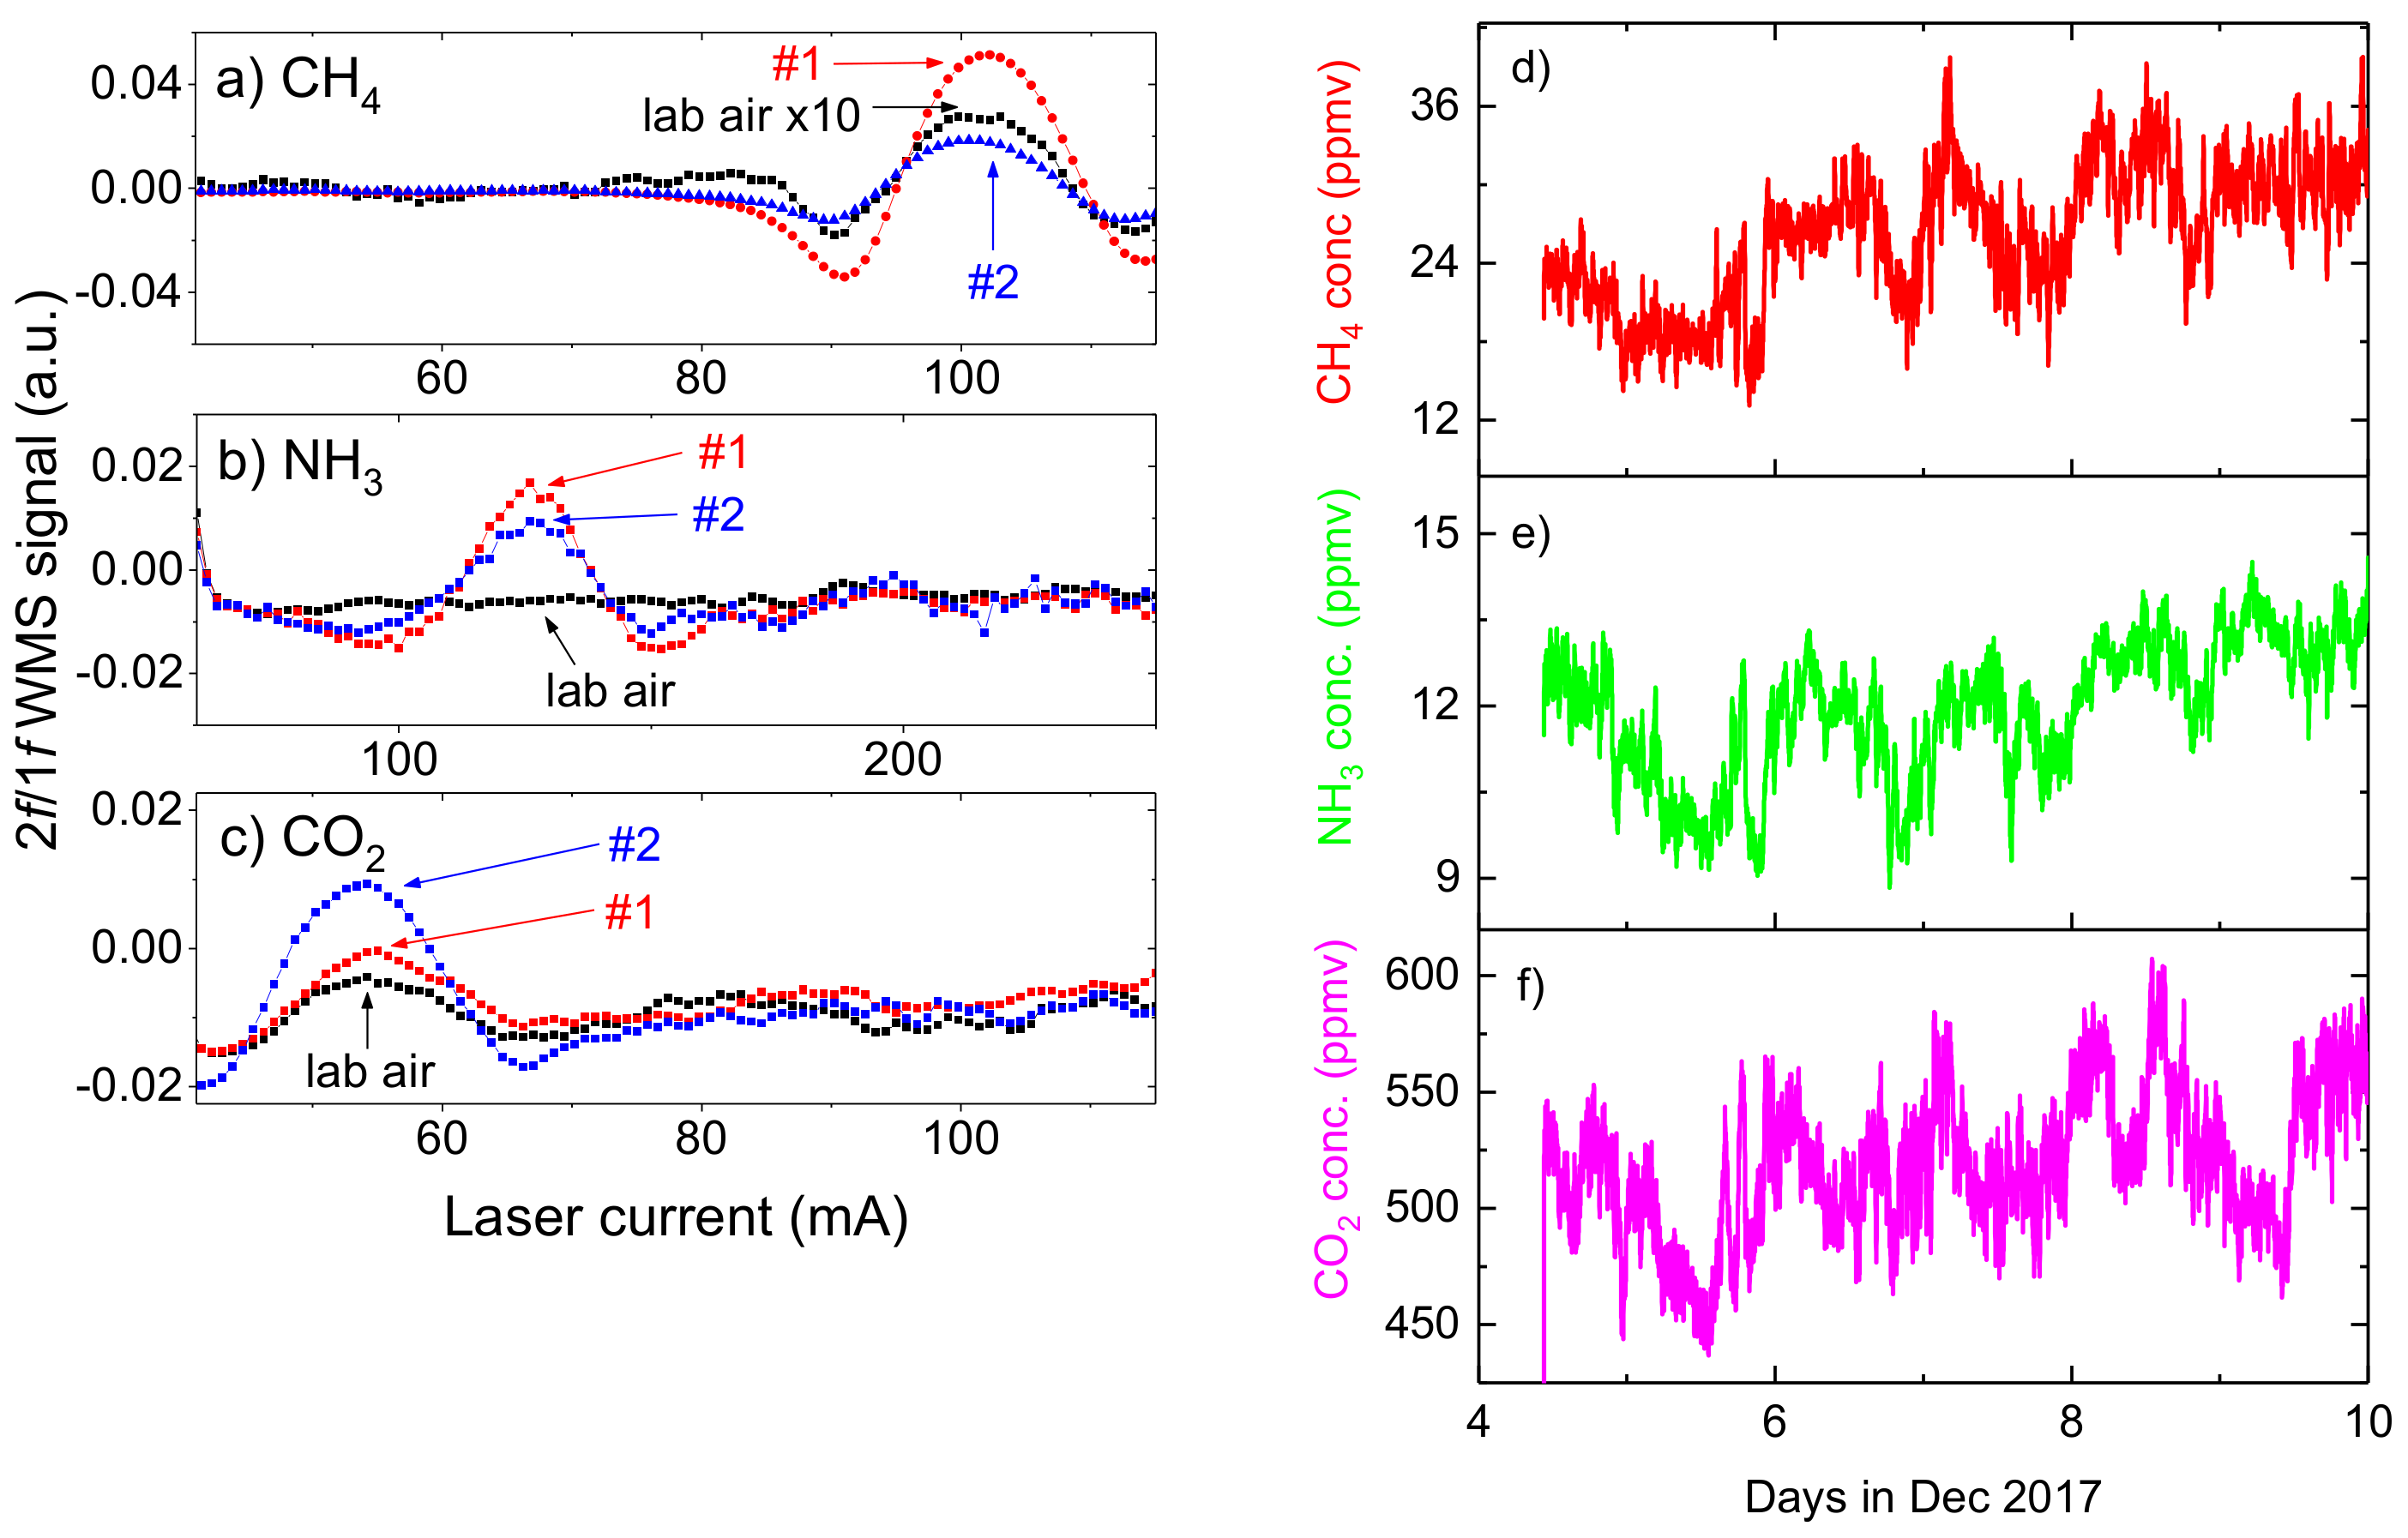
4.2. Gas Emission Measurements
5. Conclusions
Acknowledgments
Author Contributions
Conflicts of Interest
References
- Adrian, L.; Gilles, B.; Josette, G.; Bruna, G.; Luis, L.; Stefan, R.; David, S.; Mark, A.S.; Wim, V.; Franz, W.; et al. Impacts of European livestock production: Nitrogen, sulphur, phosphorus and greenhouse gas emissions, land-use, water eutrophication and biodiversity. Environ. Res. Lett. 2015, 10, 115004. [Google Scholar]
- Sutton, M.A.; Oenema, O.; Erisman, J.W.; Leip, A.; van Grinsven, H.; Winiwarter, W. Too much of a good thing. Nature 2011, 472, 159–161. [Google Scholar] [CrossRef] [PubMed]
- Leip, A. Quantitative quality assessment of the greenhouse gas inventory for agriculture in Europe. Clim. Chang. 2010, 103, 245–261. [Google Scholar] [CrossRef]
- Kille, N.; Baidar, S.; Handley, P.; Ortega, I.; Sinreich, R.; Cooper, O.R.; Hase, F.; Hannigan, J.W.; Pfister, G.; Volkamer, R. The CU mobile Solar Occultation Flux instrument: Structure functions and emission rates of NH3, NO2 and C2H6. Atmos. Meas. Tech. 2017, 10, 373–392. [Google Scholar] [CrossRef]
- Trabue, S.; Kerr, B. Emissions of Greenhouse Gases, Ammonia, and Hydrogen Sulfide from Pigs Fed Standard Diets and Diets Supplemented with Dried Distillers Grains with Solubles. J. Environ. Qual. 2014, 43, 1176–1186. [Google Scholar] [CrossRef] [PubMed]
- Ni, J.Q.; Heber, A.J.; Lim, T.T.; Diehl, C.A.; Duggirala, R.K.; Haymore, B.L.; Sutton, A.L. Ammonia Emission from a Large Mechanically-Ventilated Swine Building during Warm Weather. J. Environ. Qual. 2000, 29, 751–758. [Google Scholar] [CrossRef]
- Ni, J.Q.; Heber, A.J.; Diehl, C.A.; Lim, T.T.; Duggirala, R.K.; Haymore, B.L. Summertime concentrations and emissions of hydrogen sulfide at a mechanically ventilated swine finishing building. Trans. ASAE 2002, 45, 193. [Google Scholar]
- Zhu, J.; Jacobson, L.; Schmidt, D.; Nicolai, R. Daily variations in odor and gas emissions from animal facilities. J. Agric. Saf. Health 2000, 16, 153. [Google Scholar]
- Ma, Y.; Lewicki, R.; Razeghi, M.; Tittel, F.K. QEPAS based ppb-level detection of CO and N2O using a high power CW DFB-QCL. Opt. Express 2013, 21, 1008–1019. [Google Scholar] [CrossRef] [PubMed]
- Wang, Y.; Nikodem, M.; Zhang, E.; Cikach, F.; Barnes, J.; Comhair, S.; Dweik, R.; Kao, C.; Wysocki, G. Shot-noise Limited Faraday Rotation Spectroscopy for Detection of Nitric Oxide Isotopes in Breath, Urine, and Blood. Sci. Rep. 2015, 5, 9096. [Google Scholar] [CrossRef] [PubMed]
- Wang, Y.; Nikodem, M.; Wysocki, G. Cryogen-free heterodyne-enhanced mid-infrared Faraday rotation spectrometer. Opt. Express 2013, 21, 740–755. [Google Scholar] [CrossRef] [PubMed]
- Pushkarsky, M.; Tsekoun, A.; Dunayevskiy, I.G.; Go, R.; Patel, C.K.N. Sub-parts-per-billion level detection of NO2 using room-temperature quantum cascade lasers. Proc. Natl. Acad. Sci. USA 2006, 103, 10846–10849. [Google Scholar] [CrossRef] [PubMed]
- McManus, J.B.; Zahniser, M.S.; Nelson, J.D.D.; Shorter, J.H.; Herndon, S.; Wood, E.; Wehr, R. Application of quantum cascade lasers to high-precision atmospheric trace gas measurements. Opt. Eng. 2010, 49, 111124. [Google Scholar] [CrossRef]
- Galli, I.; Bartalini, S.; Borri, S.; Cancio, P.; Mazzotti, D.; De Natale, P.; Giusfredi, G. Molecular Gas Sensing Below Parts Per Trillion: Radiocarbon-Dioxide Optical Detection. Phys. Rev. Lett. 2011, 107, 270802. [Google Scholar] [CrossRef] [PubMed]
- Wojtas, J. Application of Cavity Enhanced Absorption Spectroscopy to the Detection of Nitric Oxide, Carbonyl Sulphide, and Ethane—Breath Biomarkers of Serious Diseases. Sensors 2015, 15, 14356–14369. [Google Scholar] [CrossRef] [PubMed]
- Krzempek, K.; Jahjah, M.; Lewicki, R.; Stefański, P.; So, S.; Thomazy, D.; Tittel, F. CW DFB RT diode laser-based sensor for trace-gas detection of ethane using a novel compact multipass gas absorption cell. Appl. Phys. B 2013, 112, 461–465. [Google Scholar] [CrossRef]
- Plant, G.; Nikodem, M.; Mulhall, P.; Varner, R.; Sonnenfroh, D.; Wysocki, G. Field Test of a Remote Multi-Path CLaDS Methane Sensor. Sensors 2015, 15, 21315–21326. [Google Scholar] [CrossRef] [PubMed]
- Wu, H.; Dong, L.; Liu, X.; Zheng, H.; Yin, X.; Ma, W.; Zhang, L.; Yin, W.; Jia, S. Fiber-Amplifier-Enhanced QEPAS Sensor for Simultaneous Trace Gas Detection of NH3 and H2S. Sensors 2015, 15, 26743–26755. [Google Scholar] [CrossRef] [PubMed]
- Vogler, D.E.; Sigrist, M.W. Near-infrared laser based cavity ringdown spectroscopy for applications in petrochemical industry. Appl. Phys. B 2006, 85, 349–354. [Google Scholar] [CrossRef]
- Asakawa, T.; Kanno, N.; Tonokura, K. Diode Laser Detection of Greenhouse Gases in the Near-Infrared Region by Wavelength Modulation Spectroscopy: Pressure Dependence of the Detection Sensitivity. Sensors 2010, 10, 4686–4699. [Google Scholar] [CrossRef] [PubMed]
- Viveiros, D.; Ferreira, J.; Silva, S.O.; Ribeiro, J.; Flores, D.; Santos, J.L.; Frazao, O.; Baptista, J.M. Ammonia Sensing System Based on Wavelength Modulation Spectroscopy. Photonic Sens. 2015, 5, 109–115. [Google Scholar] [CrossRef]
- Xia, H.; Dong, F.-Z.; Wu, B.; Zhang, Z.-R.; Pang, T.; Sun, P.-S.; Cui, X.-J.; Han, L.; Wang, Y. Sensitive absorption measurements of hydrogen sulfide at 1.578 μm using wavelength modulation spectroscopy. Chin. Phys. B 2015, 24, 034204. [Google Scholar] [CrossRef]
- Joly, L.; Maamary, R.; Decarpenterie, T.; Cousin, J.; Dumelié, N.; Chauvin, N.; Legain, D.; Tzanos, D.; Durry, G. Atmospheric Measurements by Ultra-Light SpEctrometer (AMULSE) Dedicated to Vertical Profile in Situ Measurements of Carbon Dioxide (CO2) Under Weather Balloons: Instrumental Development and Field Application. Sensors 2016, 16, 1609. [Google Scholar] [CrossRef] [PubMed]
- Curl, R.F.; Capasso, F.; Gmachl, C.; Kosterev, A.; McManus, B.; Lewicki, R.; Pusharsky, M.; Wysocki, G.; Tittel, F.K. Quantum cascade lasers in chemical physics. Chem. Phys. Lett. 2010, 487, 1–18. [Google Scholar] [CrossRef]
- Smith, C.; So, S.; Xia, L.; Pitz, S.; Szlavecz, K.; Carlson, D.; Terzis, A.; Wysocki, G. Wireless laser spectroscopic sensor node for atmospheric CO2 monitoring—Laboratory and field test. Appl. Phys. B 2012, 110, 241–248. [Google Scholar] [CrossRef]
- Farooq, A.; Jeffries, J.B.; Hanson, R.K. Measurements of CO2 concentration and temperature at high pressures using 1f-normalized wavelength modulation spectroscopy with second harmonic detection near 2.7 μm. Appl. Opt. 2009, 48, 6740–6753. [Google Scholar] [CrossRef] [PubMed]
- Rieker, G.B.; Jeffries, J.B.; Hanson, R.K. Calibration-free wavelength-modulation spectroscopy for measurements of gas temperature and concentration in harsh environments. Appl. Opt. 2009, 48, 5546–5560. [Google Scholar] [CrossRef] [PubMed]
- Tao, L.; Sun, K.; Khan, M.A.; Miller, D.J.; Zondlo, M. Compact and portable open-path sensor for simultaneous measurements of atmospheric N2O and CO using a quantum cascade laser. Opt. Express 2012, 20, 28106–28118. [Google Scholar] [CrossRef] [PubMed]
- Kluczynski, P.; Axner, O. Theoretical description based on Fourier analysis of wavelength-modulation spectrometry in terms of analytical and background signals. Appl. Opt. 1999, 38, 5803–5815. [Google Scholar] [CrossRef] [PubMed]
- Lundqvist, S.; Kluczynski, P.; Weih, R.; von Edlinger, M.; Nähle, L.; Fischer, M.; Bauer, A.; Höfling, S.; Koeth, J. Sensing of formaldehyde using a distributed feedback interband cascade laser emitting around 3493 nm. Appl. Opt. 2012, 51, 6009–6013. [Google Scholar] [CrossRef] [PubMed]
- Khan, M.A.; Schaefer, D.; Tao, L.; Miller, D.J.; Sun, K.; Zondlo, M.; Harrison, W.A.; Roscoe, B.; Lary, D.J. Low Power Greenhouse Gas Sensors for Unmanned Aerial Vehicles. Remote Sens. 2012, 4, 1355–1368. [Google Scholar] [CrossRef]
- Hangauer, A.; Chen, J.; Strzoda, R.; Amann, M.-C. Multi-harmonic detection in wavelength modulation spectroscopy systems. Appl. Phys. B 2013, 110, 177–185. [Google Scholar] [CrossRef]
- Sun, K.; Tao, L.; Miller, D.J.; Khan, M.A.; Zondlo, M. Inline multi-harmonic calibration method for open-path atmospheric ammonia measurements. Appl. Phys. B 2013, 110, 213–222. [Google Scholar] [CrossRef]
- Hlaing, M.; Khan, M.A.; Azevedo, C.S.; Fair, S.A. High spectral resolution of overlapping molecular transitions of CH4 and N2O in the mid-infrared region. In Conference on Lasers and Electro-Optics (Optical Society of America, San Jose, California, 2017); OSA Publishing: Washington, DC, USA, 2017; p. AM3B.5. [Google Scholar]
- Varga, A.; Bozoki, Z.; Szakall, M.; Szabo, G. Photoacoustic system for on-line process monitoring of hydrogen sulfide (H2S) concentration in natural gas streams. Appl. Phys. B 2006, 85, 315–321. [Google Scholar] [CrossRef]
- Werle, P. Accuracy and precision of laser spectrometers for trace gas sensing in the presence of optical fringes and atmospheric turbulence. Appl. Phys. B 2011, 102, 313–329. [Google Scholar] [CrossRef]
- De Sousa, P.; Pedersen, S. Ammonia Emission from Fattening Pig Houses in Relation to Animal Activity and Carbon Dioxide Production. Agric. Eng. Int. CIGR J. Sci. Res. Dev. 2004, 6, BC04 003. [Google Scholar]


| Spectral Region | Target Gas | Target Line Position and FWHM 1 | Required Detection Limit (ppmv) | Fractional Absorption 2 |
|---|---|---|---|---|
| 1531 nm | NH3 | 6528.9 cm−1 and 24.29 GHz | 1 | 3 × 10⁻⁴ |
| 1575 nm | CO2 H2S | 6351.6 cm−1 and 7.06 GHz 6351.0 cm−1 and 10.57 GHz | 100 2 | 1.71 × 10⁻⁴ 0.94 × 10⁻⁴ |
| 1651 nm | CH4 | 6057.1 cm−1 and 5.00 GHz | 1 | 10.15 × 10⁻⁴ |
© 2018 by the authors. Licensee MDPI, Basel, Switzerland. This article is an open access article distributed under the terms and conditions of the Creative Commons Attribution (CC BY) license (http://creativecommons.org/licenses/by/4.0/).
Share and Cite
Stachowiak, D.; Jaworski, P.; Krzaczek, P.; Maj, G.; Nikodem, M. Laser-Based Monitoring of CH4, CO2, NH3, and H2S in Animal Farming—System Characterization and Initial Demonstration. Sensors 2018, 18, 529. https://doi.org/10.3390/s18020529
Stachowiak D, Jaworski P, Krzaczek P, Maj G, Nikodem M. Laser-Based Monitoring of CH4, CO2, NH3, and H2S in Animal Farming—System Characterization and Initial Demonstration. Sensors. 2018; 18(2):529. https://doi.org/10.3390/s18020529
Chicago/Turabian StyleStachowiak, Dorota, Piotr Jaworski, Paweł Krzaczek, Grzegorz Maj, and Michał Nikodem. 2018. "Laser-Based Monitoring of CH4, CO2, NH3, and H2S in Animal Farming—System Characterization and Initial Demonstration" Sensors 18, no. 2: 529. https://doi.org/10.3390/s18020529
APA StyleStachowiak, D., Jaworski, P., Krzaczek, P., Maj, G., & Nikodem, M. (2018). Laser-Based Monitoring of CH4, CO2, NH3, and H2S in Animal Farming—System Characterization and Initial Demonstration. Sensors, 18(2), 529. https://doi.org/10.3390/s18020529