3.1. High Multipath Single Point Static Positioning and Antenna Effect
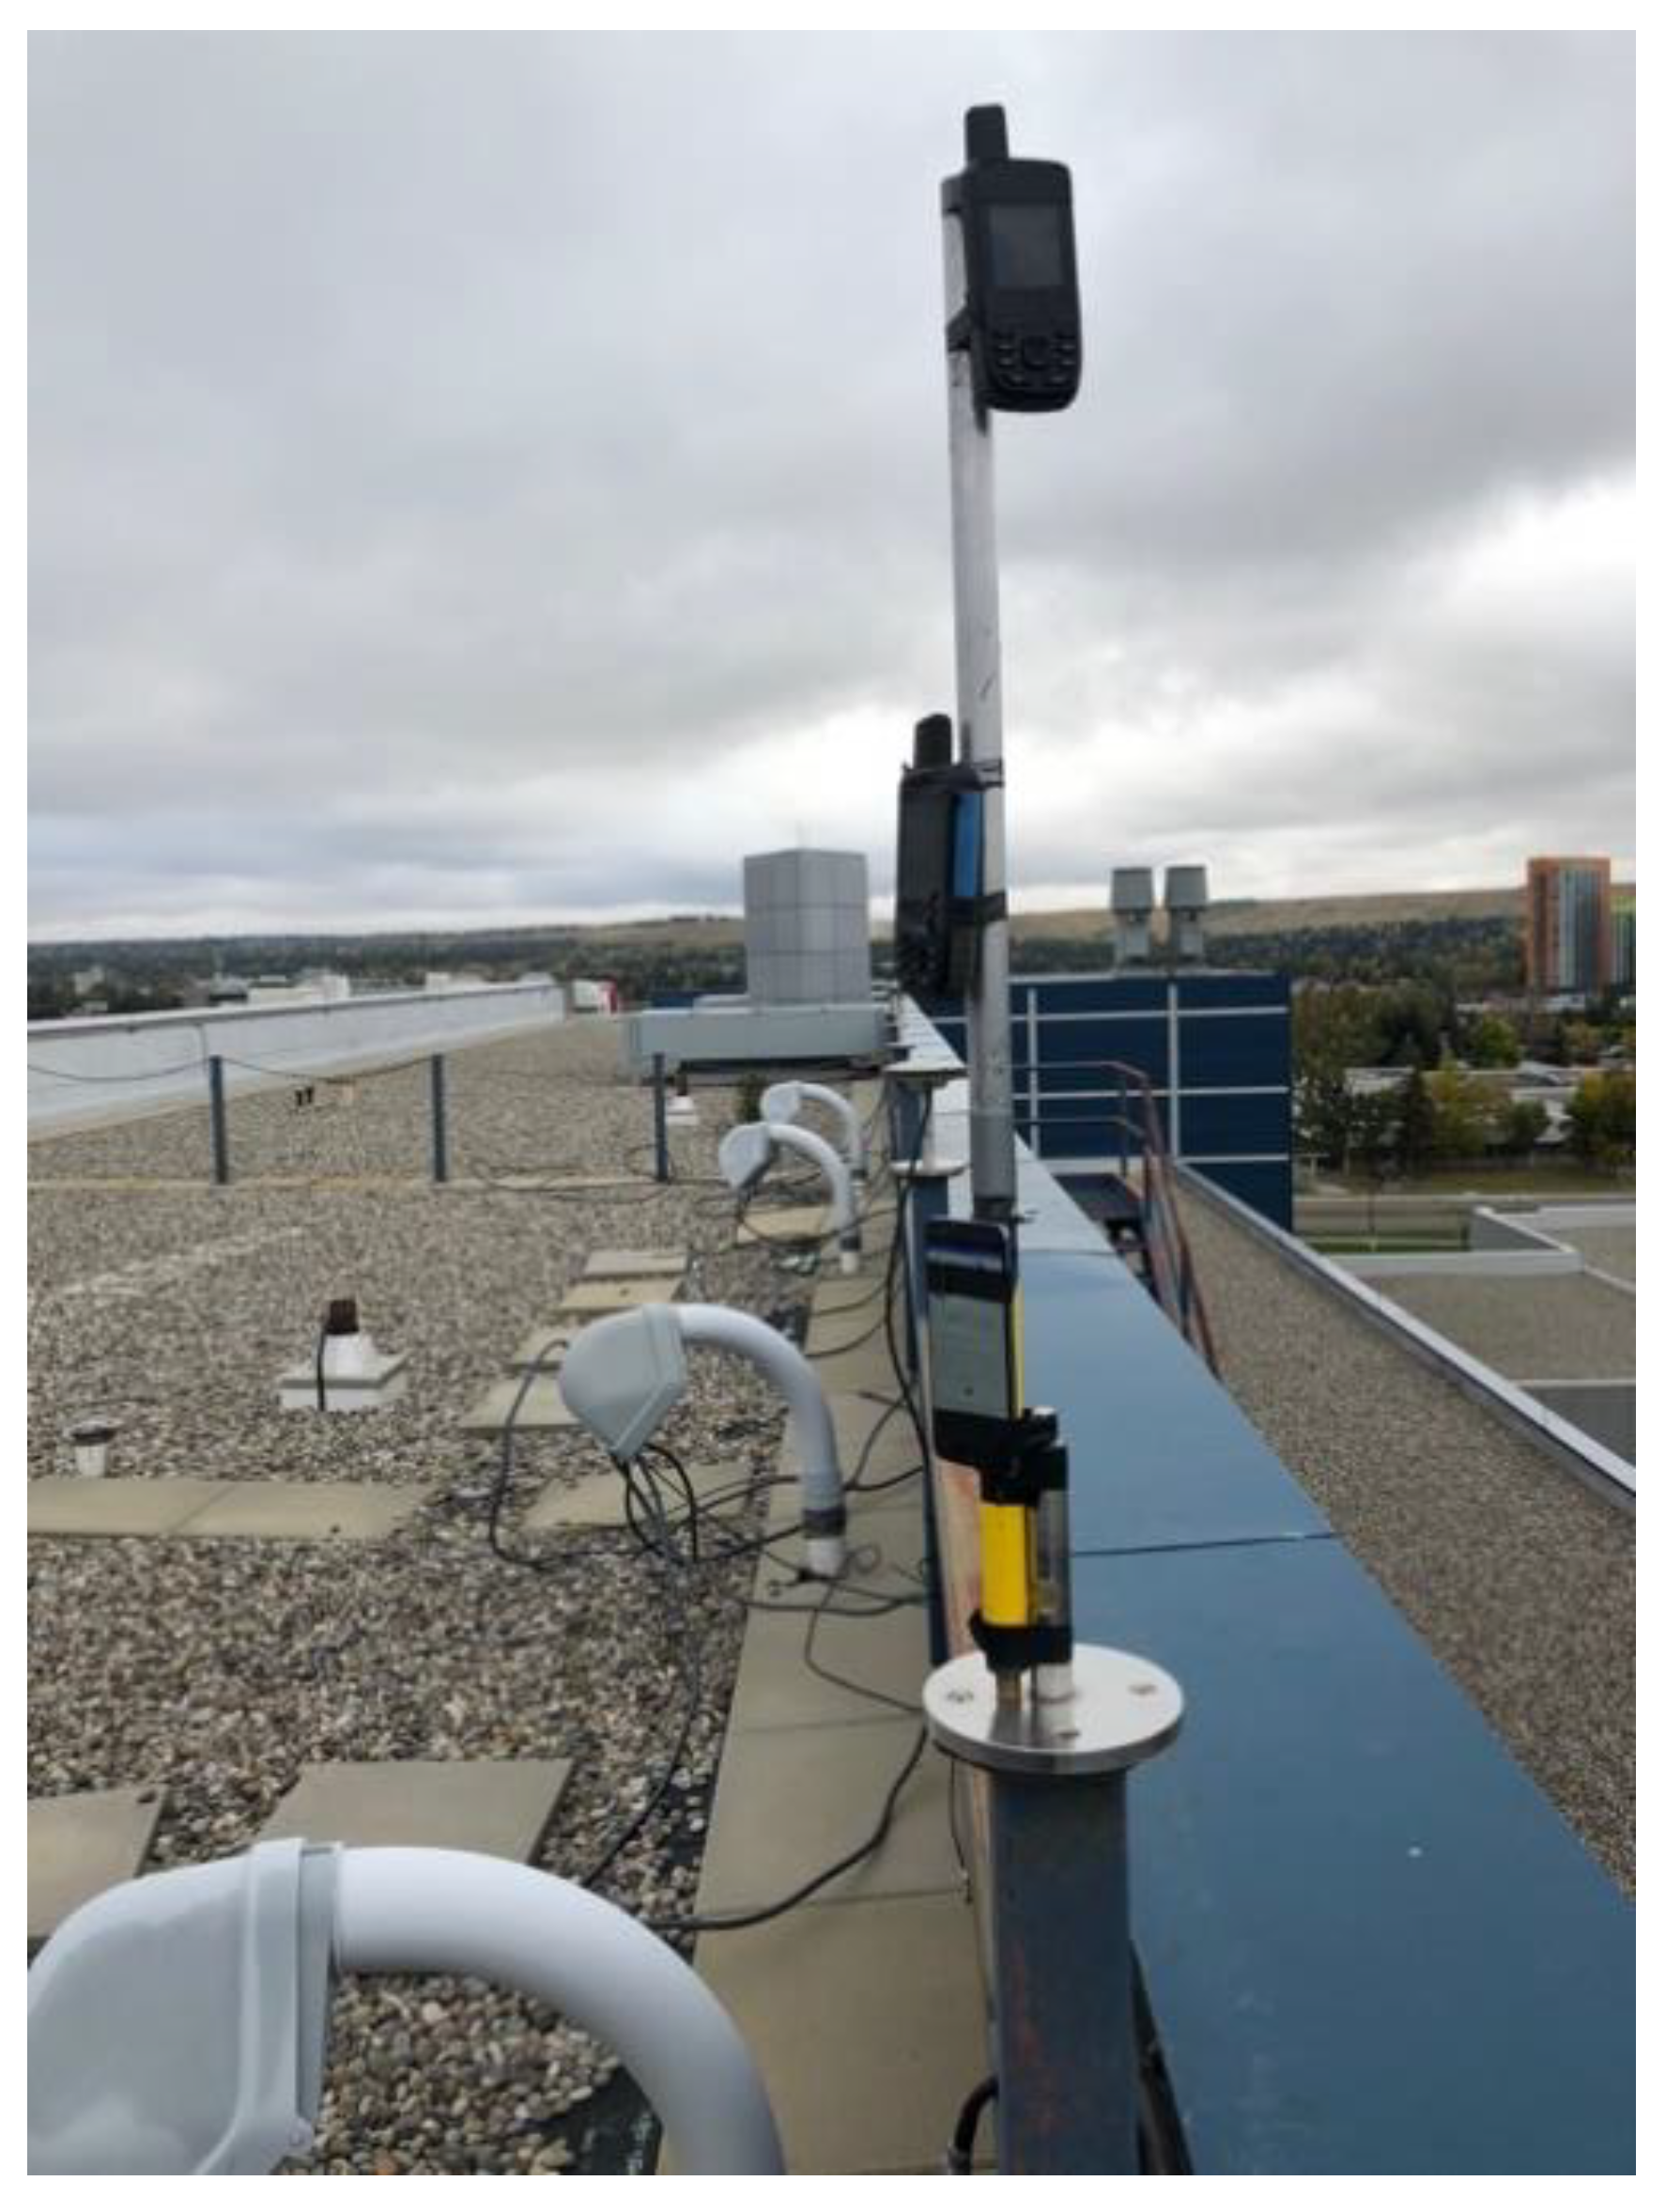
This test was carried out on the roof top of the CCIT building of the University of Calgary, a high multipath environment. The units were mounted on a vertical pole and separated by 30 cm as shown in
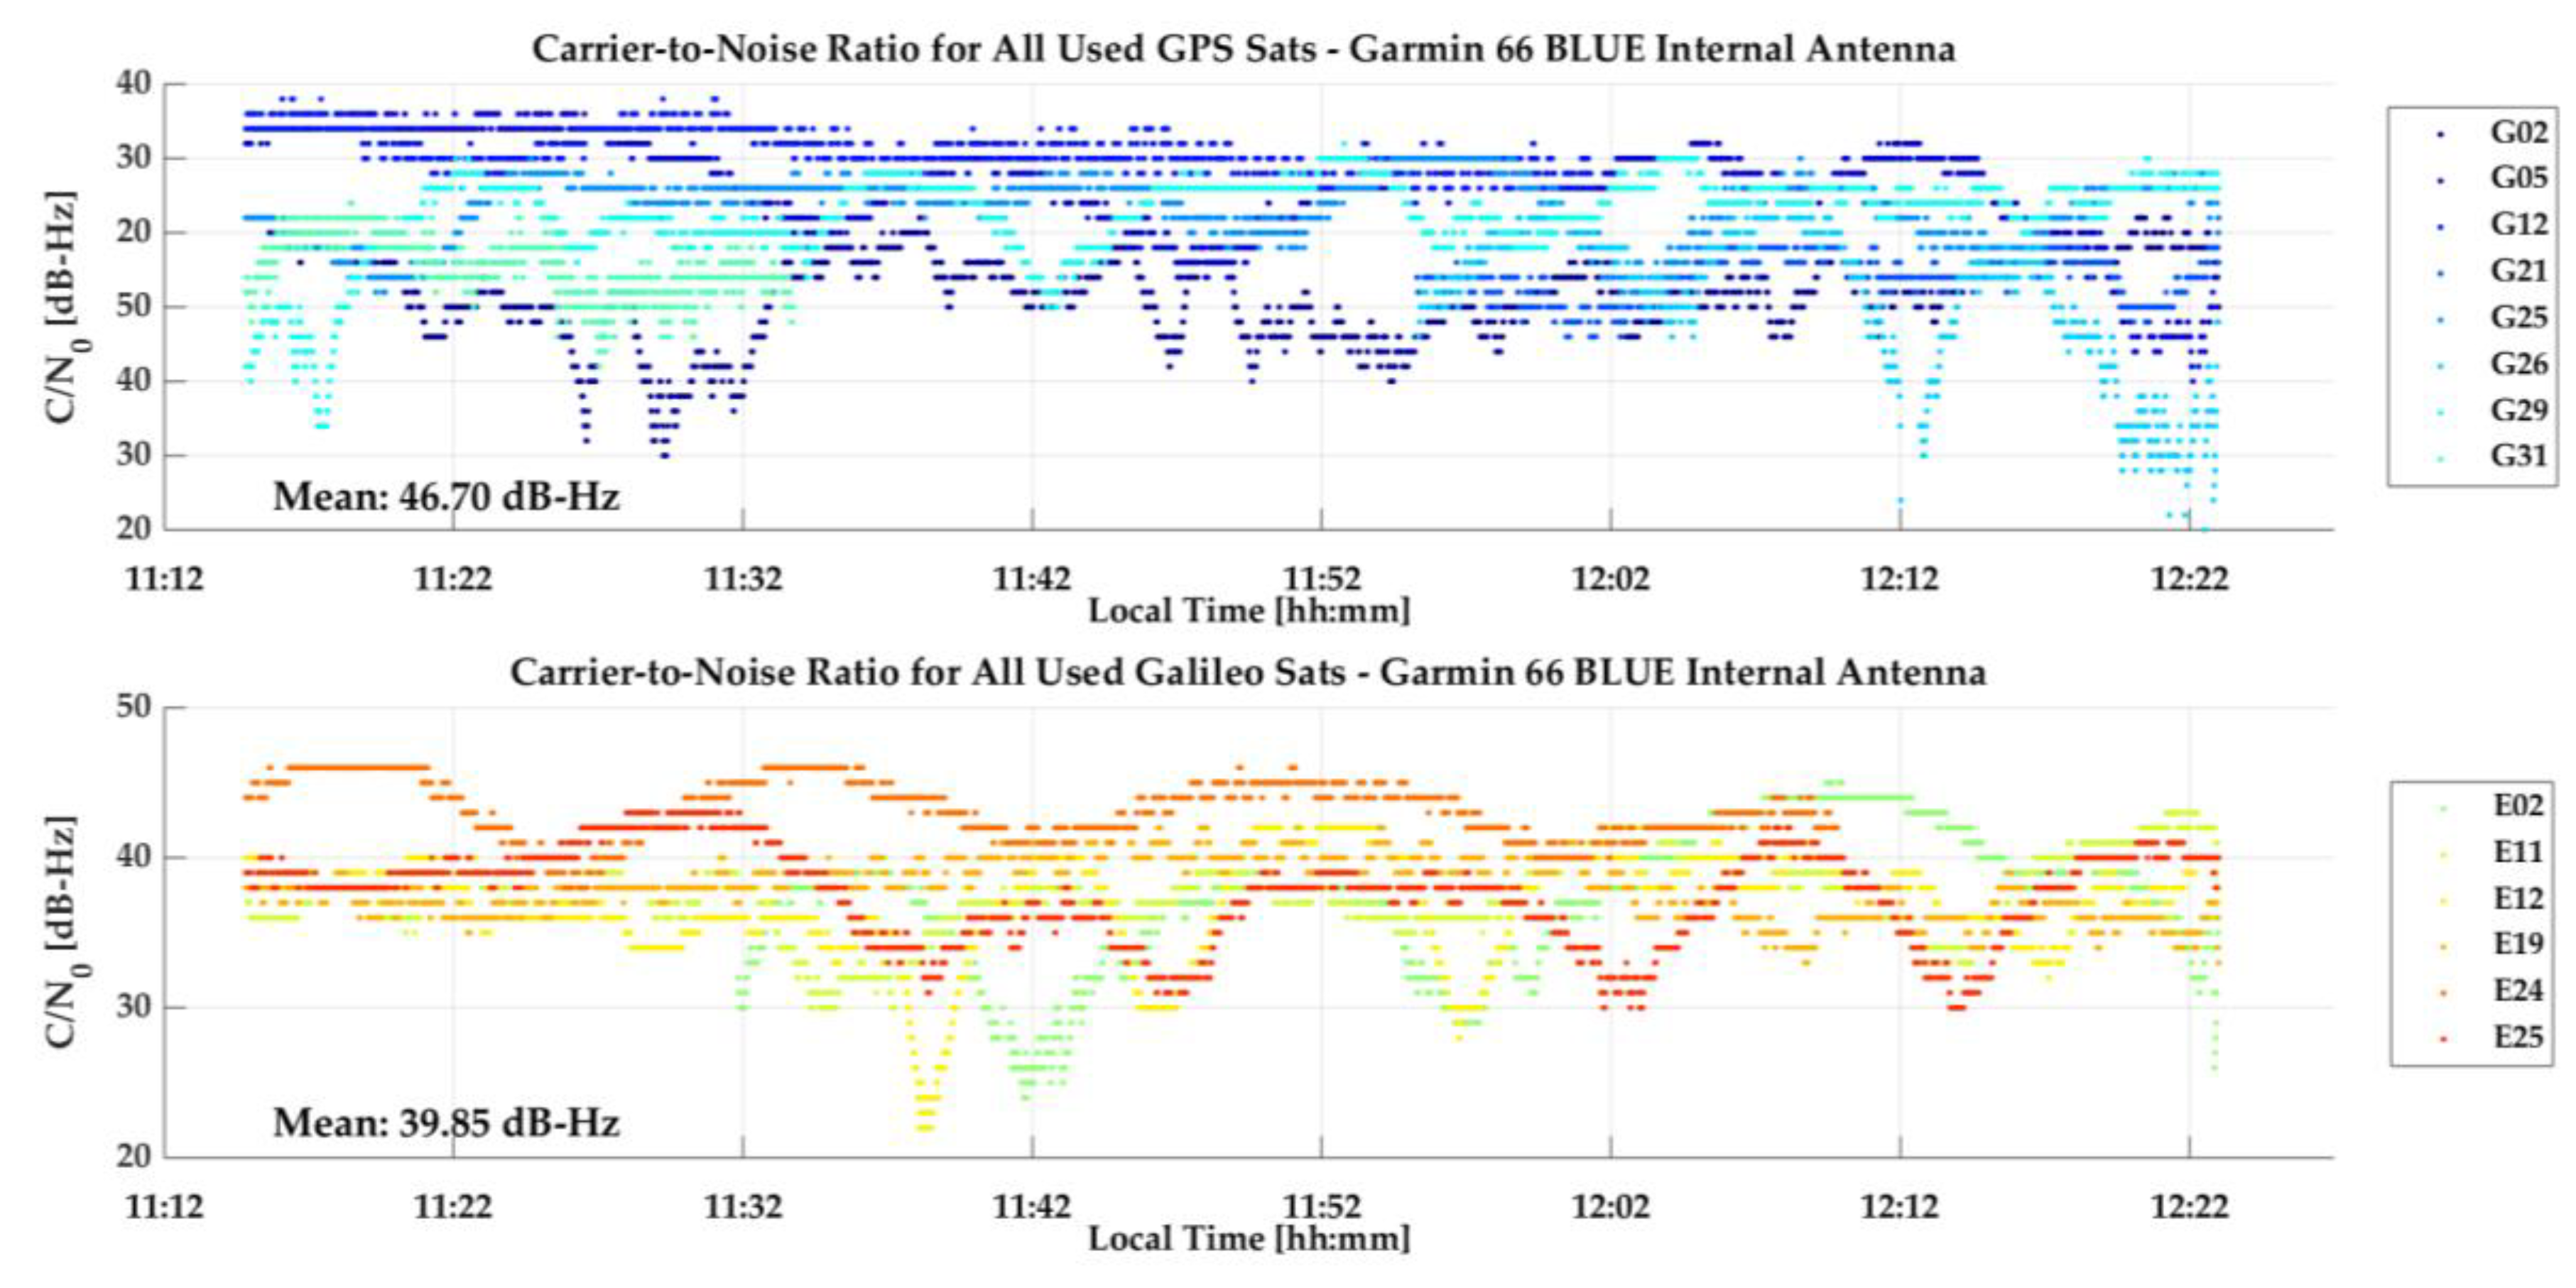
Figure 4, with the units’ own antennas, referred to as “internal” antennas in the sequel to distinguish them from the use of an external geodetic antenna as will be reported later. The observation period was selected to have Galileo coverage of up to five SVs with a PDOP of 3 or better. The GPS and Galileo measurements were processed separately in epoch-by-epoch L1 and E1 unfiltered kinematic code mode (using RTKLib). The GPS and Galileo C/N
0 measurements of the 66 blue unit are shown in
Figure 5. Cyclic attenuation of over 20 dB-Hz is characteristic of high specular multipath. Absolute C/N
0 differences between SVs are generally caused by SV elevation differences. The apparent higher attenuation of the limited Galileo constellation is due to its generally lower SVs elevation than many GPS SVs at this time.
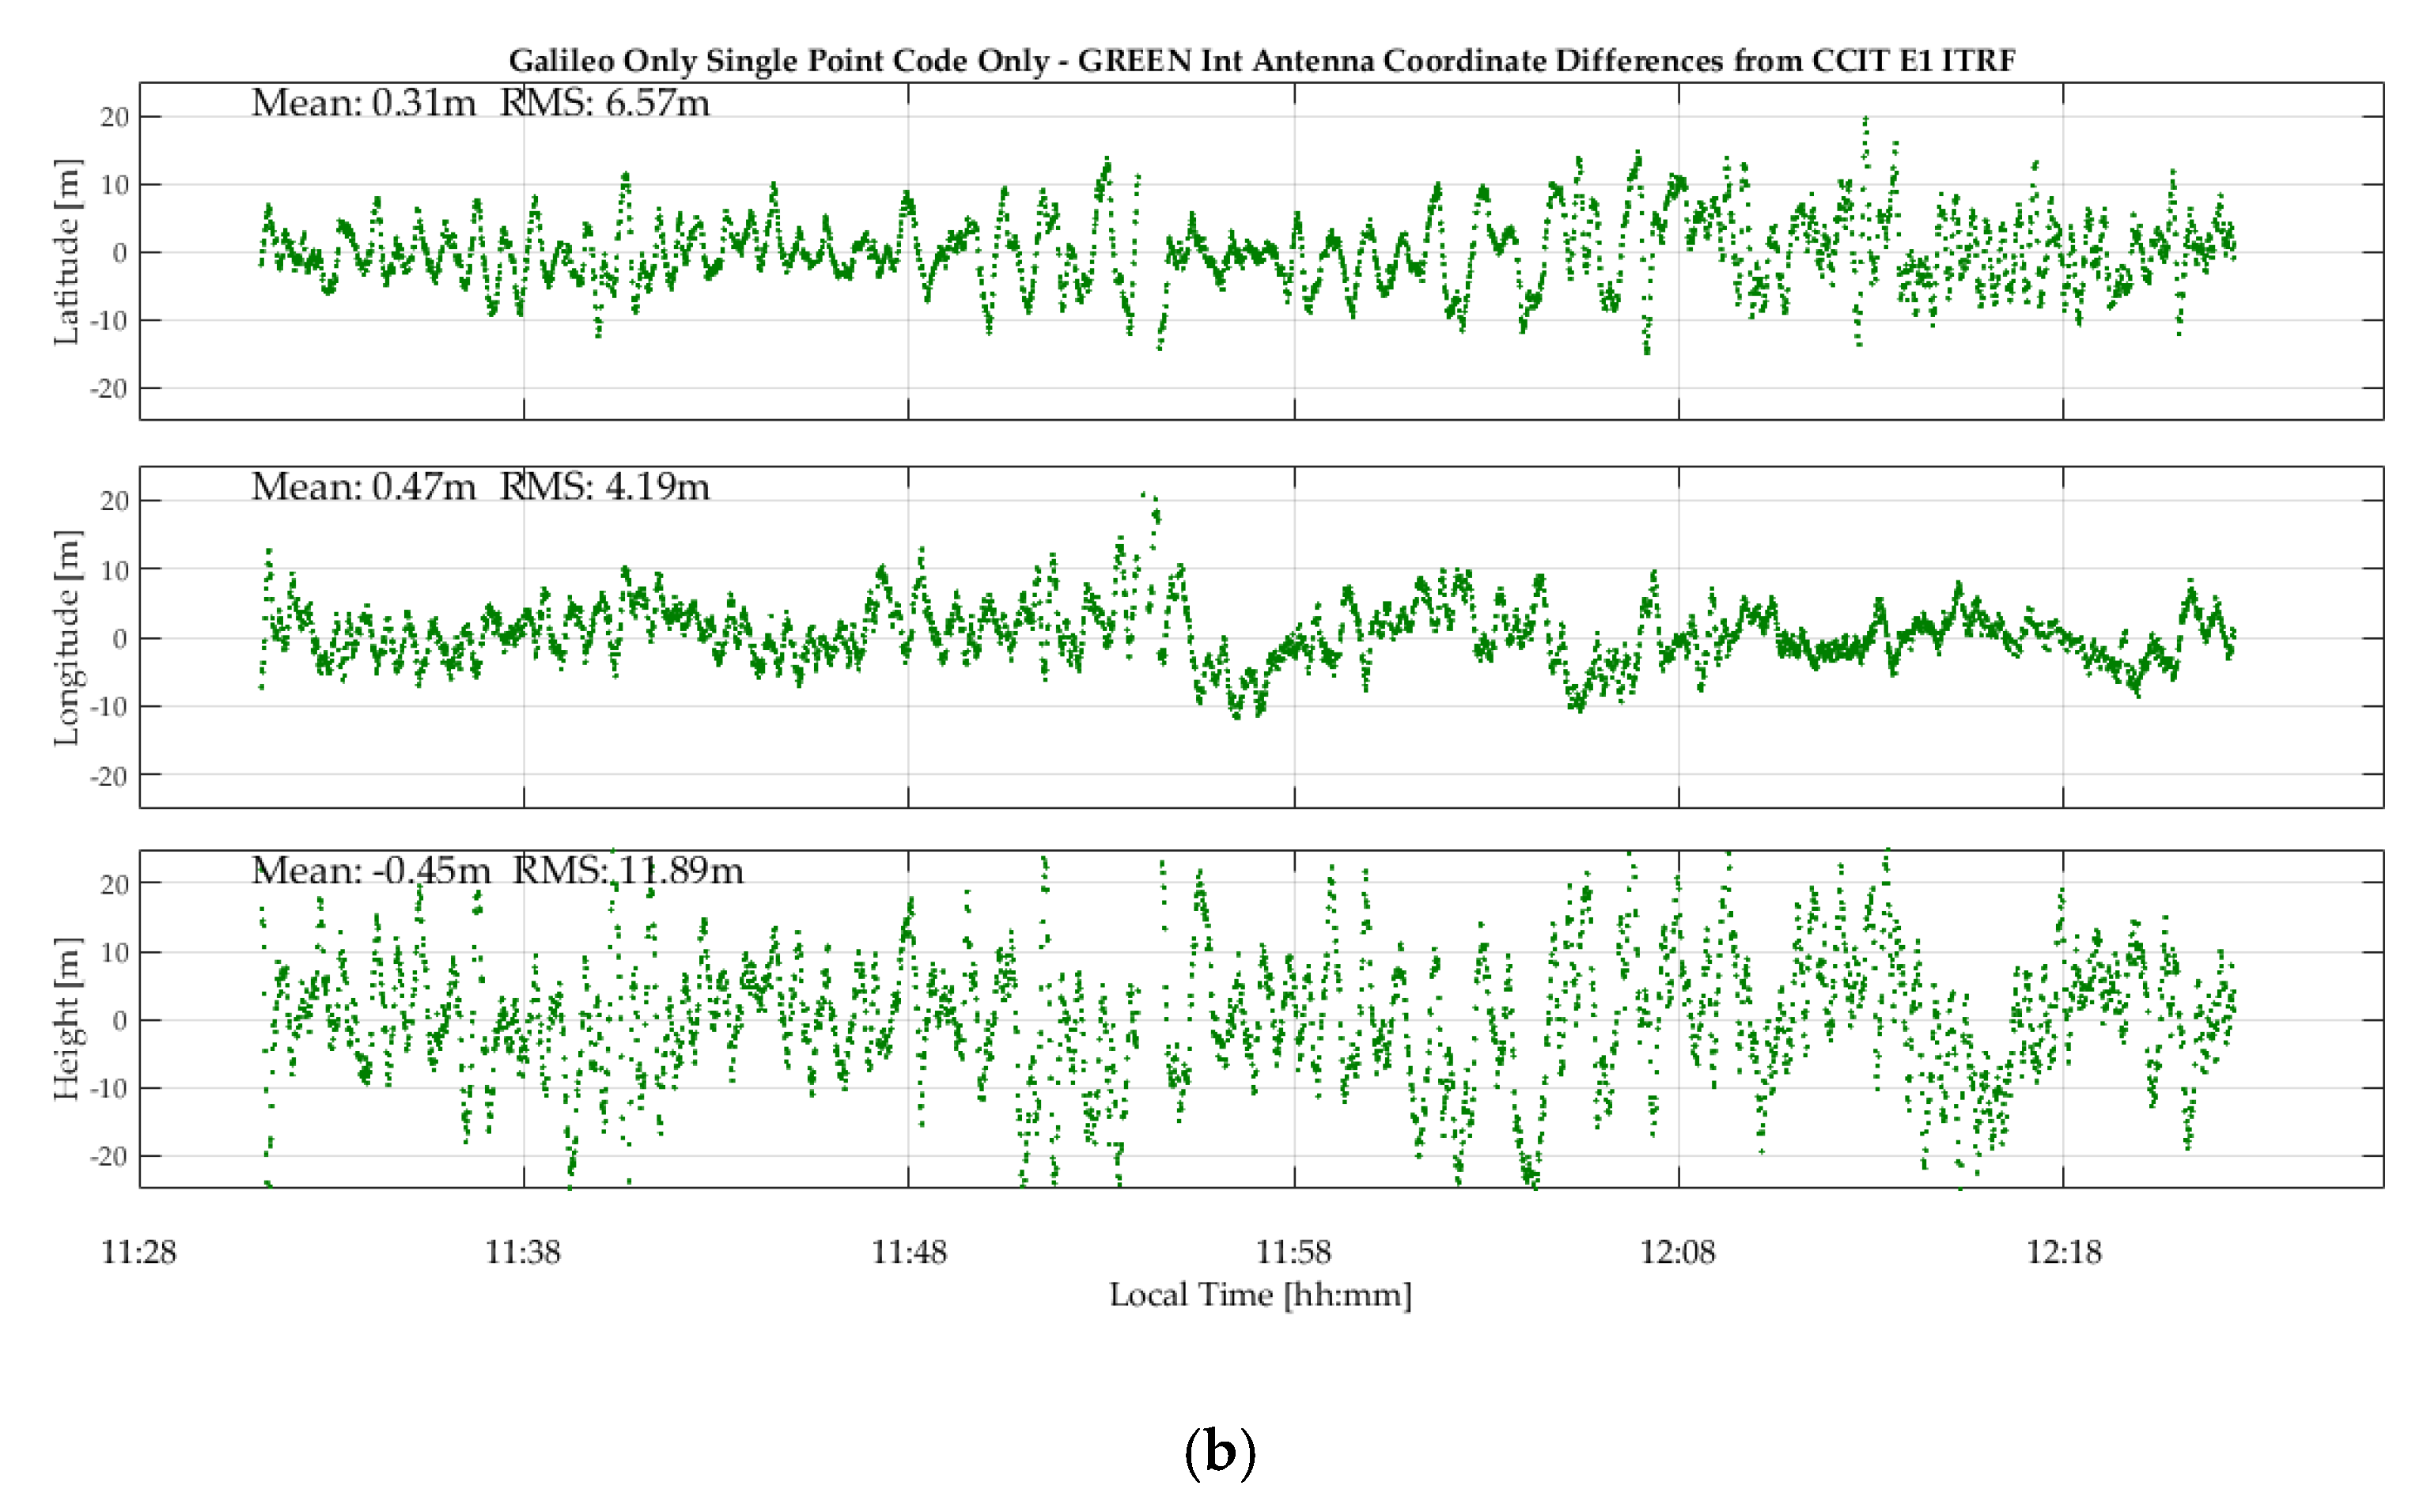
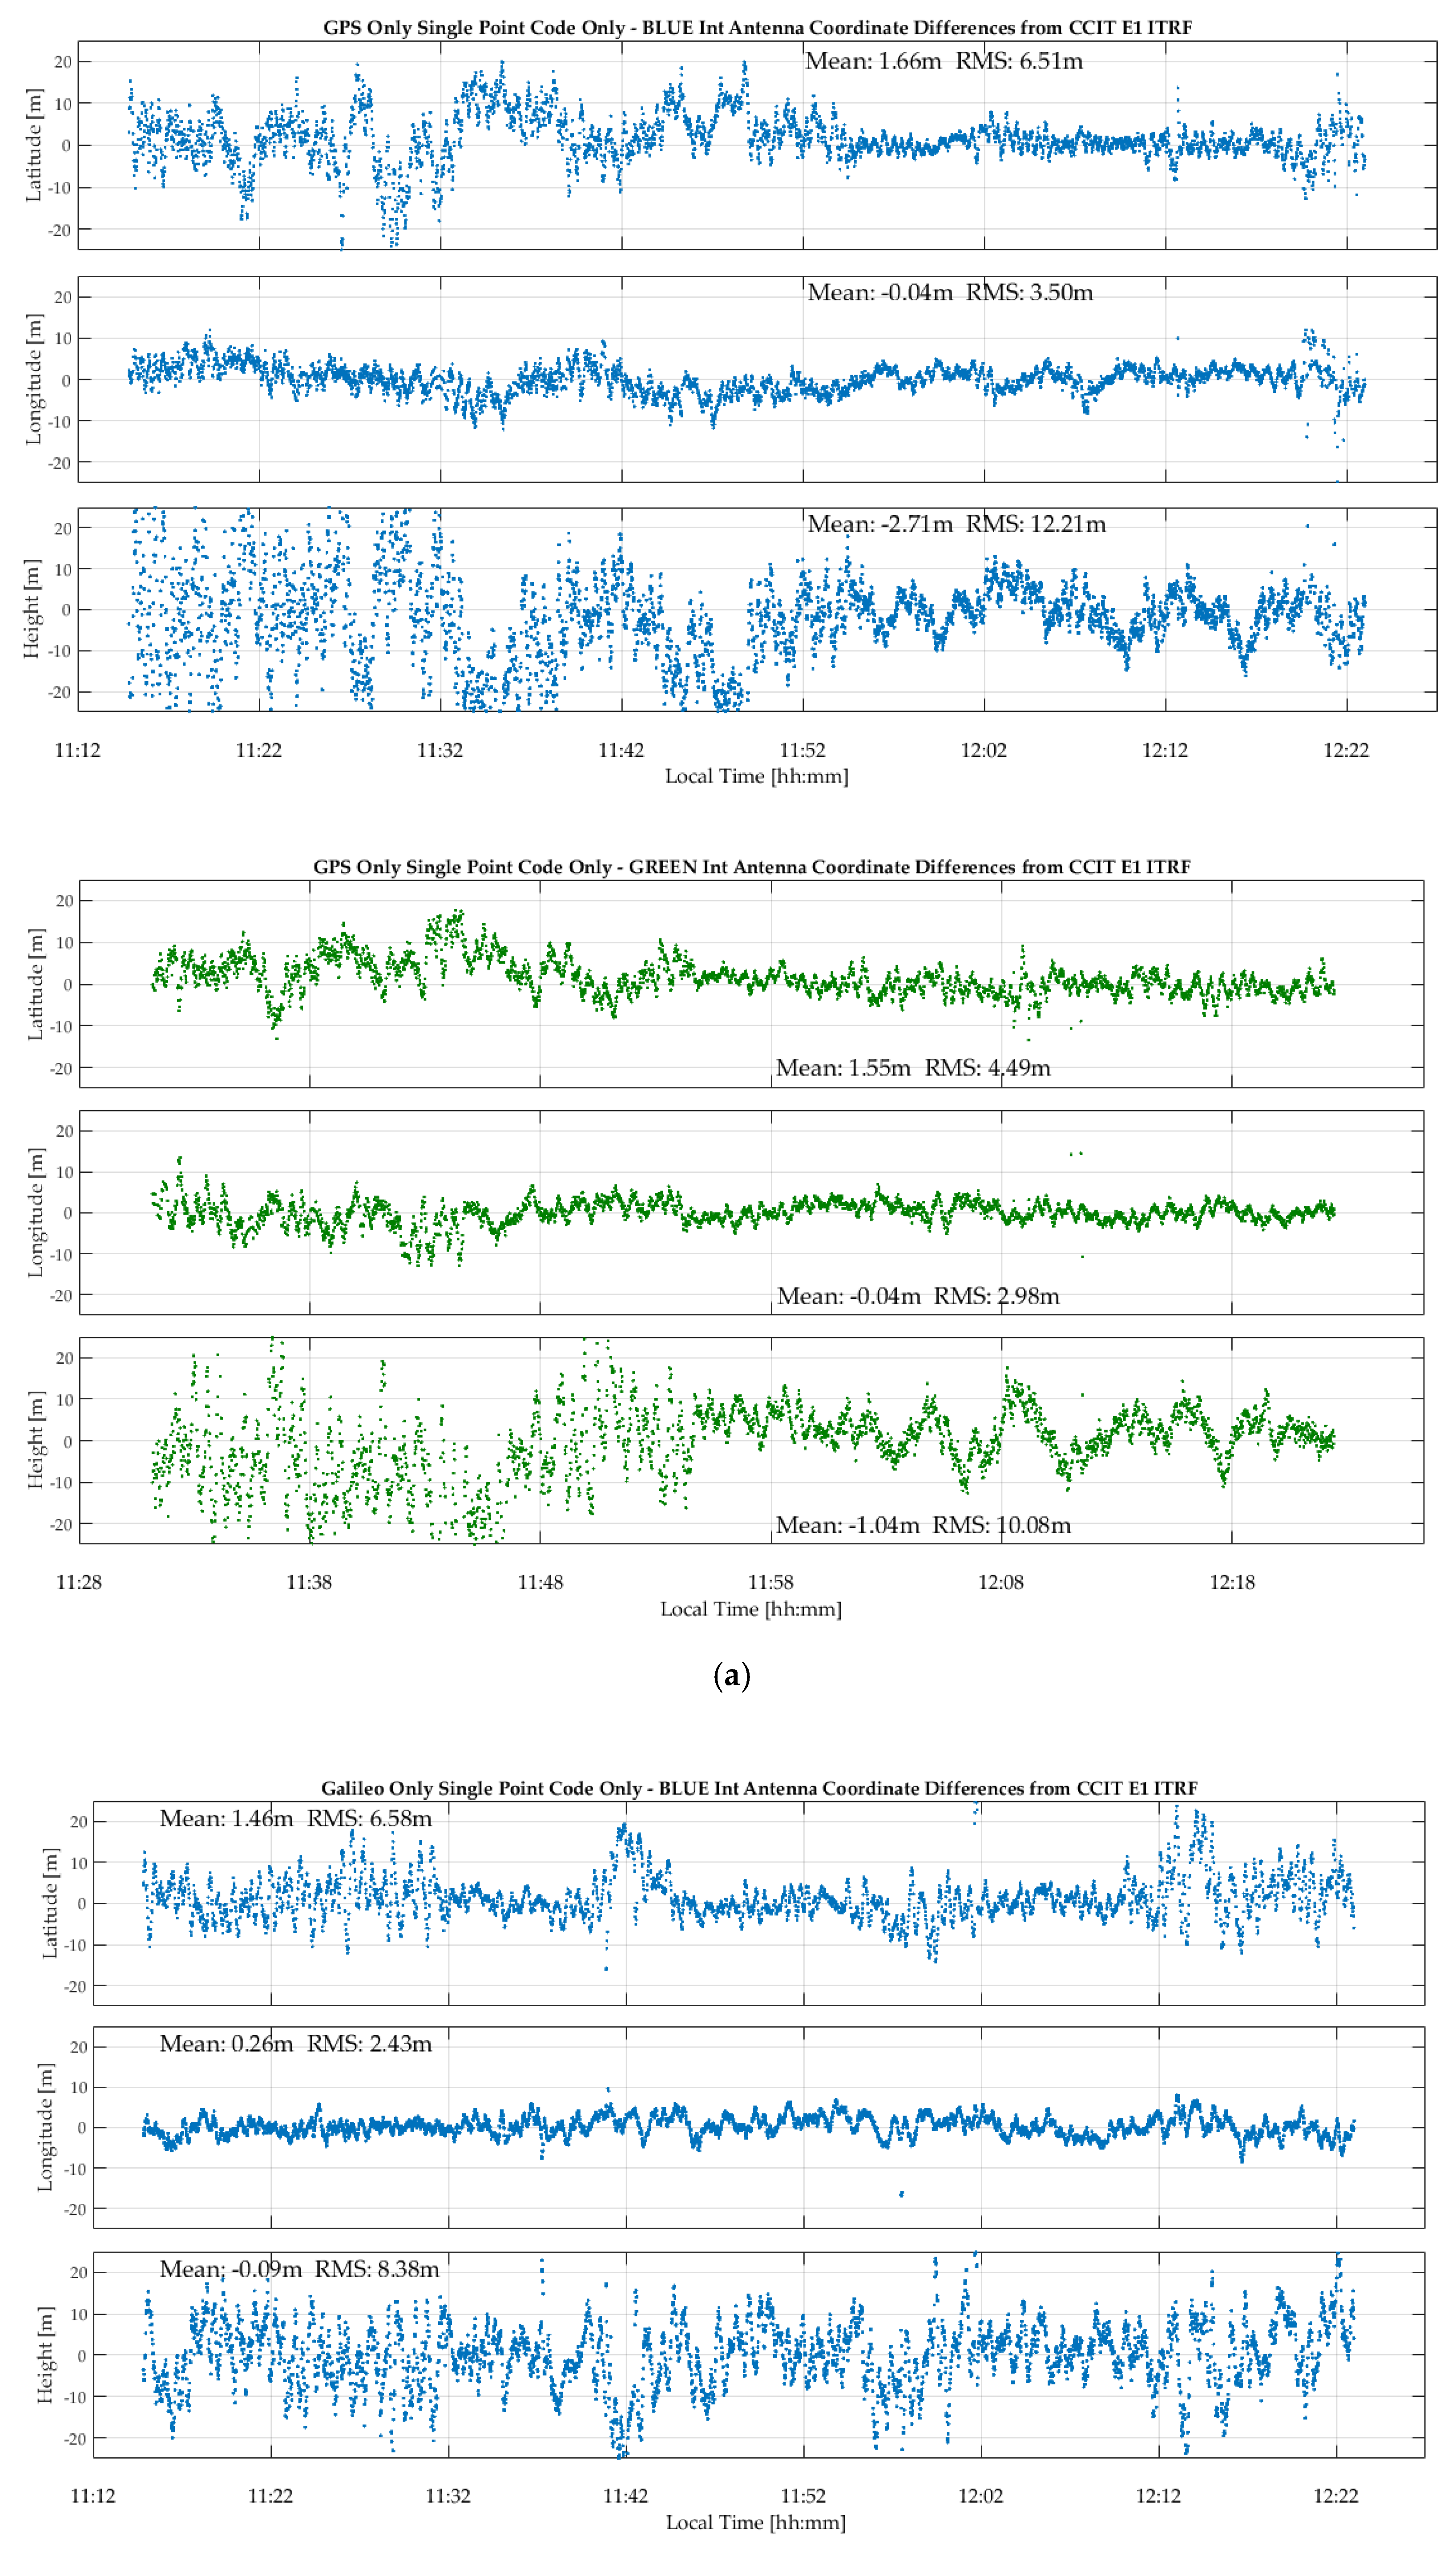
The corresponding GPS and Galileo epoch-by-epoch coordinates during the test period are shown in
Figure 6a,b, respectively. GPSMap 66 GPS latitude, longitude and height RMS values are 6.5, 3.5 and 12.2 m for the blue unit and 4.5, 3.0 and 10.1 m for the green unit. The higher height RMS values are expected due to normal height observability limitation and high multipath environment. Corresponding Galileo RMS values are 6.6, 2.4 and 8.4 m for the blue unit and 6.6, 4.2 and 11.9 m for the green unit, hence not significantly different from the GPS values. Cyclic coordinate variations are due to multipath as in the case of C/N
0 measurements. Since the coordinates are based on single-frequency measurements, the effect of the ionosphere would affect the average mean differences. However, given the high noise level, it is not possible to confirm any significant ionospheric effect, even on the height component, the more so during the current period of minimum solar activity. This reference point was observed frequently with the dual-frequency Trimble R10 during the month long period of the tests. The data was processed successively in L1 and L1/L2 mode and the resulting coordinate differences, a direct measure of the effect of the ionosphere on coordinates, were consistently lower than 10 cm. No significant biases are observed between these coordinates and the ITRF 2014 reference coordinates of the observation point.
Since the two GPSMap 66 units were collecting data at the same time, the results, within the noise level, should be the same. However, the units were separated in height by 30 cm and affected by different multipath. This spatial difference is the main reason for the slightly different results between the two units. Despite the limited number of Galileo SVs, the results are not significantly different from GPS results. Given the high multipath, the potential advantage of the higher number of GPS SVs is buried in noise.
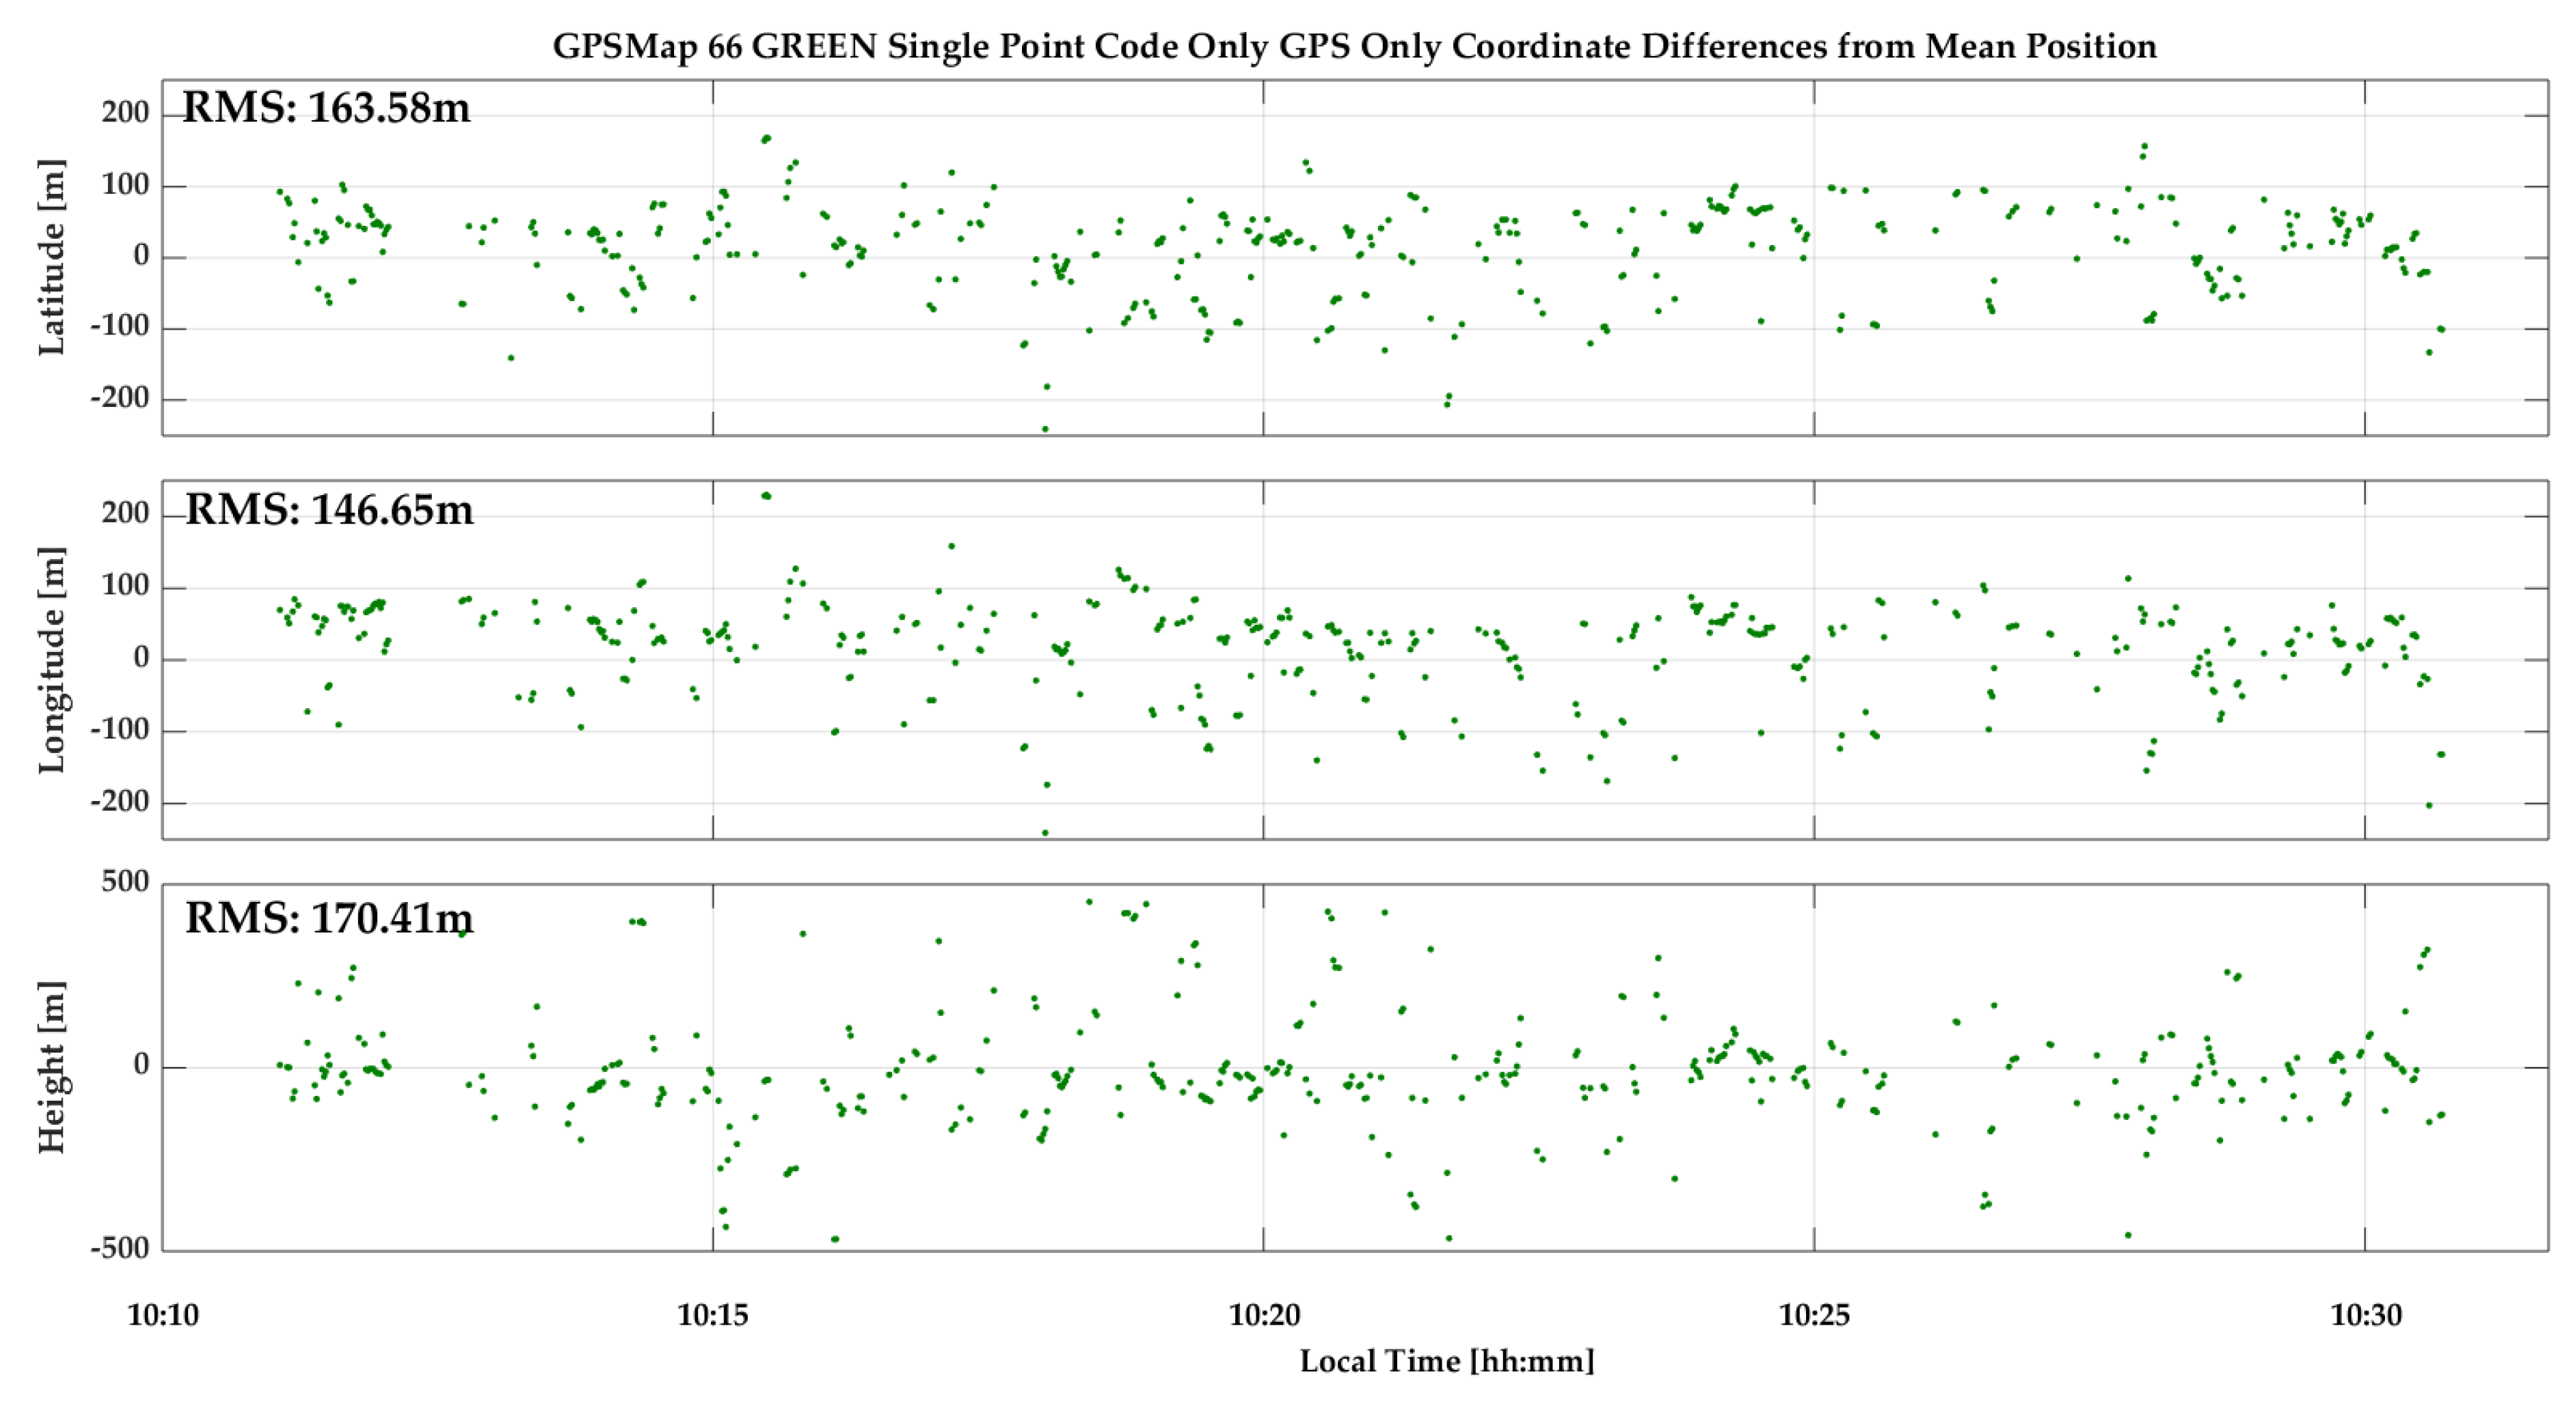
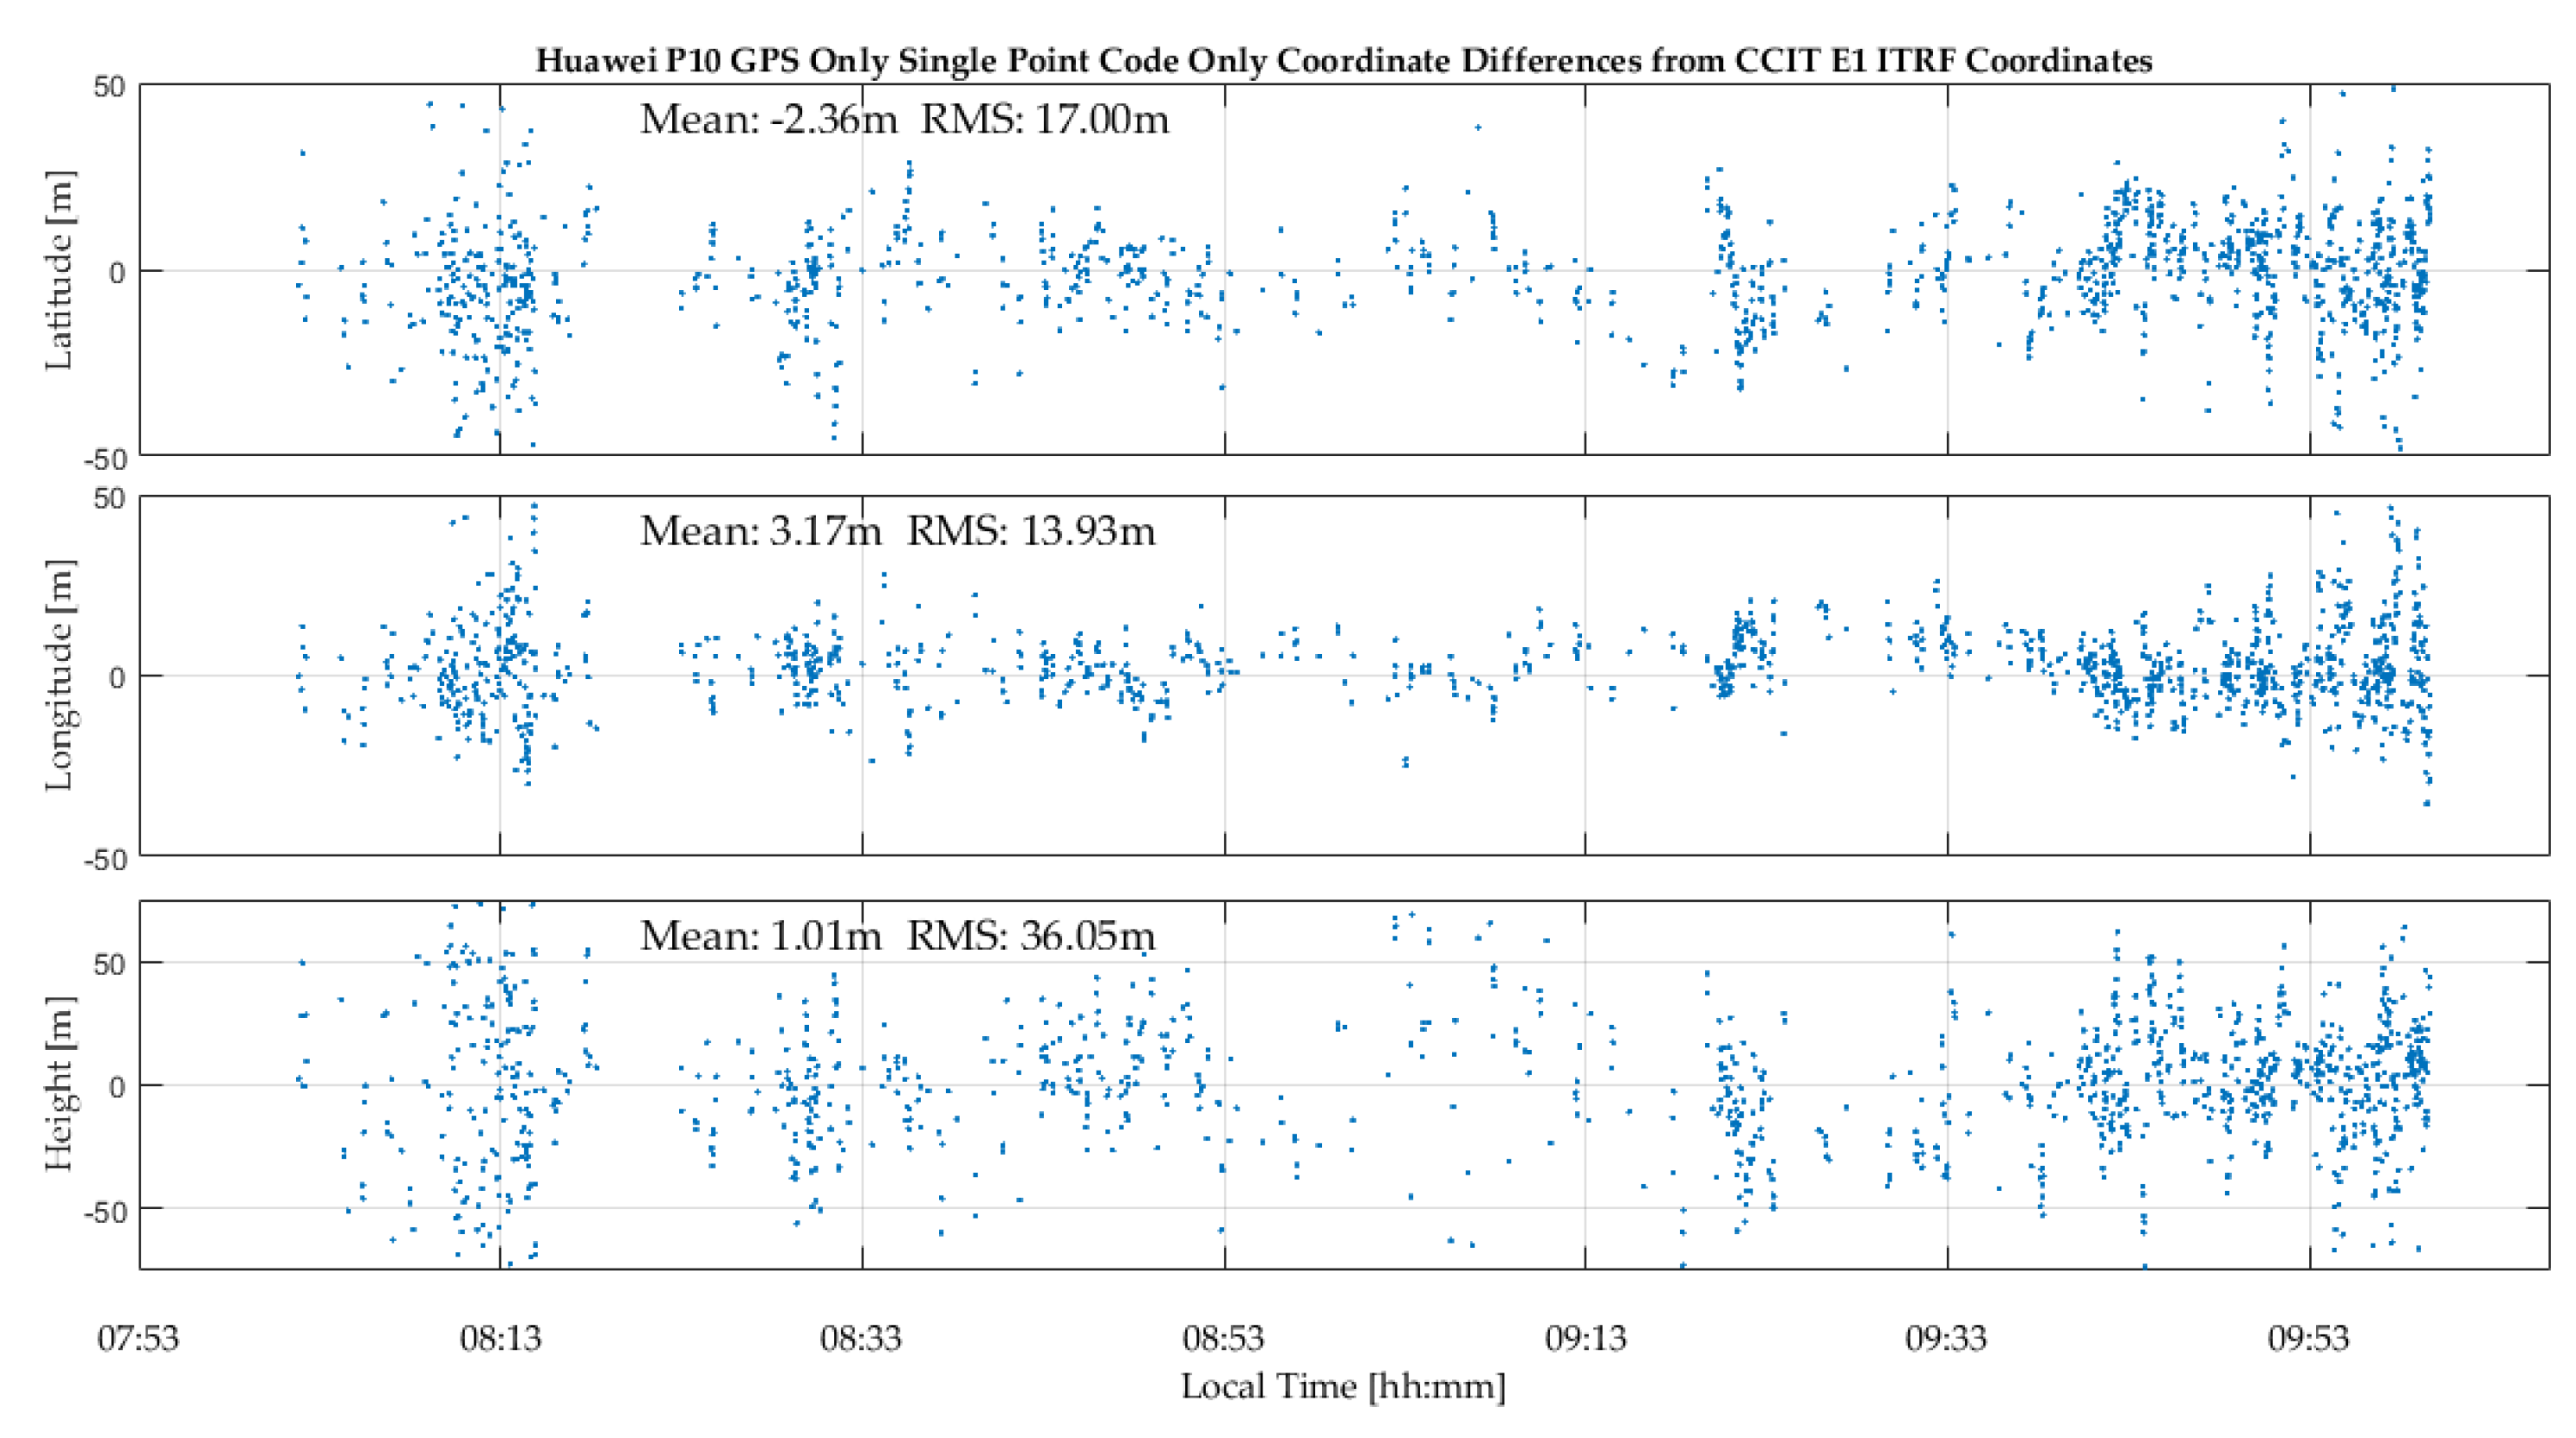
The P10 results for the above test resulted in discontinuous GPS positions and a limited number of Galileo SVs being tracked. Sub-optimal P10 GNSS data recording during the tests reported in this paper occurred frequently. A previous test, whose GPS results are shown in
Figure 7, produced continuous results. In the high multipath environment shown in
Figure 4, the P10 antenna is not as effective as the GPSMap 66 to deal with multipath and the resulting position coordinate noise is relatively high.
Use of External Geodetic Antenna
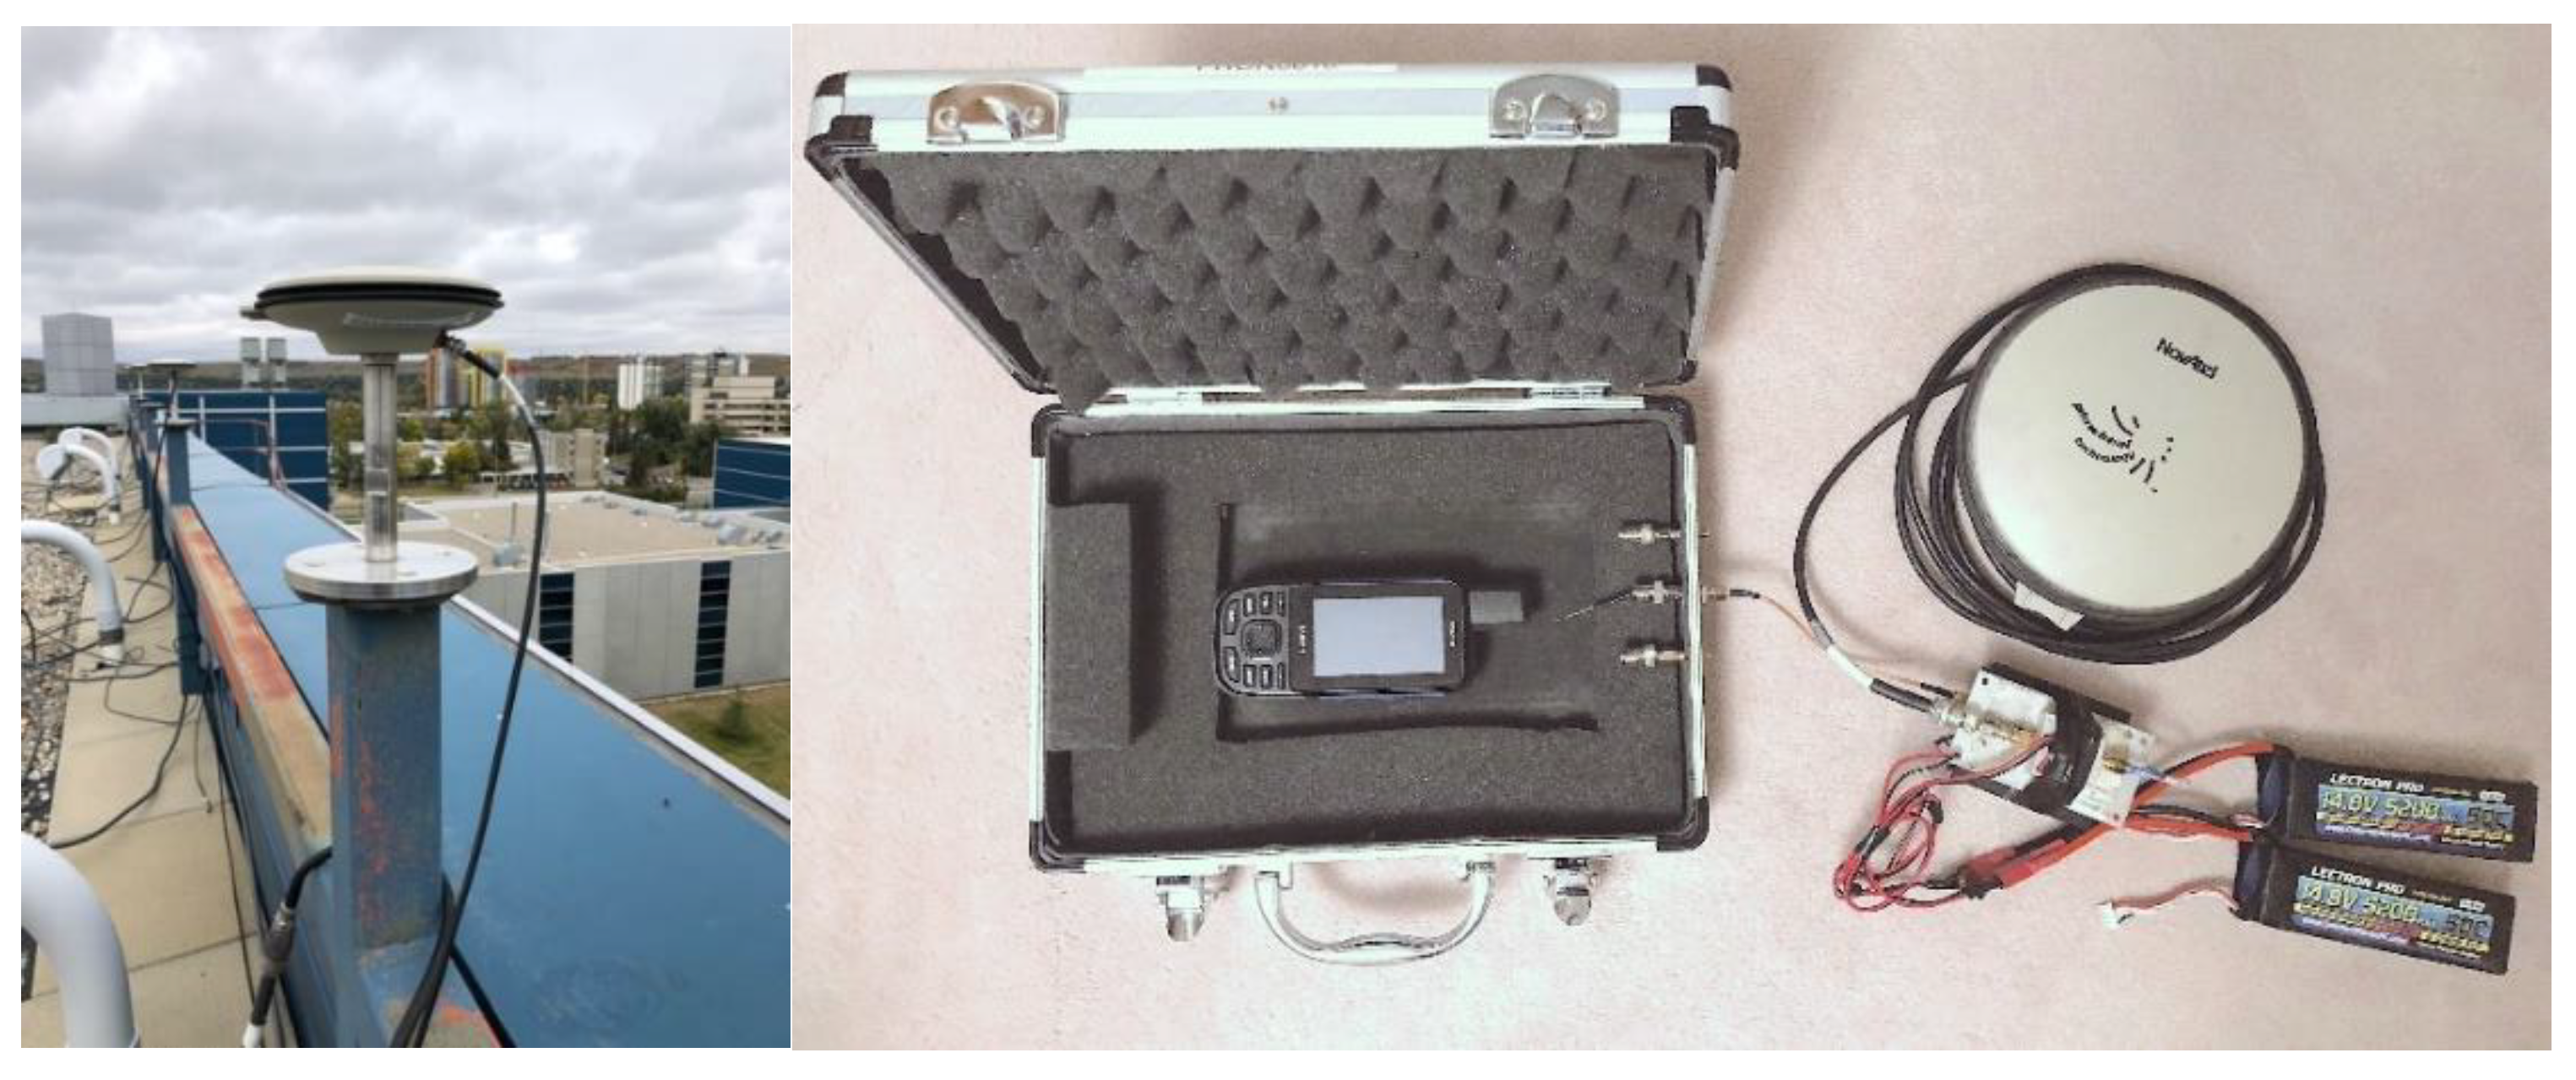
The above test was repeated with one GPSMap 66 unit using an external geodetic antenna, namely the NovAtel 702-GG model (NovAtel Inc, Calgary, AB, Canada) at the same location as shown in
Figure 8 (left). This test was done to demonstrate antenna importance in such a high multipath environment. The GPSMap 66 and P10 units do not have connectors for an external antenna. The procedure to use the external antenna in the absence of a wired connection is fully described in [
3] during evaluation of the Huawei Mate 9. The 702-GG was connected to a metallic box with its open-ended wire re-transmitting inside where the unit under test locked on the 702-GG signals. The inside of the box was lined with RF absorbent material to further decrease the strength of signals that may be coming directly from the outside through the box walls and slits. The hardware assembly is shown on the right side of
Figure 8. The issue of the potential effect of re-radiation inside the box was analysed by [
5] and no effect was detected, therefore validating the above procedure.
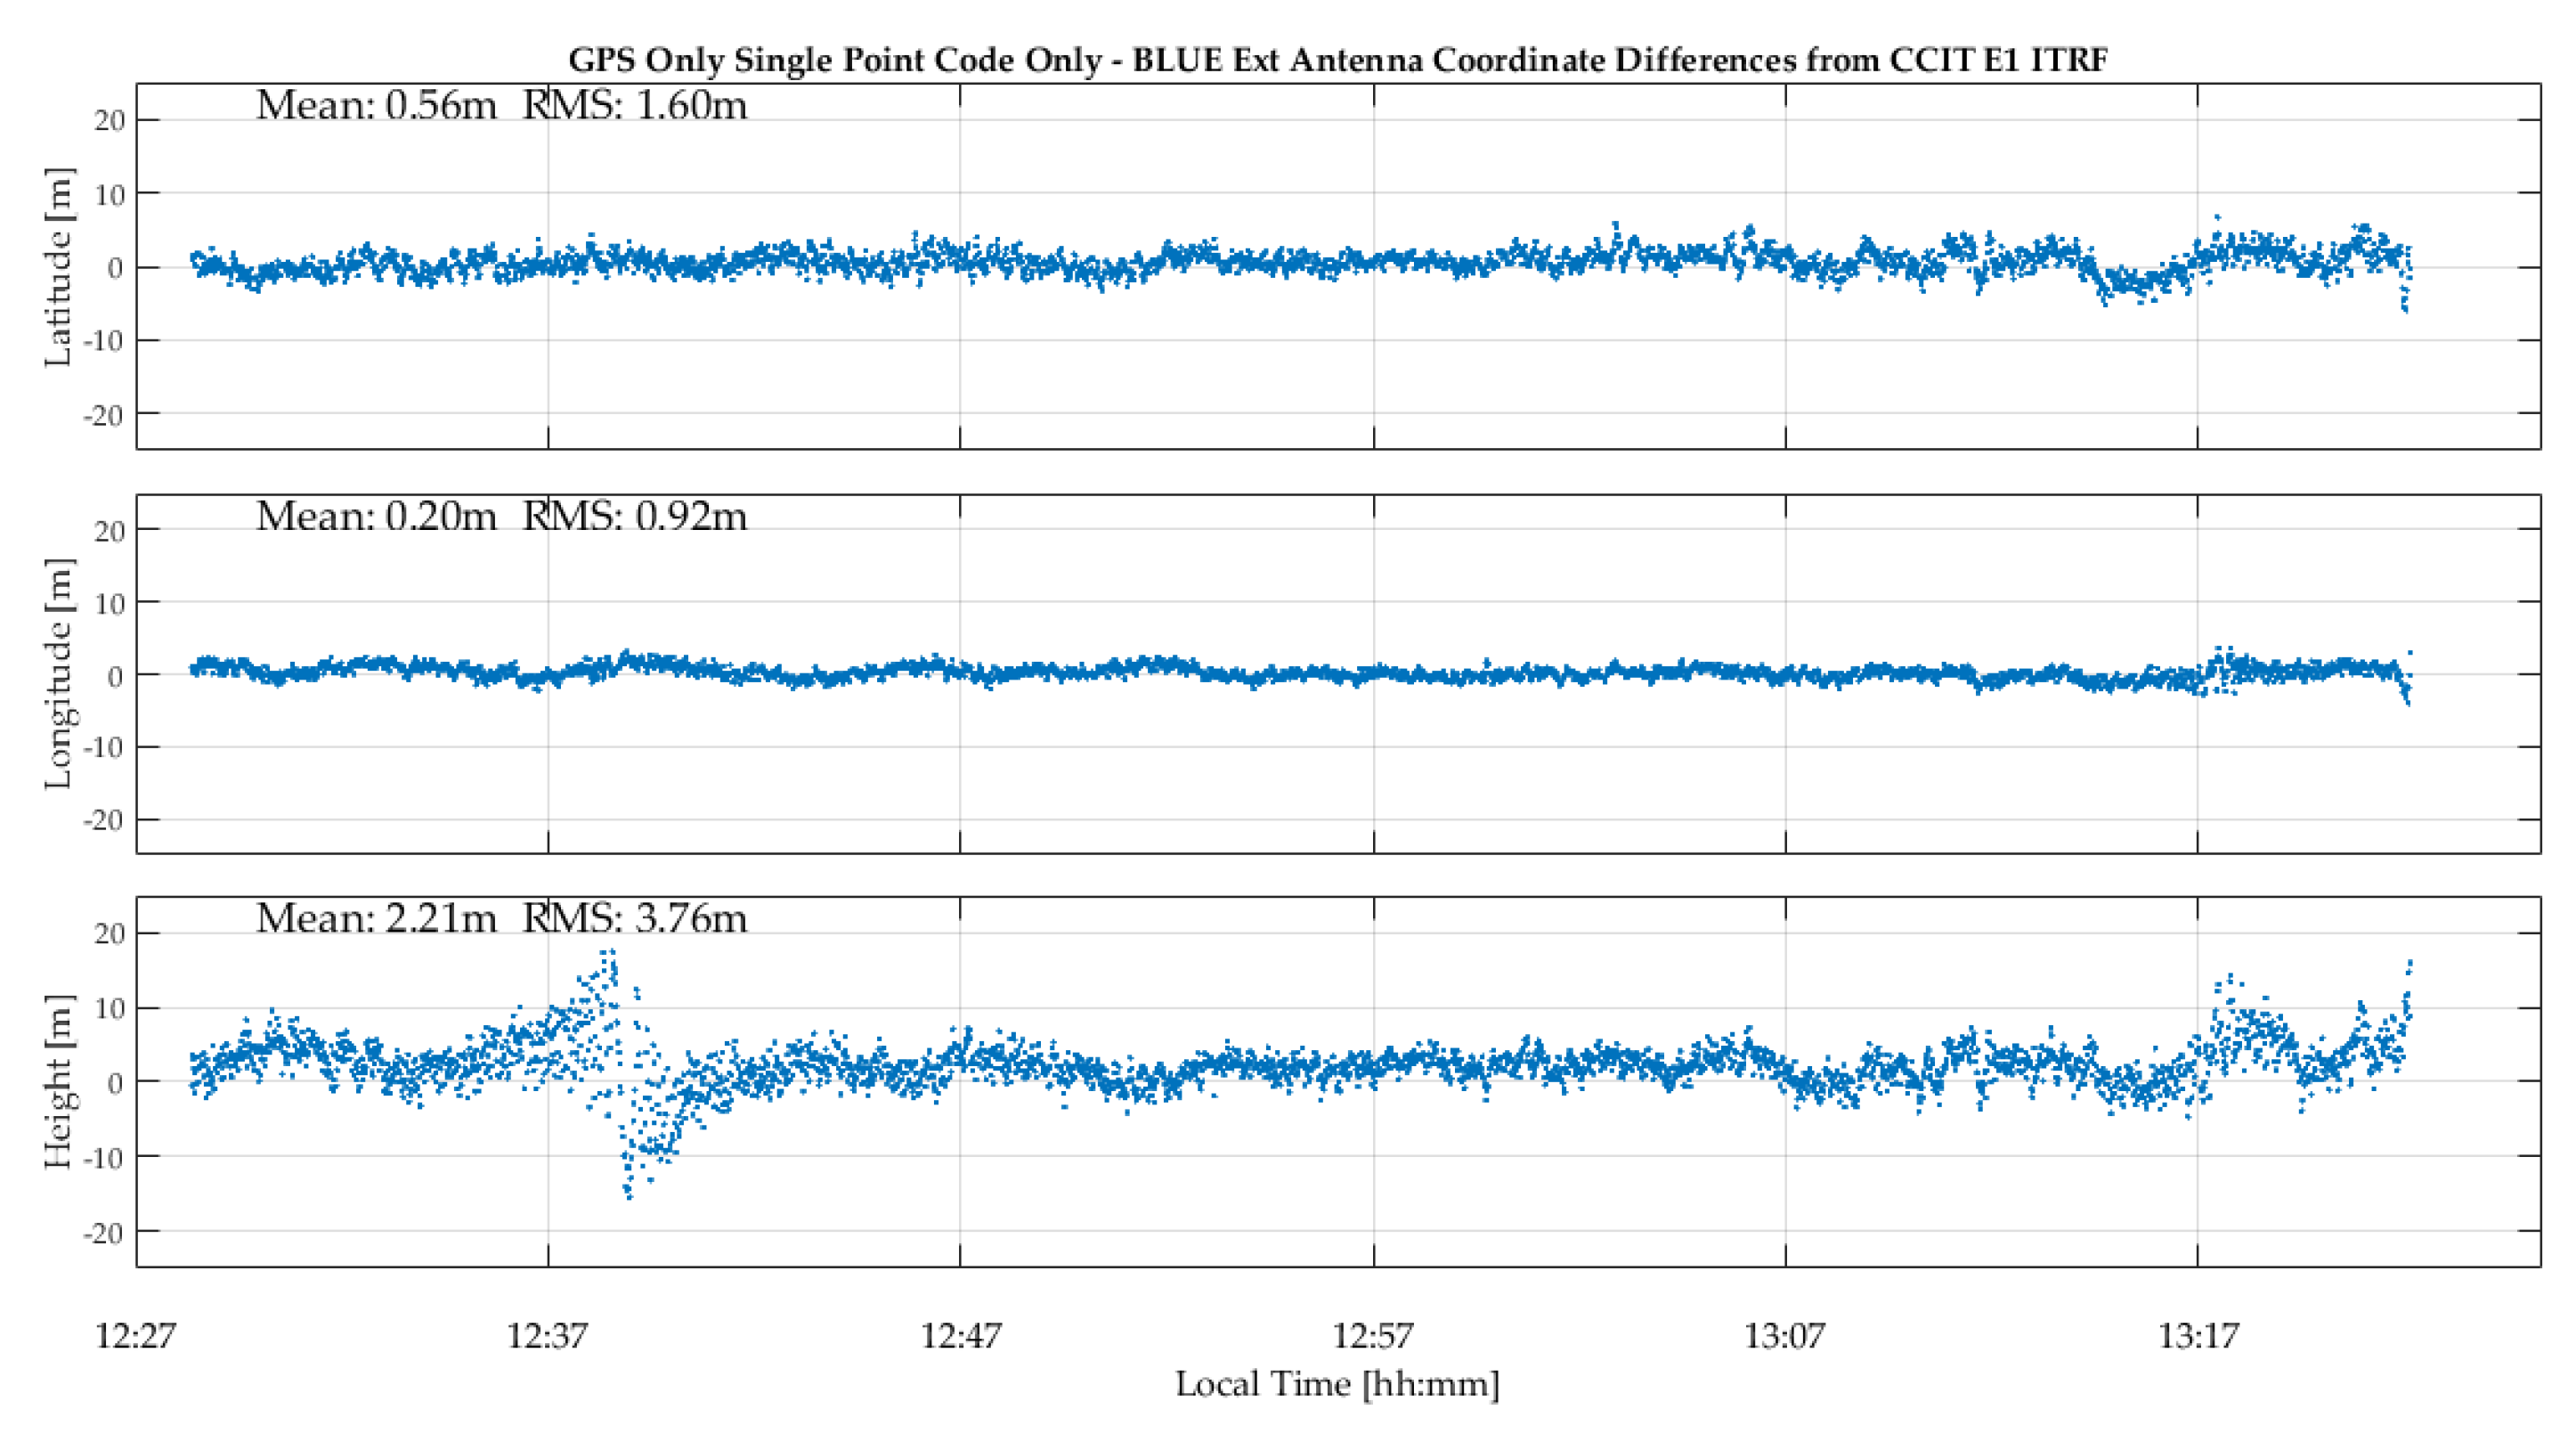
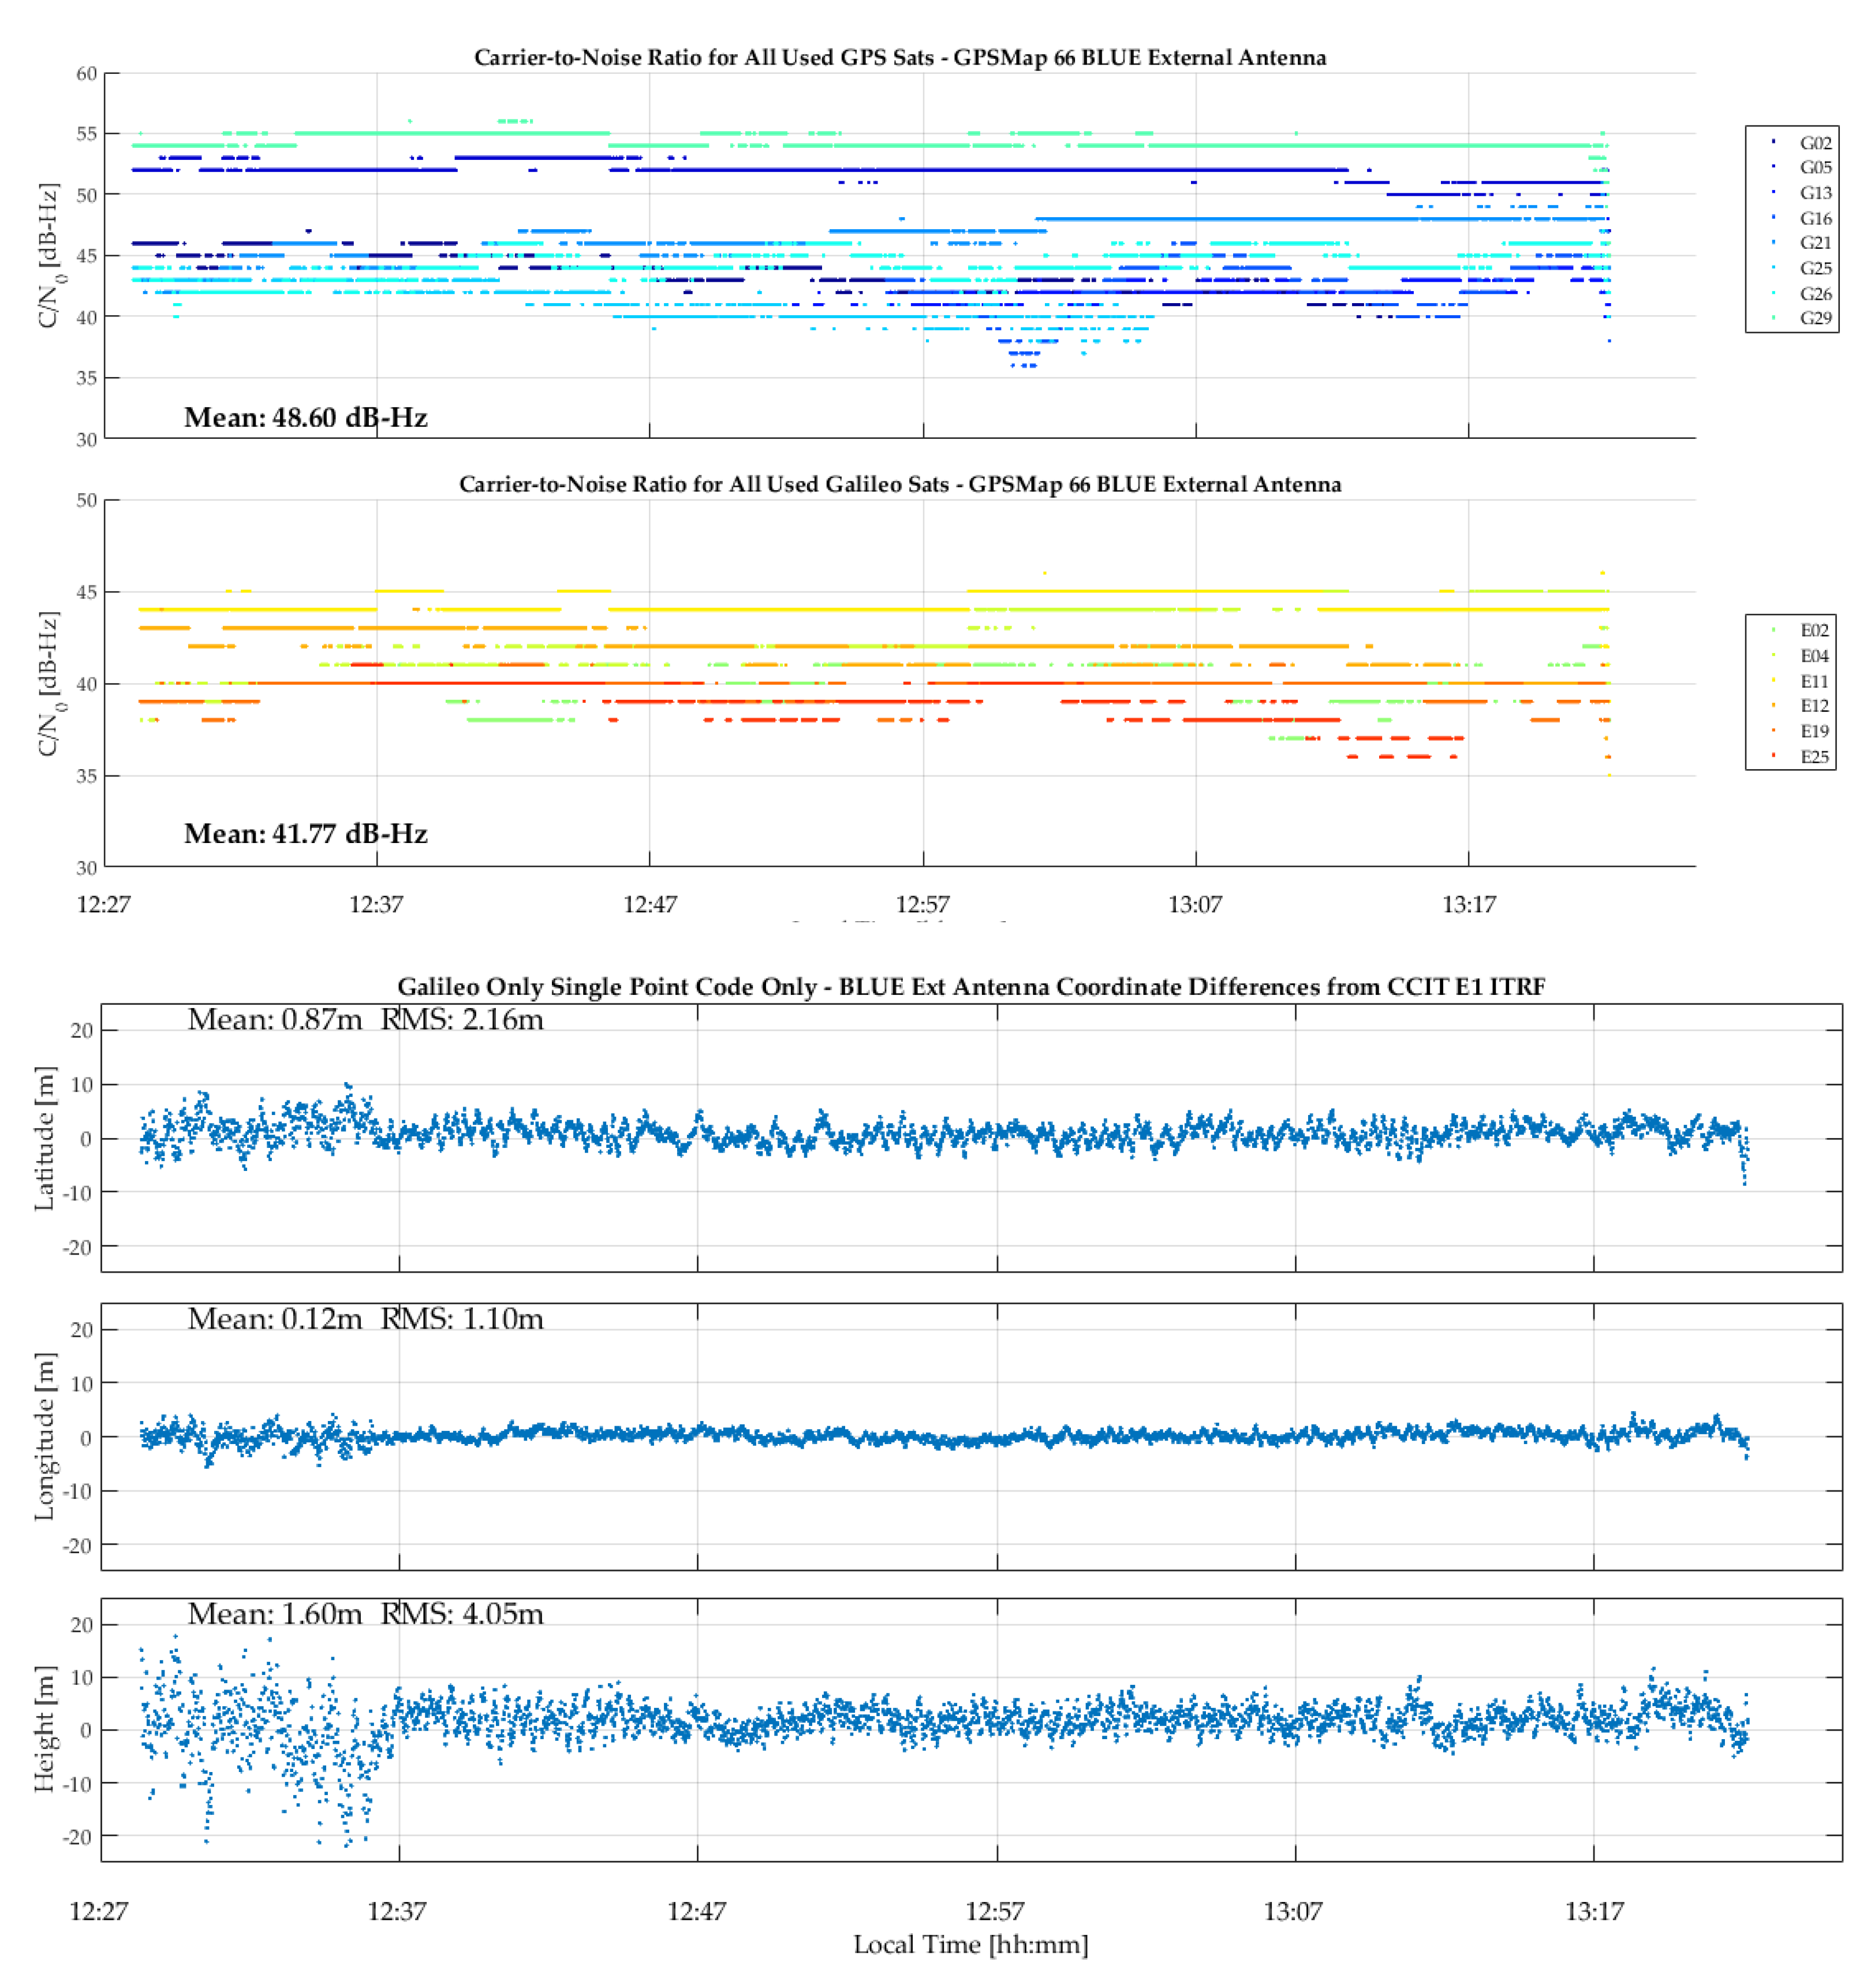
The test was conducted over a 50-min period during which Galileo coverage was available. The C/N
0 values and code-based epoch-by-epoch single point positions are shown in
Figure 9. The C/N
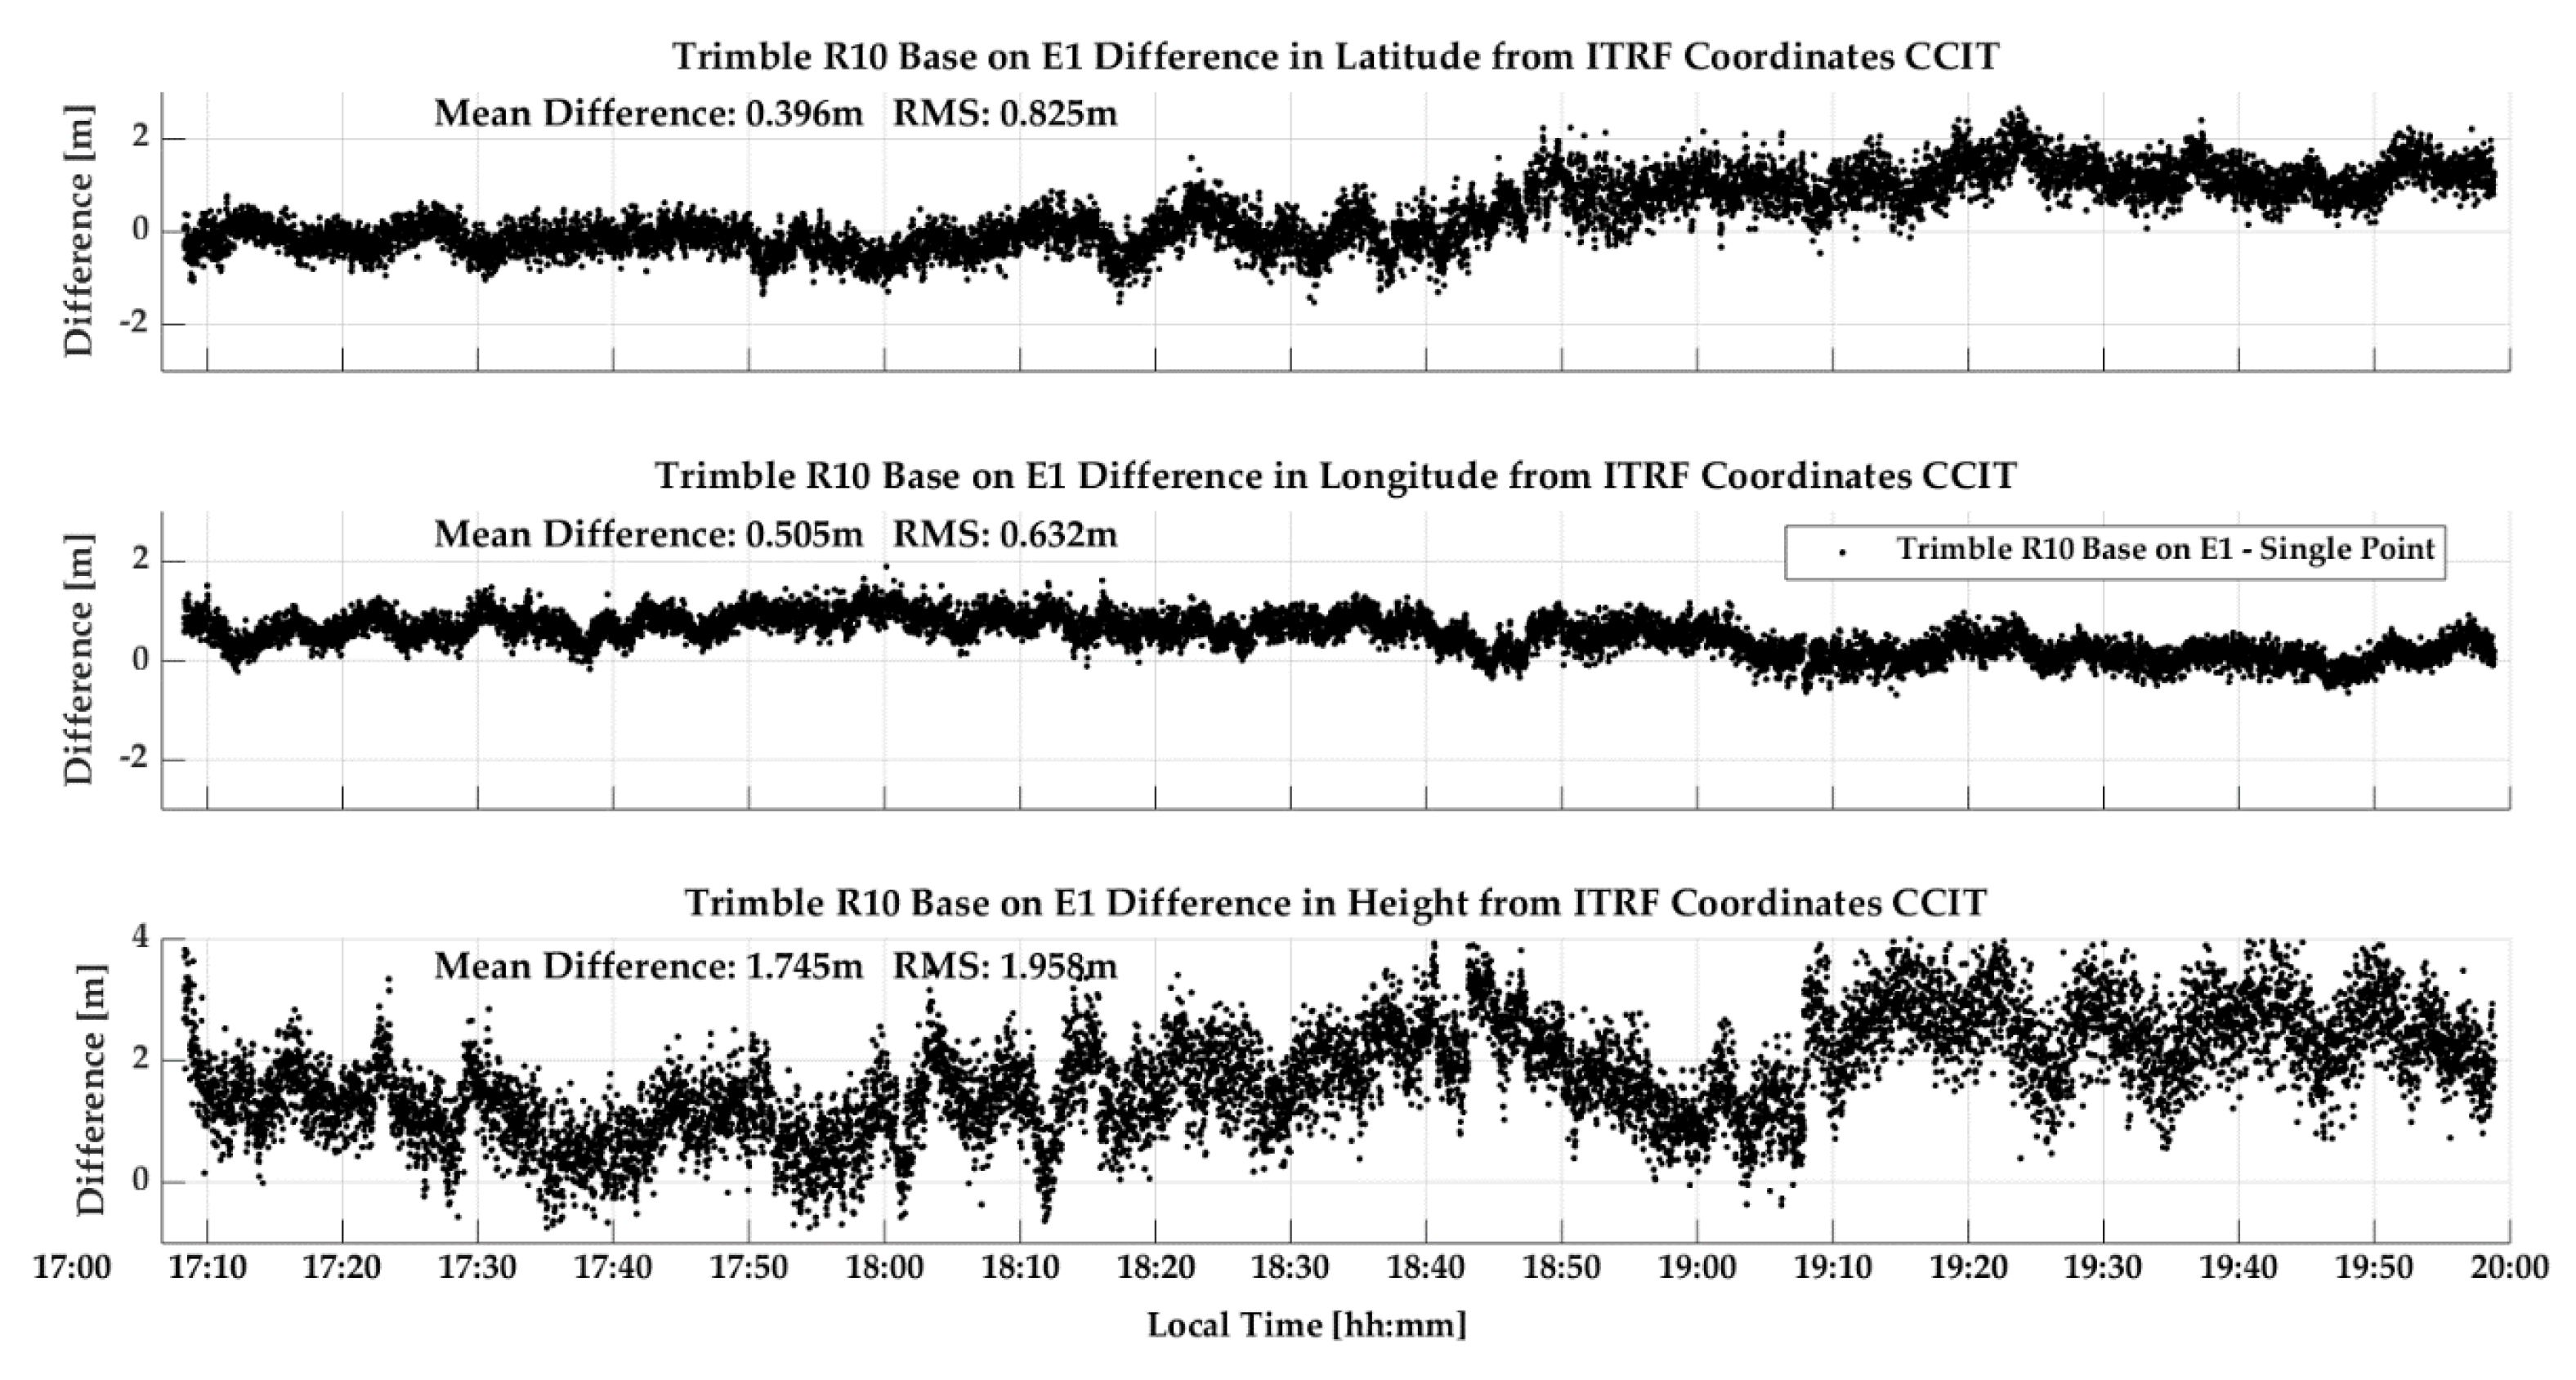
0 fluctuations are much smaller than when using the internal antenna due to the better multipath rejection capability of the geodetic antenna. This leads to a higher average gain of 2 dB-Hz with respect to the use of the internal antenna. The temporal coordinate variations are much smaller and demonstrate antenna importance under high multipath conditions. The GPSMap 66 latitude, longitude and height RMS values are now 1.6, 0.9 and 3.8 m for GPS and 2.2, 1.1 and 4.0 m for Galileo, which is two to three times better than the results shown in
Figure 6 when using the unit’s internal antenna and only slightly higher than those of the Trimble R10 L1 code epoch-by-epoch values of 0.8, 0.6 and 2.0 m shown in
Figure 10 at the same location, which is remarkable. In single point positioning mode, the effect of satellite orbit and clock errors, in addition to those of the atmosphere, limits accuracy achievable, regardless of the receiver used. The use of carrier phase in differential mode leads to different levels of performance between the receivers used as will be demonstrated in the sequel with tests in differential mode.
P10 position coordinate results in the same high multipath environment with the external antenna are shown in
Figure 11. Performance remains substantially poorer than that of the GPSMap 66 shown in
Figure 9 but is still better than that shown in
Figure 7 for the P10 without the benefit of an external antenna.
3.2. Low Multipath Single Point and Differential Positioning
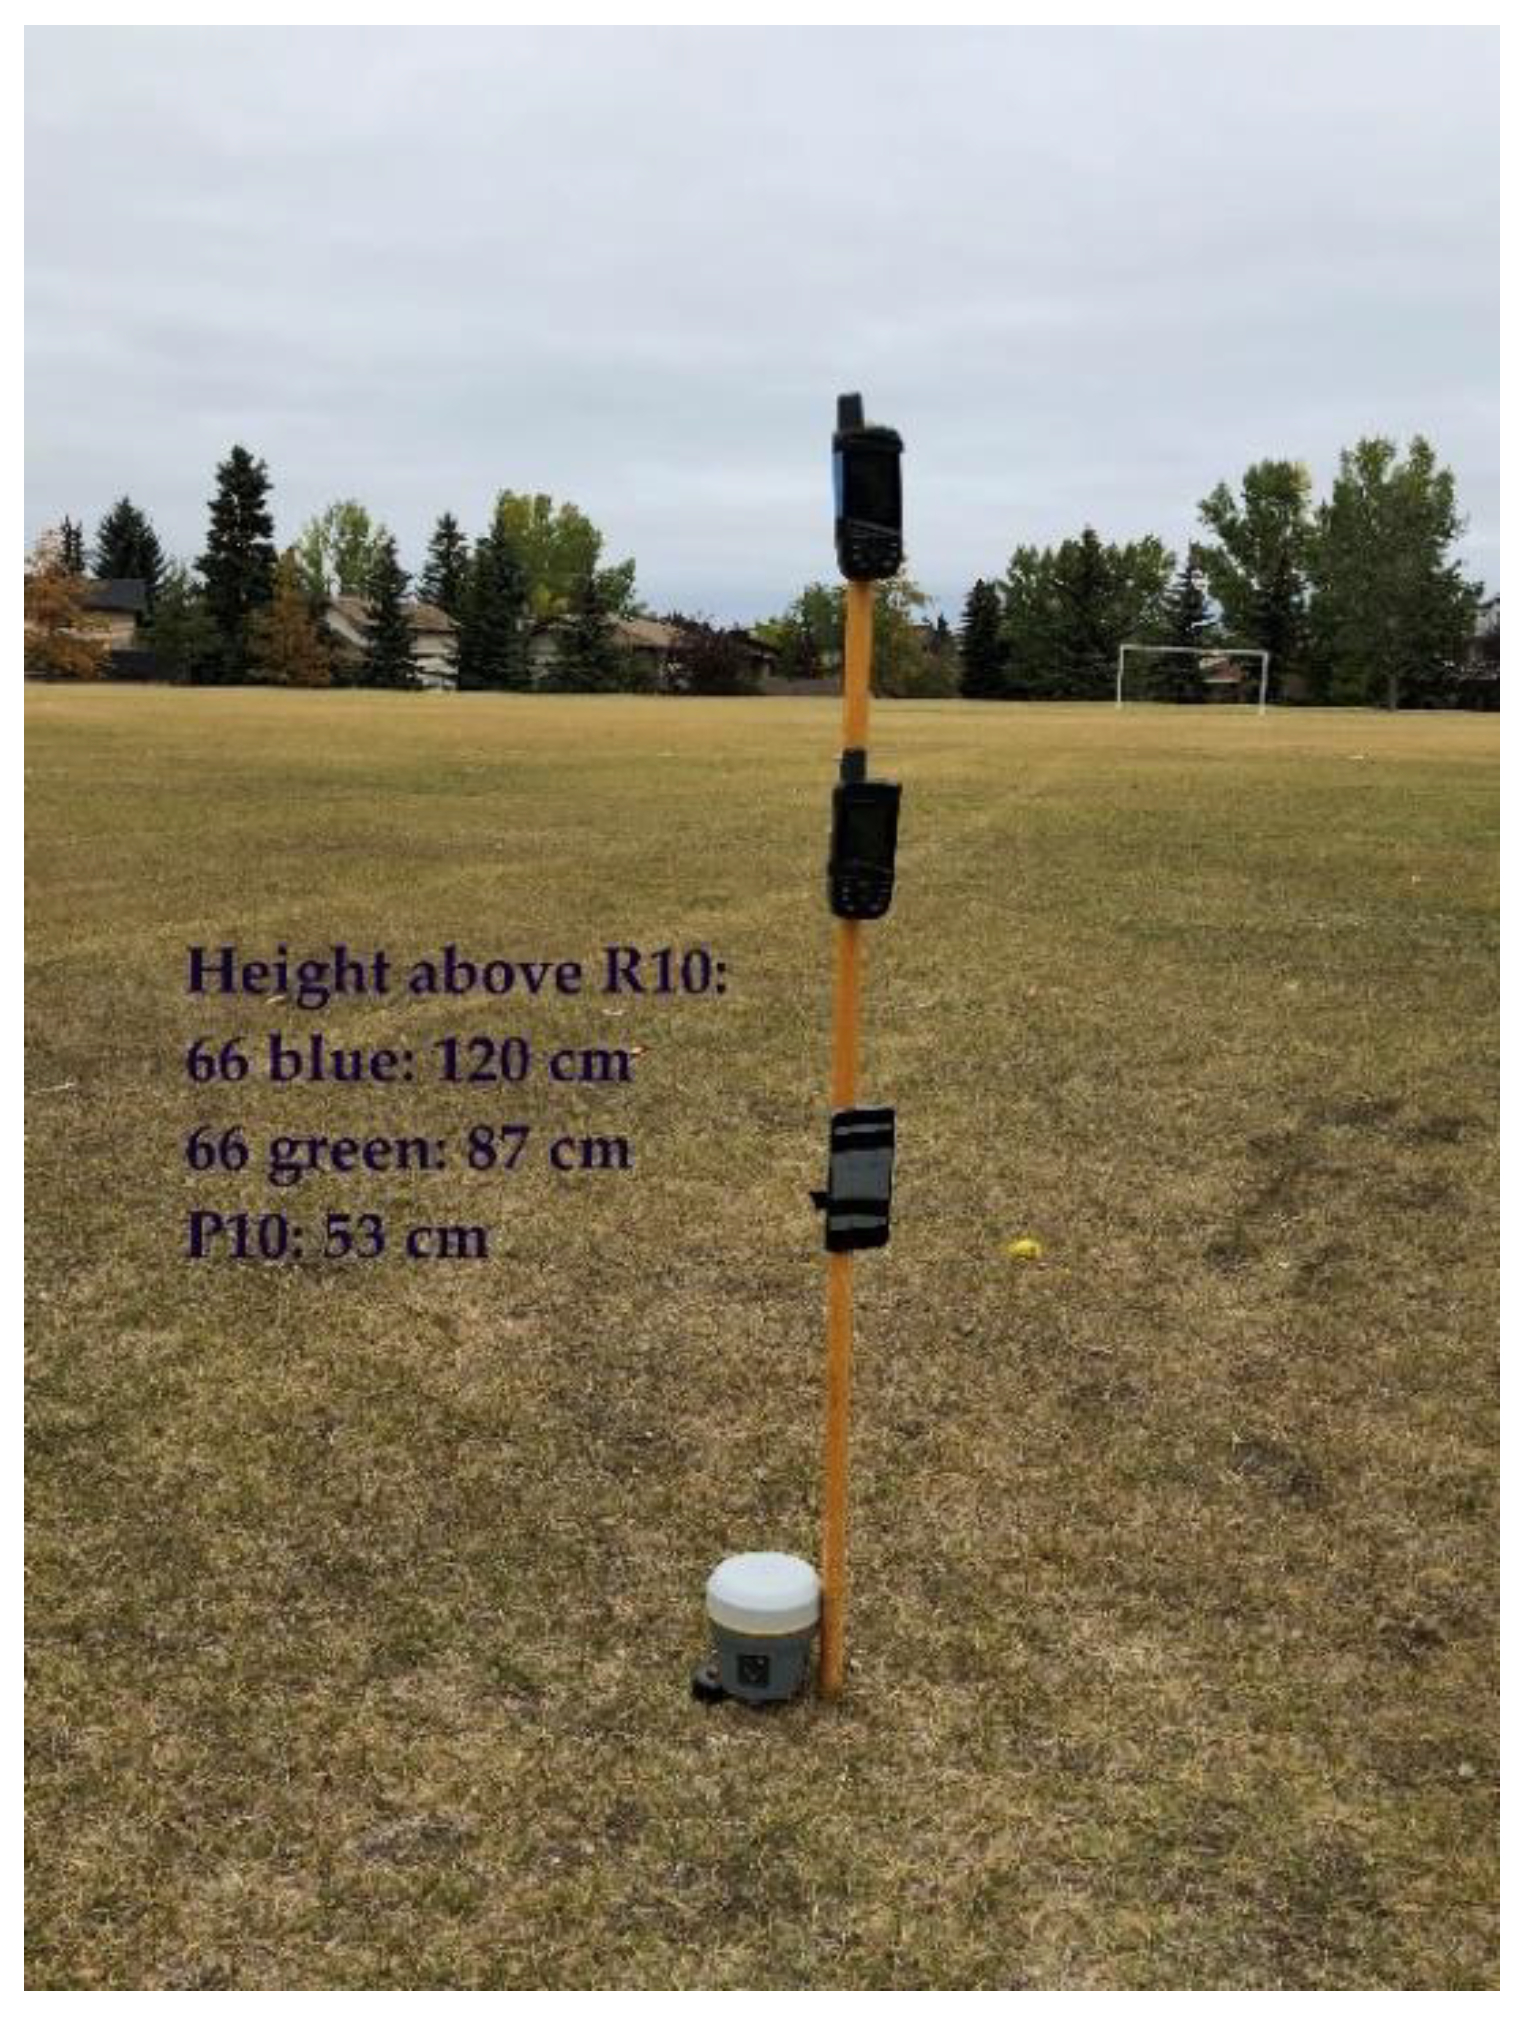
A lower multipath test was conducted in the middle of a flat playground with no obstruction in a radius of 100 m, a section of which is shown in
Figure 12. The two GPSMap 66 and Huawei units being tested were mounted on a vertical wooden pole with the vertical separations shown in the figure. The data collection occurred over a period of 75 min during which four to five Galileo SVs were available with a PDOP of 3 to 7. The corresponding values for GPS were 10 to 11 SVs and a PDOP better than 2. A Trimble R10 was installed at the base of the pole and operating in differential mode with a second R10 unit at a reference station 5 km away at the same point as used previously to provide an accurate position of the test point to evaluate the other units.
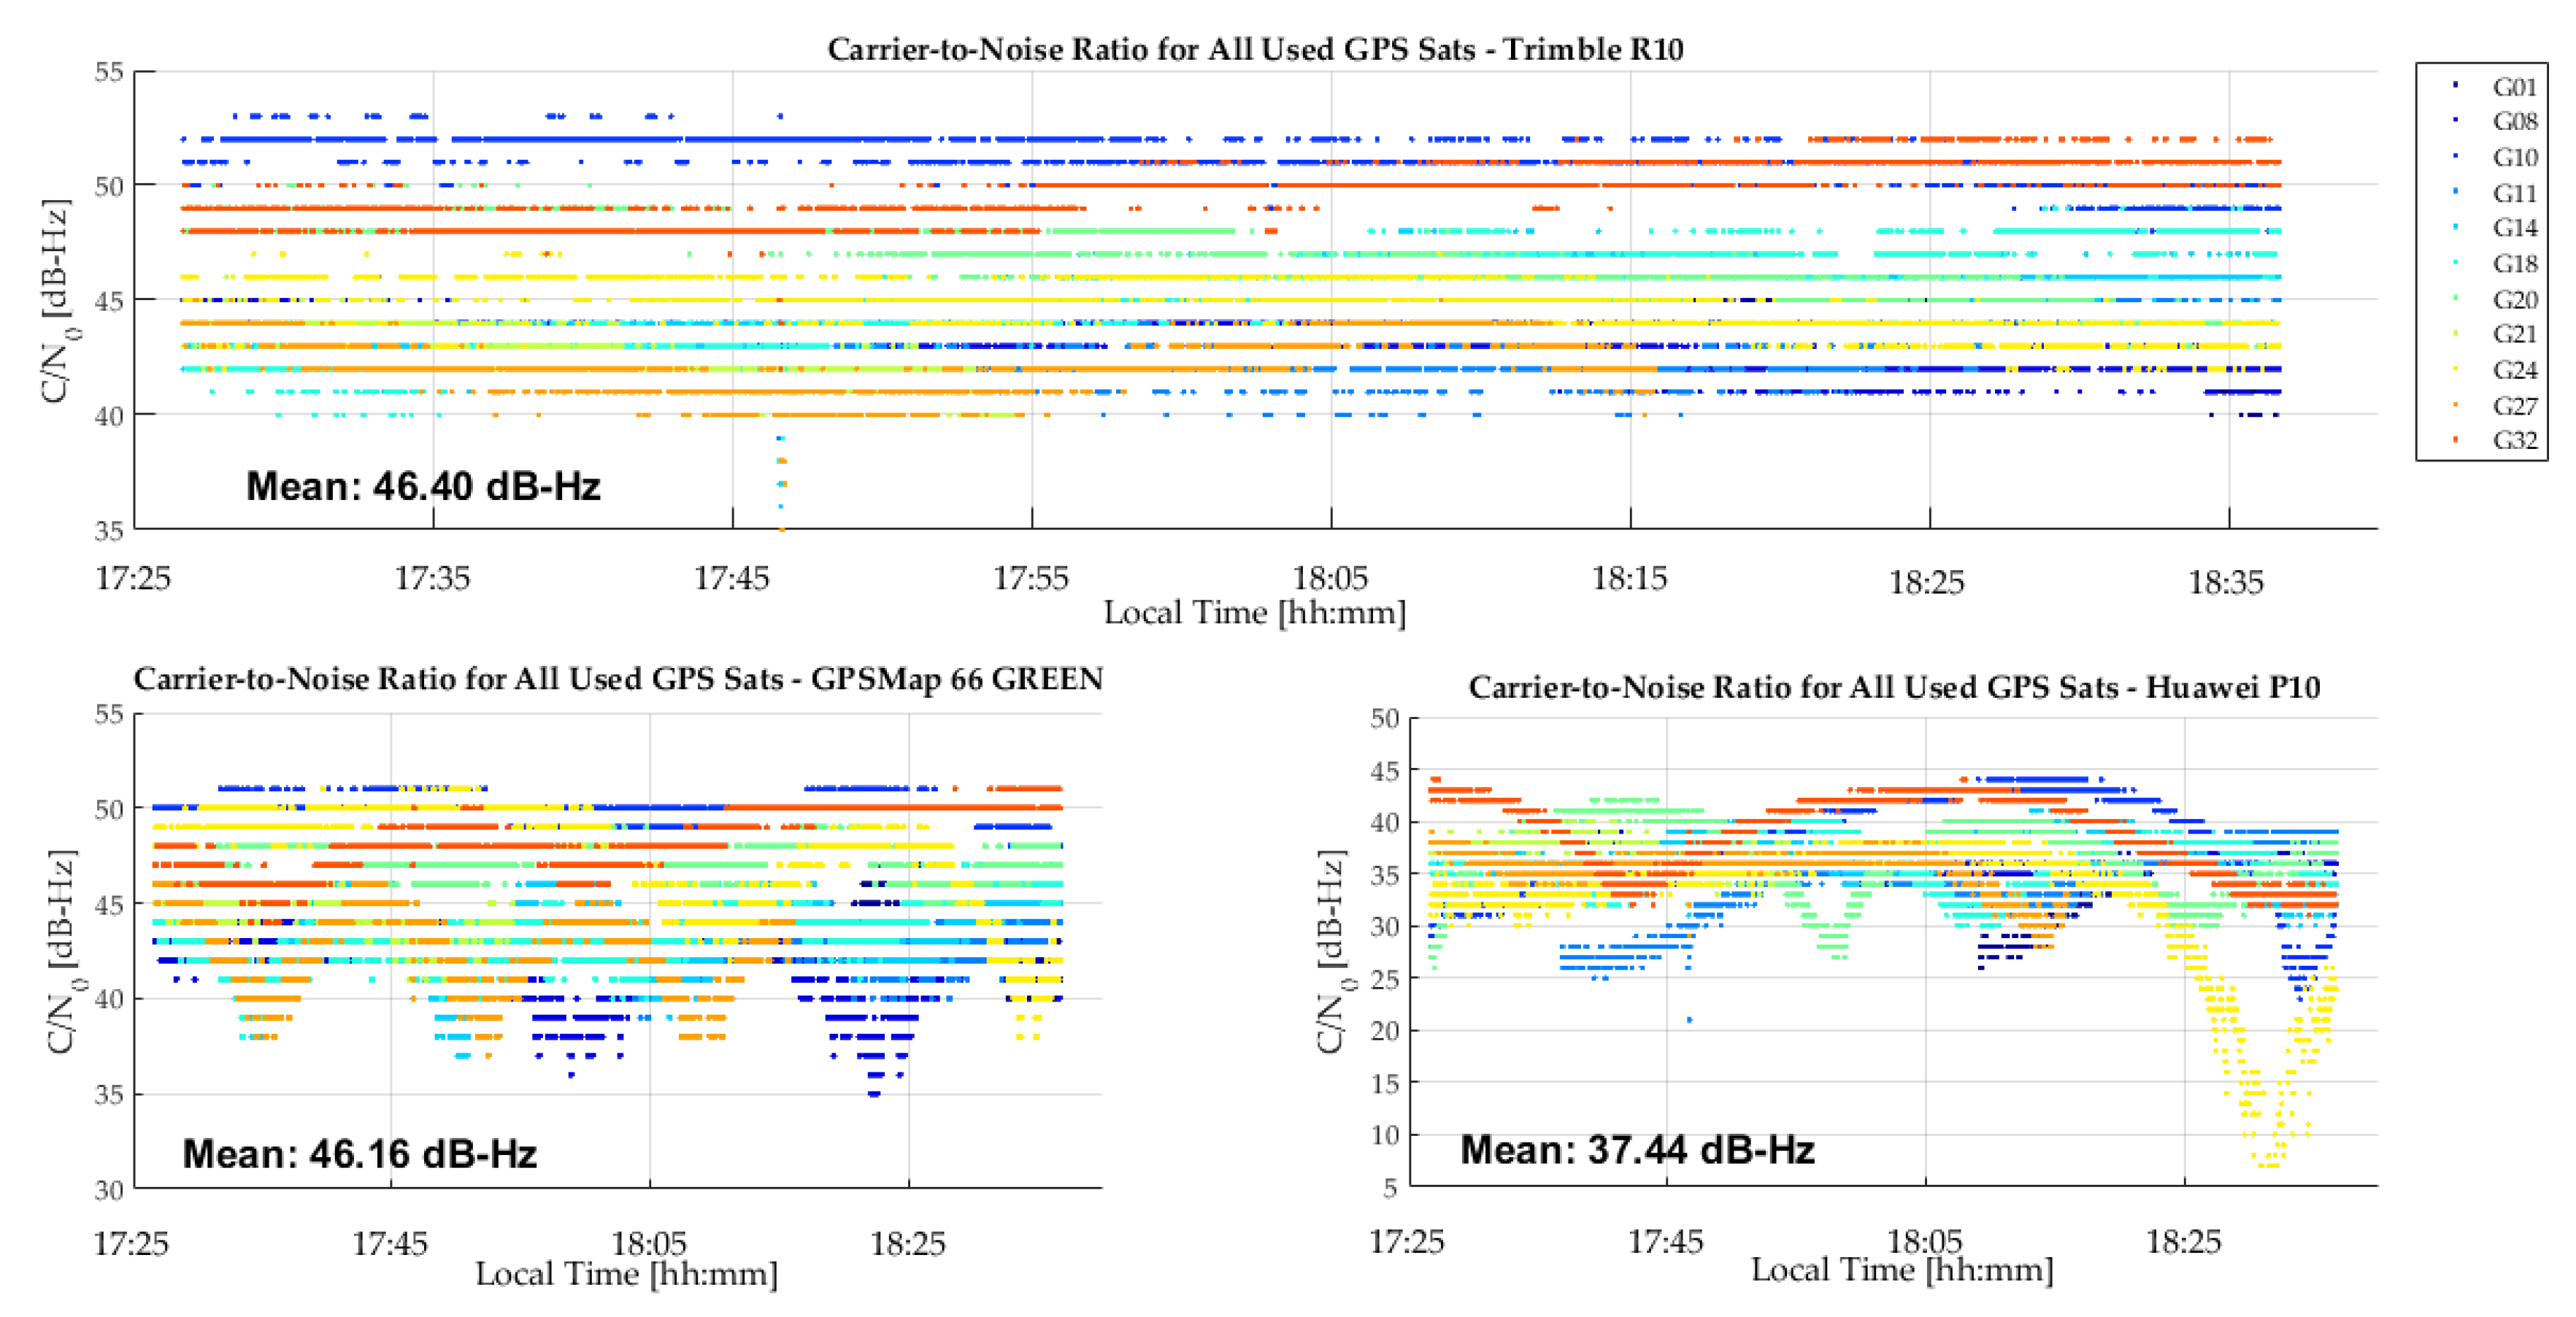
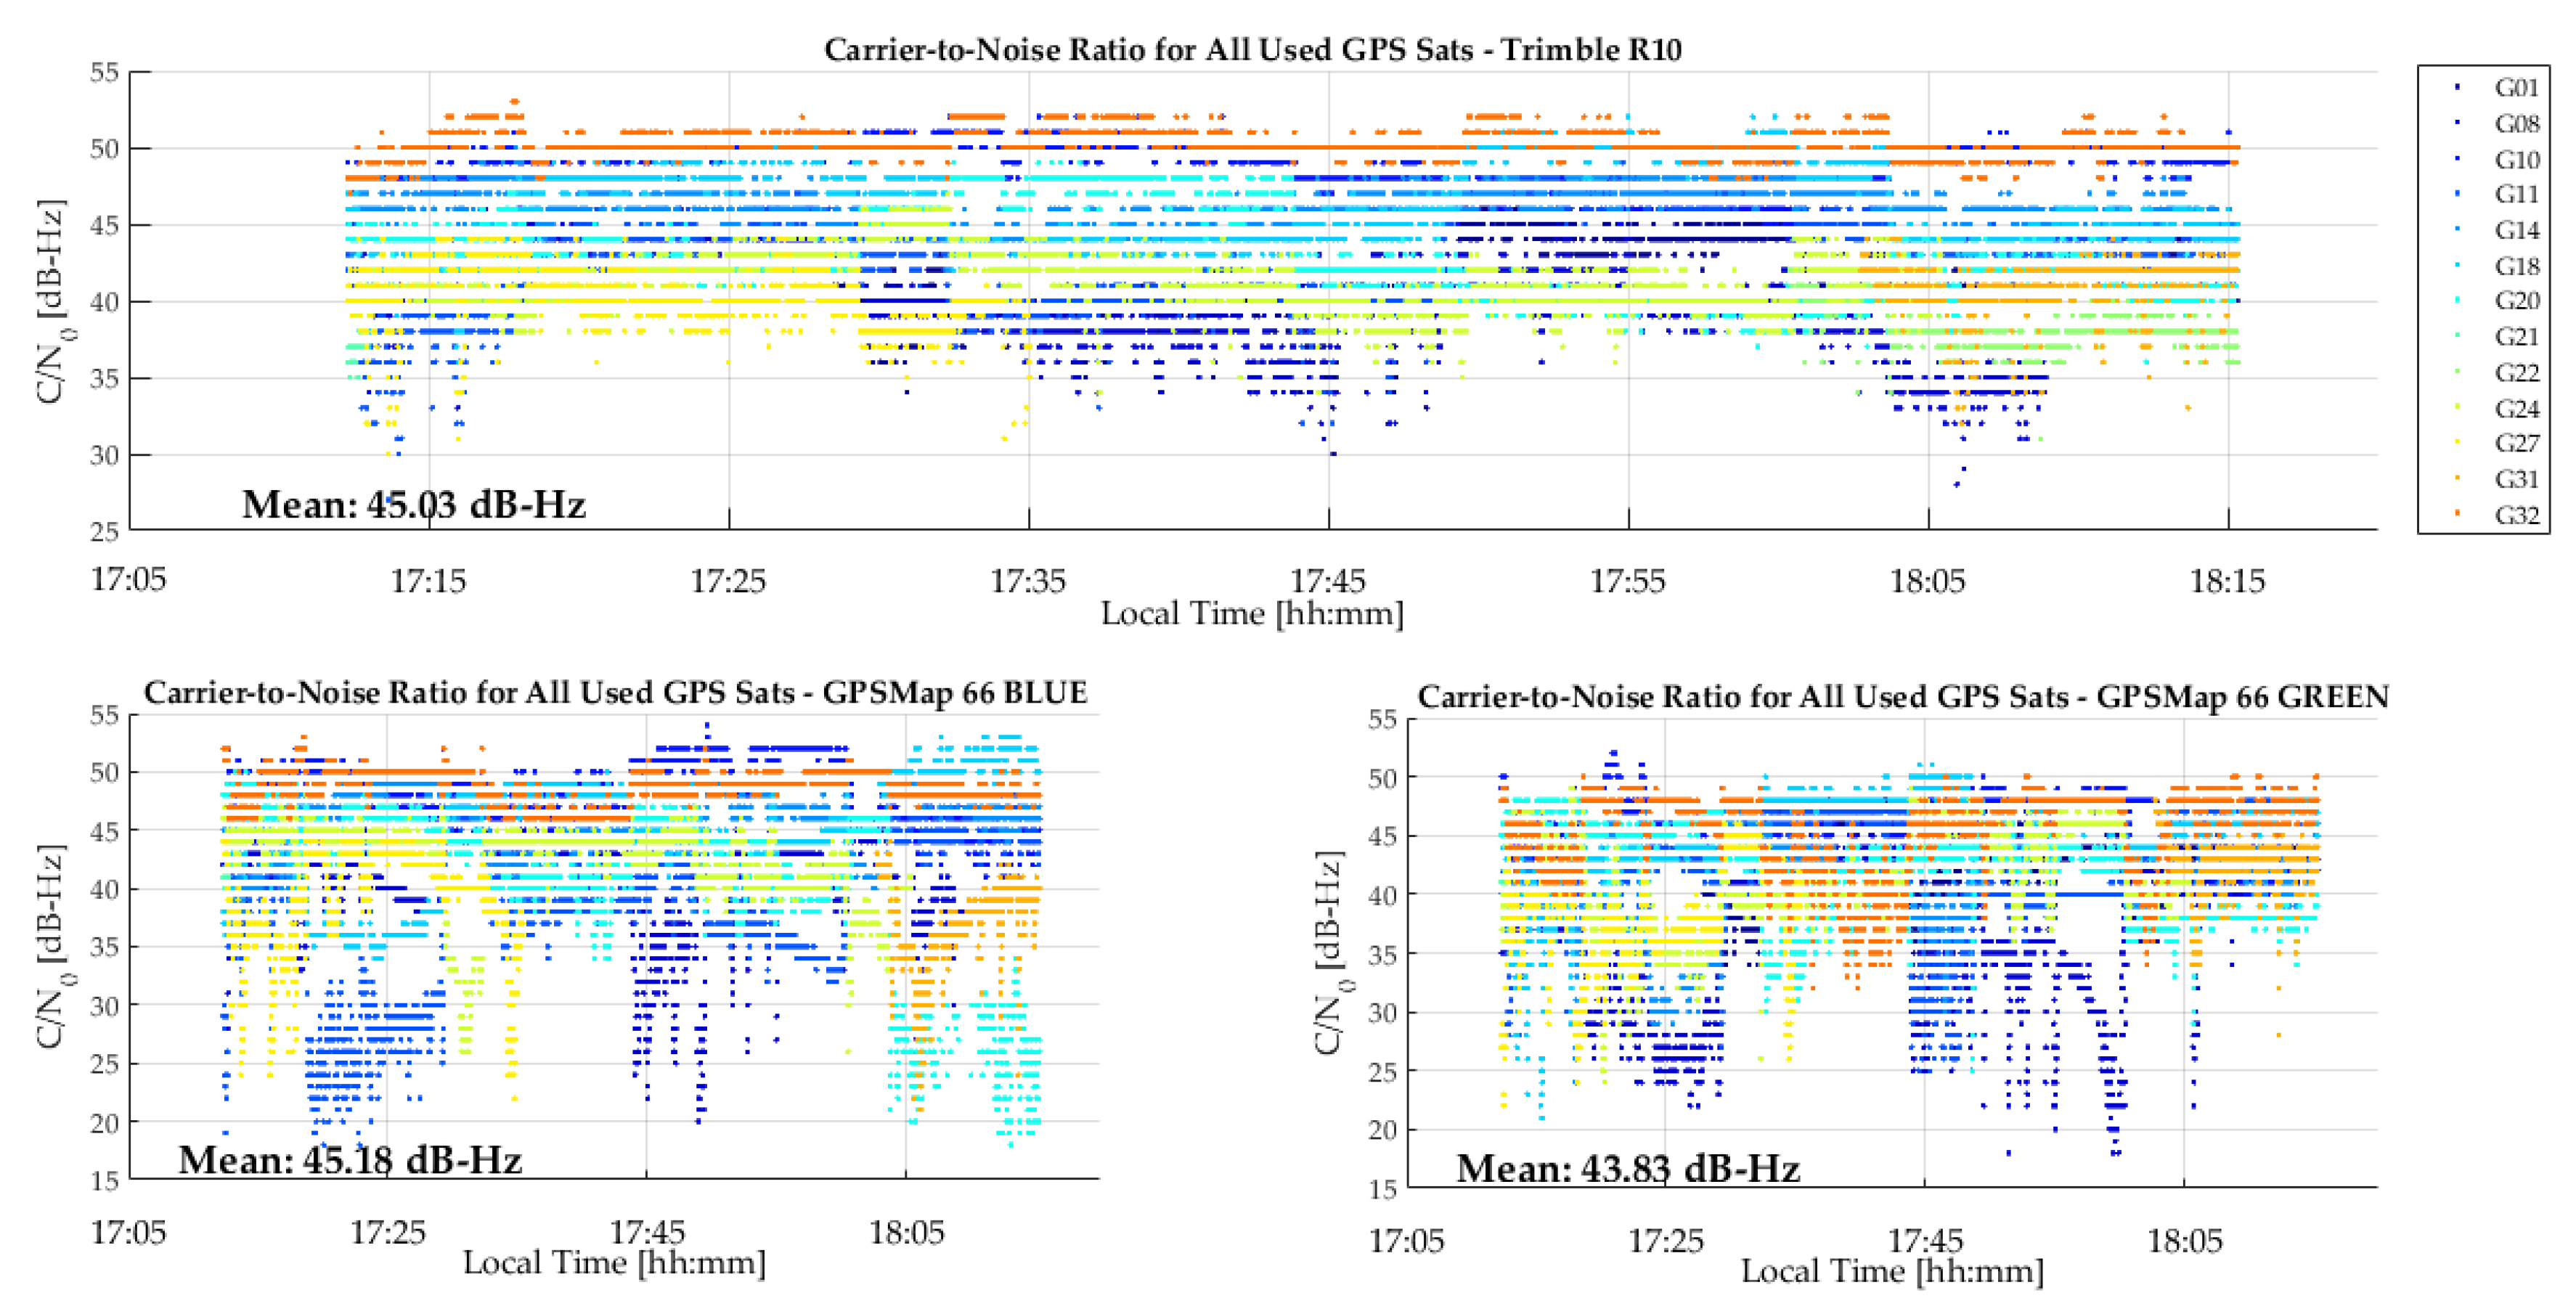
The C/N
0 measurements of the R10, GPSMap 66 green and P10 units are shown in
Figure 13. The GPSMap 66 blue unit has similar values. The R10 values are better than those of the GPSMap 66 for a few SVs, although the averages are similar. However, no cyclic variations are present in the R10 values, demonstrating the high multipath rejection capability of its antenna. Although the test environment was considered to be low multipath, cyclic variations likely due to multipath caused by buildings in a radius of 200 m are still present in the GPSMap 66 unit results. Helix antennas, although compact and well suited for hand held units, are not as effective for multipath rejection as high performance but larger geodetic antennas. The P10 C/N
0 values are much lower, with an average of 8 to 9 dB lower than those of the R10 and GPSMap 66 units. The P10 provided carrier phase for only very short periods, which is not surprising given the low C/N
0 values. Another test with the GPSMap 66 on a 2200 m mountain summit with the unit on the ground resulted in a C/N
0 value average of 1 dB-Hz higher than in the current case, due to the absence of any natural or person-made objects below the 360° horizon.
3.2.1. Precise Point Positioning (PPP) Static Results
The distance between the reference station and the test point was 5 km, hence the effect of the ionosphere would have been nearly identical at each point. Three hours of R10 measurements at the reference station made during the test were processed successively in L1/L2 and L1 only PPP mode. The coordinate differences provide as excellent estimate of the effect of the ionosphere during the test. The differences (L1/L2 − L1) were 1, −9 and 13 cm in the latitude, longitude and height components, hence insignificant on the GPSMap 66 L1 results. The R10 L1/L2 and GPSMap 66 L1 measurements at the test point were also processed in PPP static mode. The differences between the R10 and GPSMap 66 blue unit were 43, 39 and −35 cm in the latitude, longitude and height components. The corresponding differences for the GPSMap 66 green unit were 34, −32 and 2 cm. The results demonstrate the capability of the GPSMap 66 for PPP applications at the 1 m RMS or better level under low ionospheric conditions. The P10 data was also submitted to the NRCan PPP service in static mode. The outcome was returned in code only kinematic mode due to the noisy data. No carrier phase nor Galileo data was available on the P10 during the test.
3.2.2. Epoch-by-Epoch Single Point and Differential Mode
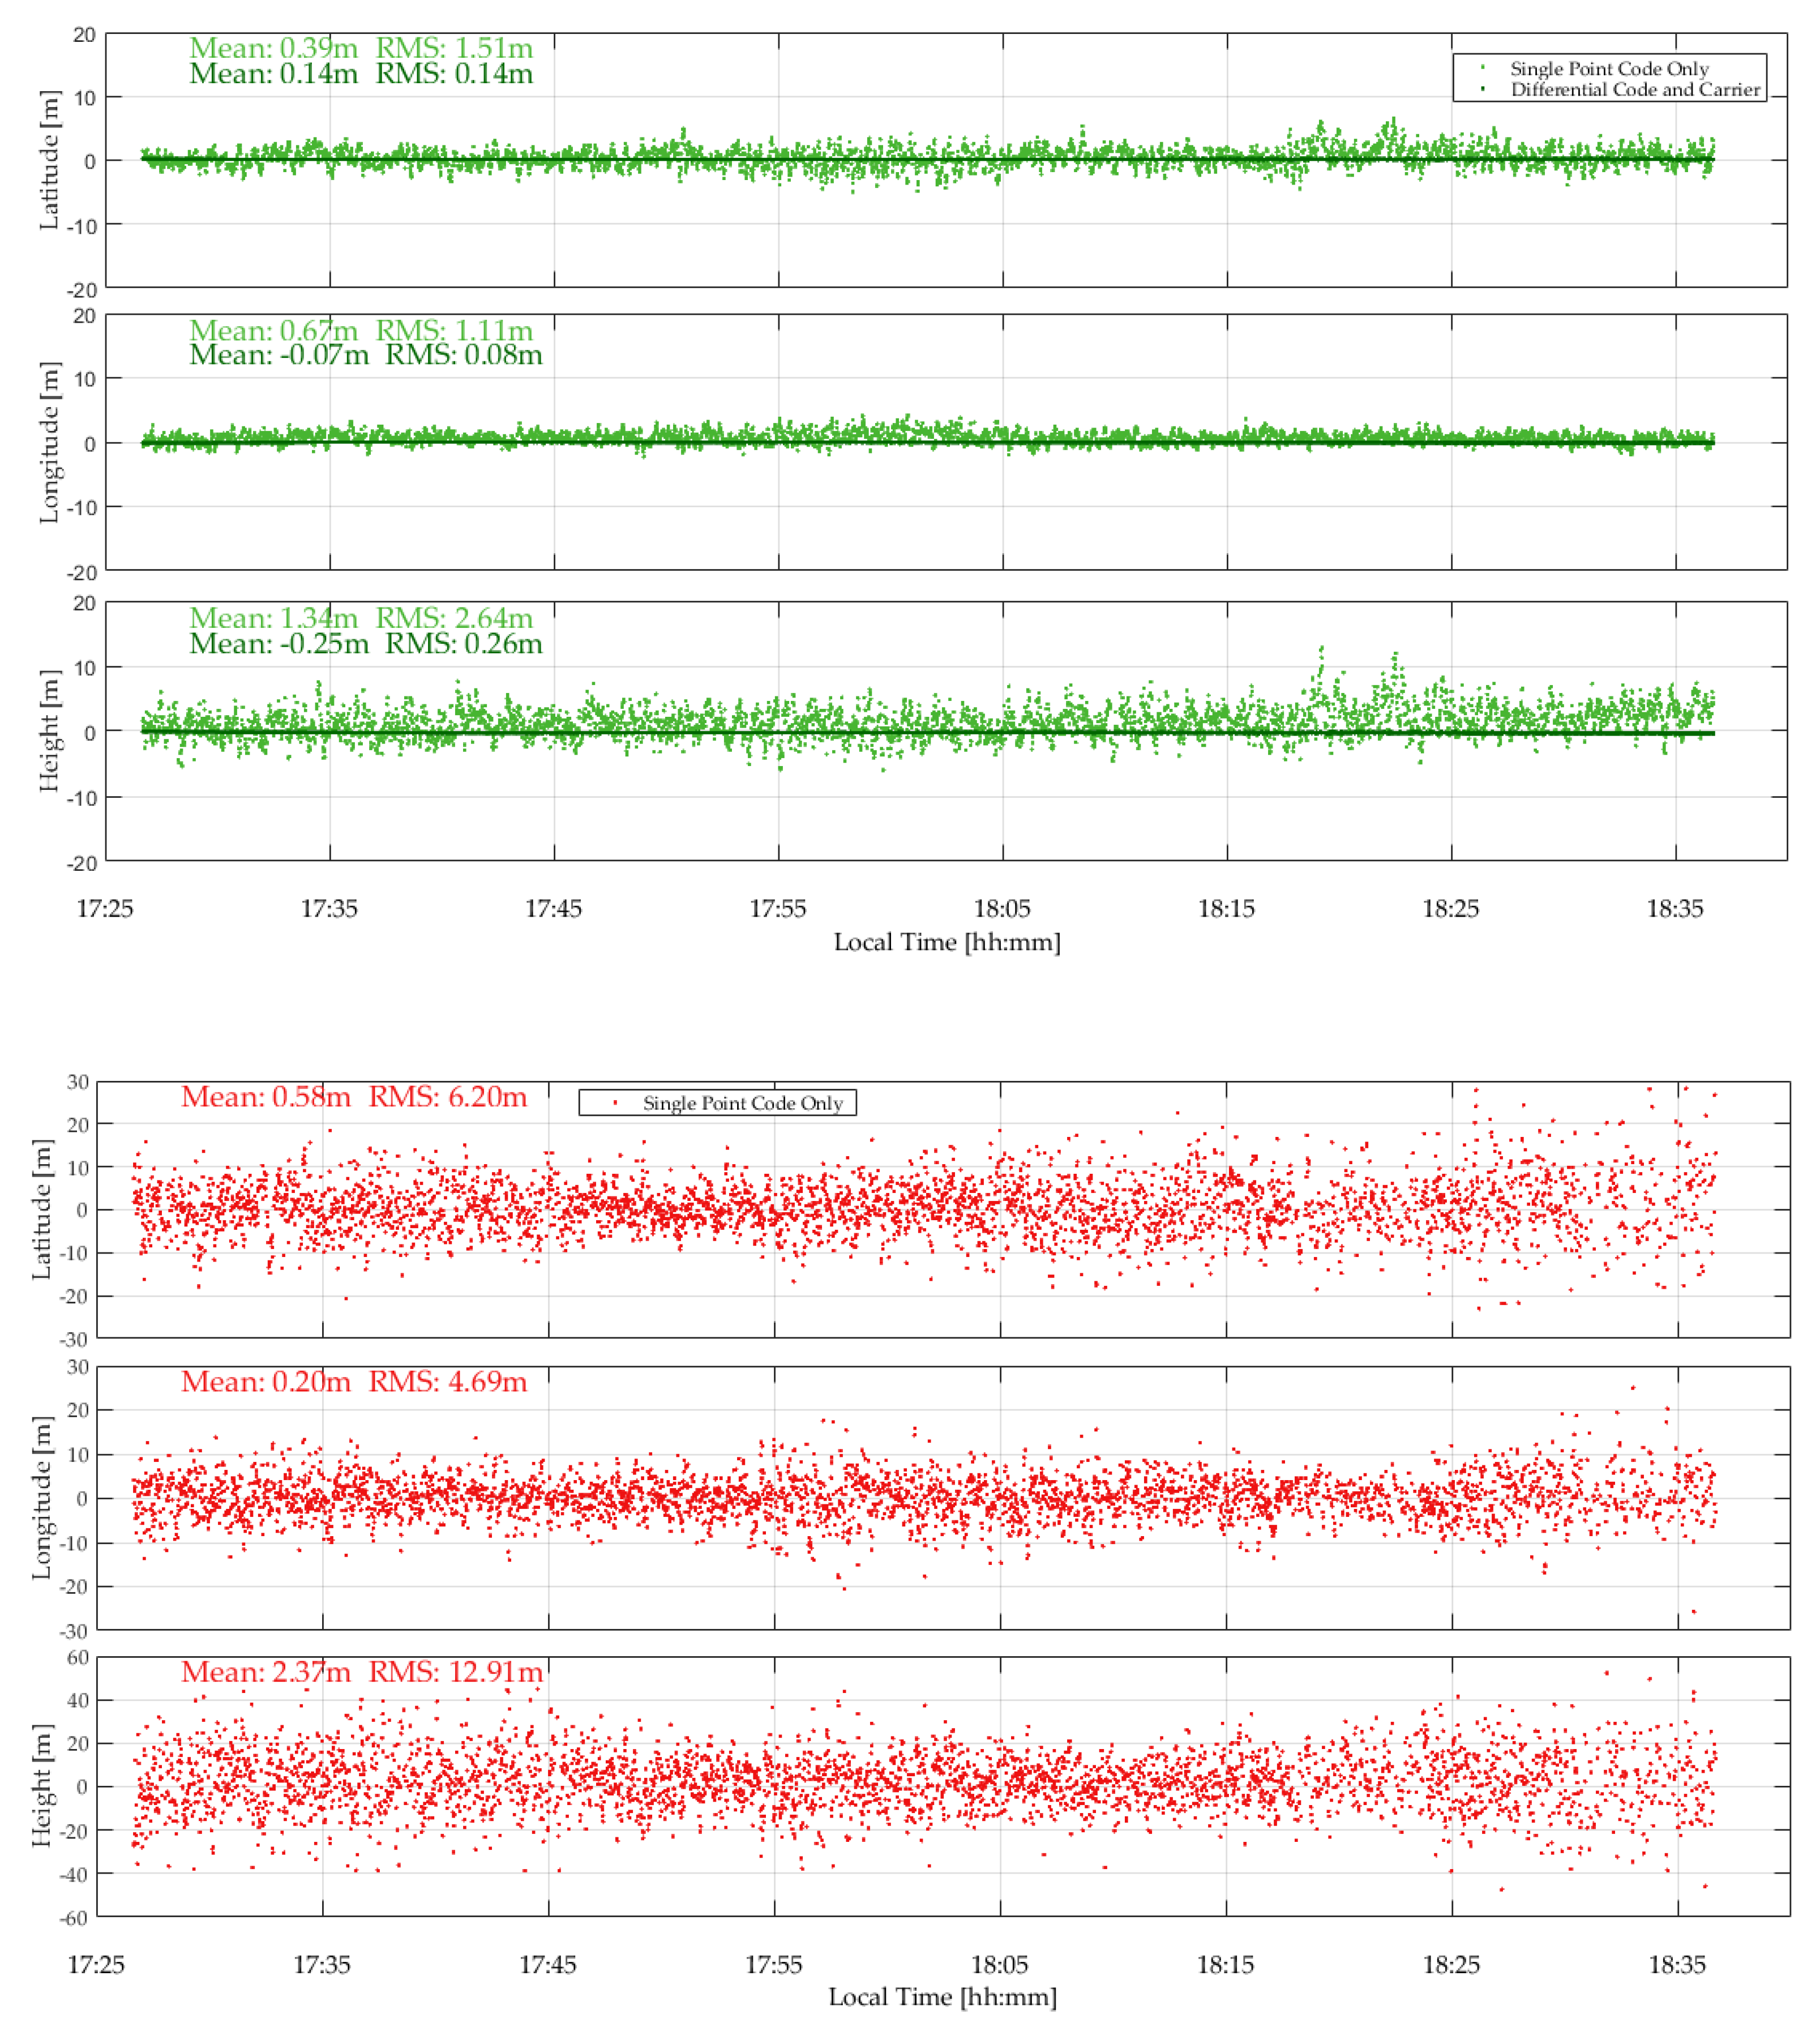
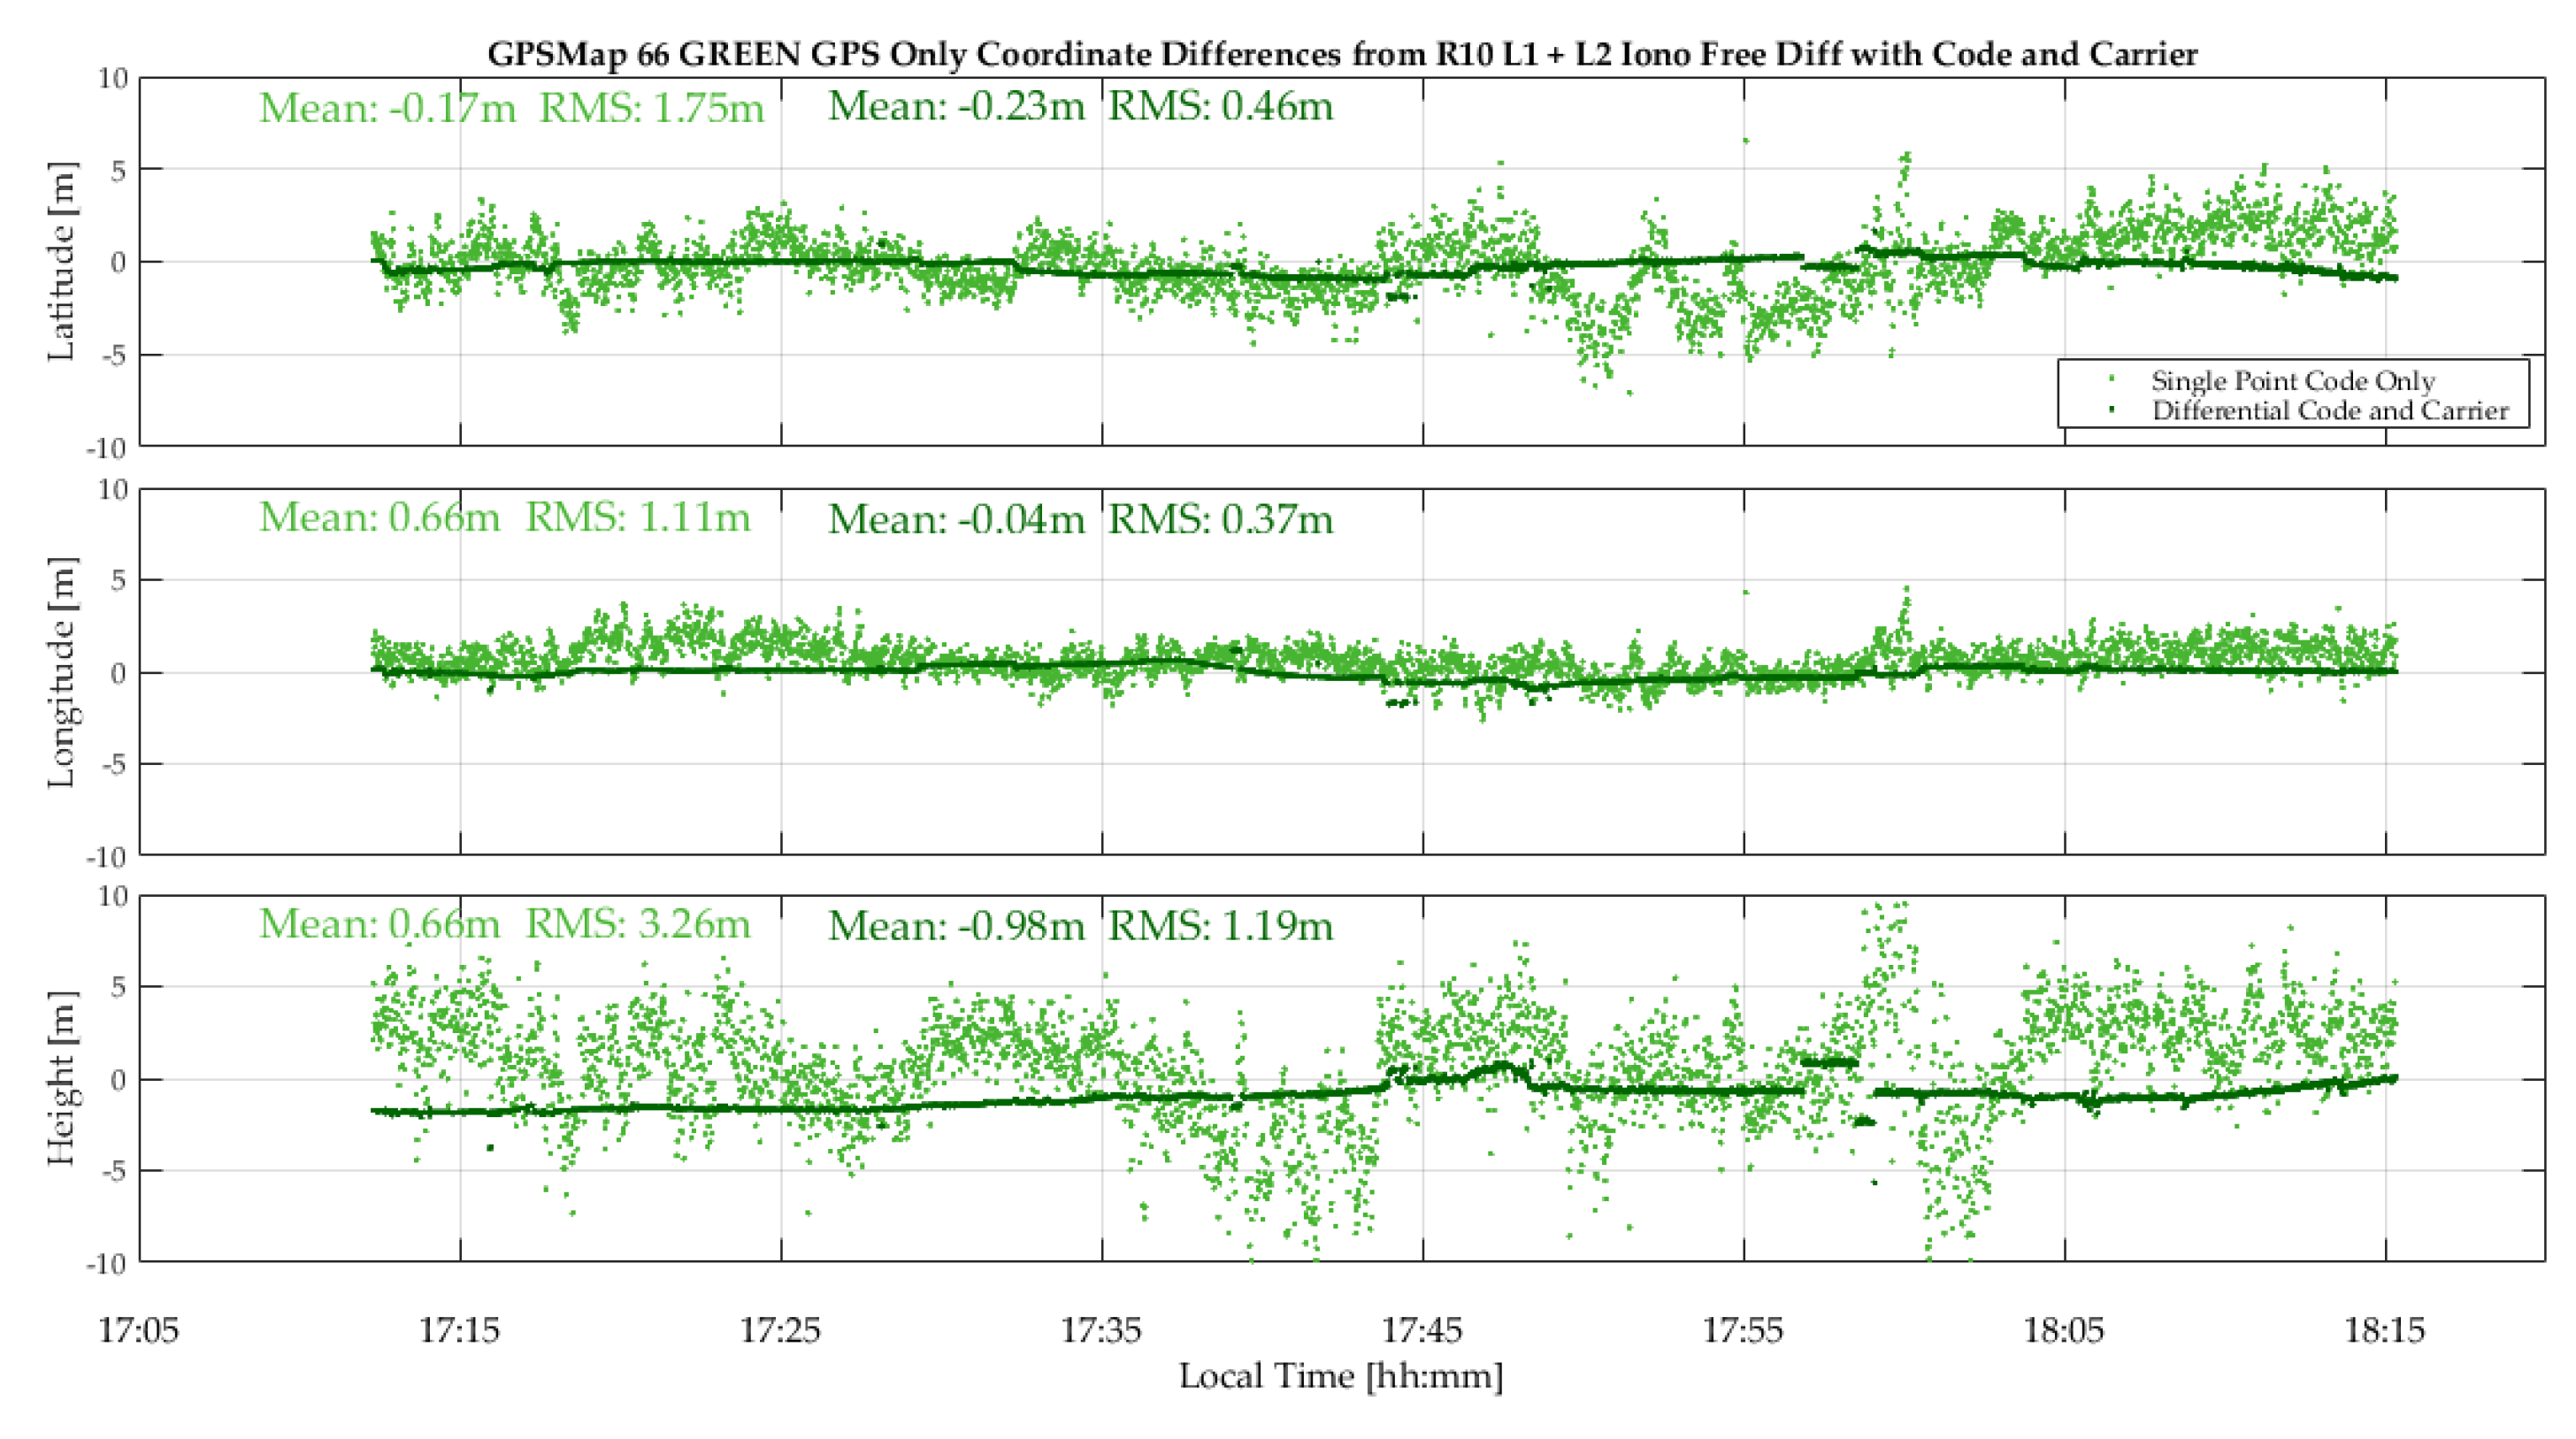
The GPSMap 66 and P10 measurements were successively processed in epoch-by-epoch single point single frequency code mode and differential code/carrier phase (when available) mode using RTKLib and the resulting coordinates were compared to the test point reference values. The results for GPS are shown in the two plots of
Figure 14. In single point mode, the superior helix antenna of the GPSMap 66 showed its advantage with RMS values of 1.51, 1.11 and 2.64 m in the latitude, longitude and height components, compared to the corresponding P10 RMS values of 4.20, 4.69 and 12.9 m. The performance of the GPSMap 66 in differential code/carrier phase mode, with RMS values of 14, 8 and 26 cm in latitude, longitude and height, is impressive. The code/carrier phase RTKLib solution was in float mode 100% of the time. Carrier phase lock was maintained more or less continuously.
The P10 unit did not output carrier phase measurements nor Galileo data during the test. The single point GPS results are shown in the second plot of
Figure 14. No differential processing was pursued with the P10.
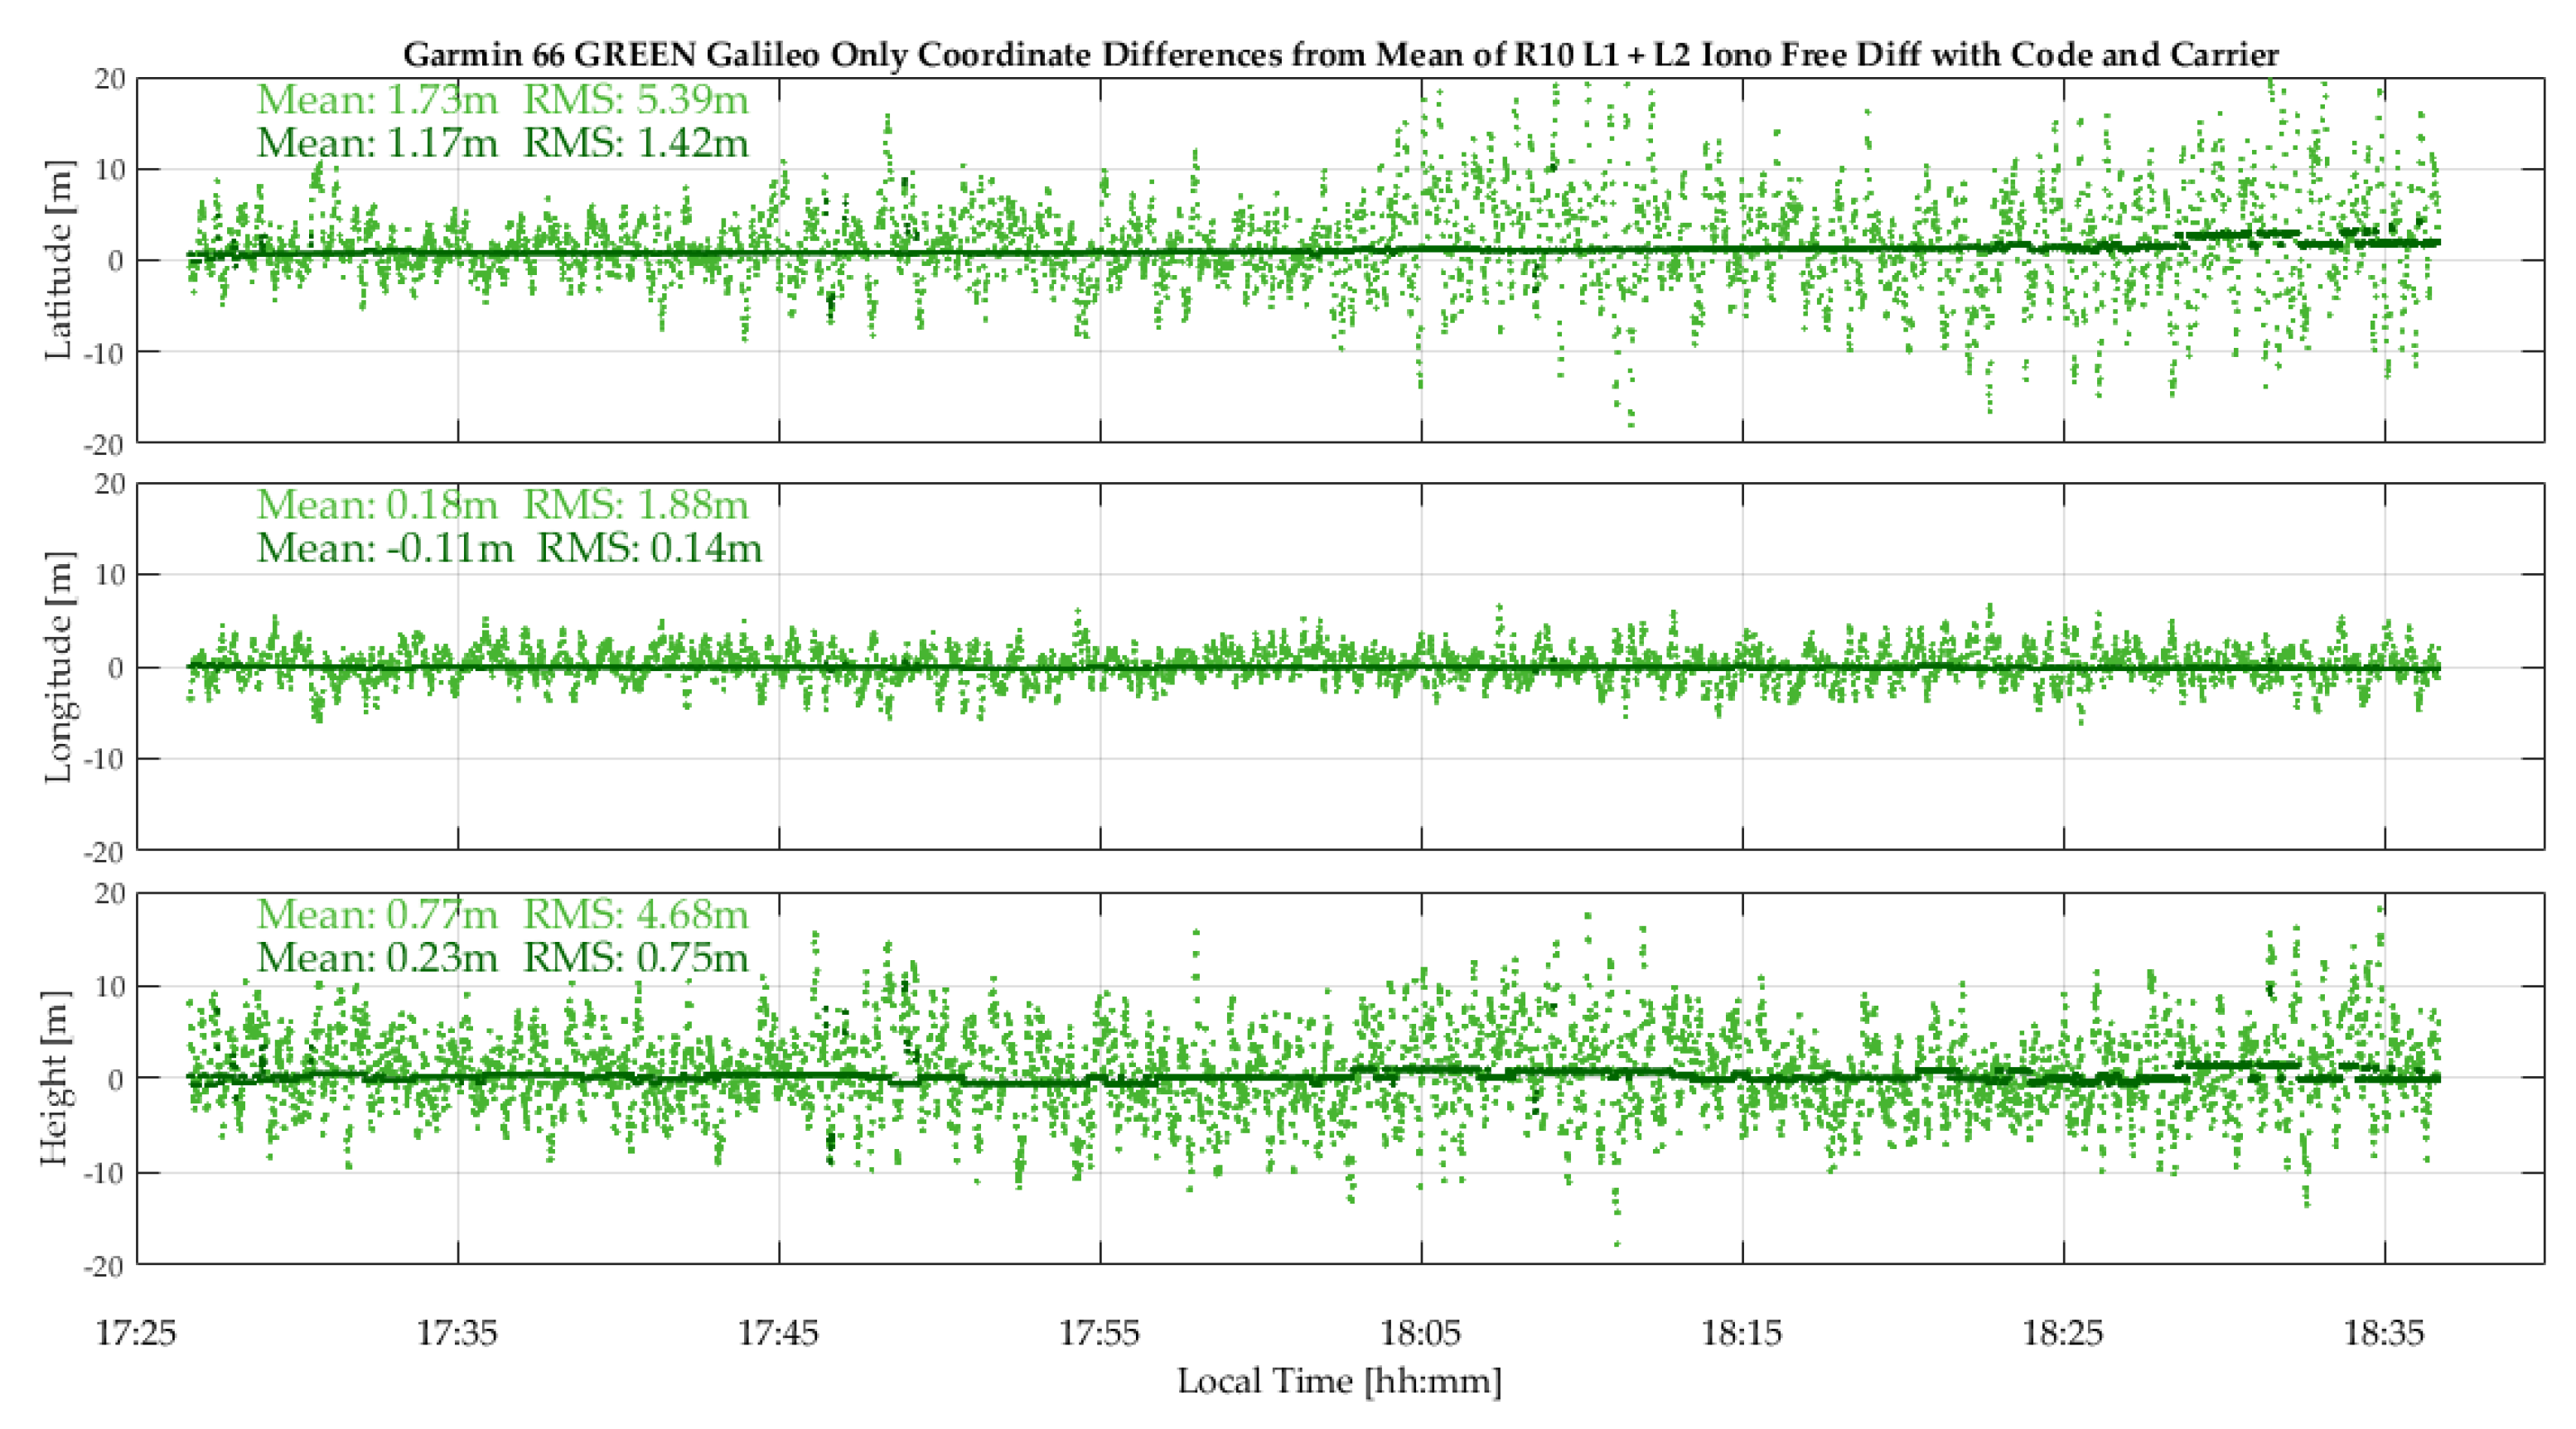
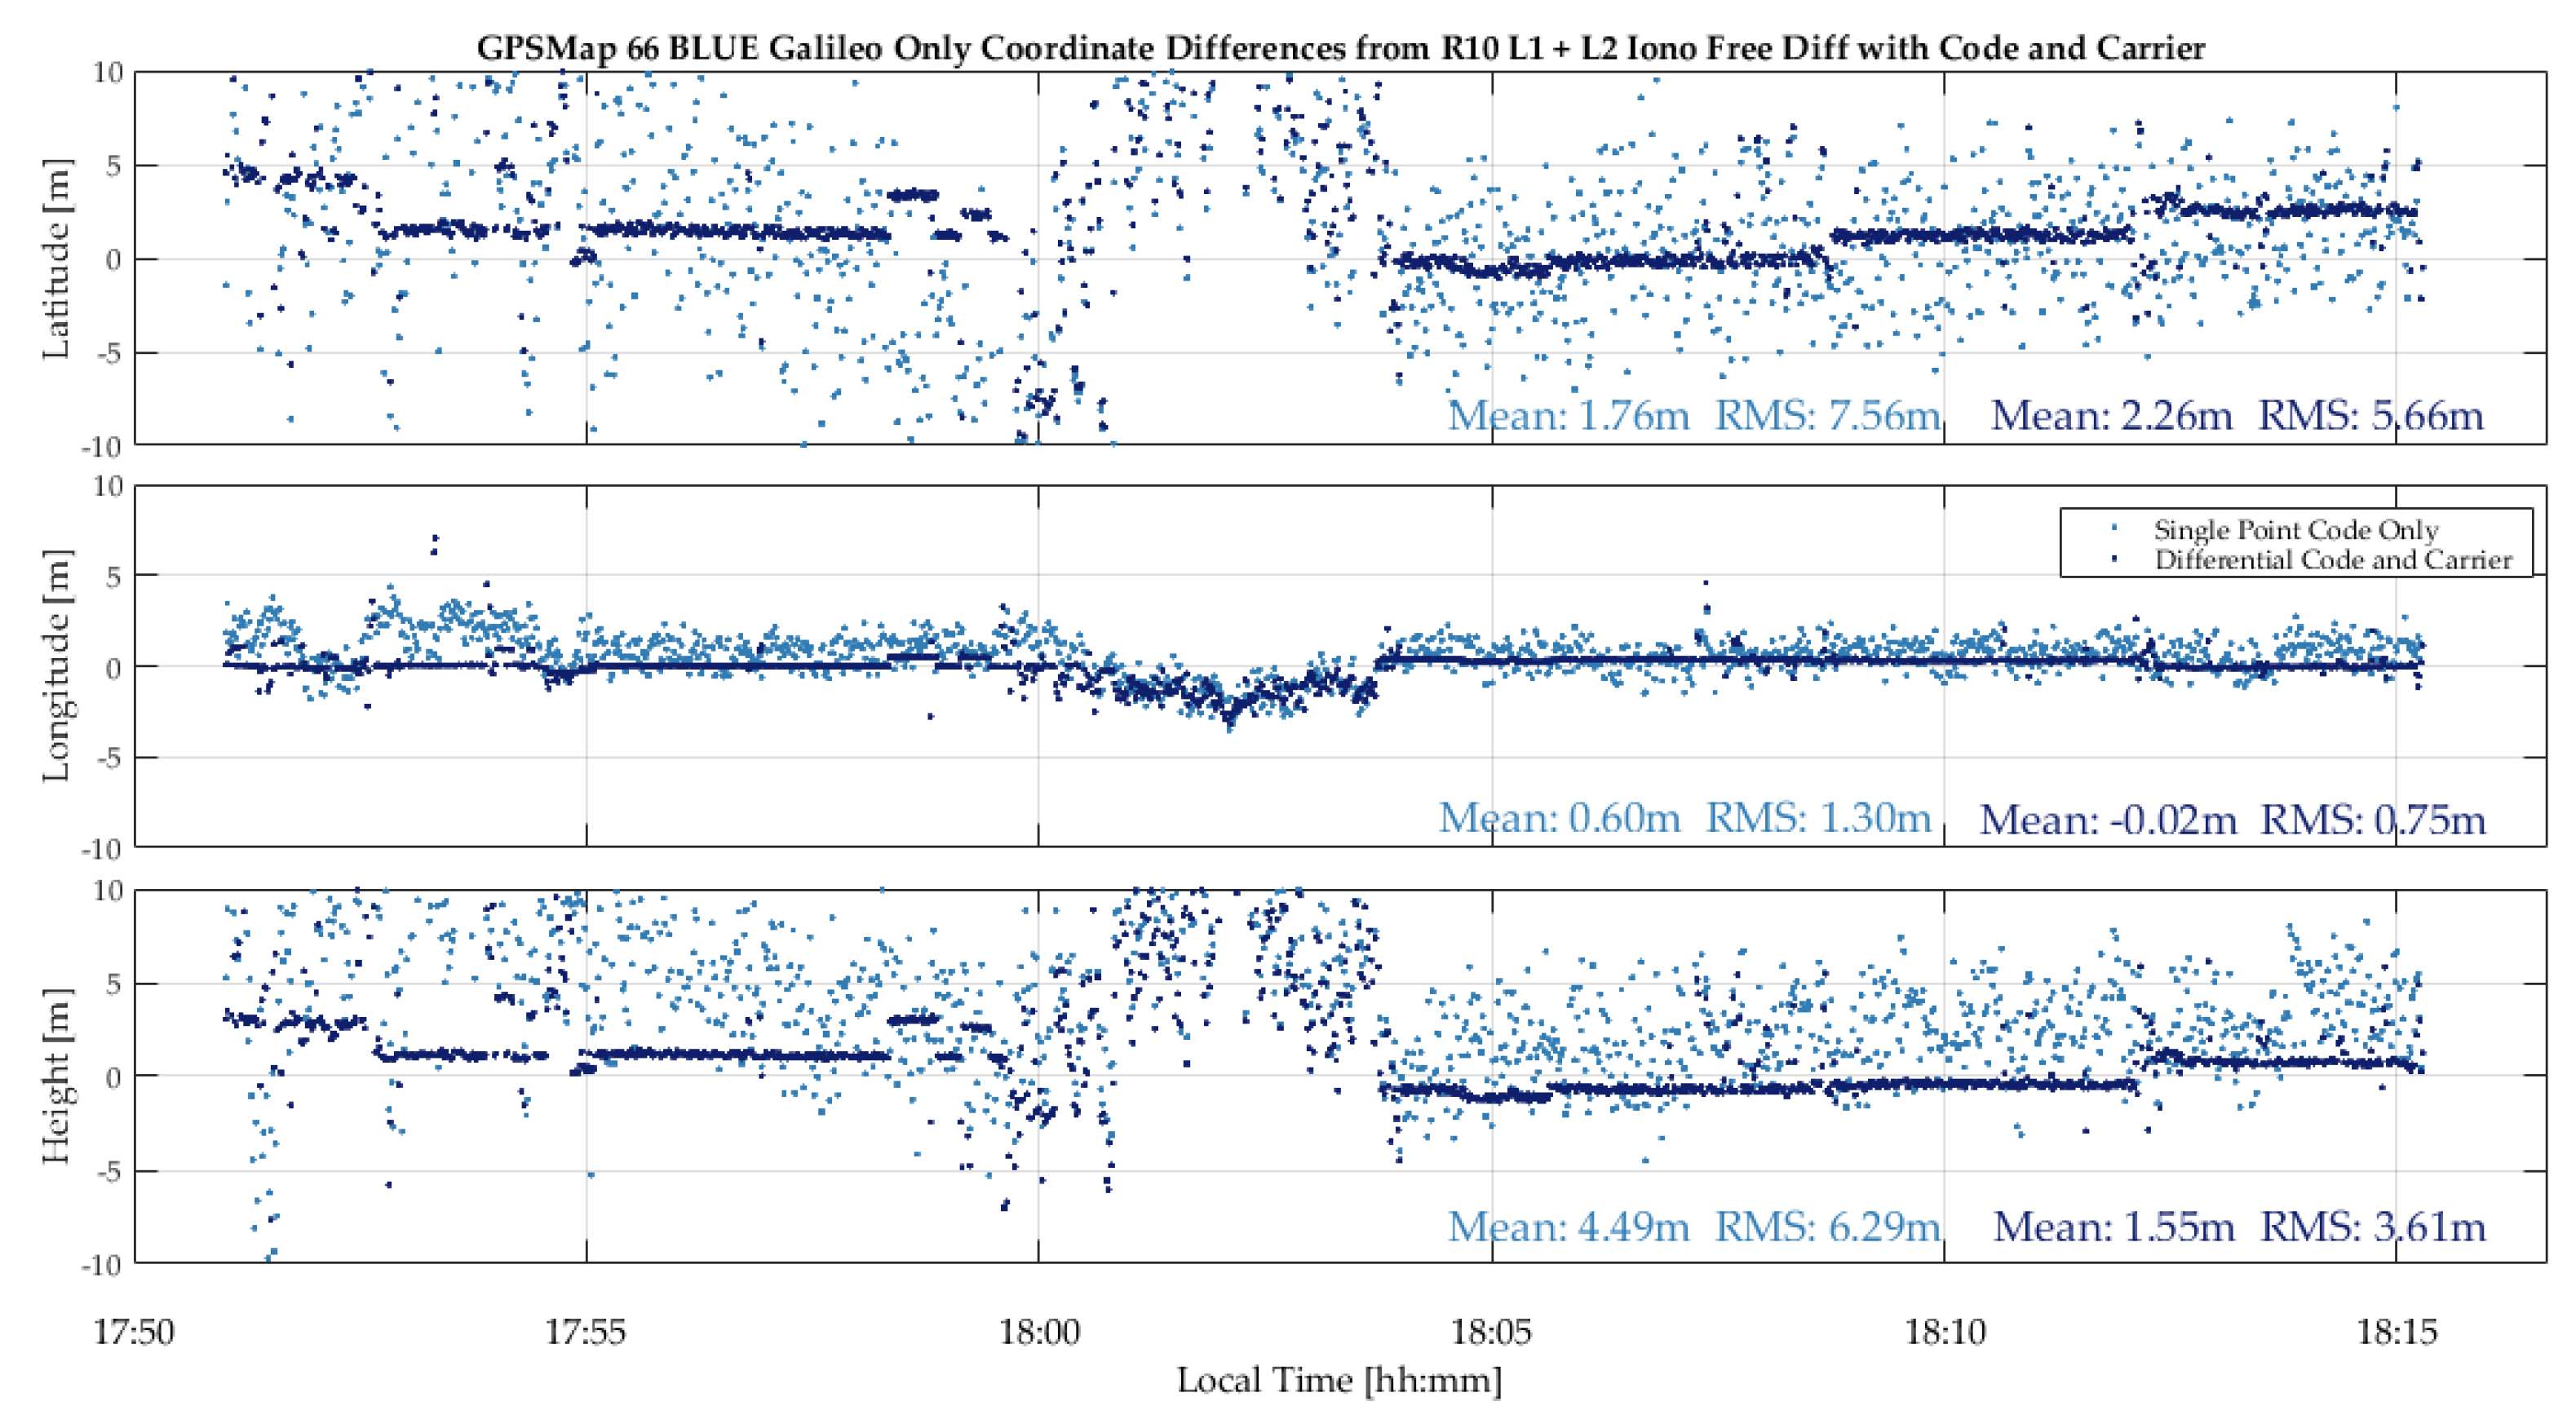
The Galileo coverage was sufficient to obtain solutions with the GPSMap 66 units. The measured C/N
0 values, not shown here, range from 42 to 52 dB-Hz for the R10 and 34 to 46 dB-Hz for the 66 green. The mean difference between the two units is 5 dB-Hz. The Galileo E1 code single point and code/carrier phase position results are shown in
Figure 15. The single point RMS values of 5.39, 1.88 and 4.68 m in latitude, longitude and height are predictably higher than the corresponding values reported for GPS, given a PDOP of 4 to 7 for Galileo versus 2.7 for GPS and four to five SVs for Galileo versus 10 to for GPS. The differential code/carrier phase RMS values of 1.42, 0.14 and 0.75 m versus those of GPS are however roughly in the same range, showing a similar level of code and carrier phase performance tracking at the individual signal level within the above error bounds.
3.3. Vehicular Positioning
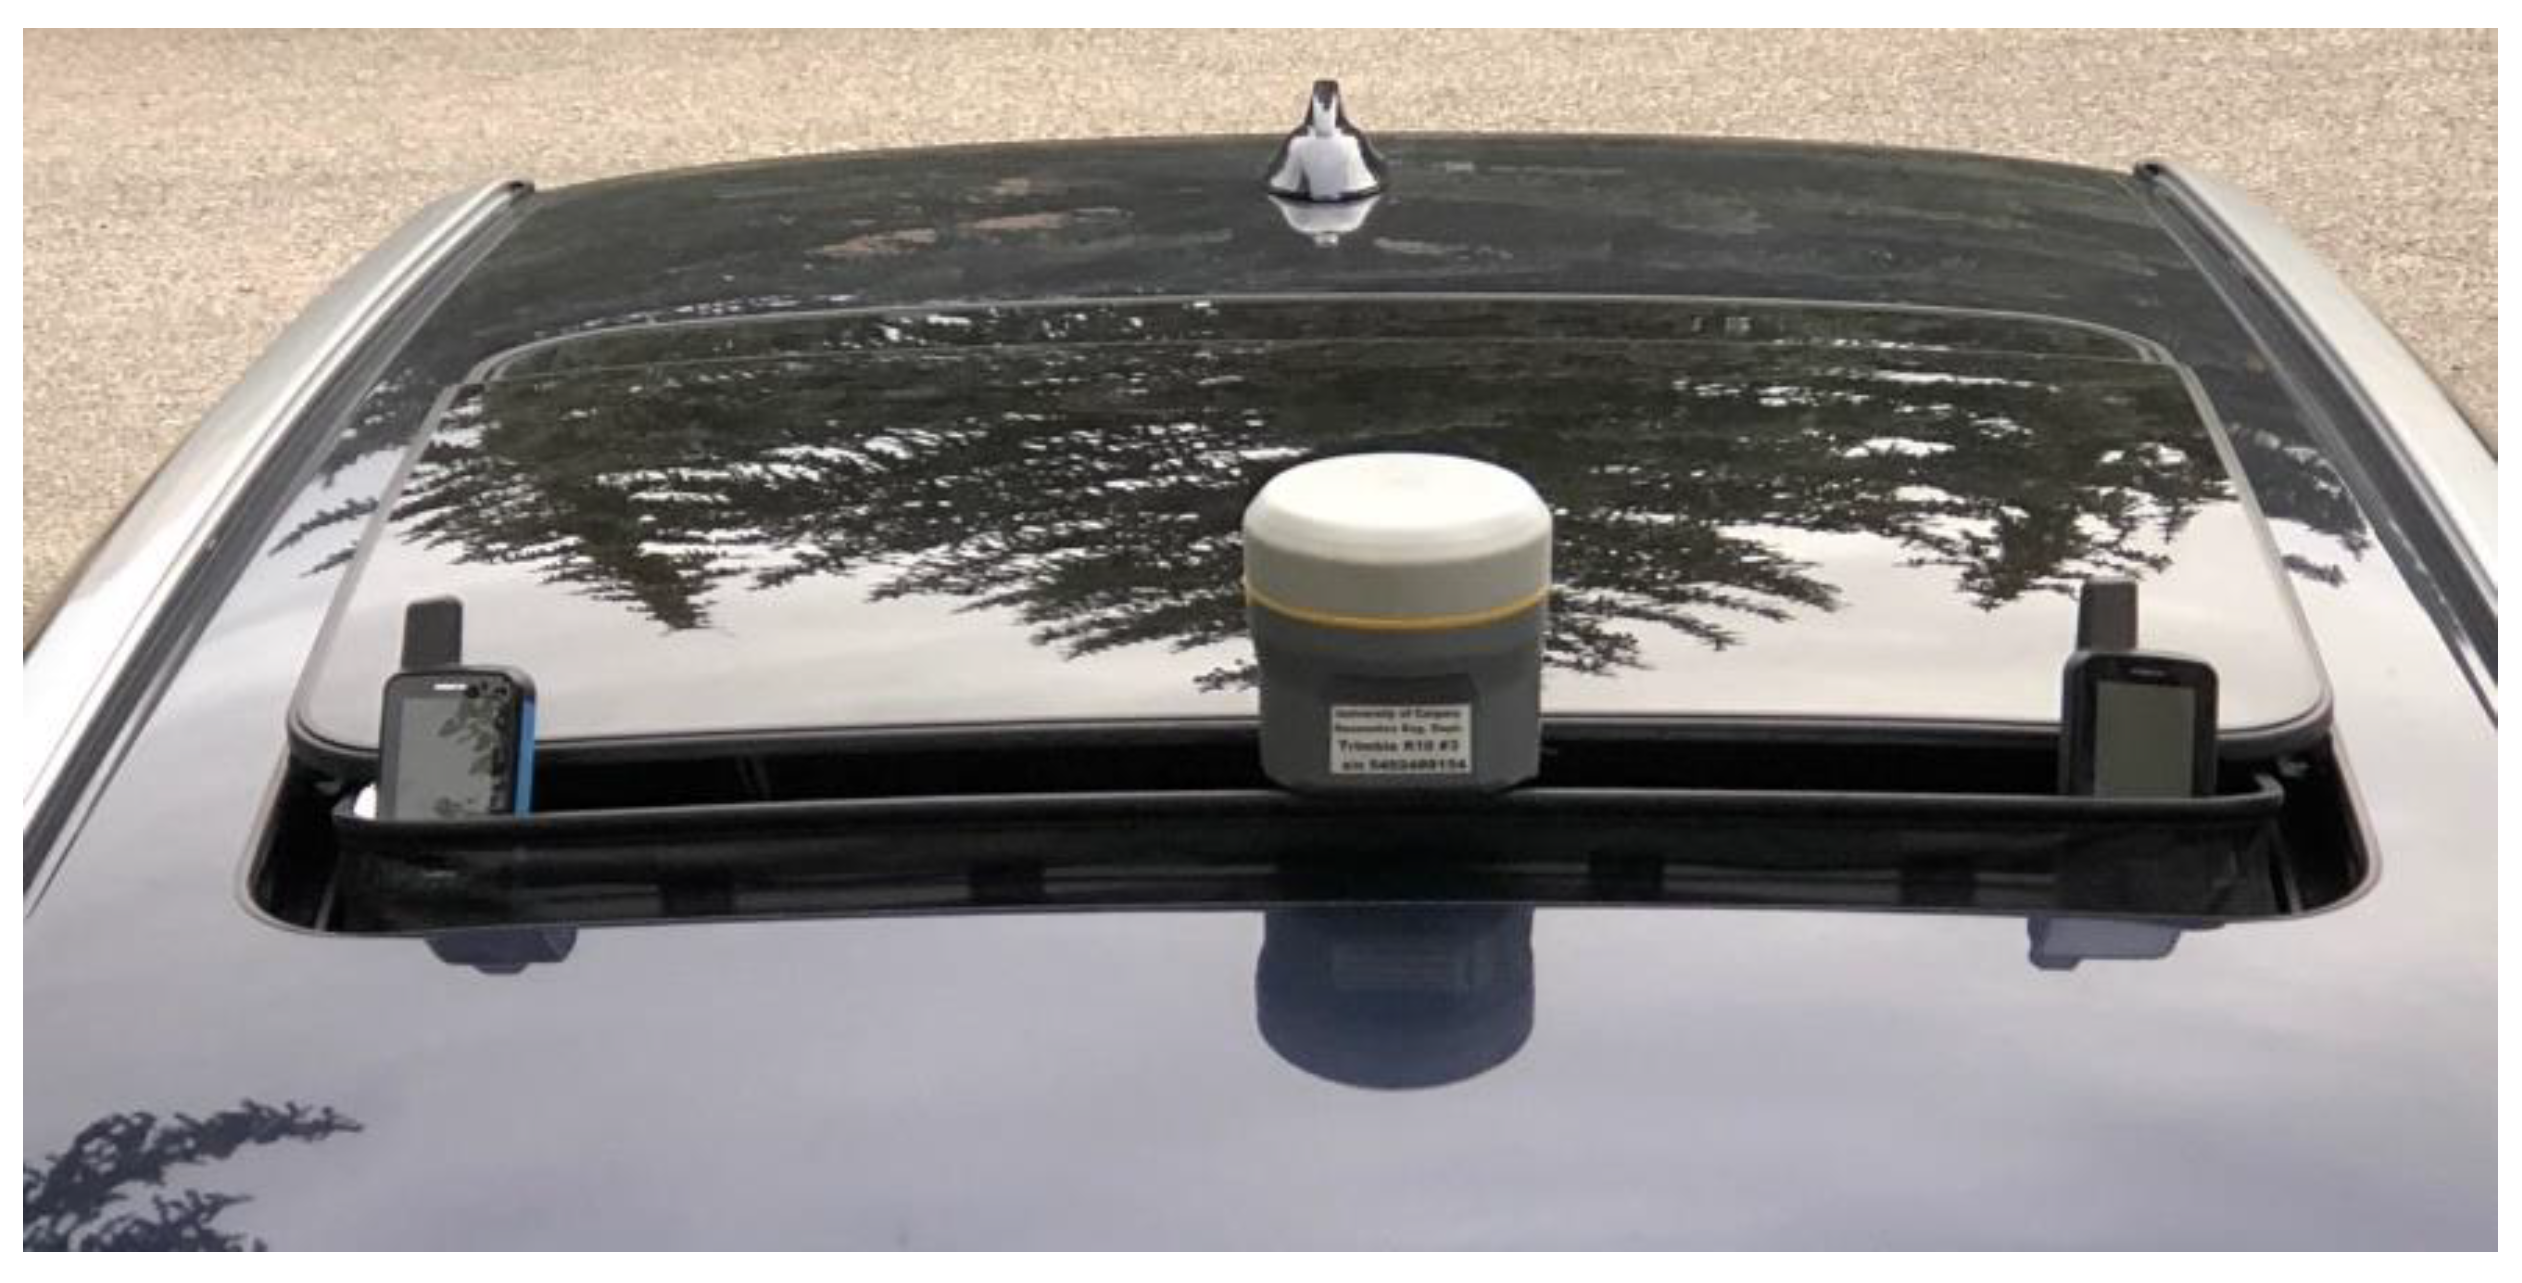
A test to assess the GPSMap 66 units in vehicular mode was carried out on a relatively open 43-km road rectangle at speeds of 80 to 100 km/h. Two 15 km legs of the rectangle was oriented east-west while the two others were north-south. The rectangle was driven twice to assess consistency, resulting in a 2-lap, 86 km trajectory. The R10 and GPSMap 66 units were mounted on a car roof as shown in
Figure 16, to secure access to line-of-sight signals. The antennas are at the same height but separated horizontally from each other by 35 cm. There were unavoidable obstructions by foliage and passing vehicles. A R10 unit at a base station 6 to 20 km away was used for differential processing. The differential R10 trajectory served as reference for evaluating the GPSMap 66 trajectories in each coordinate component. The R10 RTKLib code/carrier phase solution was in float mode and its accuracy in each coordinate would have been better than 10 cm much of the time except during short periods when carrier phase lock losses caused by obstructions along the road occurred. Signal attenuation occurring along the trajectory is seen when examining the C/N
0 measurements of all units in
Figure 17. The two GPSMap 66 were 60 cm but still largely exposed to the same attenuation and multipath. Their C/N
0 patterns are highly correlated, which is also a strong indicator of the high reproducibility of their two helix antenna horizontal and vertical radiation patterns. A code-minus-carrier analysis of the results confirmed that the lower C/N
0 values were caused by multipath. The plots indicate where trees and other obstructions were present. The attenuation is caused by partial line-of-sight blockage and a mix of specular and diffuse multipath. While the average multipath is the same for all units, that of the GPSMap 66 units exhibits deeper attenuations during short time periods, which would be antenna related.
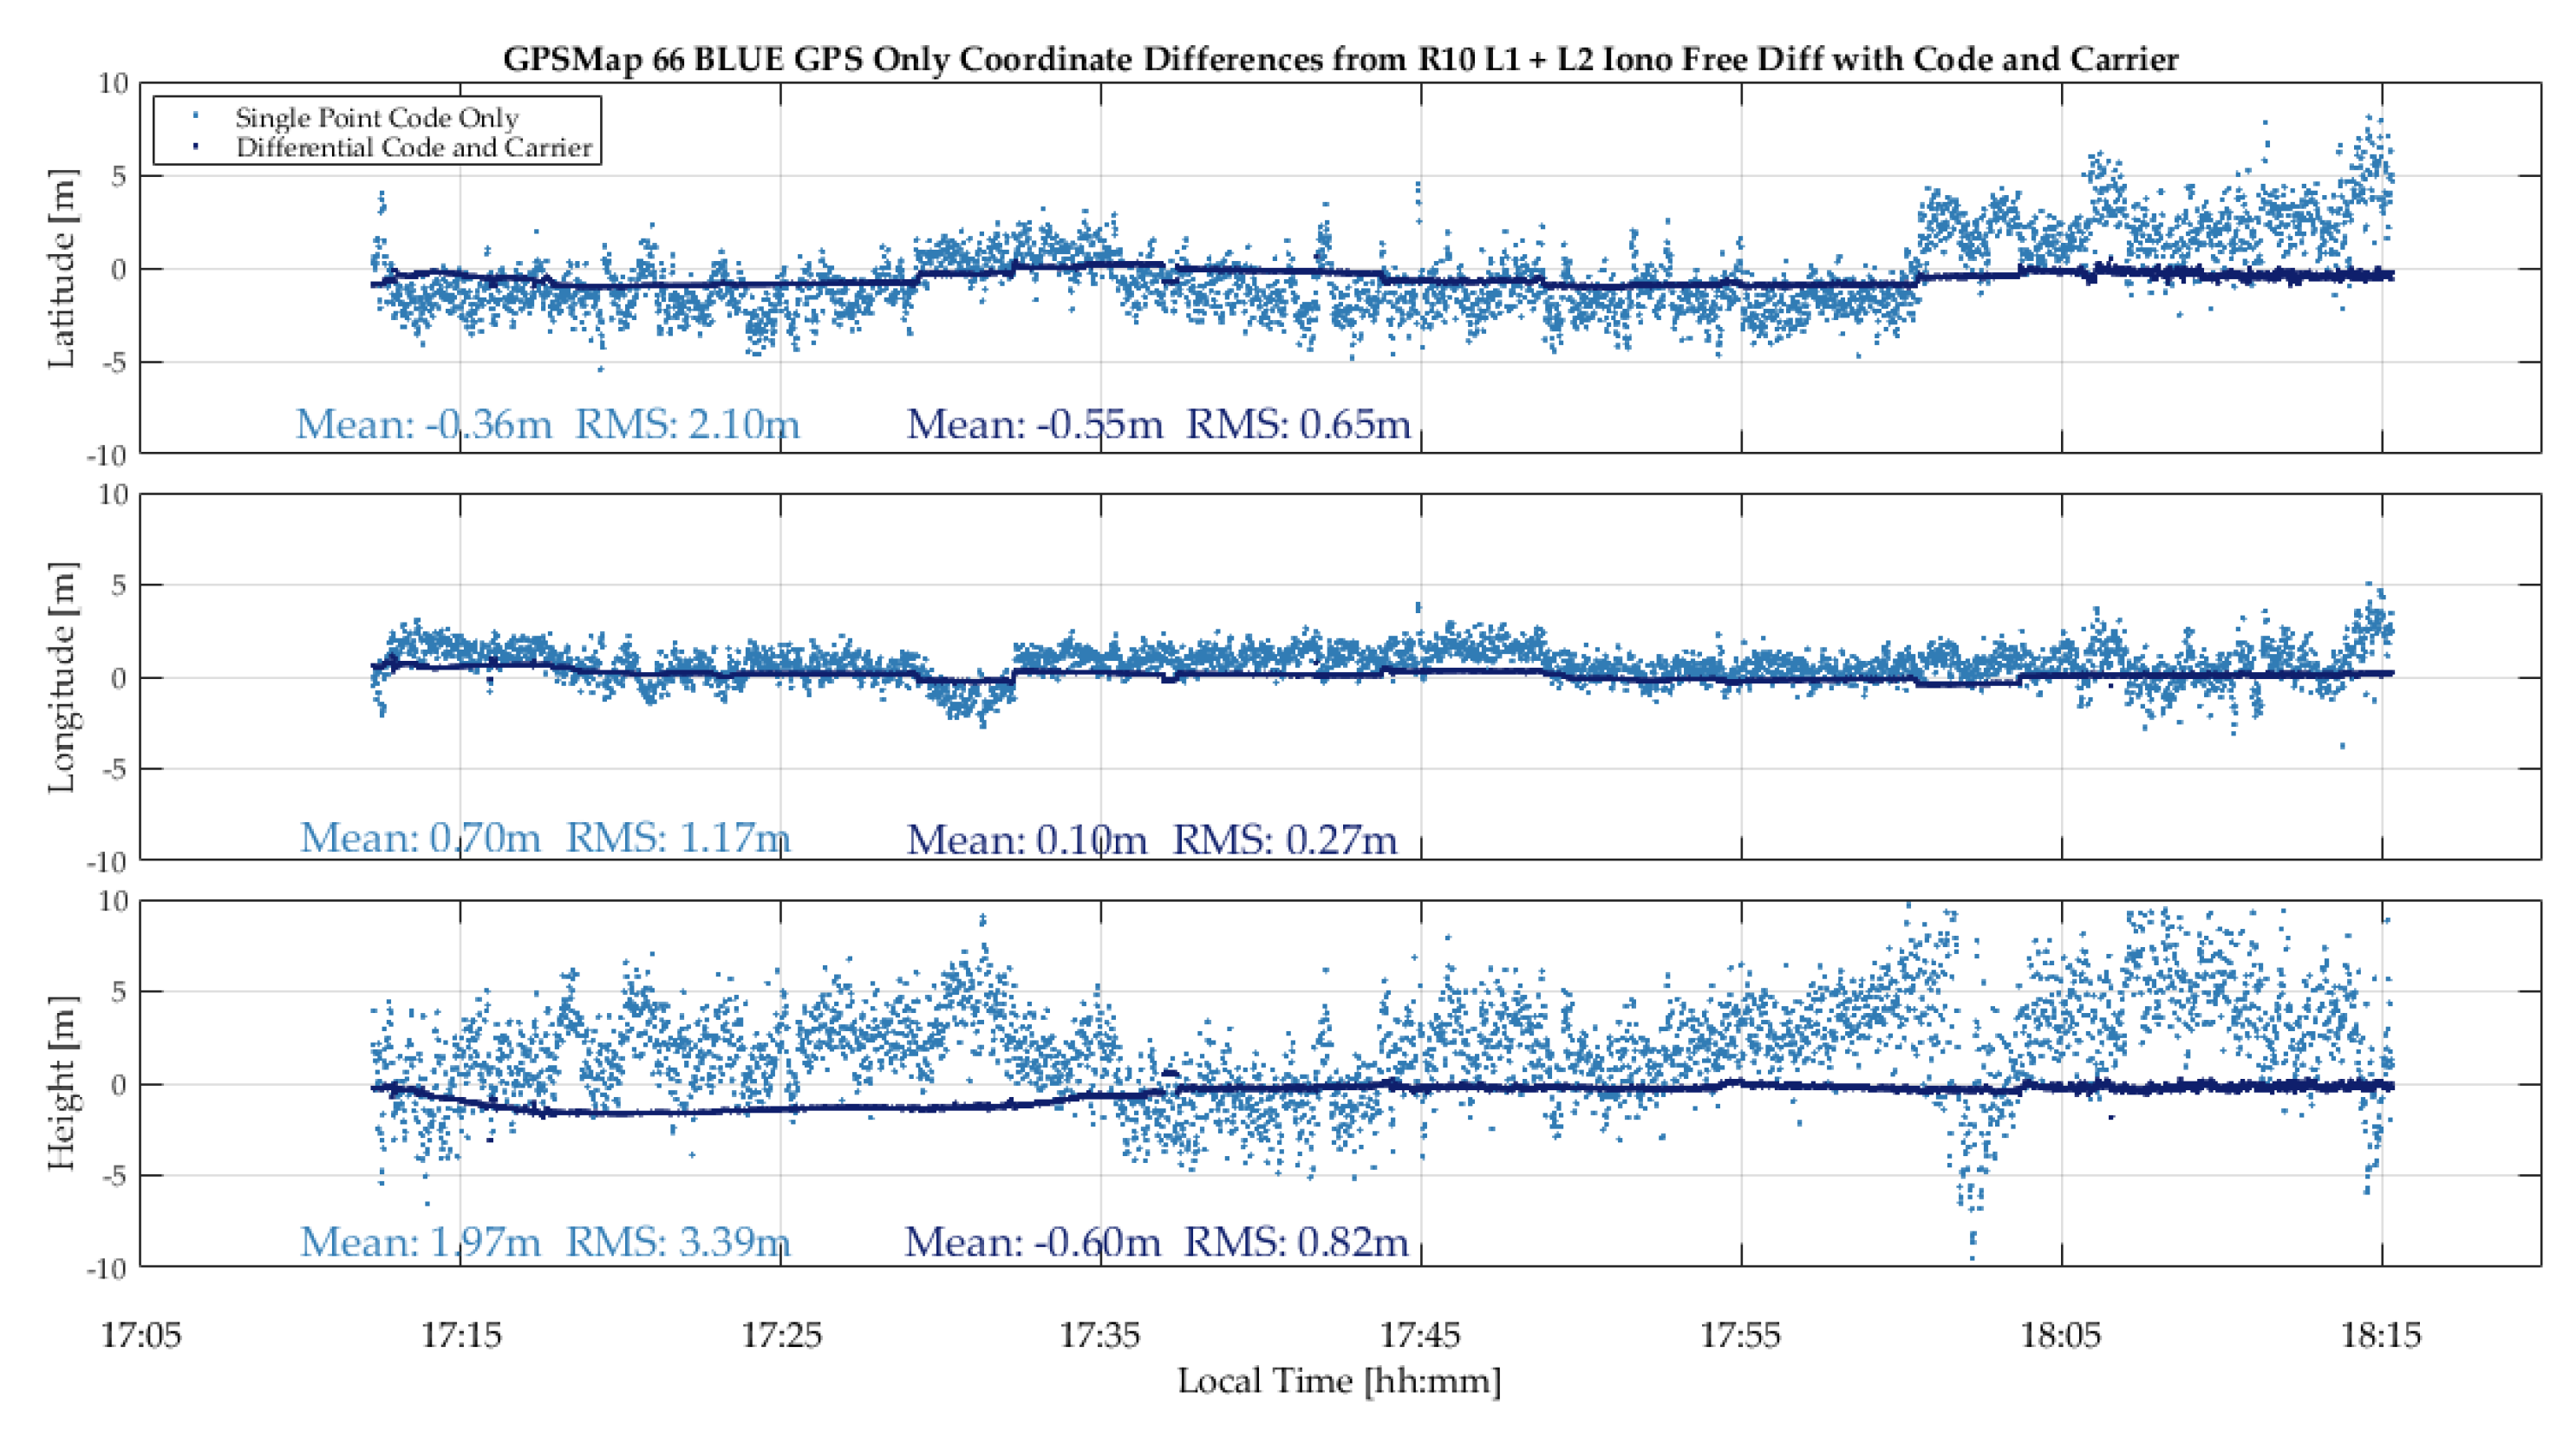
The GPSMap 66 code measurements were processed in epoch-by-epoch code single point mode and in differential code/carrier phase mode, the latter over 95% in float carrier phase ambiguity mode. The differences with respect to the R10 reference trajectory are shown in light and dark blue, and light and dark green in the two plots of
Figure 18. The single point code position performances of the two units are at the same level, with RMS values of 2.10 m, 1.17 m and 3.39 m in latitude, longitude and height for the blue unit versus 1.75 m, 1.11 m and 3.26 m for the green unit. The mean differences are well within the above RMS values. These differences are due mostly to a combination of GPSMap 66 code multipath and noise. The differential code/carrier phase results are significantly better with RMS values of 0.65 m, 0.27 m and 0.82 m in latitude, longitude and height for the blue unit and 0.46 m, 0.37 m and 1.19 m for the green unit, hence clearly better than the 1 m RMS level. The float ambiguity mode of the GPSMap RTKLib code/carrier phase solution means that phase lock was maintained on a sufficient number of GPS SVs to produce a carrier phase based solution, albeit float, over 95% of the time.
The effects of carrier phase ambiguity float mode solutions with the GPSMap 66 units and the R10 unit some of the time are due to signal shading that results in occasional losses of phase lock. This has a significant impact on the magnitude of the mean and RMS differences reported above. In float mode, code measurements are used with varying weights and their noise and multipath enter the solutions. The ionosphere has no effect on the GPSMap 66 L1 measurements in differential mode. In single point mode, it has no significant effect in this case either. The magnitude of the ionospheric effect was measured by successively processing the R10 data at the nearby base station in L1/L2 and L1 mode. The latitude, longitude and height differences (L1/L2 − L1) were −3, −4 and −4 cm.
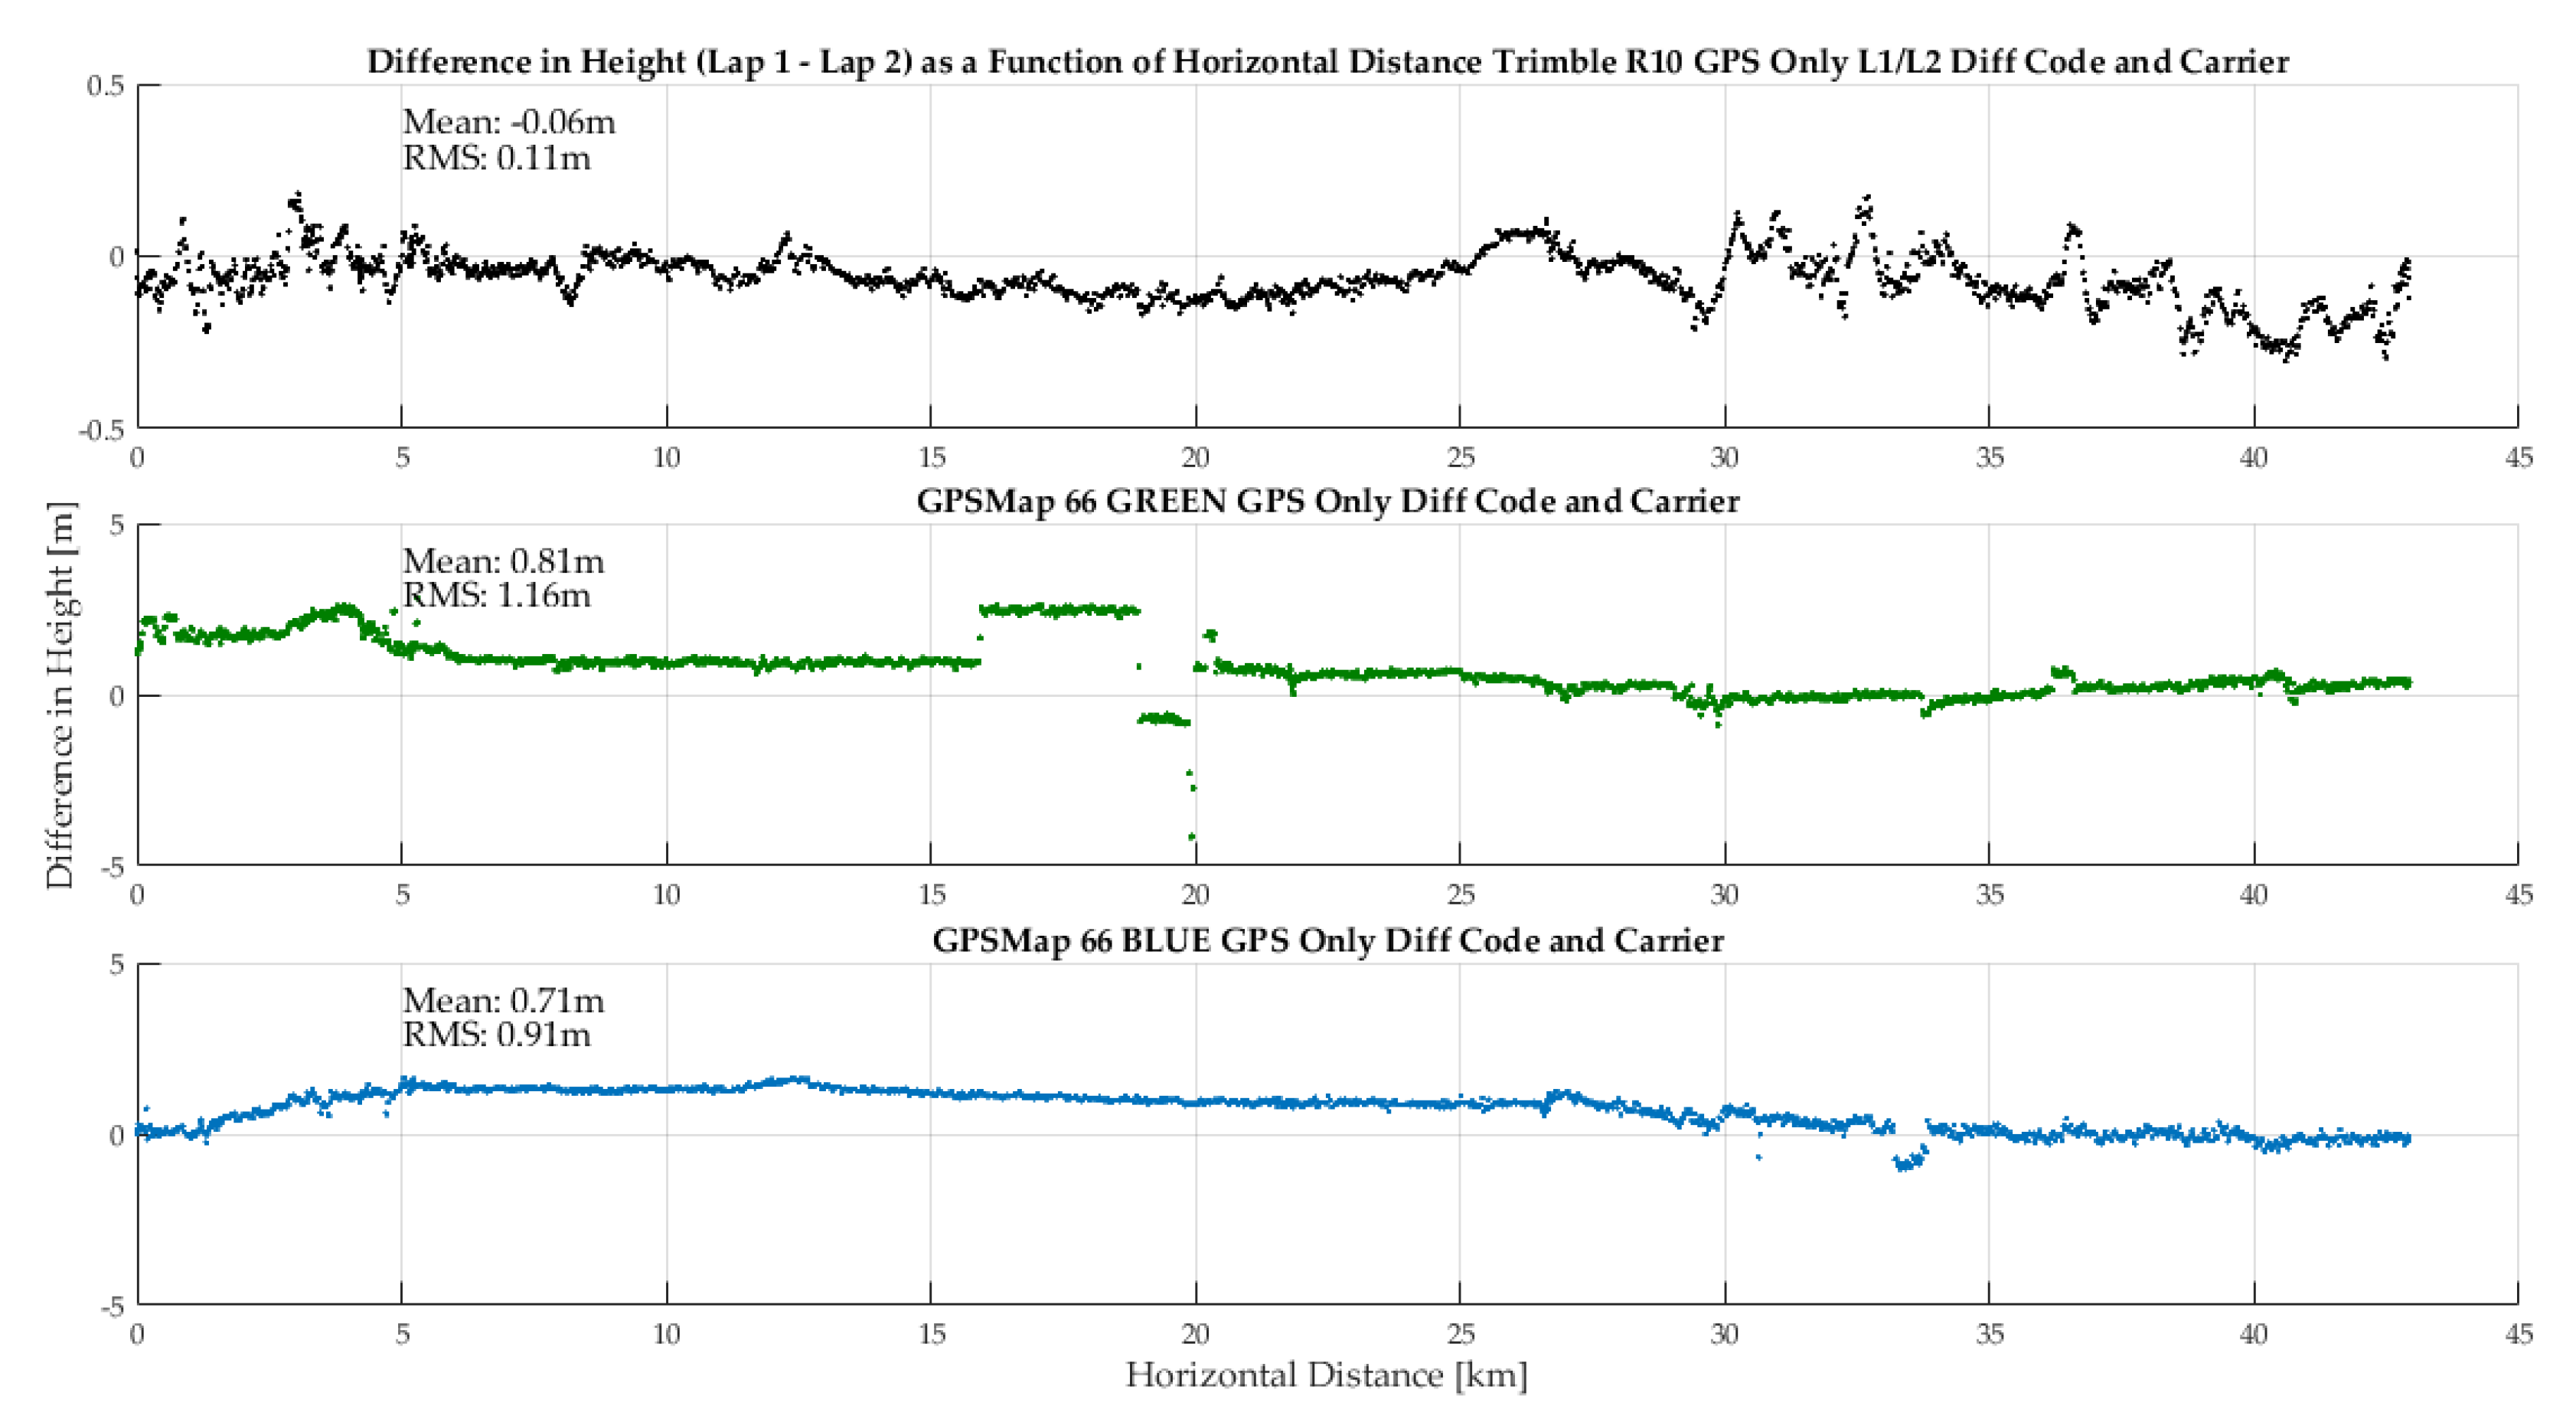
The two iterations of the rectangular vehicular trajectory (Lap 1 and 2) allows one to assess height profile repeatability as a function of horizontal coordinates. This is done in
Figure 19 for the R10 and the two GPSMap 66 units, all in differential code and carrier phase mode. Predictably, the R10 height repeatability is within 10 cm except where obstructions along the road result in losses of phase lock. Repeatability of the GPSMap 66 units is lower, with the RMS difference being slightly over 1 m for the green unit. These results confirm independently the validity of the mean and RMS values shown in
Figure 18.
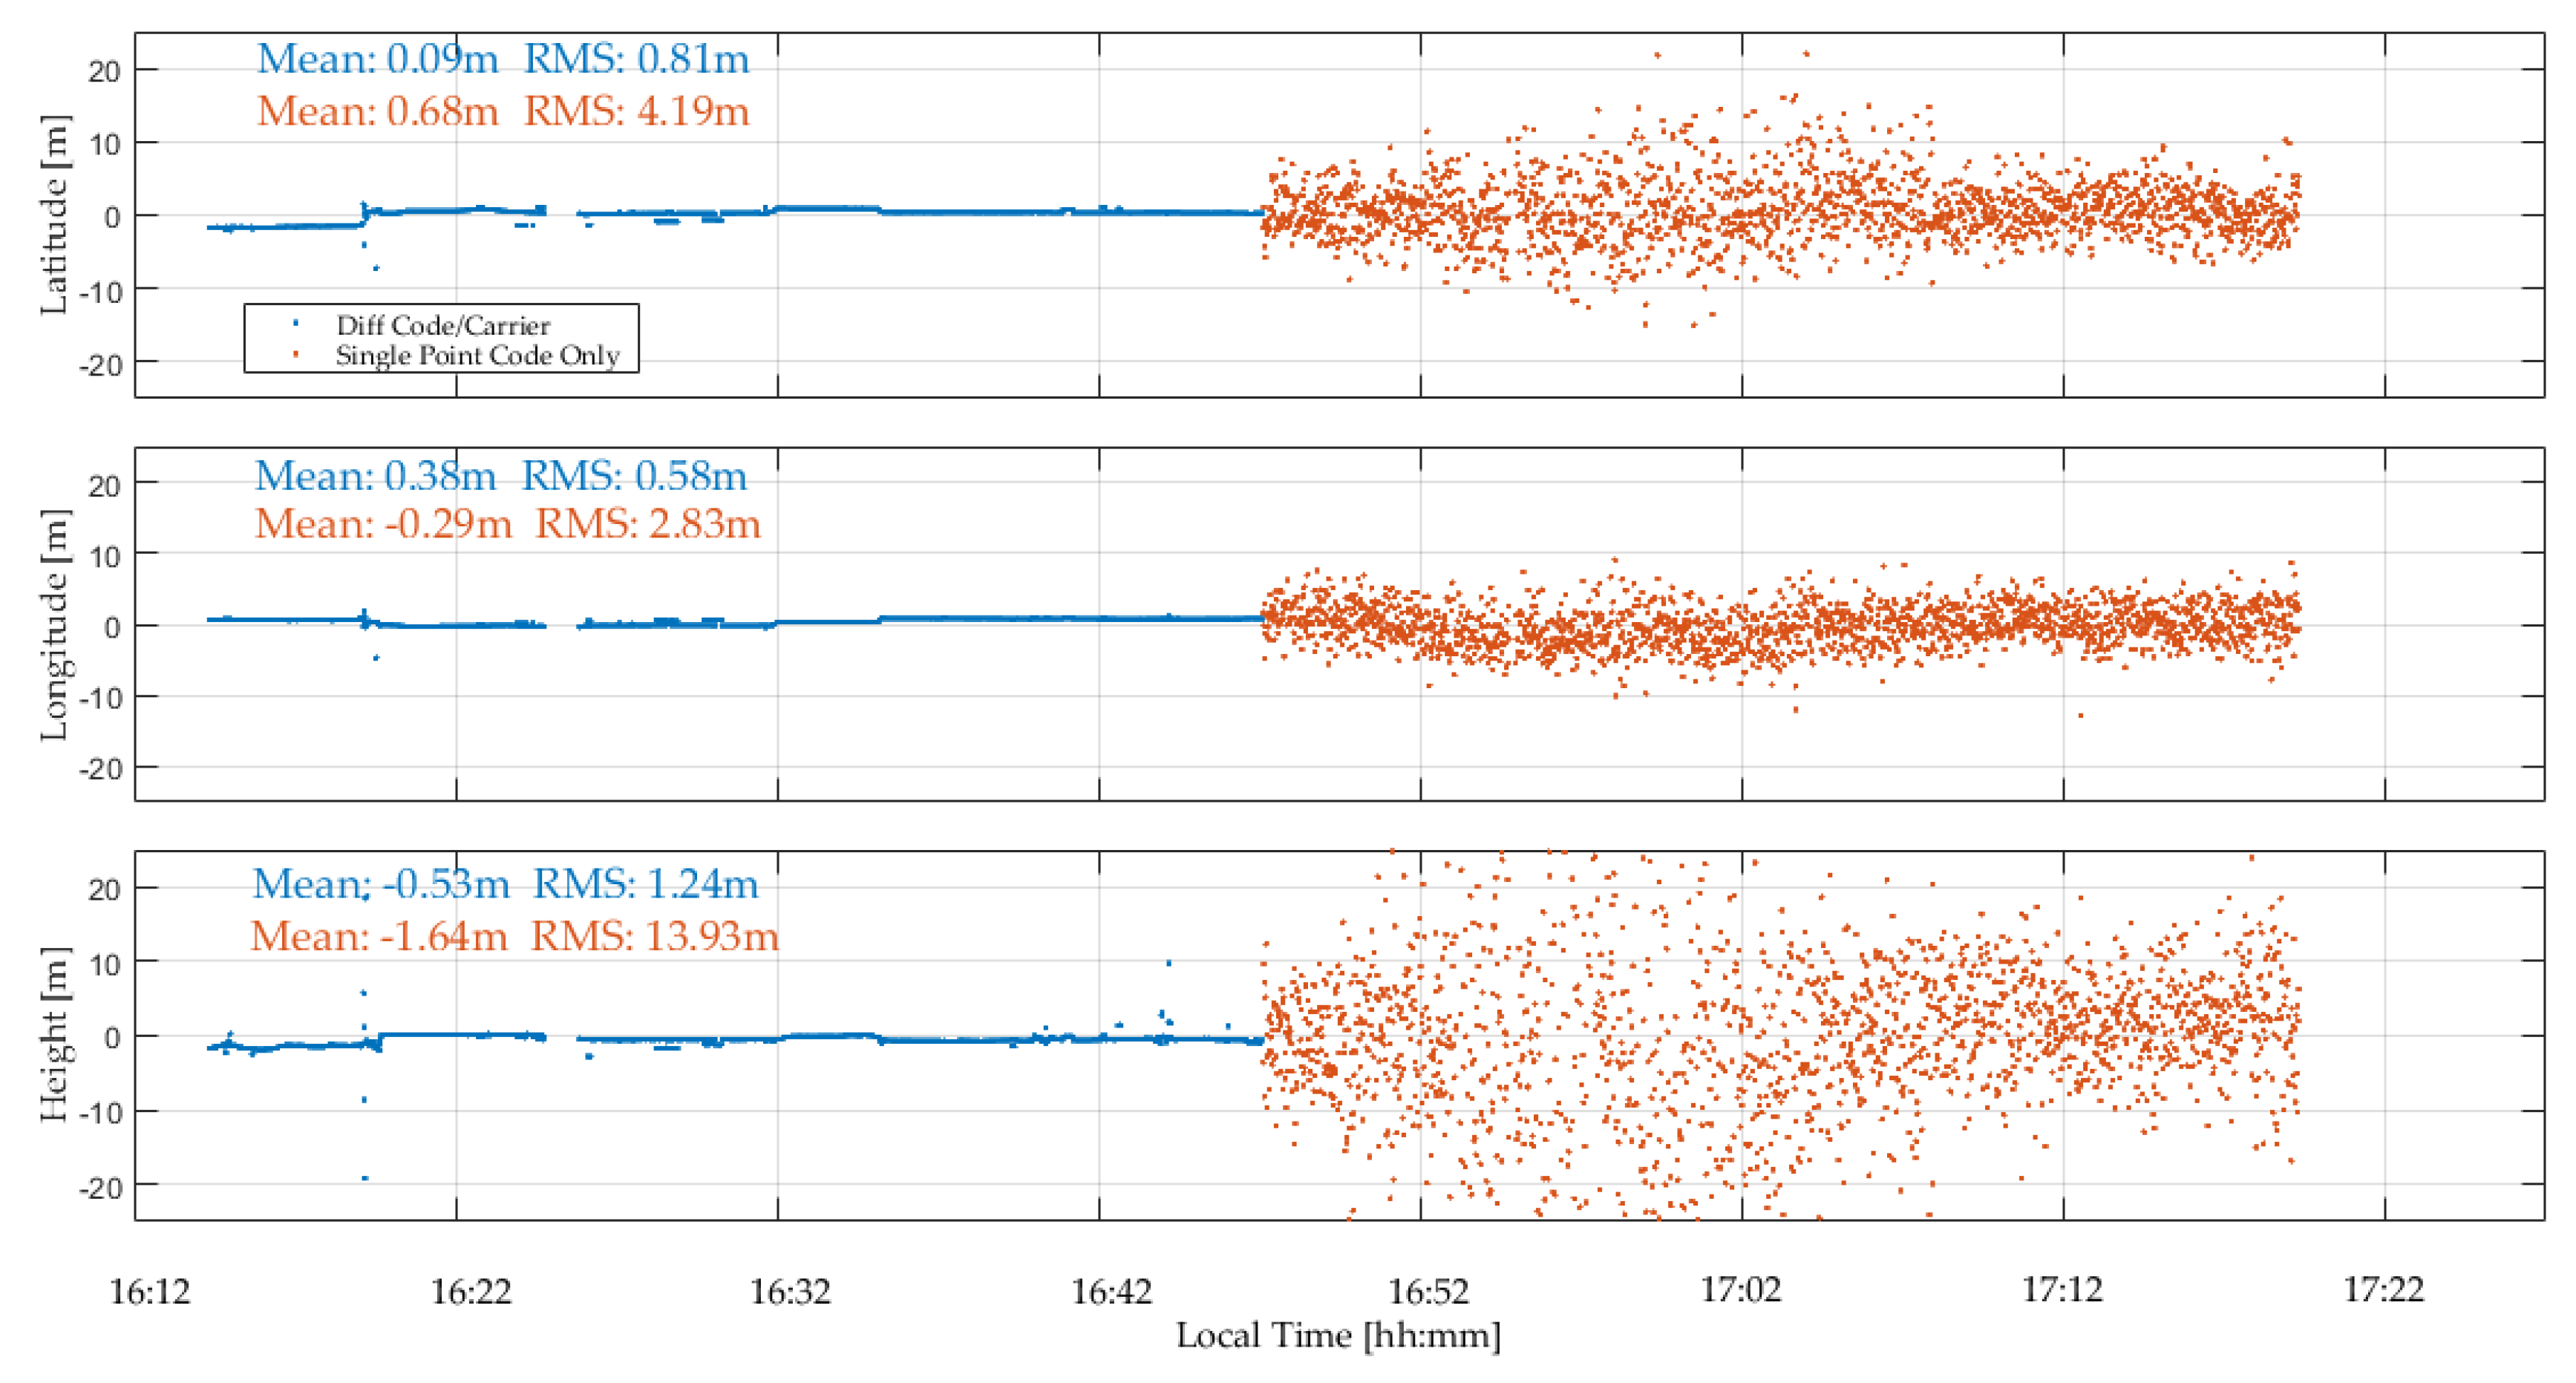
Galileo only results: Although the number of satellite available above the horizon was only five and in a sub-optimal geometry, enough Galileo satellites were available to calculate an independent solution for part of the time as shown in
Figure 20. Despite the poor geometry and signal shading, the differential code/carrier solution was available some 70% of the time during the 25-minperiod. The single point position is noisier than the GPS one due to higher DOP values and lower measurement redundancy.
P10 Vehicular test: The P10 was tested in the same manner as above but at a different time on the same trajectory, again with two laps. The GPS C/N
0 values, shown in
Figure 21, exhibit the same attenuation pattern as seen for the GPSMap 66 test, although the average C/N
0 is lower by 4 dB-Hz, a highly significant and detrimental effect on carrier phase tracking. The comparison of the P10 and R10 reference trajectory is shown in
Figure 22 During the first lap, the P10 maintained phase lock and the results are very good and similar to those of the GPSMap 66 in the previous test. During the second lap, phase lock was lost and did not recover, likely due to Android 8 operating system limitations as mentioned earlier. Hence the second half of
Figure 22 shows performance in differential code mode only. Galileo coverage was available and the P10 was able to successfully track signals during various periods but only in E1 code mode. The geometry of the SVs tracked was not sufficient to calculate reliable positions.
3.4. Indoor Testing
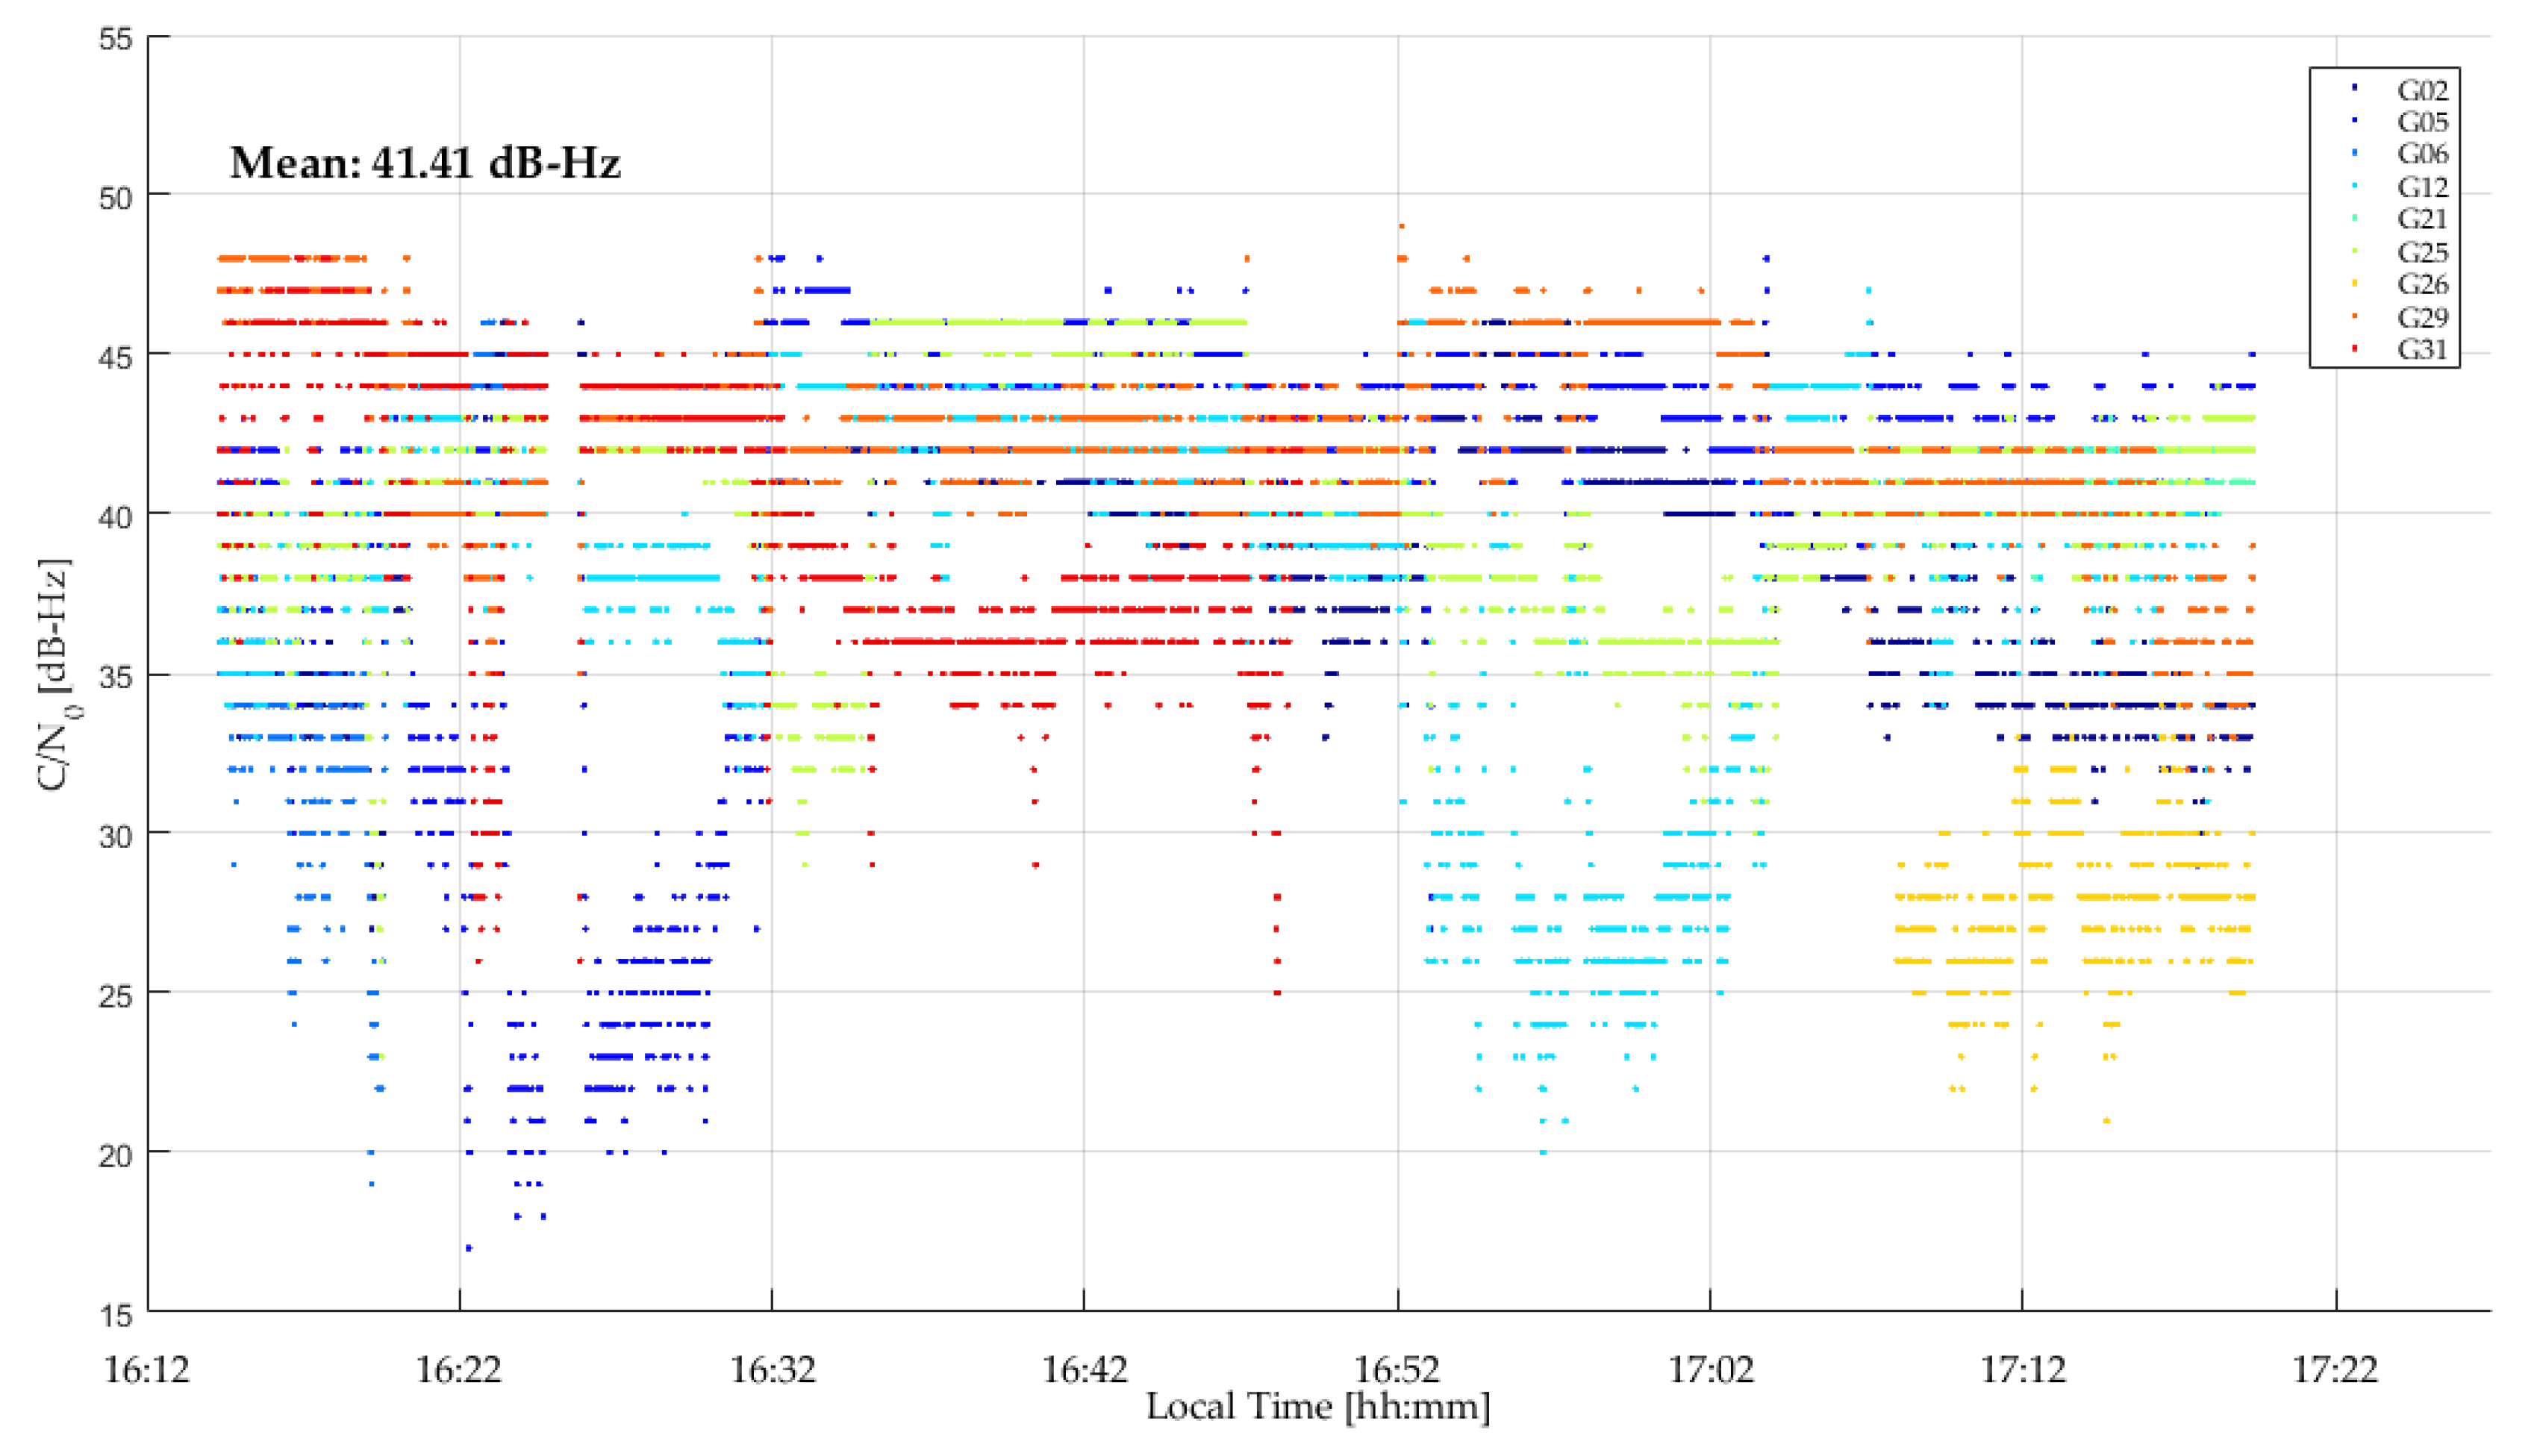
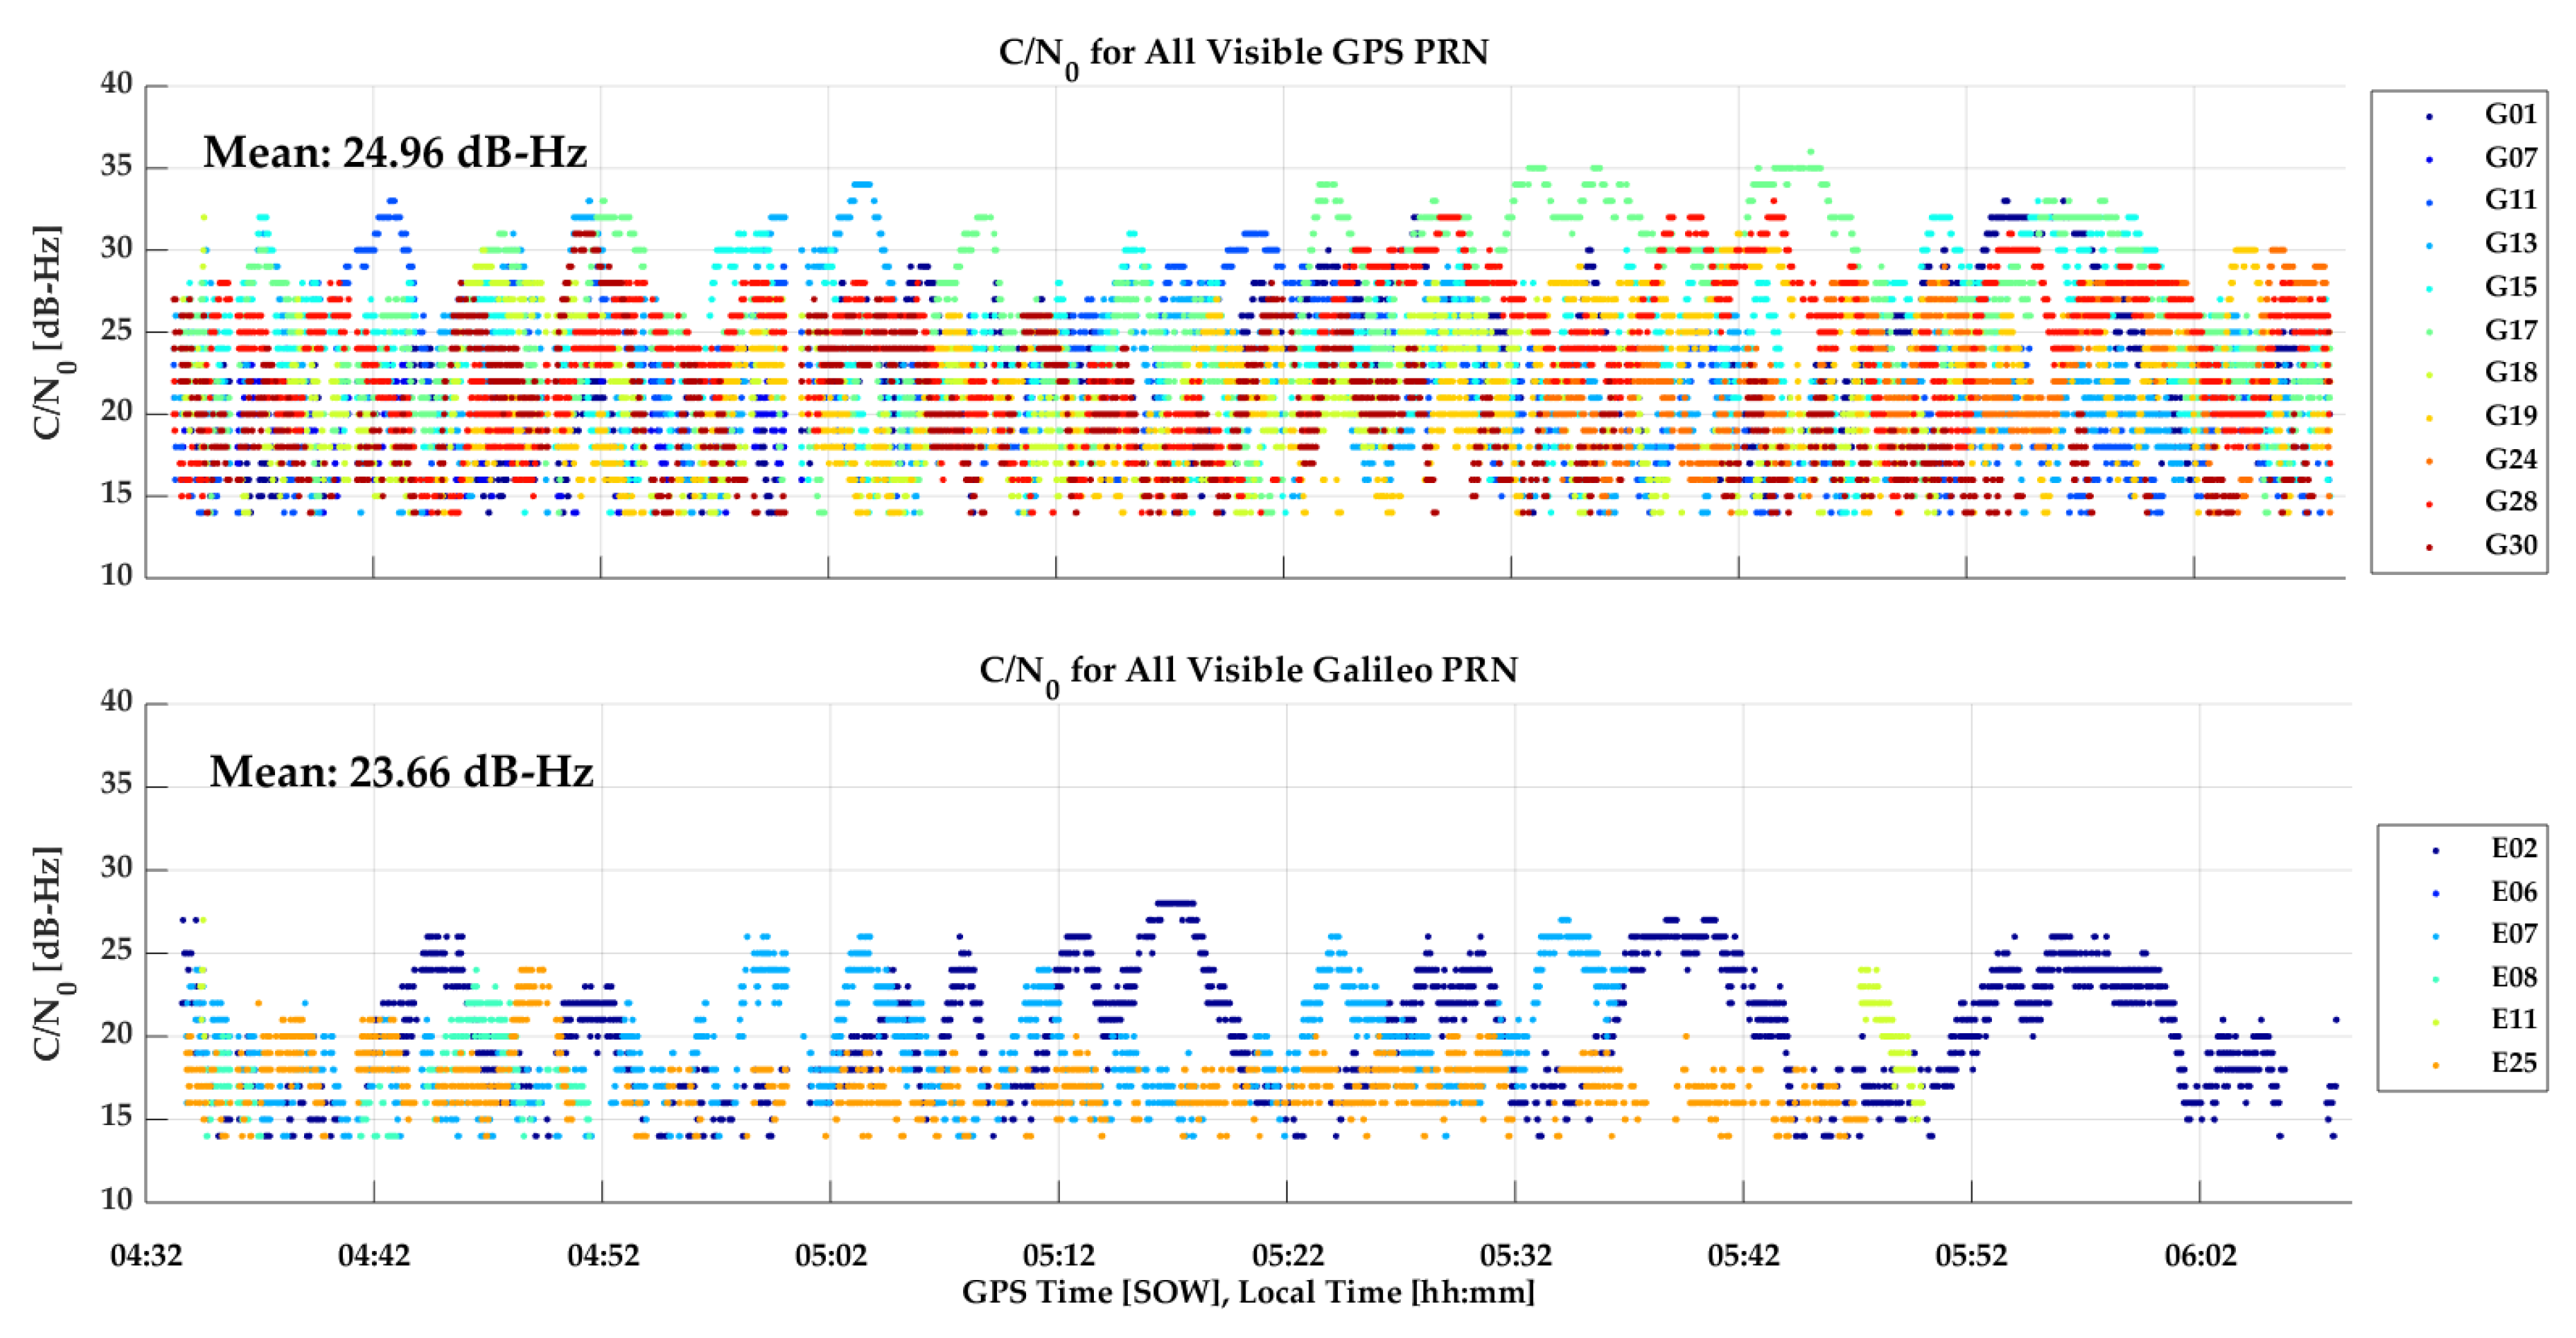
In order to study GNSS signal behavior with the GPSMap 66 and P10 units in an indoor environment, a test was conducted in the basement of a private residence. GPSMap 66 results are reported below. The P10 only recorded a few GPS SVs periodically, although it was initialized outside, hence there are no results to report. Indoor environments are difficult to fully characterize in term of GNSS signal behavior. An important metric is signal attenuation. Others are the size of the room in which the test occurs, wall materials and windows as these impact multipath characteristics. The 90-min test reported herein took place when up to six Galileo SVs were available. The room size was 4 m × 4 m × 2.5 m, concrete walls were 1 m above the ground and one outer wall had a 2.5 m × 1 m window. The coordinates were transferred from an outdoor position with accuracy of 1 m.
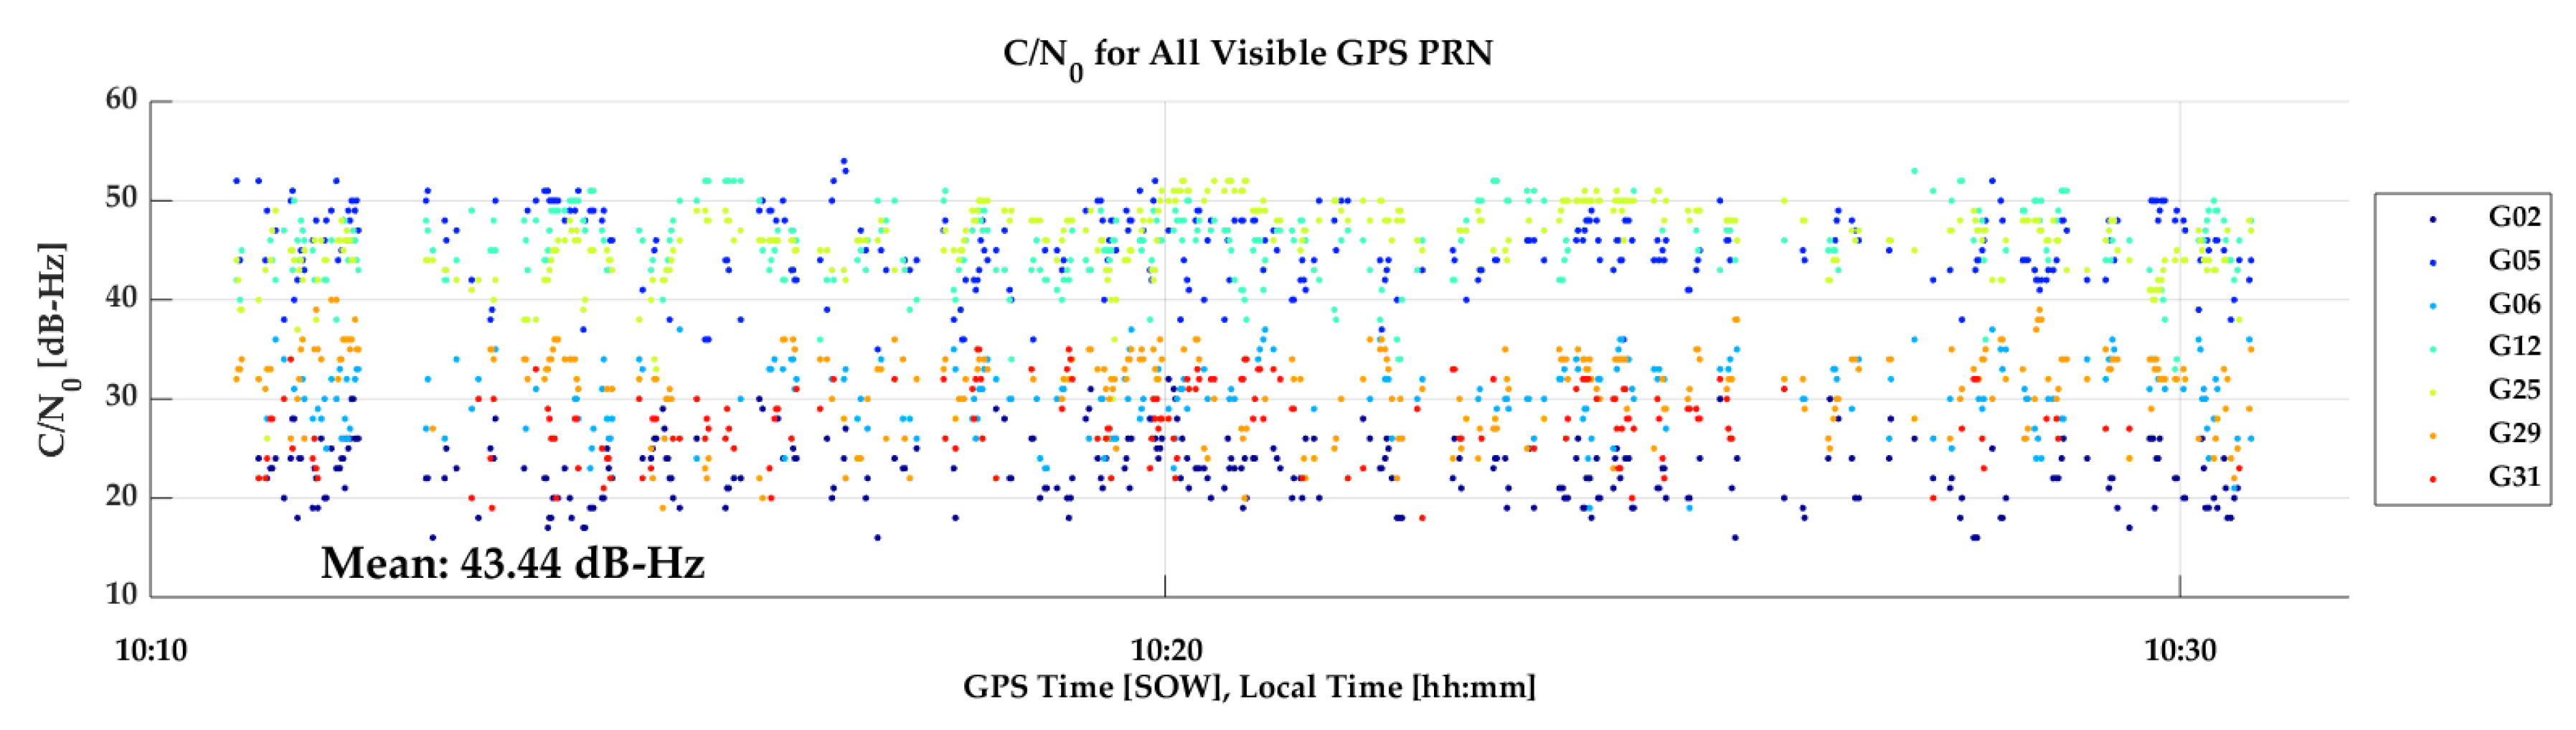
The GPSMap 66 C/N
0 values measured during the test are shown in
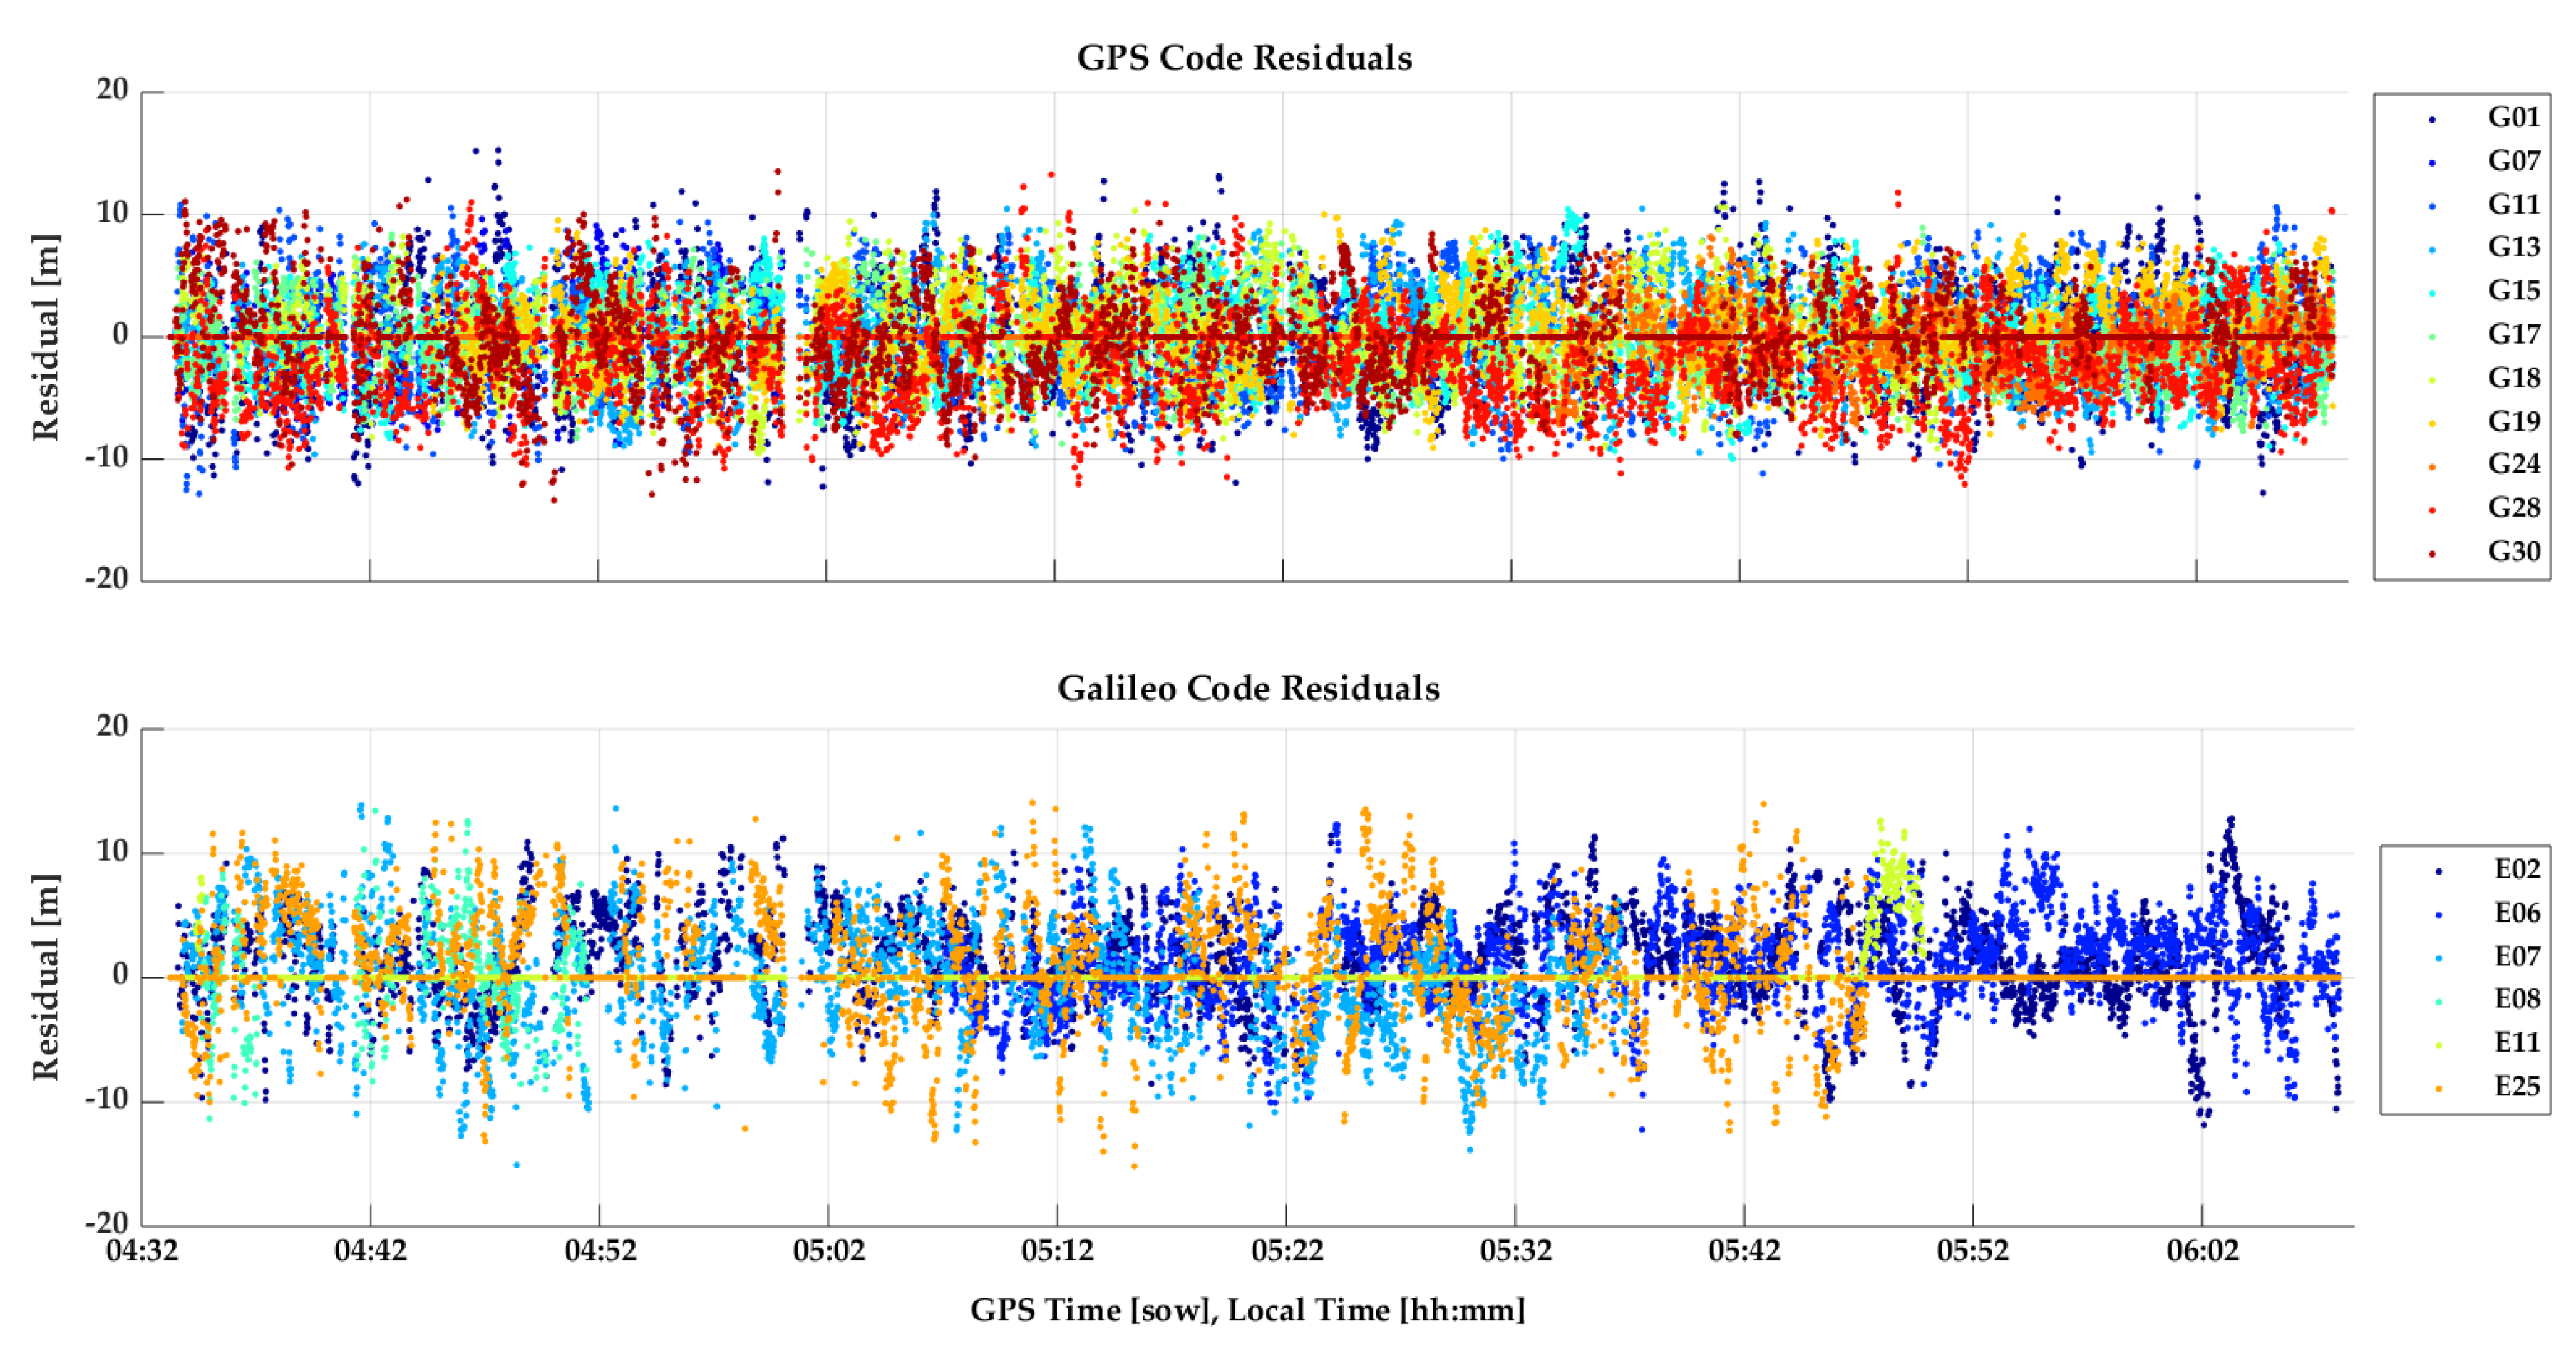
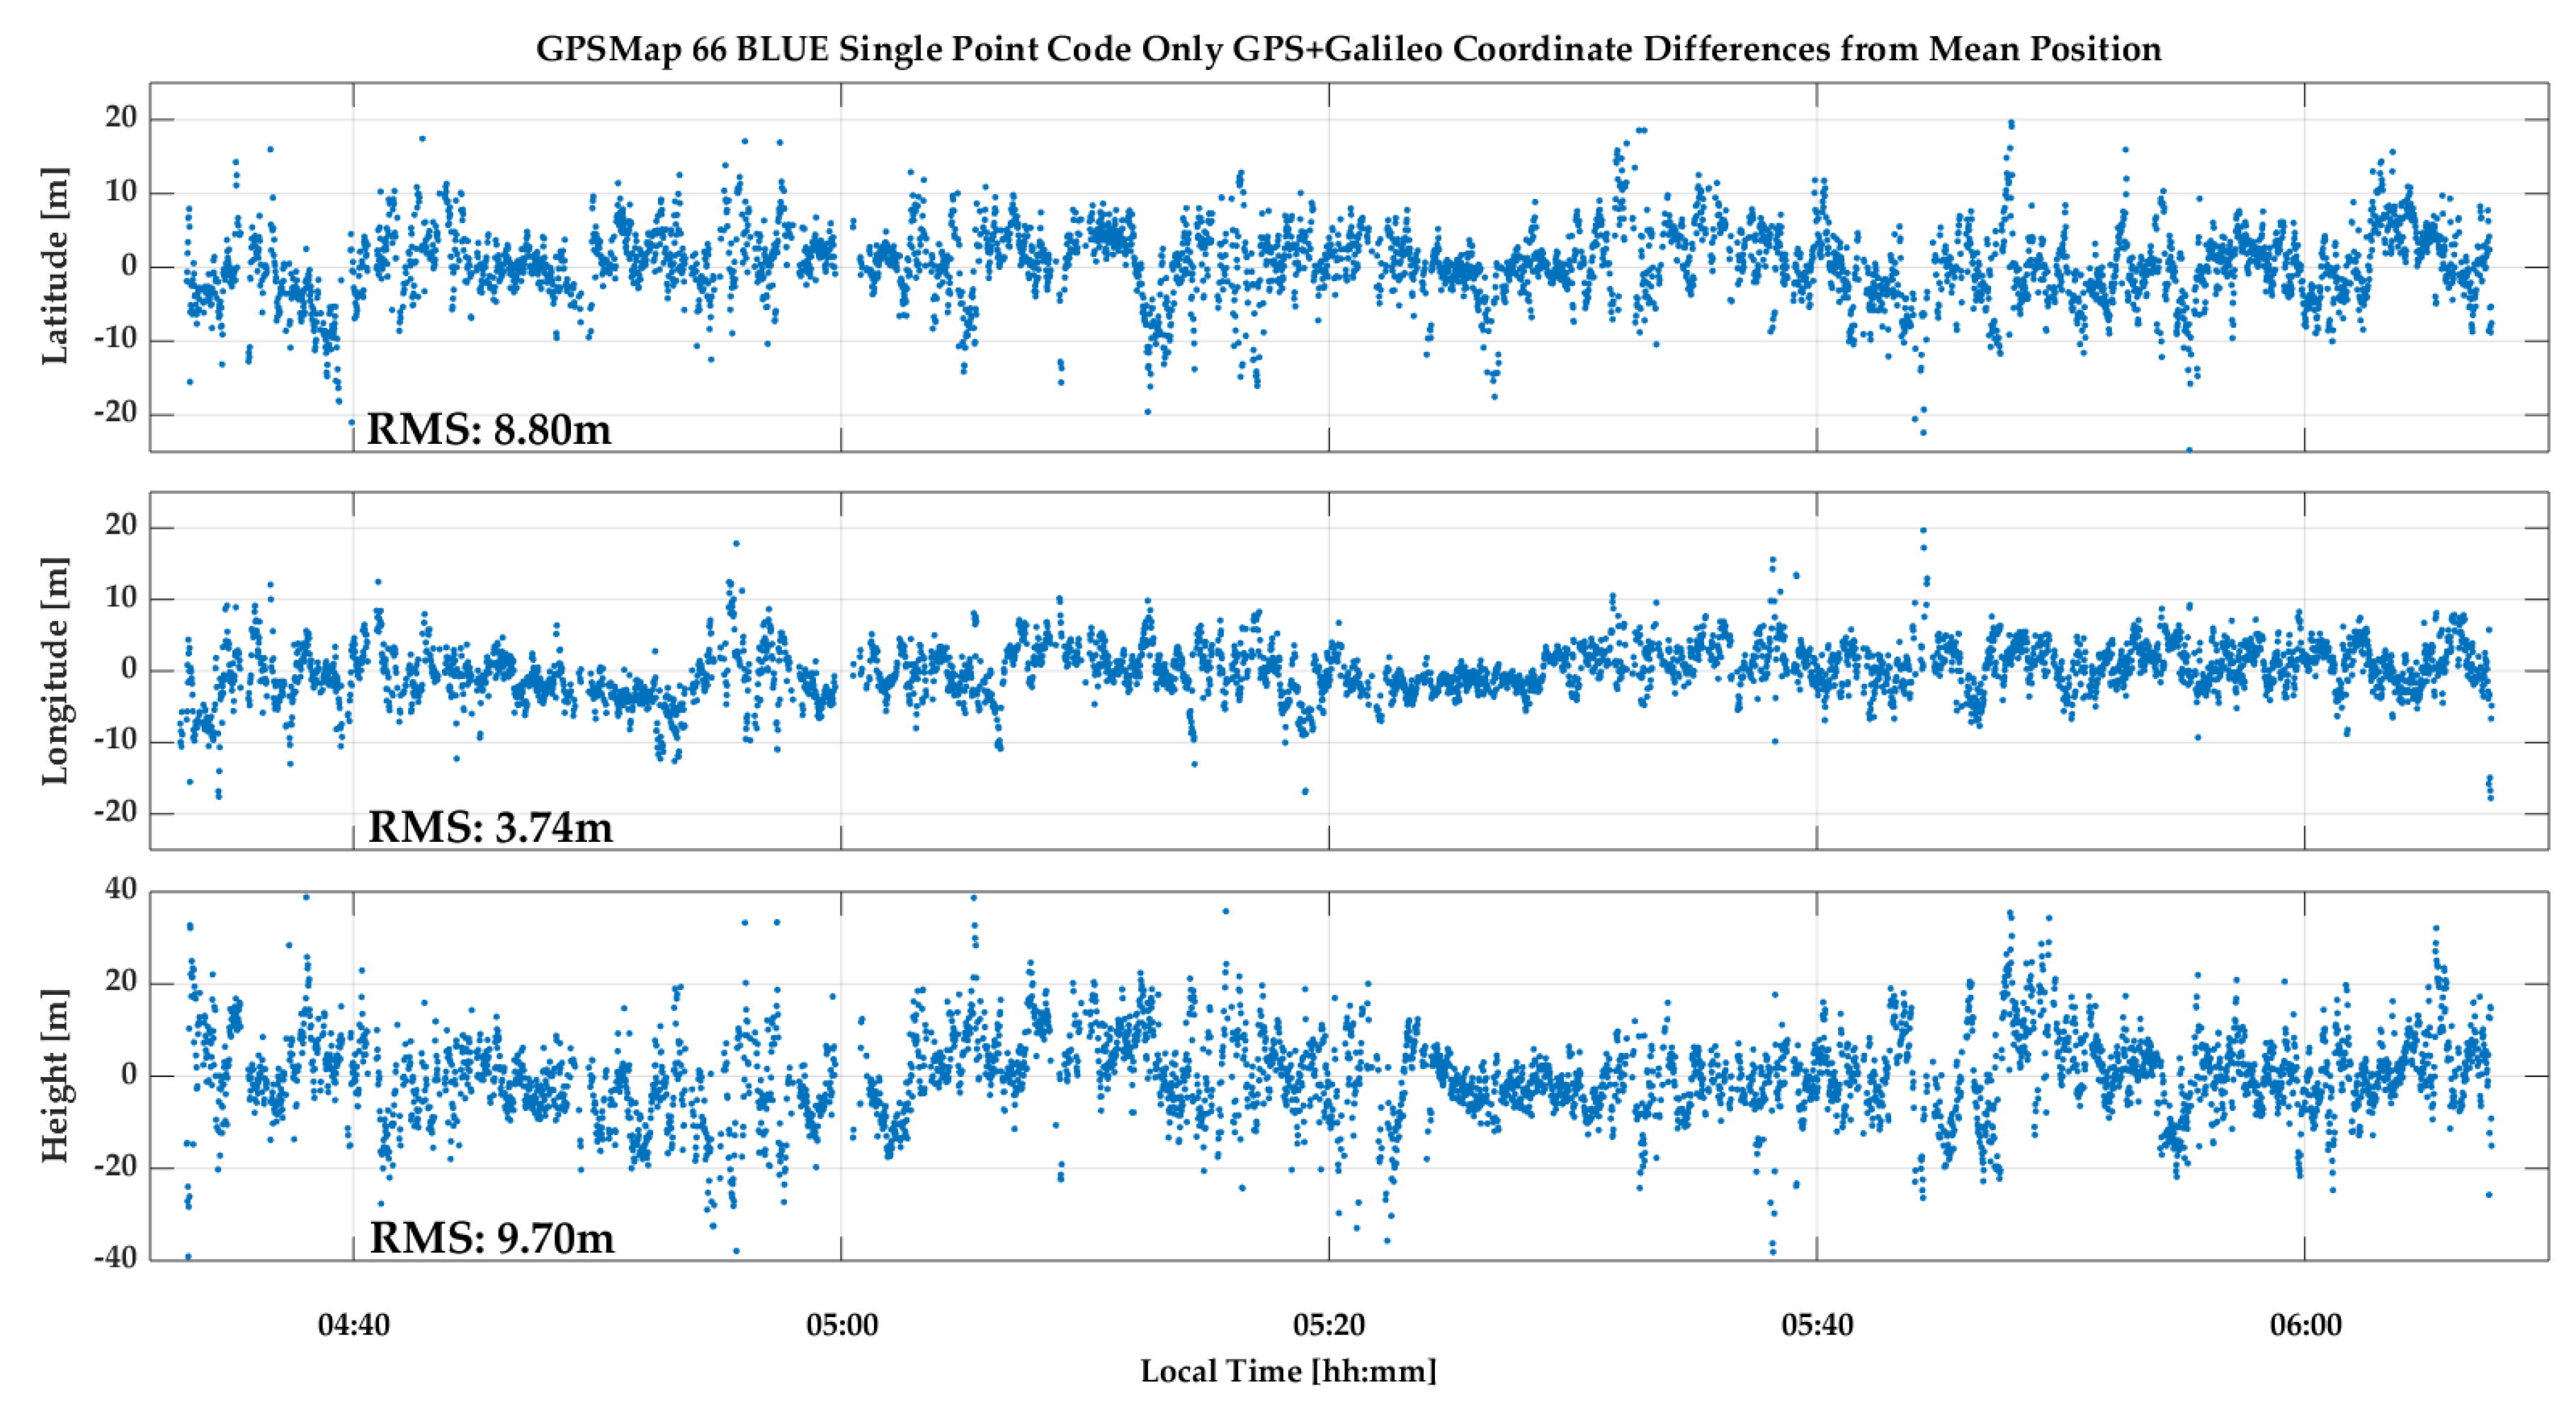
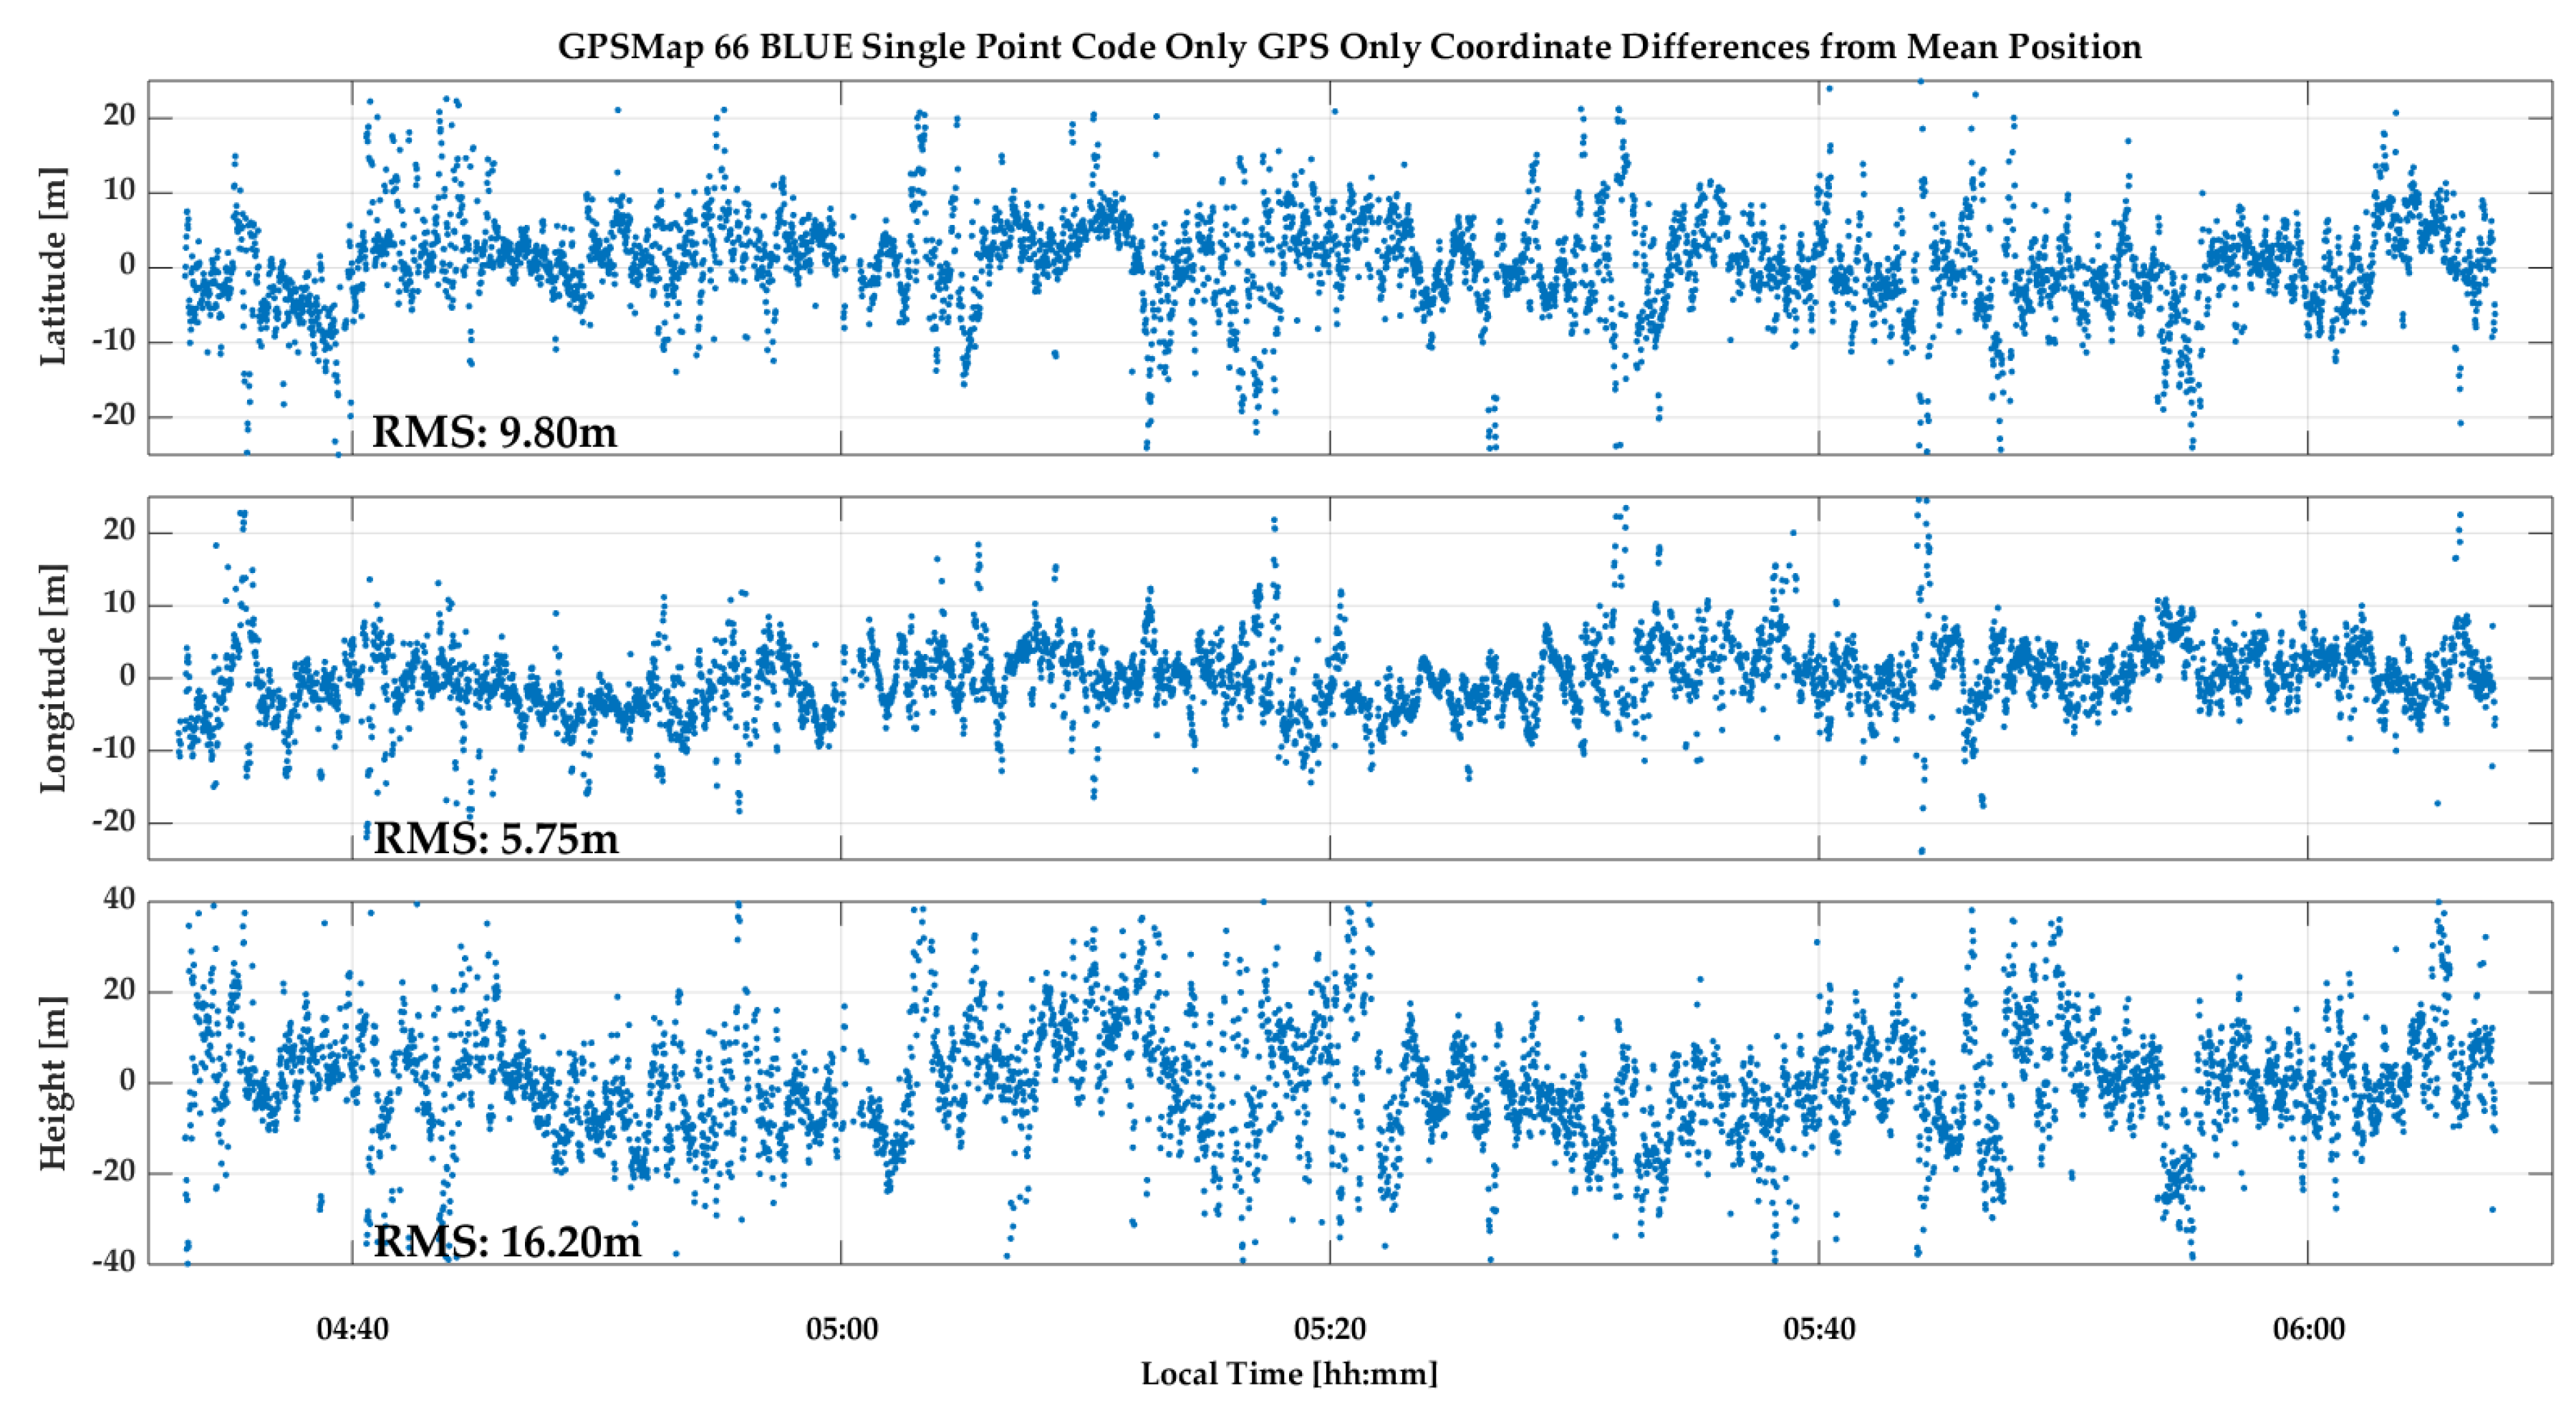
Figure 23. All values are below 35 dB-Hz and drop to below 15 dB-Hz. The unit was able to acquire and track many signals for continuous periods of time. The cyclic variations are typical of multipath. The lower Galileo signal values are due to generally lower SV elevations. Again, code measurements were processed in epoch-by-epoch single point mode to evaluate their stability. The combined GPS/Galileo and GPS only solutions are shown in
Figure 24 and
Figure 25. The RMS coordinate variations are 8.8, 3.7 and 9.7 m in latitude, longitude and height for the combined solution, and 9.8, 5.8 and 16.2 m for GPS only. The GPS only results are slightly poorer, demonstrating the importance of using as many signals as possible (GPS + Galileo in this case) to somewhat mitigate noise and multipath in such a harsh environment. The GPS/Galileo average coordinates agree at the level of 1.5 m with the values transferred from the outdoors. The residuals of the epoch-by-epoch least-squares solutions are shown in
Figure 26 and are within a band of 20 m.

