In this paper, a system is proposed for estimating a driver’s danger level by measuring the distance and time of movement between the driver’s hand and the center console during driving.
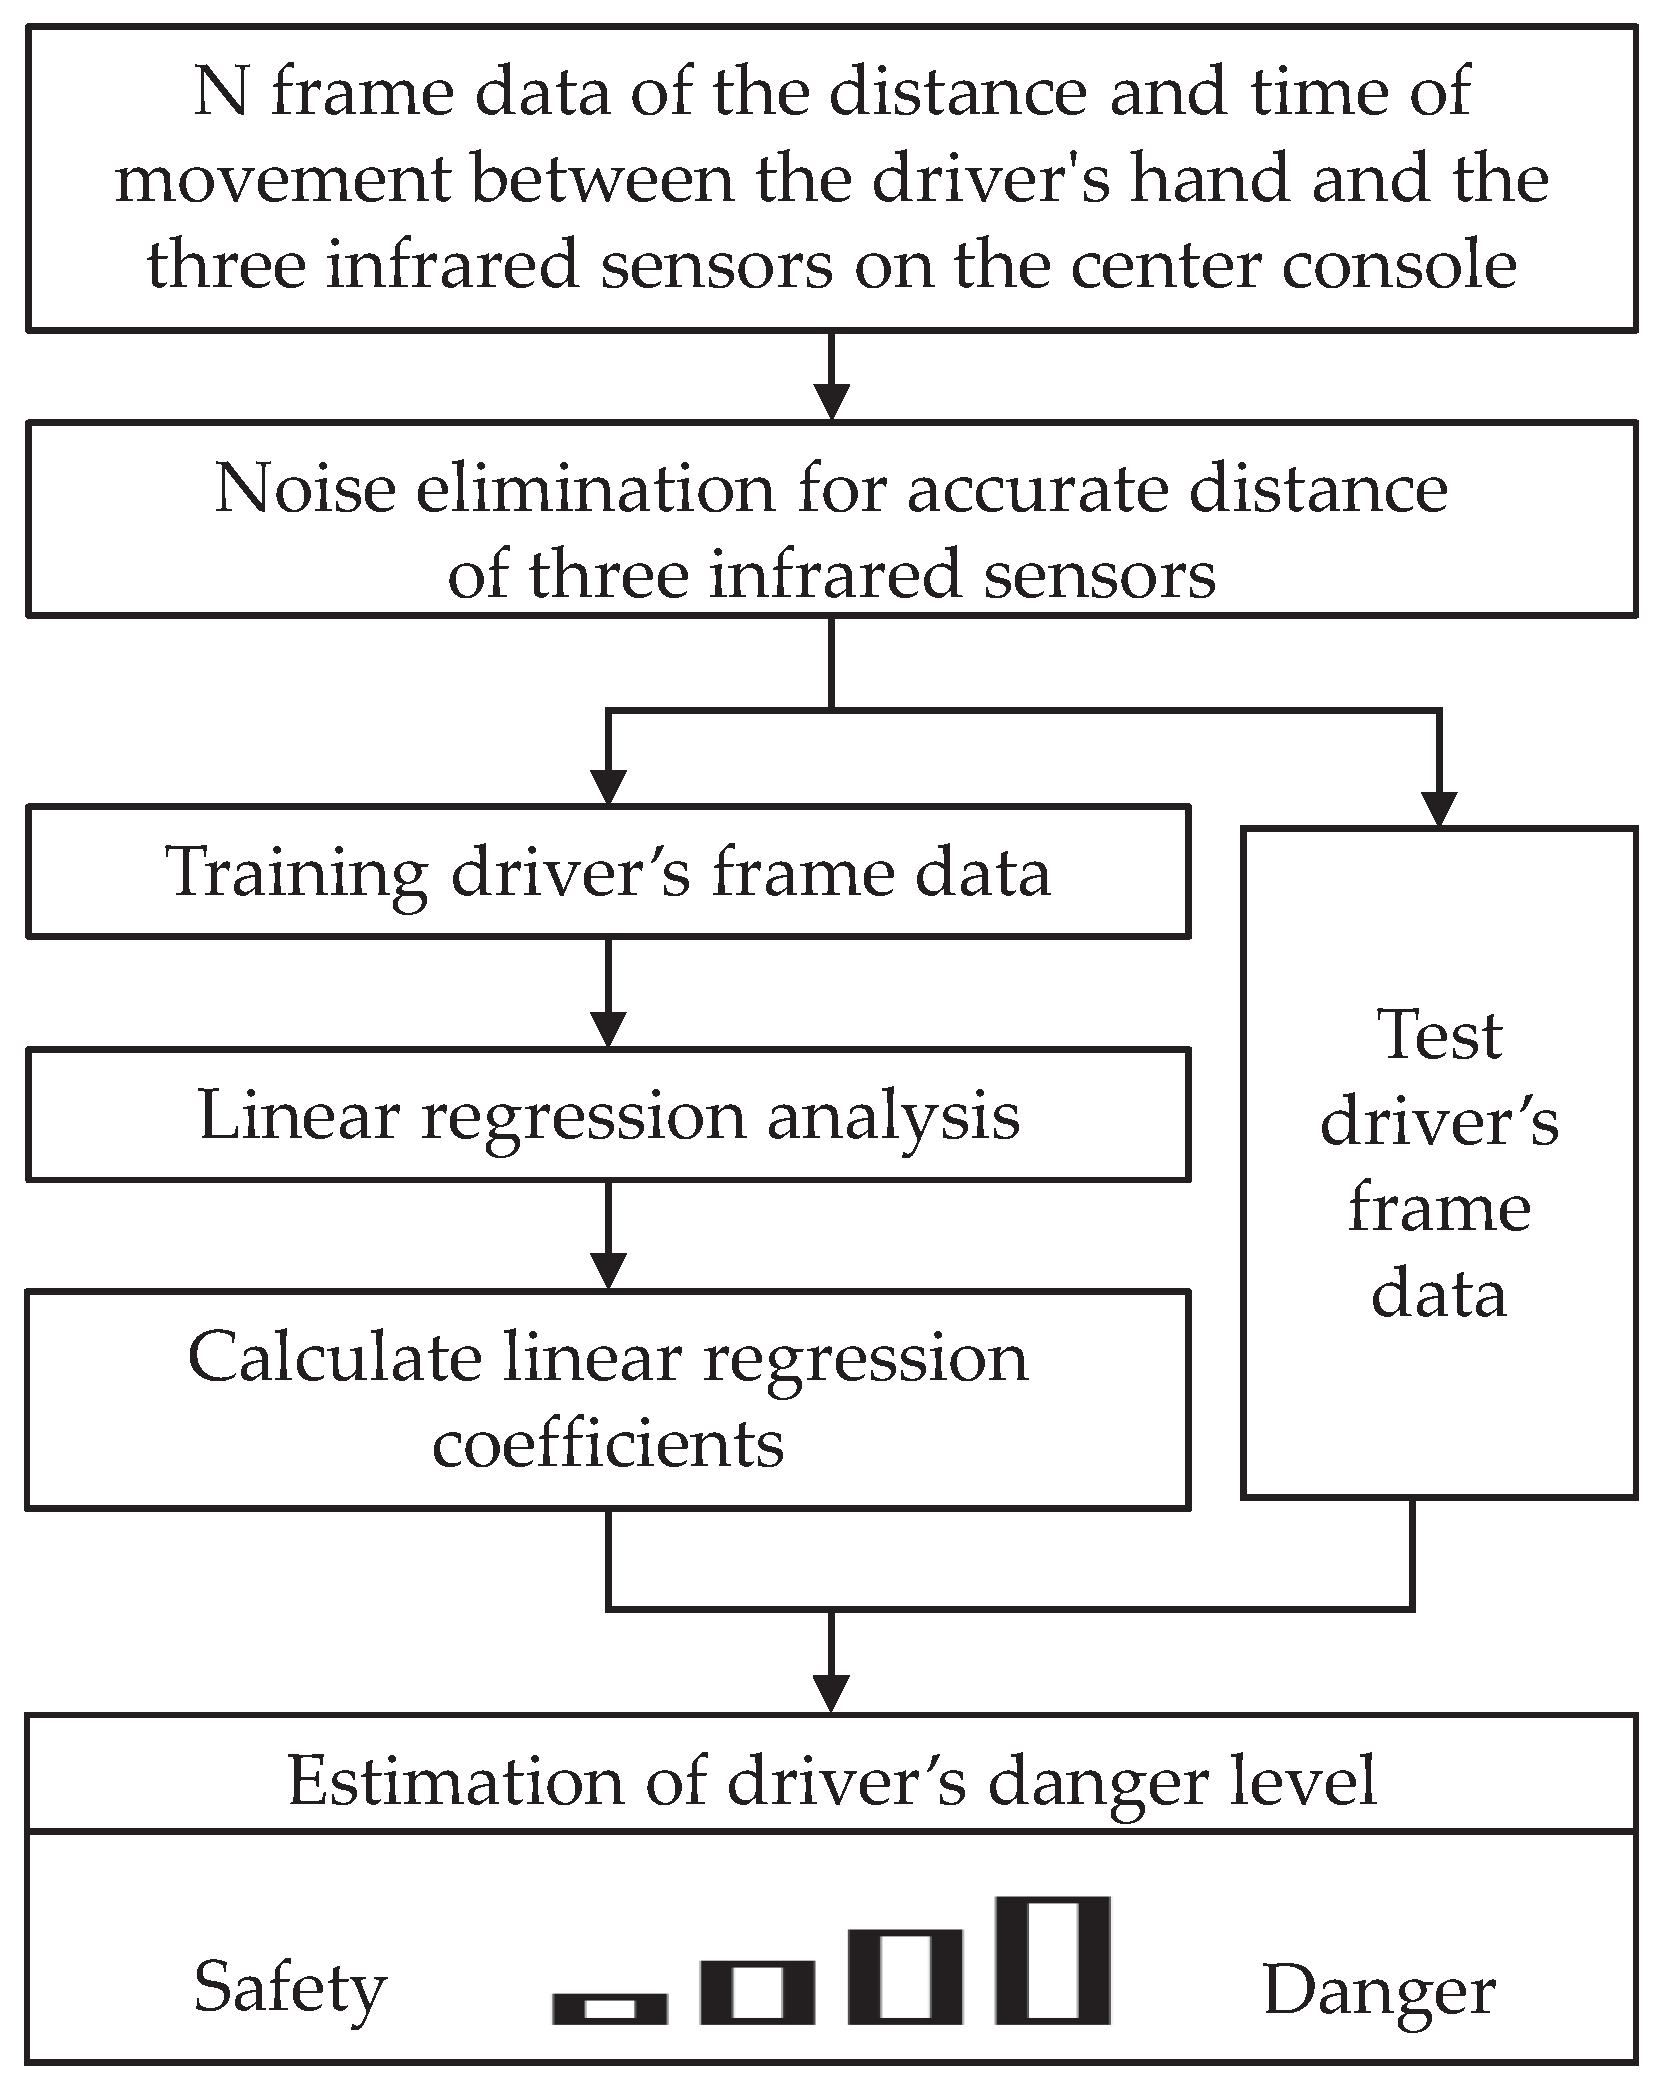
Figure 1 presents an overview of the proposed estimation system. First, three infrared sensors were installed in the center console of the driver monitoring platform. A driver drives the vehicle, and the distance and time of movement between their hand and the three infrared sensors in the straight sections of the proposed driving scenario are measured. In order to collect accurate distance data between the driver’s hand and the center console, the infrared sensor was set to detect the area around the center console, and the noise of the infrared sensor value was filtered. Subsequently, a linear regression analysis trained the collected frame data, consisting of measured distances with time of movement and the ground truth values of a driver’s danger level. When a new test distance and time of movement is given, the same process is performed, and the driver’s danger level is estimated by applying the returned linear regression coefficient.
3.1. Accurate Distance Measurement Process
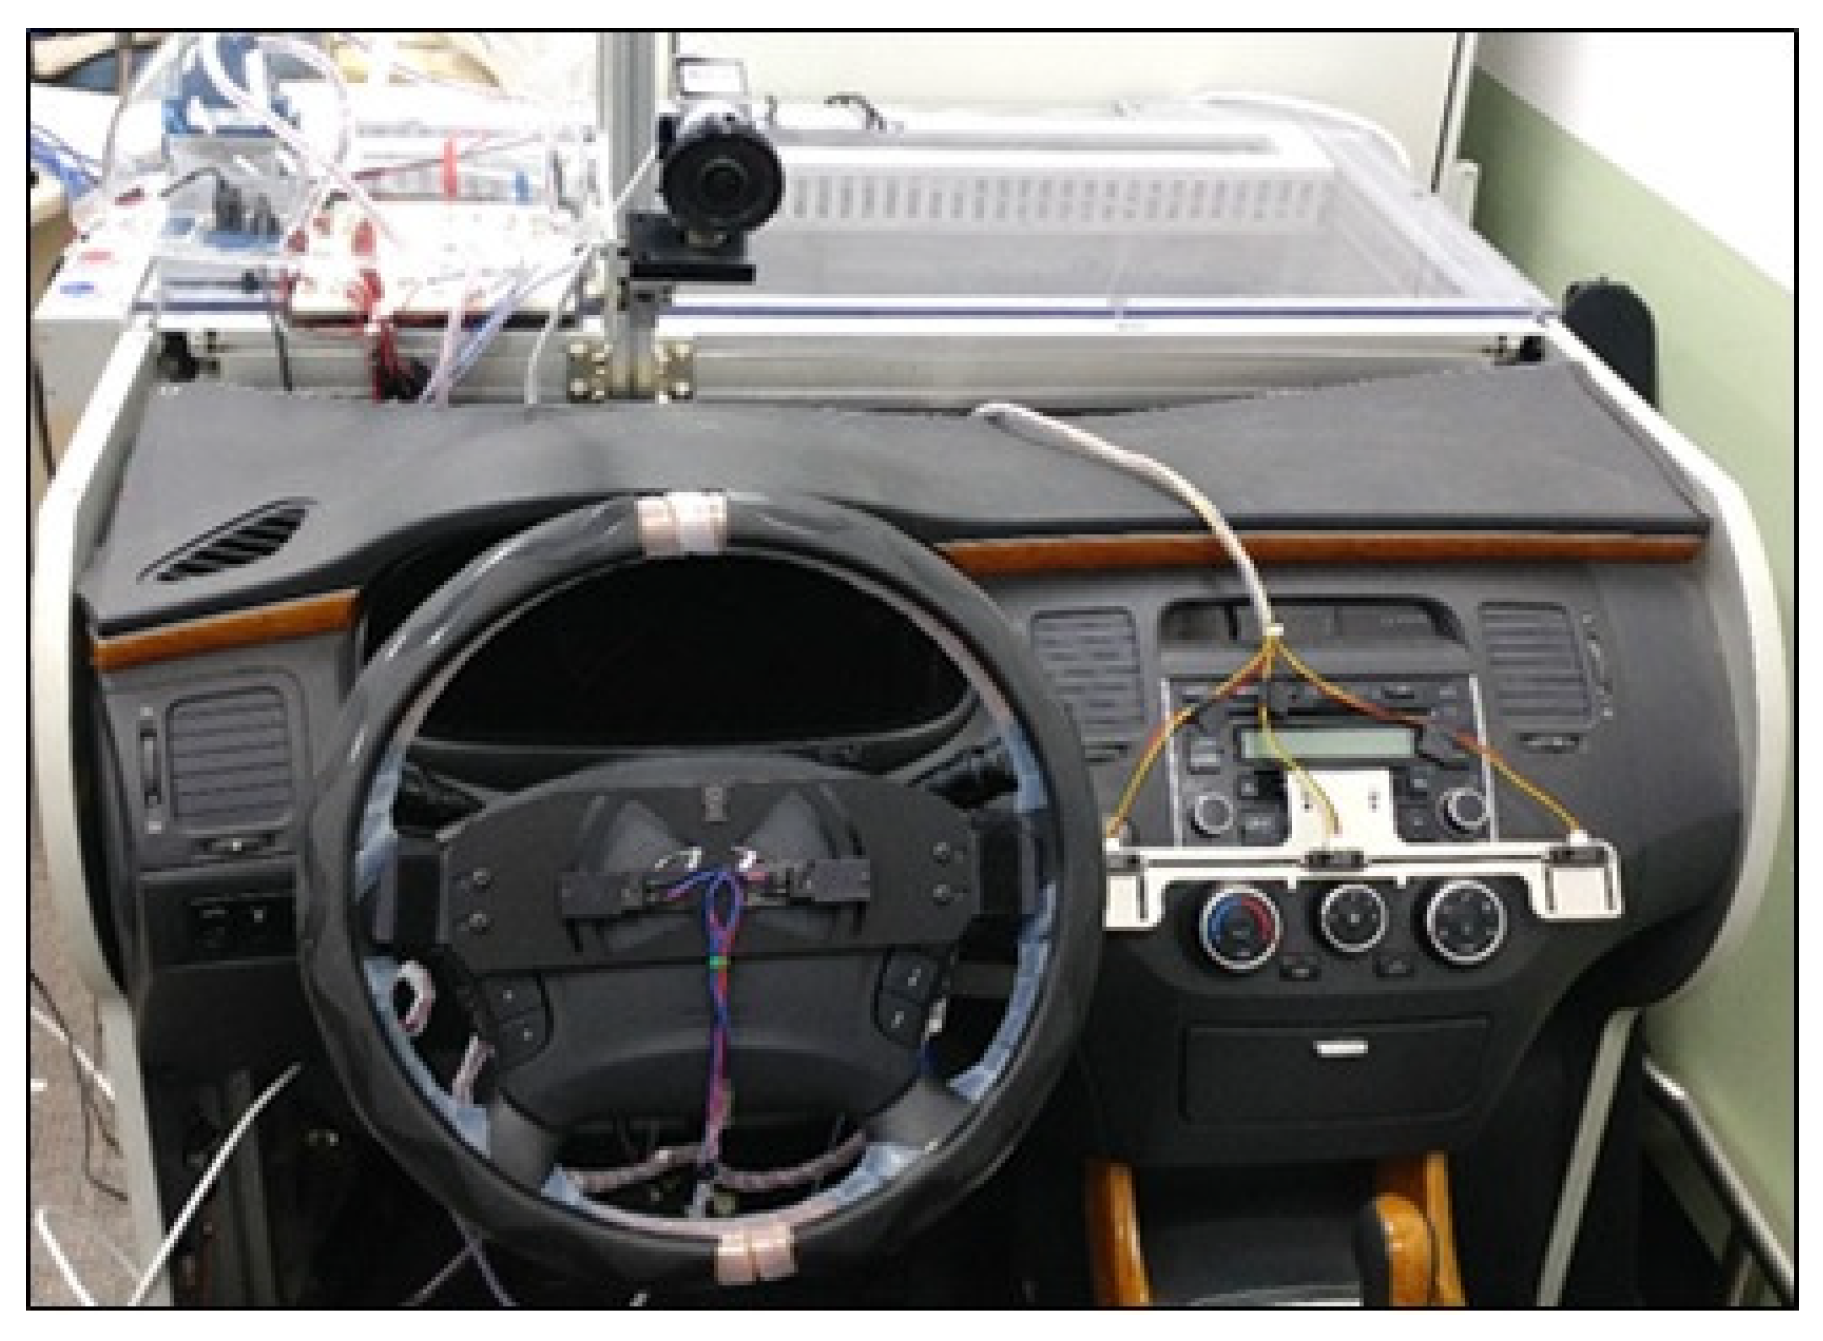
A driver monitoring platform for the laboratory environment was employed to simulate the exact experimental environment of the driver. This was used to measure the driver’s danger level of the distance and time of movement between the driver and the center console during driving. The driver monitoring platform adopted the Hyundai Grandeur car model. In
Figure 2, the infrared sensors installed to collect frame data on the driver’s hand position when accessing the center console of the driver monitoring platform are illustrated. To simulate an actual driving situation in the laboratory, a driver monitoring platform was employed. In this driver monitoring platform, three infrared sensors on the center console were employed to collect the driver’s hand position when accessing the center console.
To measure accurate data for the driver’s hand position, the frame data of the infrared sensors was collected using the Data Acquisition (DAQ) equipment of National Instruments. Then, to monitor the measurement of the accurate distance between the driver’s hand and the infrared sensors collected from the DAQ equipment, a system was developed to collect measured distances from each of the three infrared sensors using the Labveiw program. The system was designed to represent the distance between the driver’s hand and each of the three infrared sensors and the total driving time. As a result, we were able to check the accurate distance and time of movement between the driver’s hand and the three infrared sensors of the center console of the driver monitoring platform using this system in real time.
The module of the infrared sensor for the experiment was the GP2Y0A21YK model by Sharp. The operation principles of a sensor are as follows. The infrared transmitter emits an infrared light to an object’s surface, and the reflected infrared light is then absorbed by the infrared receiver. Then, the voltage value is output by measuring the amount of absorbed infrared light. Finally, the distance between the object and the infrared sensor is measured. In this study, the infrared sensors installed in the center console emitted infrared light to the driver’s hand, and then this infrared light was reflected and absorbed by the infrared module to determine whether the driver’s hand was detected. When the driver’s hand was detected by the infrared sensor, the voltage value was measured.
While collecting driver’s frame data, the infrared sensor’s noise was generated. The raw data for the measured voltage values was difficult to analyze owing to the infrared sensor’s noise. Therefore, the infrared sensor’s noise was filtered to collect precise driver’s frame data. The Butterworth filter, which has a maximally flat magnitude response, was employed to reduce the infrared sensor’s noise and measure an accurate distance. Equation (
1) [
23] defines the Butterworth filter:
Here,
denotes the Butterworth filter,
indicates the number of vibrations per second, and
n is the number of poles. The voltage value at which the noise was filtered by applying Equation (
1) was used to calculate the distance between the driver’s hand and the infrared sensor using Equation (
2):
Here, D indicates the distance between the driver’s hand and the infrared sensor, and V defines the voltage measurement.
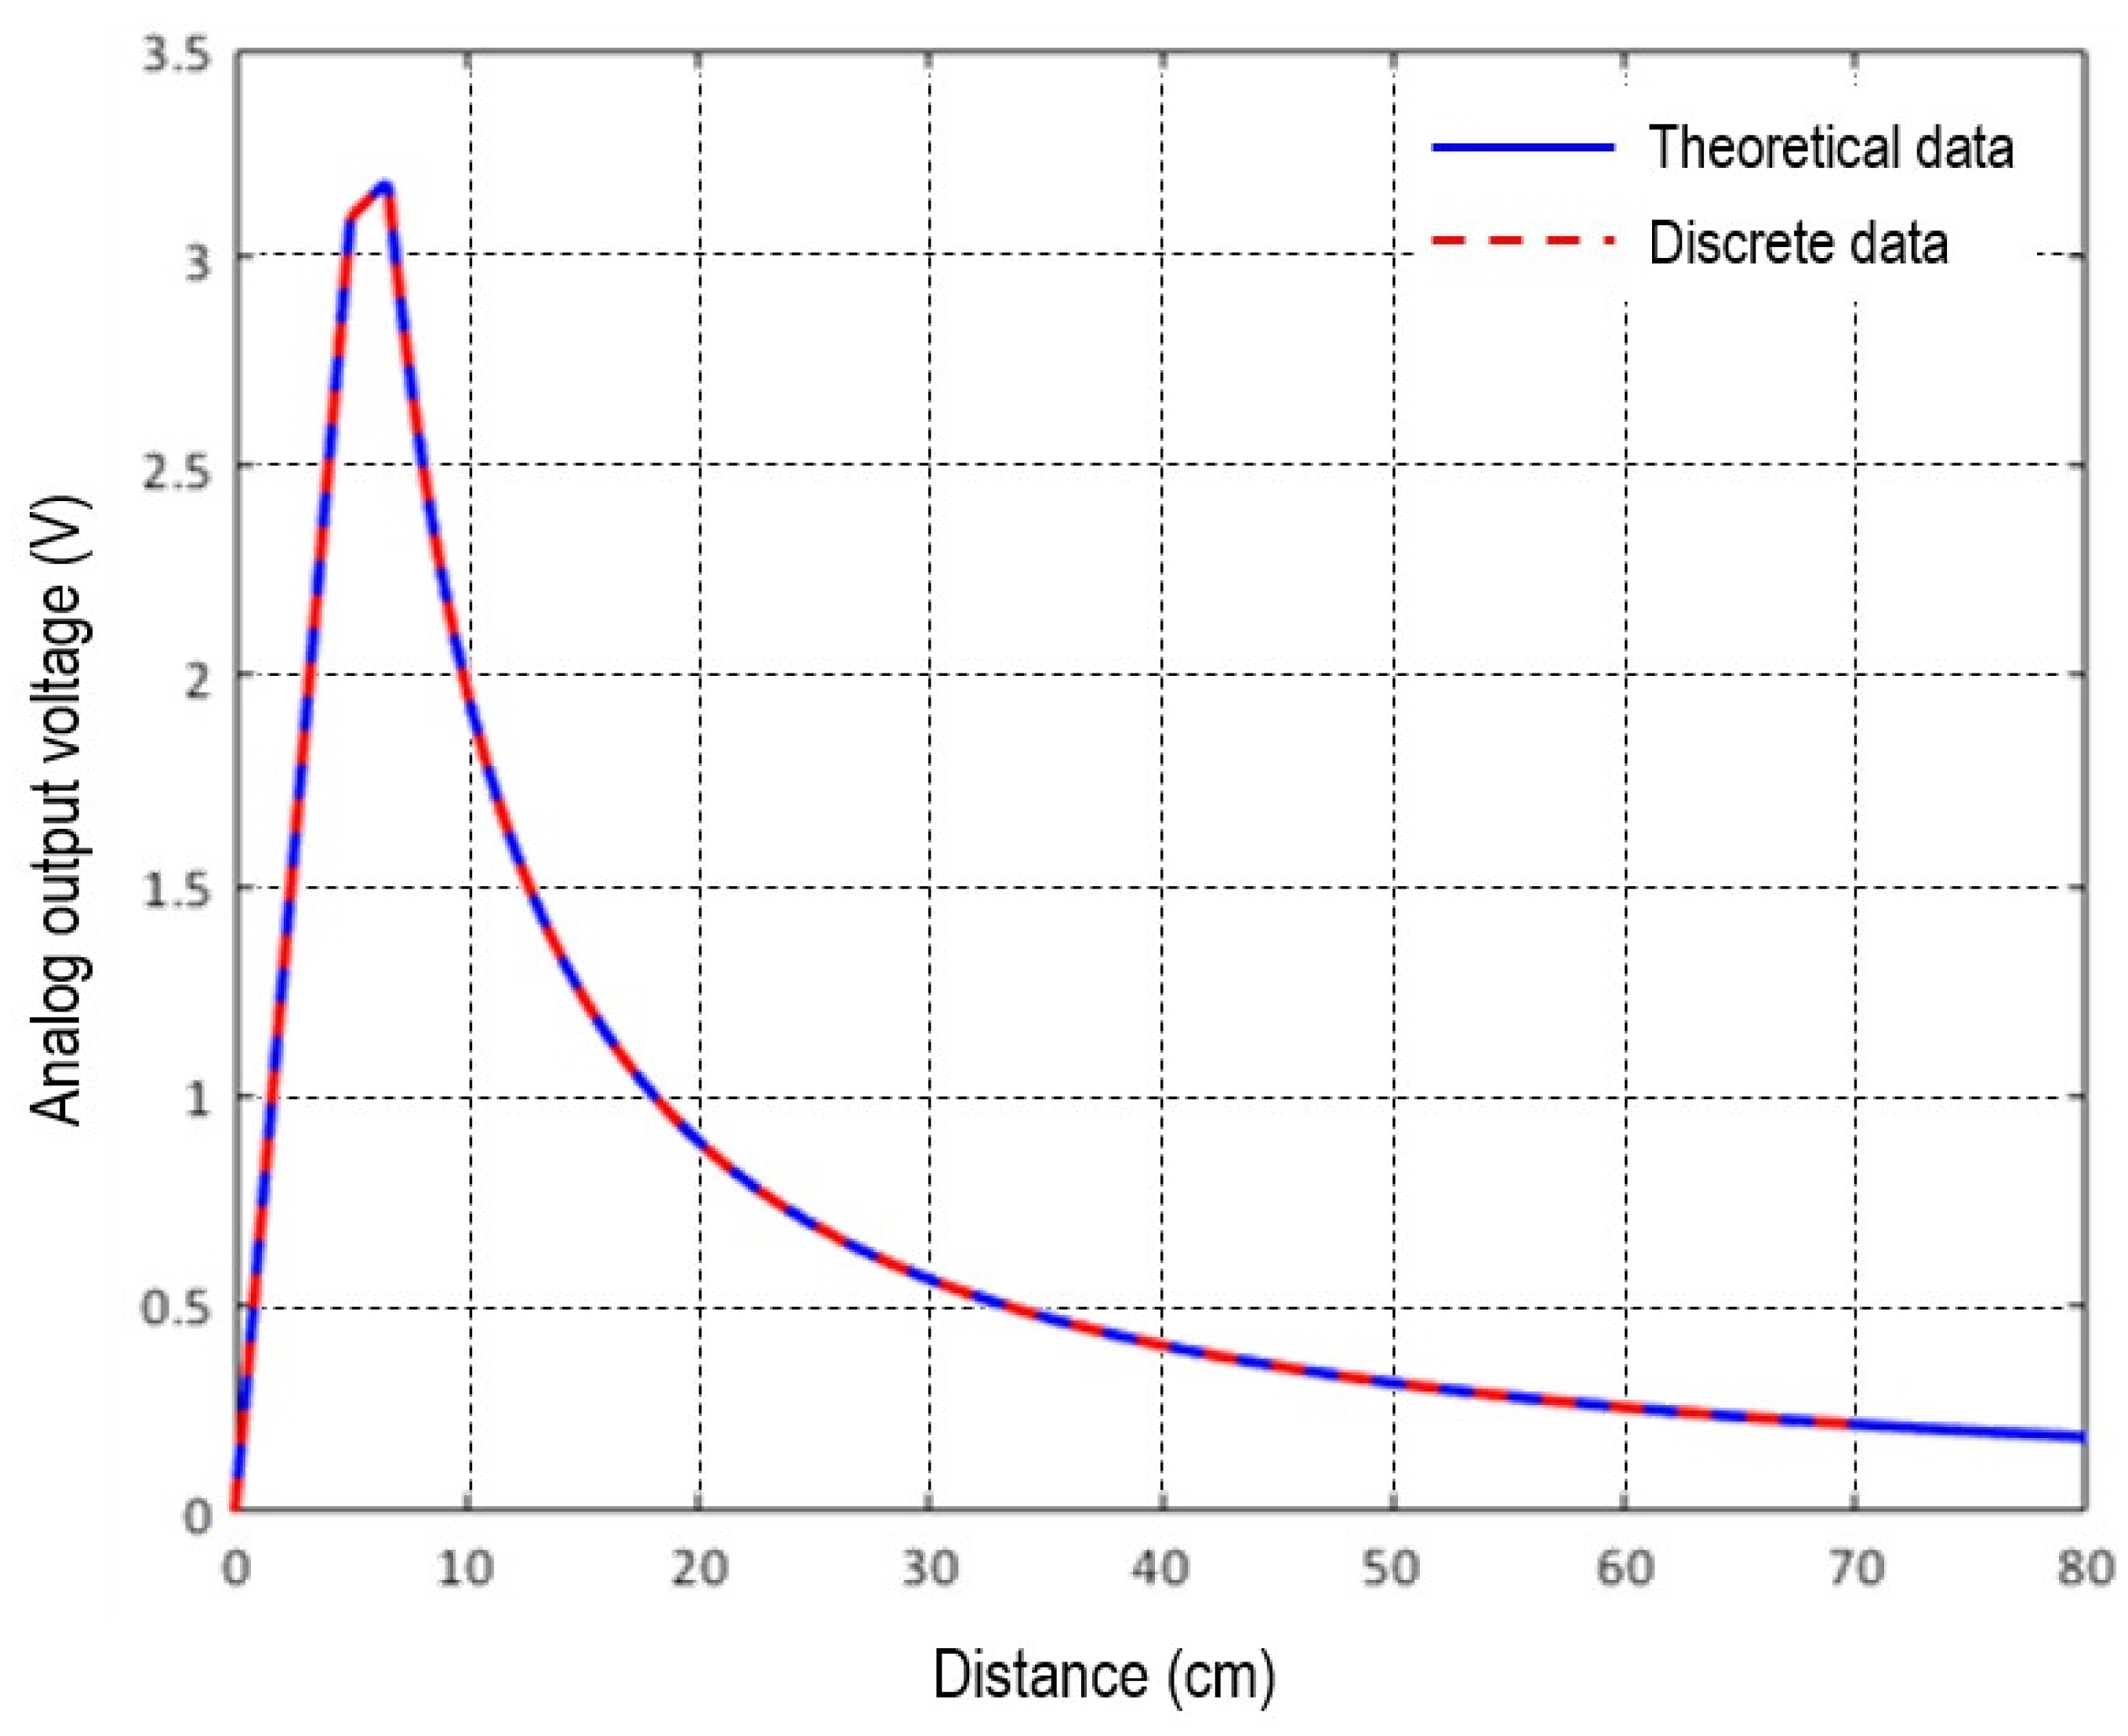
The infrared module GP2Y0A21YK has a data sheet [
24] that is shown in
Figure 3. In this datasheet, the infrared module voltage is a minimum of 0.4 V and a maximum of 3.25 V, and its measureable distance is a minimum of 8 cm and maximum of 80 cm as theoretical data. However, after applying the Butterworth filter the results shown by dots in
Figure 3 were obtained. The voltage value was exactly the same as for the theoretical data sheet, but the distance was different, in that the minimum value was reduced from 8 cm to 4 cm, and the maximum value was decreased from 80 cm to 69 cm. Therefore, the distance measurement range for the infrared sensors of the driver monitoring platform can be measured from a minimum distance of 4 cm to a maximum distance of 69 cm.
3.2. Method of Collecting Driver’s Frame Data
The three infrared sensors were employed on the center console of the driver monitoring platform, as shown in
Figure 4. These three infrared sensors of the center console used in the experiment were installed: at the top of the buttons that control the air conditioner and heater (temperature controller), wind direction controller, and wind intensity controller. The three infrared sensors were installed on the center console in an x-axial direction from the center of the steering wheel at distances of 22 cm, 36 cm, and 54 cm. The position of the right end of the center console between the driver and passenger is 22 cm from the steering wheel, which is defined as
. The middle position, representing the wind direction control button, is 36 cm, and is set as
. The position on the left end is 54 cm, and is defined as
.
The experimental environment for collecting the driver’s frame data on the distance between the driver’s hand and the center console is shown in
Figure 5. As shown in the figure, one participant sat in the driver’s seat of the driver monitoring platform and drove using the proposed scenarios. Using the system implemented in the Labview 2014 program, the driver’s frame data was collected. A total of eight drivers participated in the experiments under the proposed scenarios, and the driver’s frame data were collected on the distances and time of movement between each driver’s hand and the infrared sensors while driving straight ahead. The participants of the eight drivers, who have a Korean driver’s license, had driving experiences from a minimum of three months to a maximum of 20 years. Of these participants, two drivers were Chinese and six drivers were Korean, four drivers were female and four drivers were male. The average age of the eight voluntary participant drivers was 31 years.
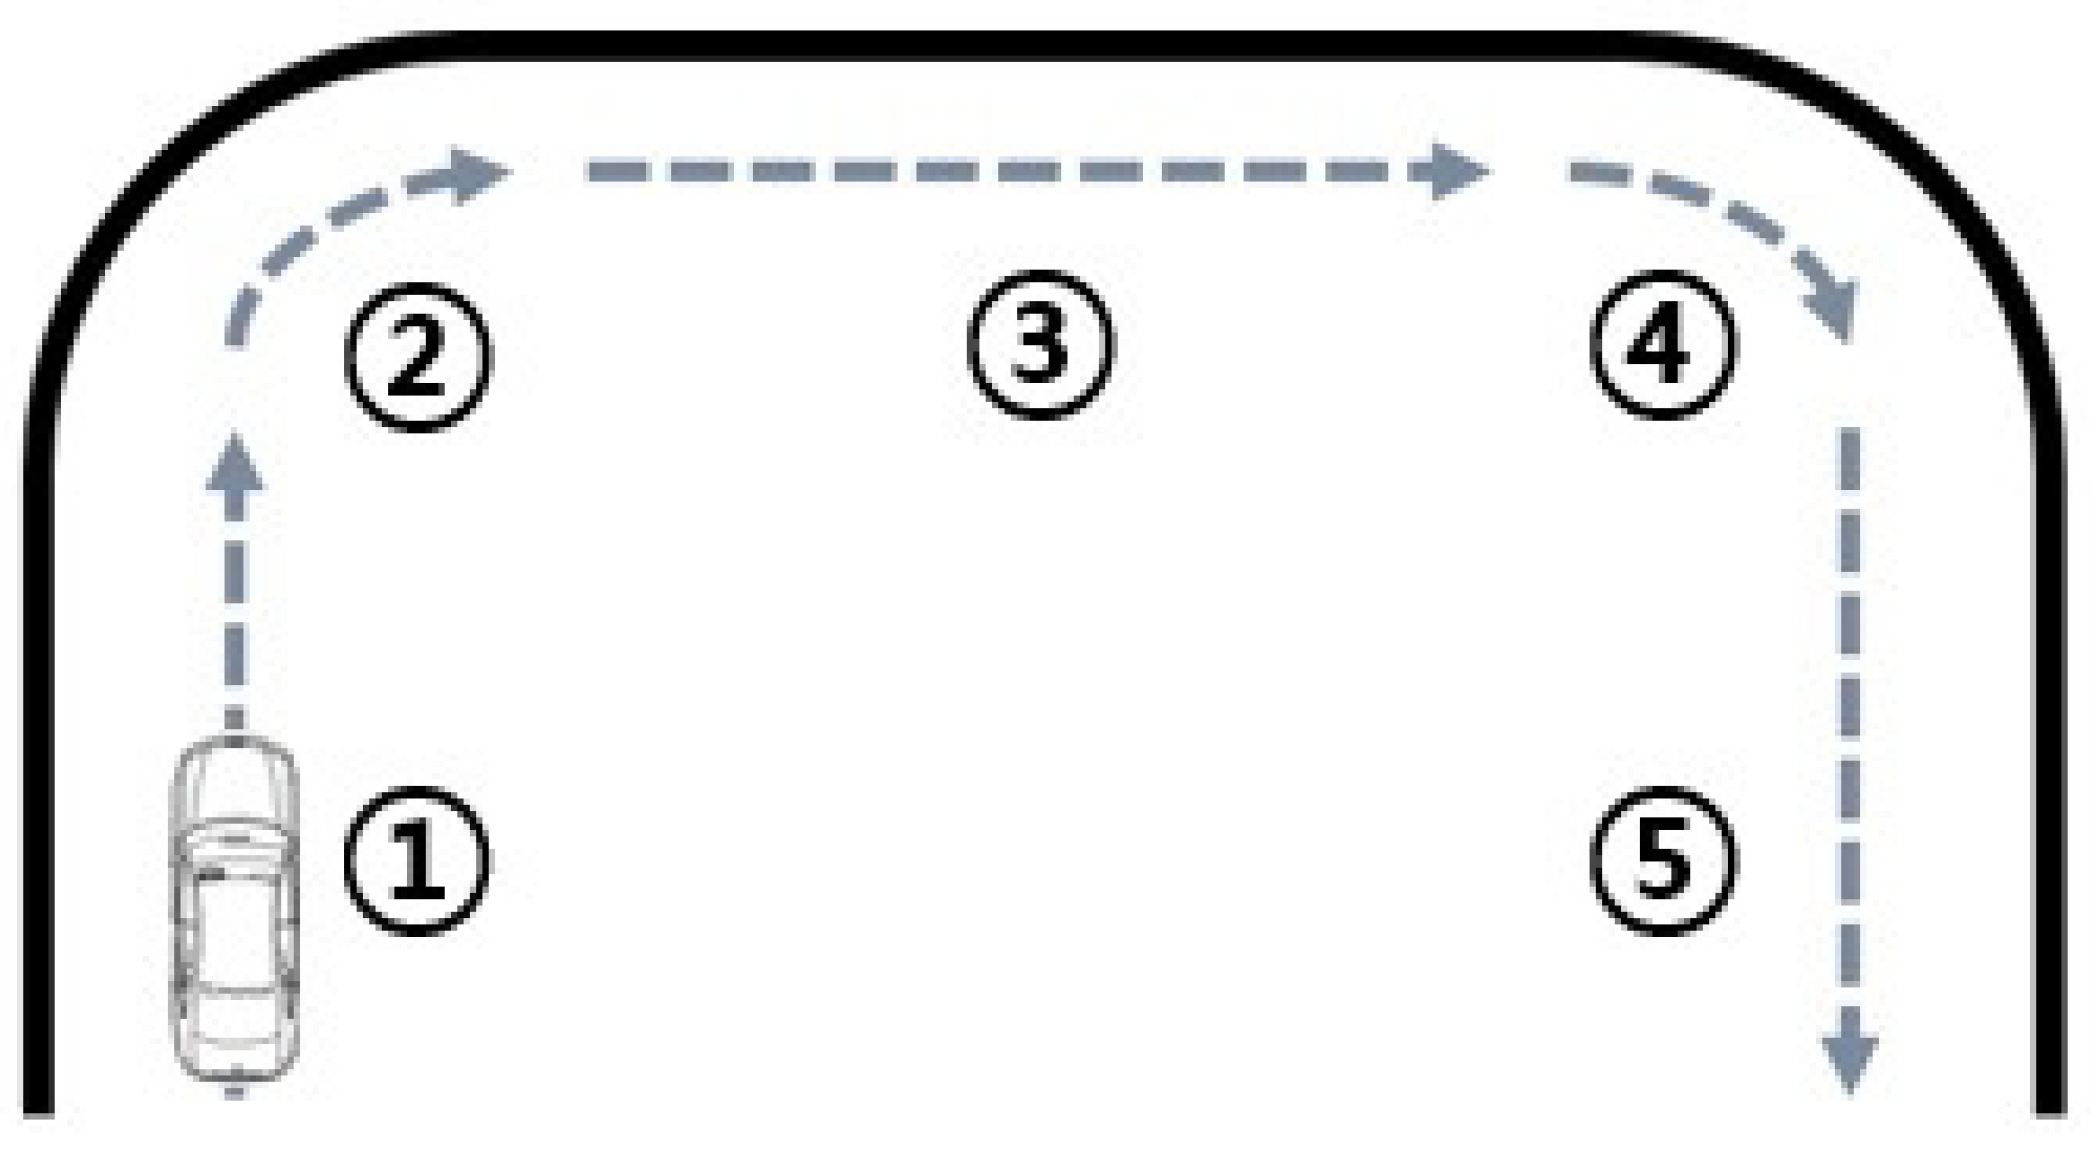
In order to collect the driver’s frame data for the distance and time of movement between the driver’s hand and the infrared sensors, a virtual road was defined. The virtual road included five driving sections such as three go straight sections and two turn right sections, as depicted in
Figure 6. The total driving time for each of the scenarios was 60 s on the virtual road, as detailed in
Table 1. The numbered lists of the proposed driving conditions are as follows:
Go straight for 17 s.
Turn right for 3 s.
Go straight for 20 s.
Turn right for 3 s.
Go straight for 17 s.
Table 2 shows the eight proposed scenarios for each of the eight drivers. In addition,
Table 2 details the proposed scenarios for estimating the driver’s danger level using the distance and time of movement between the driver’s hand and the infrared sensors while driving on the straight sections (①, ③, ⑤ in
Table 1). To set the distance, the distances between the driver’s hand and infrared sensors while driving straight ahead are set to be close to the minimum measurable distance. In the right turning sections (②, ④ in
Table 1), the maximum distance is measured, because the driver’s hand does not move towards the infrared sensors. Therefore, the time corresponding to the driver’s danger level is not measured. To employ the time with the distance, the time is set as either short or long, because the driver’s danger level differs depending on whether their hand accesses the center console for a long or short time while driving. Therefore, the proposed scenarios consist of the cases of “being close for a short time” and “being close for a long time.” To classify between the short and long time, the reference value is set to be 2.5 s, which represents the perception reaction time (PRT) [
12,
13,
14]. The reference value means total time measured by one movement in one section.
To measure the various patterns of driver’s danger level, the proposed scenarios considered repetitive motions in which the driver’s hand moved closer to the infrared sensor
of the three infrared sensors and remained there for either less than 2.5 seconds or longer than 2.5 seconds. The proposed scenarios were performed to each of the infrared sensors
and
in turn. In scenario III of
Table 2, driver A’s hand repeats the motion of moving close to the infrared sensor
of the three infrared sensors for less than 2.5 s four times during the 17 s driving time on the first straight section (①). Furthermore, during the 20 s driving time of the second straight section (③), driver A’s hand repeats the motion of moving closer to the infrared sensor
for over 2.5 s three times. During the 17 s driving time for the third straight section (⑤), driver A’s hand repeats the motion of moving close to the infrared sensor
for less than 2.5 s four times. Then, the distance and time of movement between driver A’s hand and infrared sensors
was measured using the same process. The remaining infrared sensors
were also measured. Therefore, we collected frame data consisting of the distance and time of movement between driver A’s hand and infrared sensors
,
and
using the process of this scenario III.
Each scenario, considering the distances and time of movement between the driver’s hand and the three infrared sensors of the center console in the straight sections (①, ③, ⑤) represents data on a total of 300 frames collected at a rate of 5 frames per second (fps).
Table 3 shows the sample frame used in the experiment that driver A collected in the straight section (⑤) according to scenario III for infrared sensor
. Moreover, a total of 85 frame data including omitted data is shown. Here, the omitted data and the same distance data from the three infrared sensors (216, 233, 241, 254, 261, 273, 280, and 294) means that driver A’s hand does not move towards any of the three infrared sensors. Thus, the values of the three infrared sensors are the maximum distances, and the time of movement is zero s. As shown in
Table 3, the sample frame data of driver A is the case in which the driver A’s hand approaches the infrared sensor
four times. One frame consists of the distance between driver A’s hand to infrared sensor
, and infrared sensor
being the same at 69 cm. It also consists of the time of movement between driver A’s hand at 1.2 s and the distance from hand to infrared sensor
being at 6.76232 cm. For example, between the frames 295 to 300, driver A’s hand moves once towards the infrared sensor
for less than 2.5 s. That is, the total time of the movement of driver A’s hand towards the infrared sensor
is 1.2 s. The value of the infrared sensor
represents the distance of the driver’s hand to the infrared sensor
for 1.2 s. The infrared sensors
and
are 69 cm, which means the maximum distance, respectively. The total number of frames used for the experiment consists of the frames merged sequentially for the data from scenarios I through VIII, giving data on a total of 7200 frames.
3.3. Approach to Estimating the Driver’s Danger Level
After the driver’s frame data were collected for the proposed driving scenarios, a linear regression analysis [
18,
21] was applied to estimate the driver’s danger level for a close distance and time between the driver’s hand and the infrared sensors
,
, and
installed on the center console.
Linear regression analyses [
21] can be classified into simple linear regression analyses, in which there is one predictor variable, and multiple linear regression analyses, in which there are several predictor variables. In this paper, a multiple linear regression analysis is employed, because several predictor variables are considered. To estimate the driver’s danger level, the linear regression analysis Equation (
3) is applied.
Here, , , and denote the distance between the driver’s hand and infrared sensor , , and , respectively. denotes the time of movement between the driver’s hand and the three infrared sensors. represents the estimated value of the driver’s danger level in test driver’s frame data, denotes the coefficient of the linear regression analysis estimated by the linear regression analysis, and l is defined as the number of driver’s frame data.
The linear regression analysis employed in this paper represents how close to linear the relationship is between the four predictor variables , , , and , and the response variables . Therefore, represents the estimated value of the linear regression coefficient for the multiple linear regression analysis of , which is a response variable for the predictor variable u.
Thus, in training driver’s frame data, the predicted variables represent the distances and time of movement between the driver’s hand and the three infrared sensors, and the response variables represent the ground truth values of the driver’s danger level. Based on the linear regression coefficient estimation calculated in this process, the estimated value of the driver’s danger level can be calculated for the frame data consisting of the distance and time of movement between the driver’s hand and the three infrared sensors to be tested.
3.4. Experimental Results
The ground truth value for the driver’s danger level were set by considering the distances and time of movement between the driver’s hand and the center console’s three infrared sensors employed in the experiment. The case in which the driver’s hand does not get close to the center console is defined as “safety.” In addition, the ground truth value of “safety” is set to zero. The case in which the driver’s hand is close to the center console is defined as “danger.” First, the ground truth value for the driver’s danger level is defined considering the time of movement between the driver’s hand and the center console. The longer the time of movement, the higher the driver’s danger level. On the other hand, the shorter the time of movement, the lower the driver’s danger level. Therefore, the ground truth value for the time of movement is defined as a value that increases by 0.1 in proportion to the driver’s level if the time increases by 0.2 s (5 fps) intervals. Then, the ground truth value for the driver’s danger level is defined considering the distance between the driver’s hand and the center console. The closer the distance between the driver’s hand and the center console, the higher the driver’s danger level. On the other hand, the farther the driver’s hand is from the center console, the lower the driver’s danger level. The ground truth value for the distance is defined as (1/distance) because the driver’s level is inversely proportional to the distance. Thus, the ground truth value for the driver’s danger level combining the distance and time of movement is defined as a value that adds (1/distance) to the number of data in increasing time × 0.1. For example, in the case that the distance between the driver’s hand and infrared sensor is 4 cm and the measured time is 0.2 s, the driver’s danger level is 0.1, and when the reciprocal of 4 is added, the driver’s danger level becomes 0.35. For the case in which the driver’s danger level is higher than a certain numerical value, an alarm can be set up.
Table 4 presents the experimental results based on the linear regression analysis for the frame data consisting of the ground truth values for driver’s danger level and the distances and time of movement between the driver’s hand and the three infrared sensors for eight drivers for each scenario in
Table 2, i.e., scenarios I through VIII. Each of the proposed scenarios was performed for the following proposed methods: a method considering the distances and times between the driver’s hand and the infrared sensors, one considering the distances only, and one considering the times only. Leave-one-out cross validation (LOOCV) and 10-fold cross validation were employed to validate the performance of the frame data using the linear regression analysis. Suppose that the total number of entire data is
N. Then, LOOCV is a method of using
training data in order for one data point to be tested. Furthermore, 10-fold cross validation is a method of dividing the total of
N data into 10 equal parts, then employing each single part one-by-one as the test data with the remaining nine parts as the training data.
With respect to each proposed method and the validation methods, the root mean square error (RMSE) was calculated for the driver’s danger level. The RMSE is used to handle the difference between the estimated value and the ground truth one. If the RMSE is large, then the error is large, and vice versa. The RMSE used in the experiment is defined in Equation (
4):
Here, T is defined as the total number of frame data, means the ground truth value of an arbitrary frame data, and denotes the value estimated using the linear regression analysis for an arbitrary frame data. For example, the RMSE of scenario VII is 0.4671 when estimated the driver’s danger level by using the LOOCV method and the method considering only the distances between the driver’s hand and the three infrared sensors. On the other hand, in the case of using the LOOCV method and both the distances and times between the driver’s hand and the infrared sensors for the same scenario, the RMSE is 0.0068. Therefore, it is found that the frame data that considers both the distances and times between the driver’s hand and the center console exhibits a lower RMSE than that considering only the distances. Under the same conditions, comparing the result obtained when using both the distances and times with the result obtained when using the times only, the RMSE of estimating the driver’s danger level when using only the times for the driver’s hand being close to the infrared sensors is 0.0520, which is larger than the RMSE using both the distances and times. The other scenarios exhibit the best RMSE results when considering the times and distances between the driver’s hand and the infrared sensors. Therefore, for all the proposed scenarios it is determined that when both the distances and times between the driver’s hand and the infrared sensors are considered together, which reflects the proposed method, the best estimation of the driver’s danger level is obtained.
Table 5 presents the test results of the total frame data in all the scenarios for each of the eight drivers. In the case of considering both the distances and time of movement between driver A’s hand and three infrared sensors for all scenarios and employing the LOOCV method, the RMSE is 0.0049. On the other hand, for the same method, the RMSE is 0.3096 when only the distances are considered, and 0.0466 when only the times are considered. The RMSEs considering the distances and the times for the total frame data for all drivers exhibited the best results. Therefore, the approach considering the distances and times together for the total frame data for all drivers provides the best estimation of the driver’s danger level. Hence, the proposed method provides accurate and detailed estimations of the driver’s danger level.
Comparison of the proposed method with previous research for driver’s safe driving are summarized in
Table 6. In [
10] a drowsiness detection system of fuzzy Bayesian network considering smartphone, electrocardiography (ECG) shows true awake of 96%, true drowsy of 97%. In [
20], a gaze detection system was implemented as convolutional neural network (CNN) using a near-infrared (NIR) camera. This system shows strictly correct estimation rate (SCER) of 92.8% and loosely correct estimation rate (LCER) of 99.2%. The proposed system shows the RMSE of 0.0043 in
Table 5, which means the best estimated result of the driver’s danger level. Therefore, the previous systems can be classified as driver’s safety or driver’s danger but the proposed system estimates the driver’s danger level. Moreover, the performance of the proposed method is not directly comparable with the performance of the two previous research studies because the performance comparison method is different.


