Free-Form Deformation Approach for Registration of Visible and Infrared Facial Images in Fever Screening †


Abstract
:1. Introduction
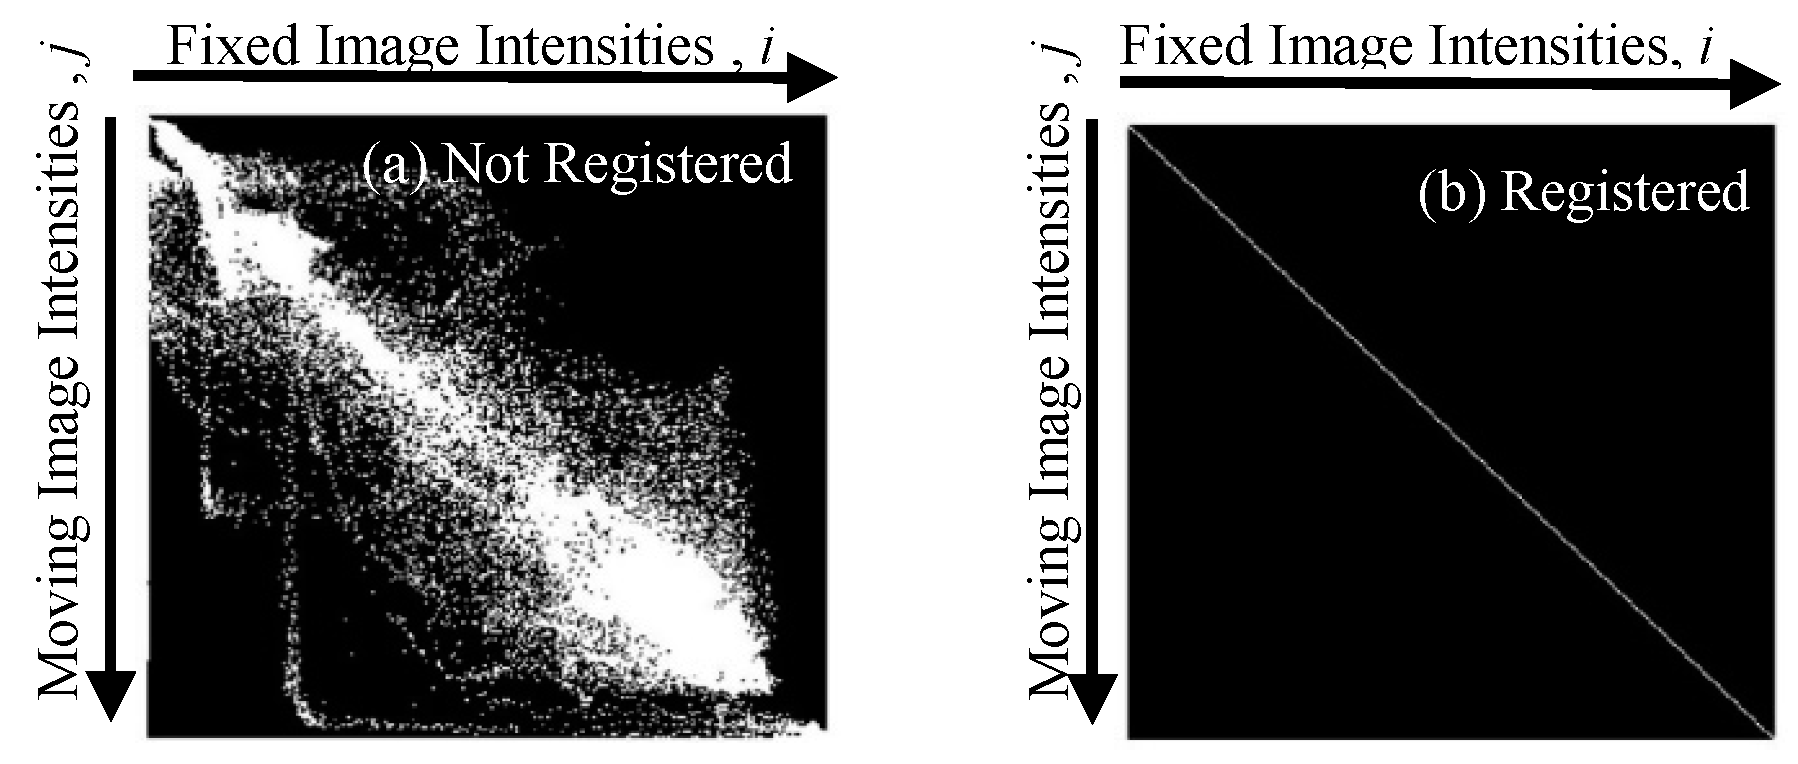
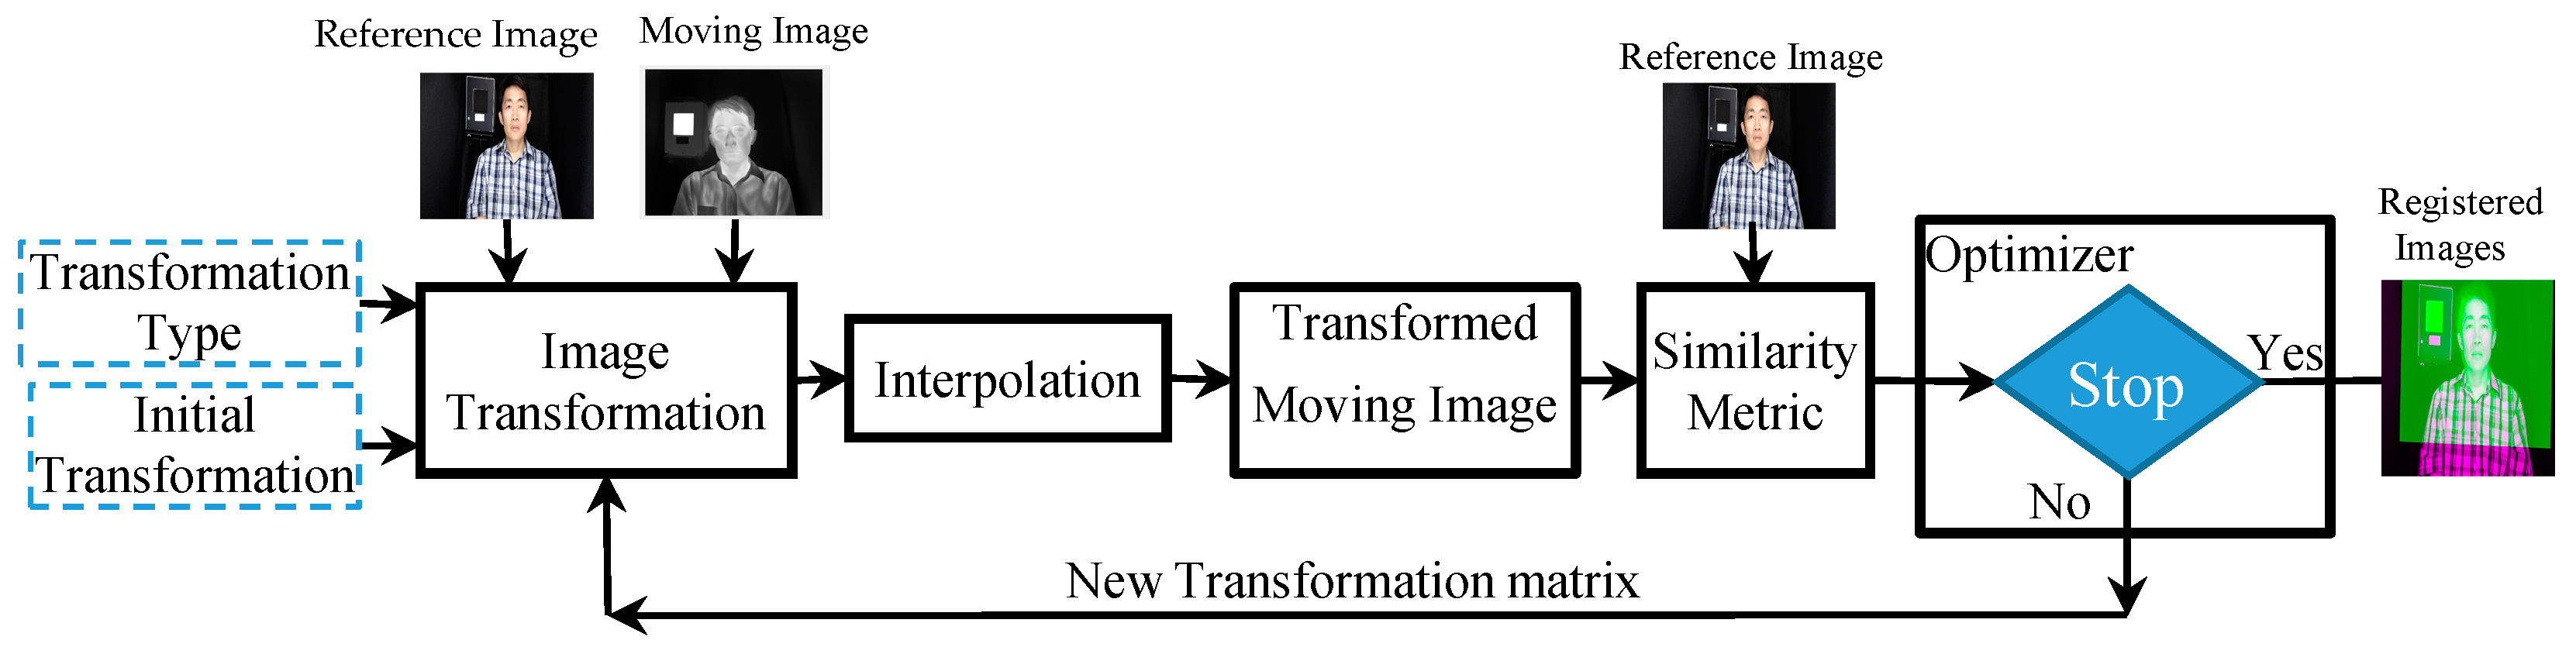
Image Registration
2. Implementation
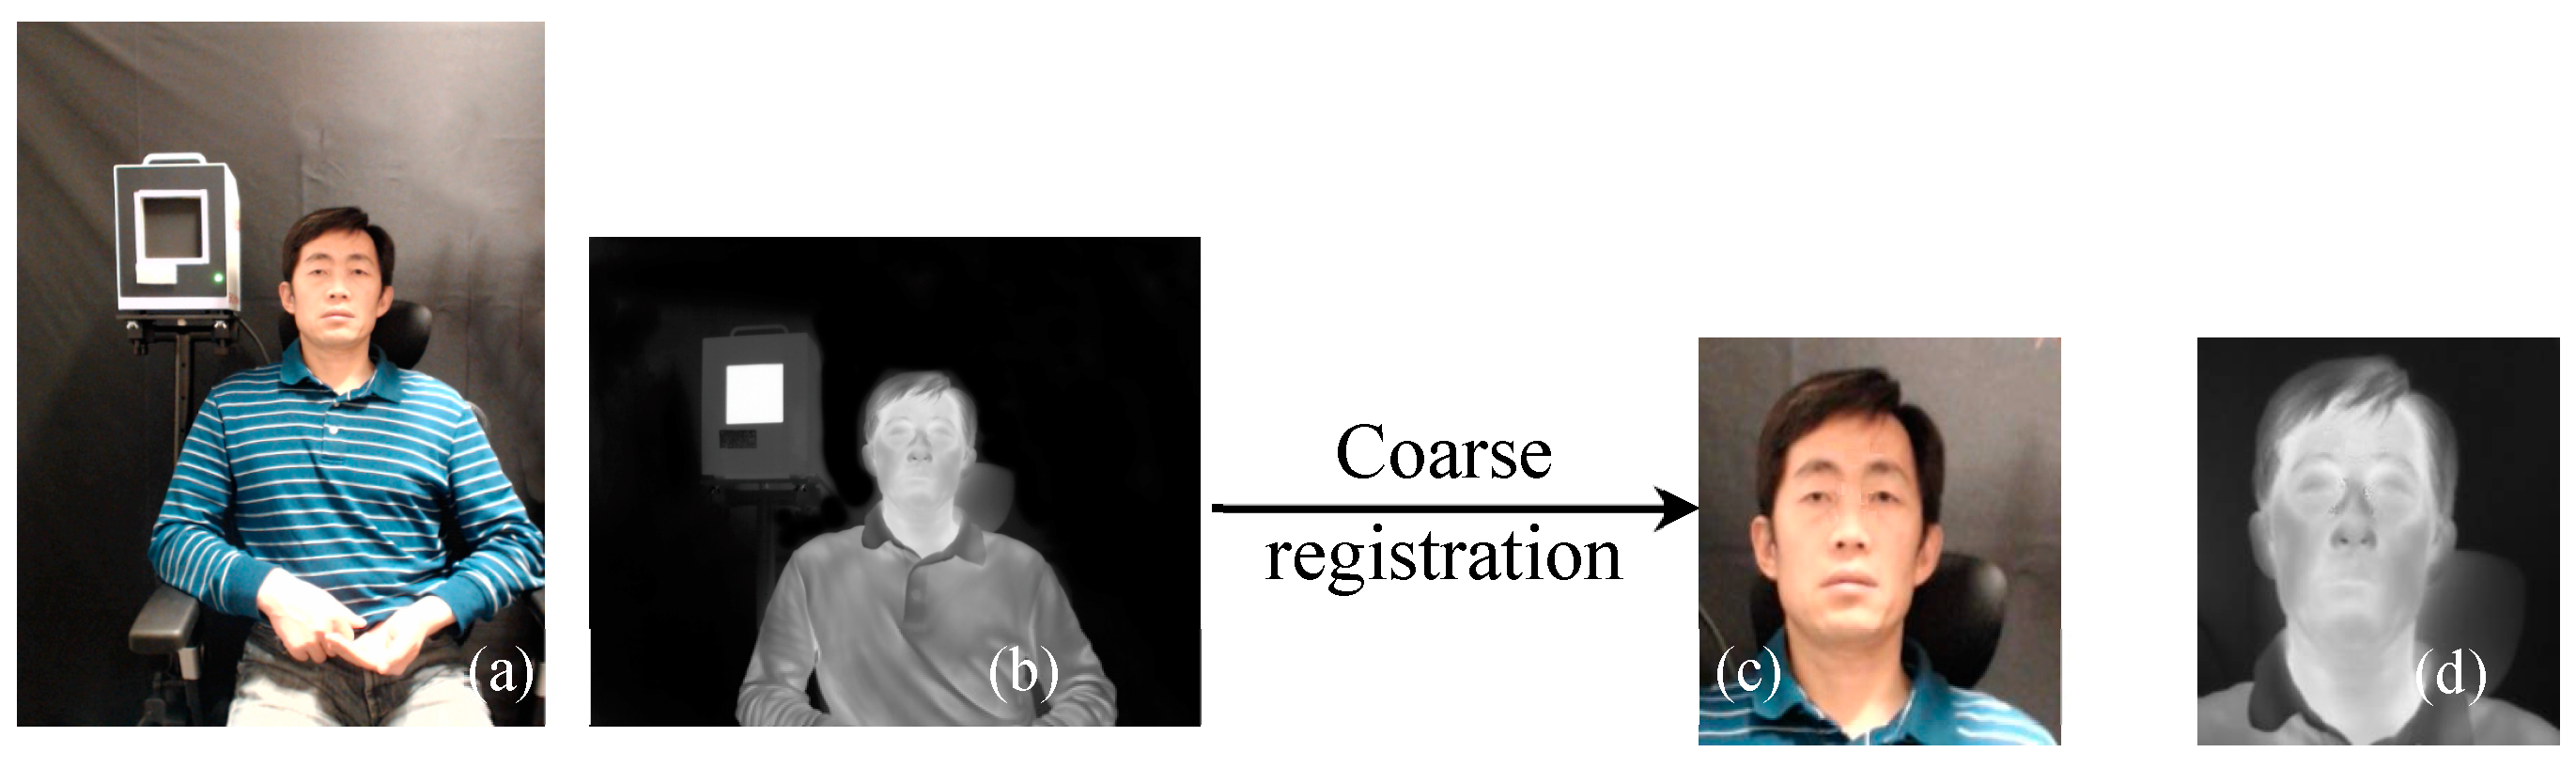
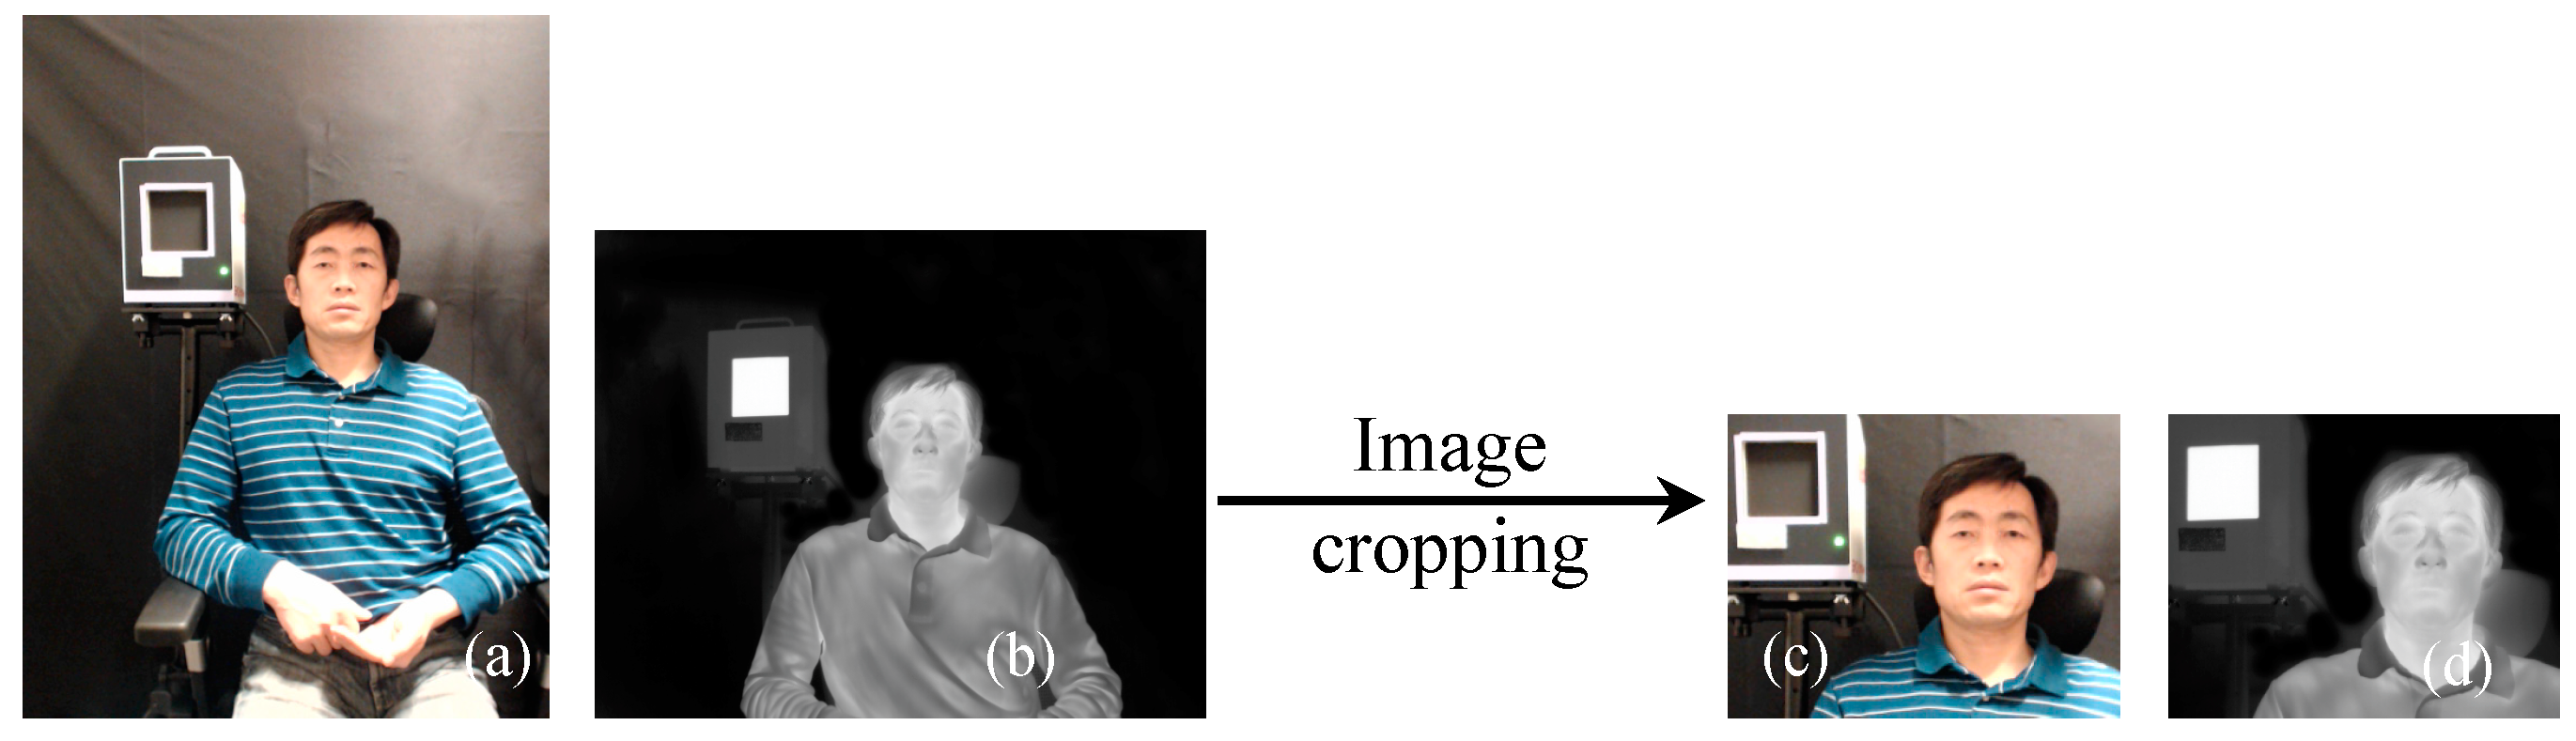
2.1. Coarse Registration
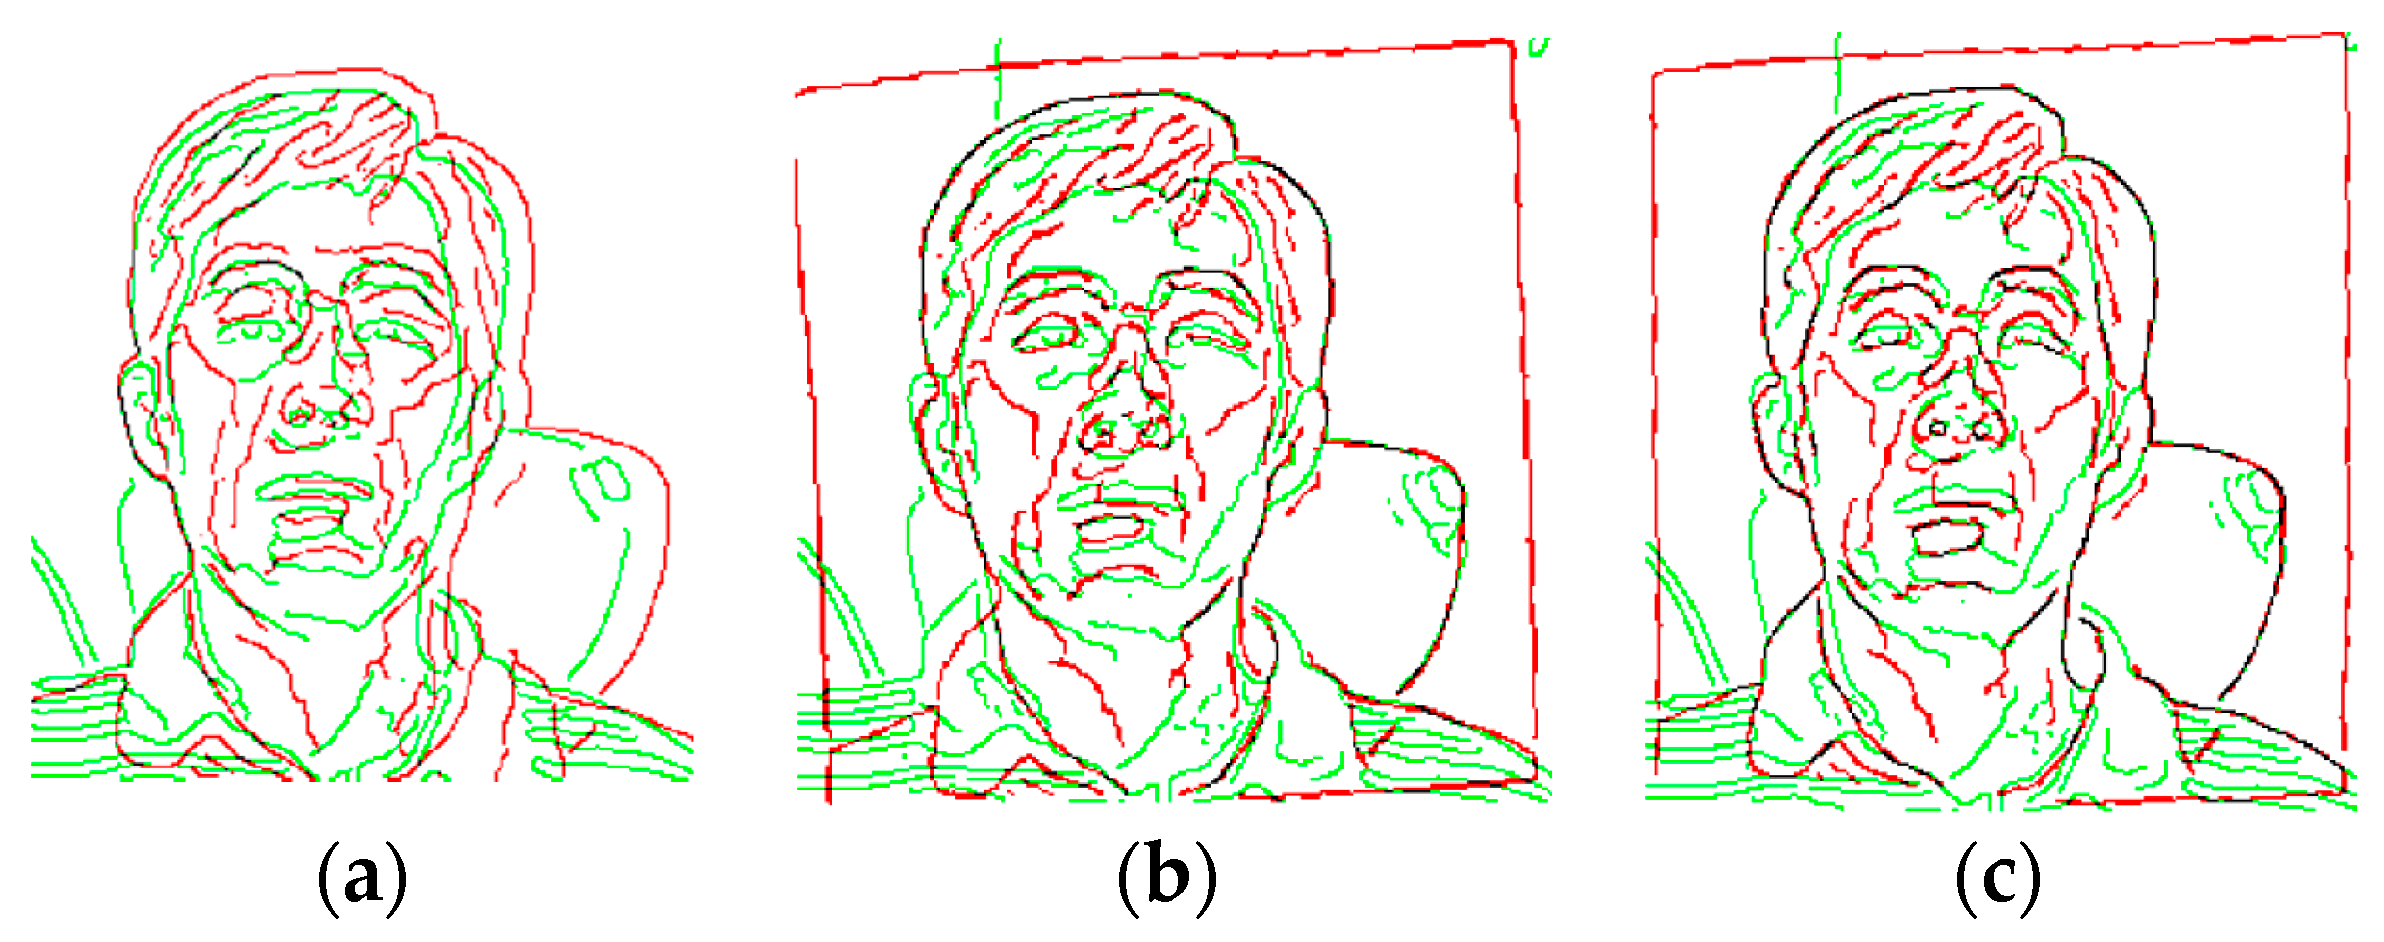
2.2. Fine Registration
3. Results
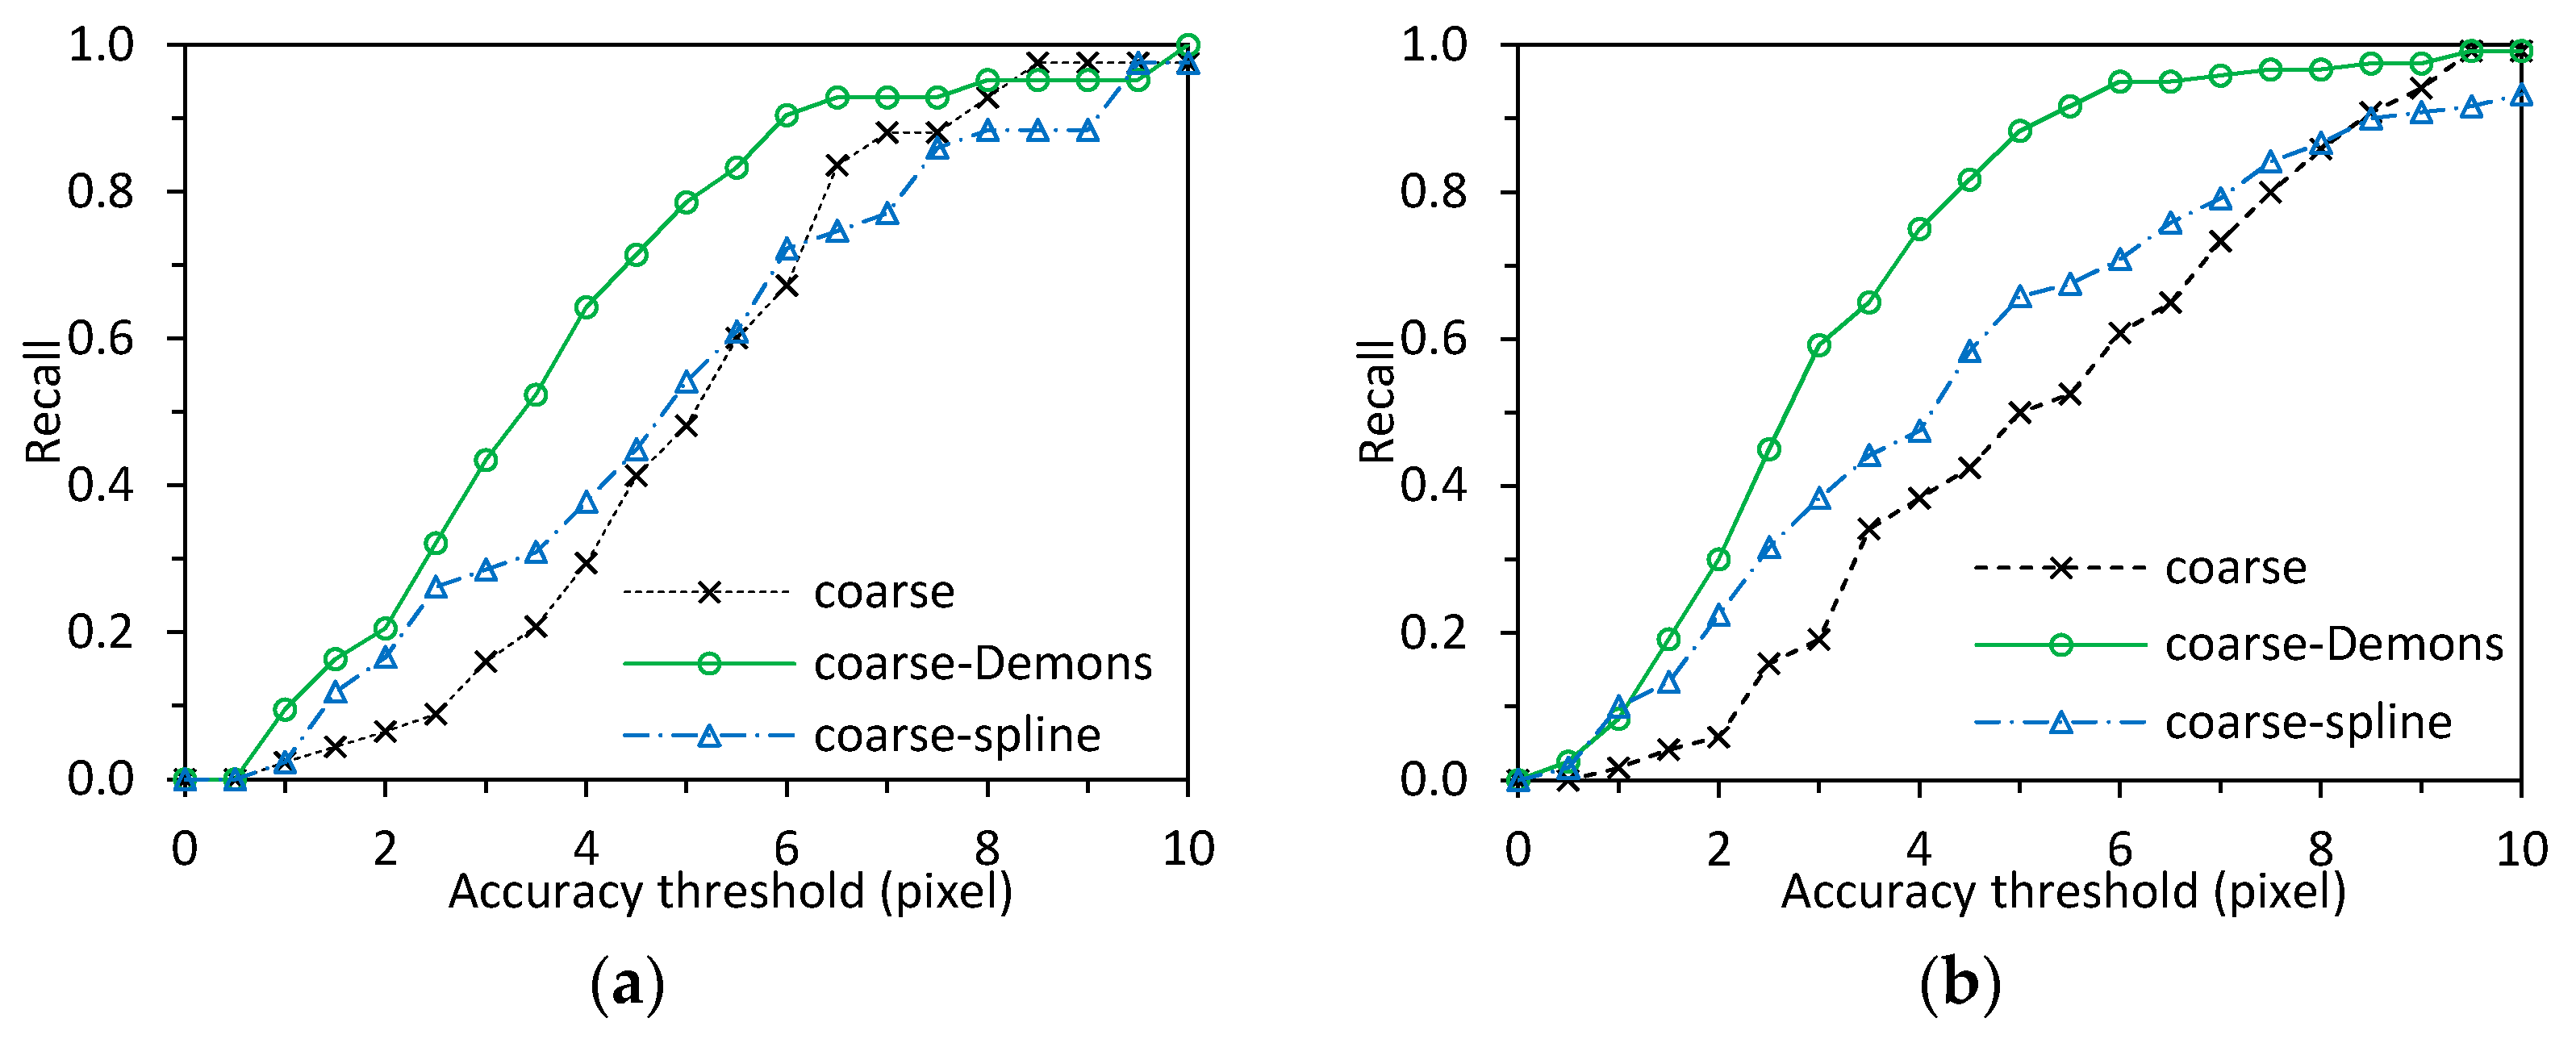
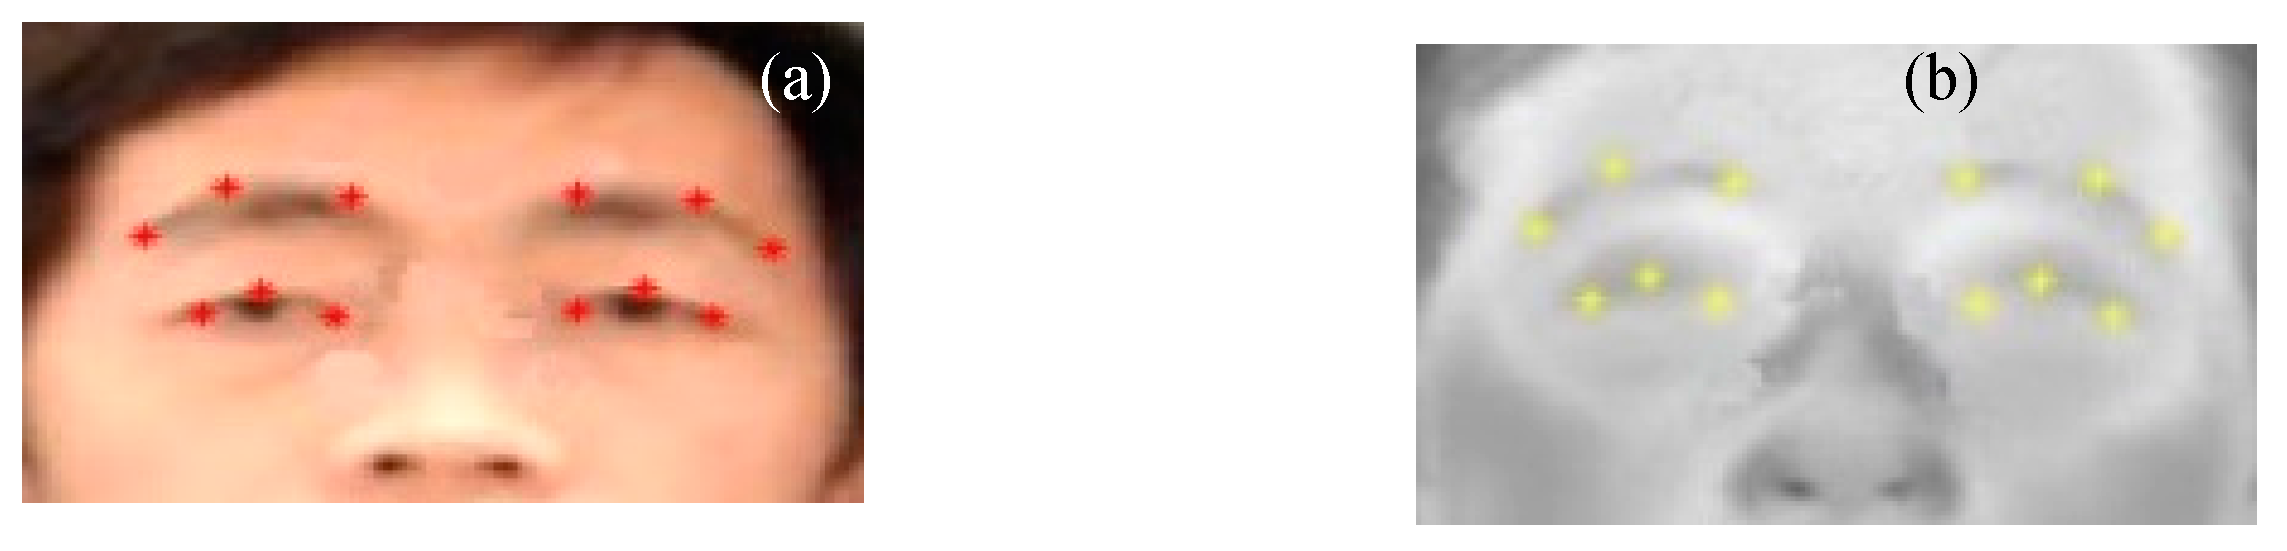
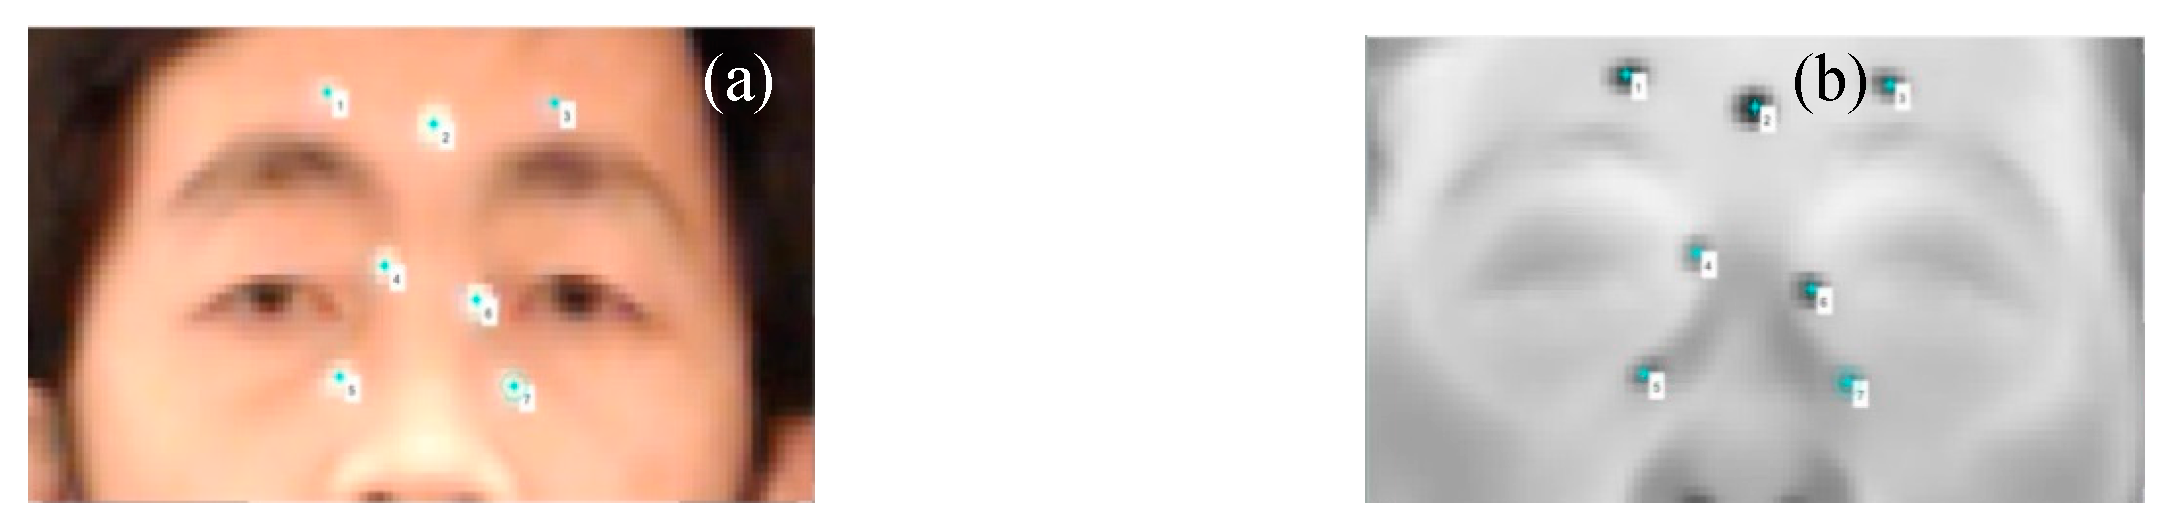
3.1. Registration Accuracy
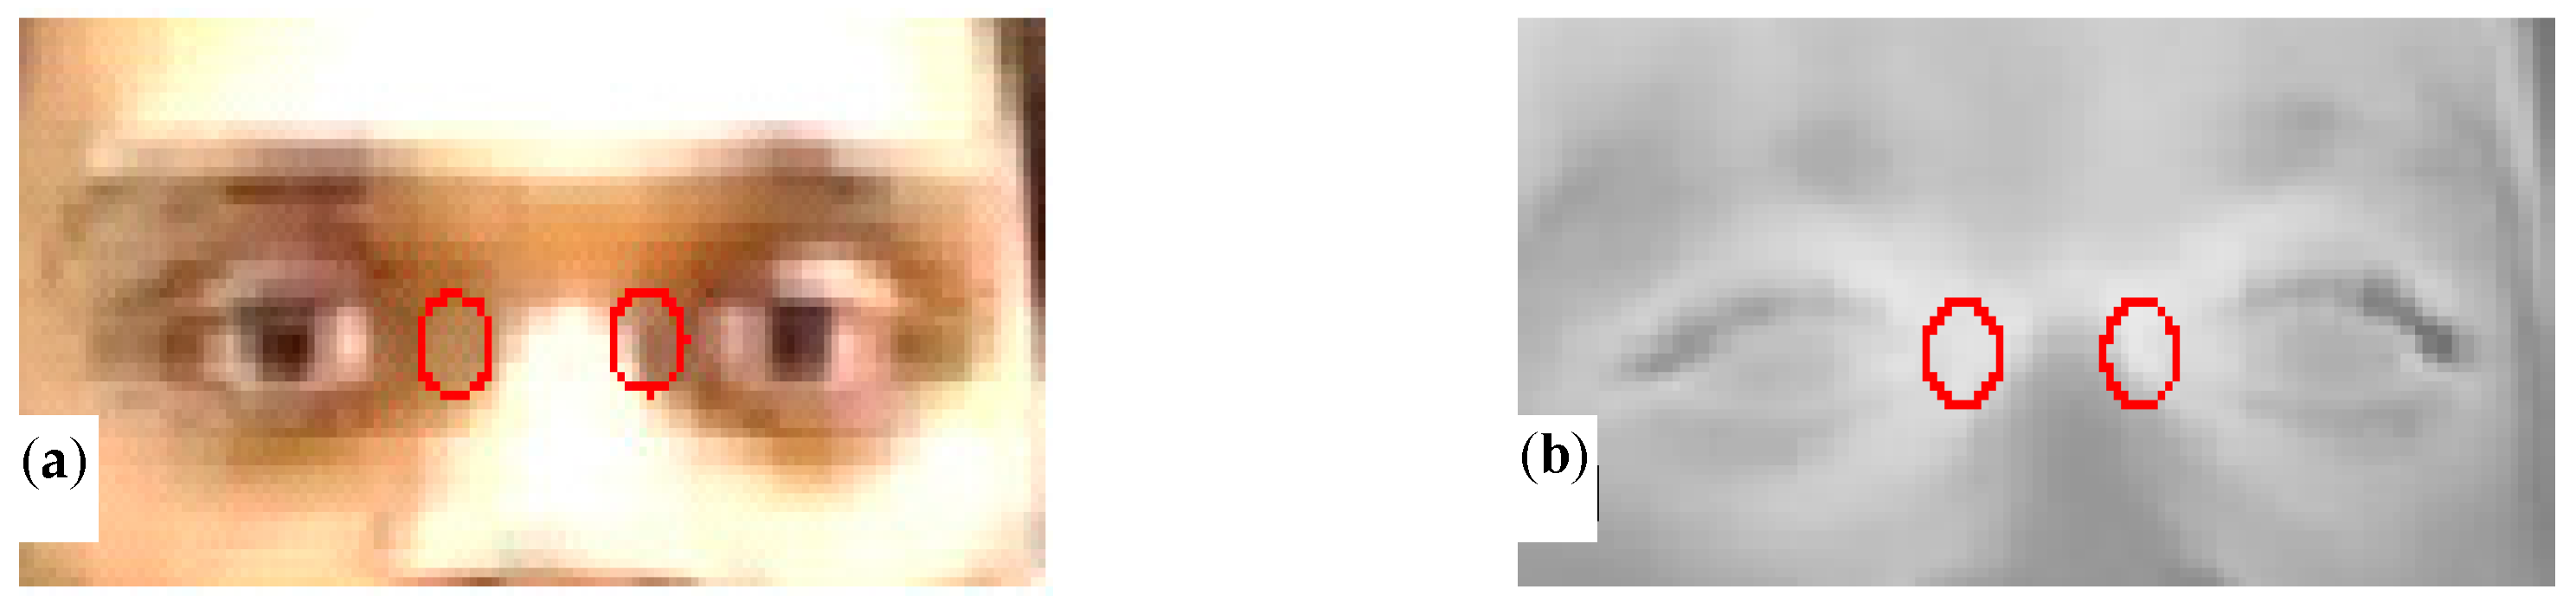
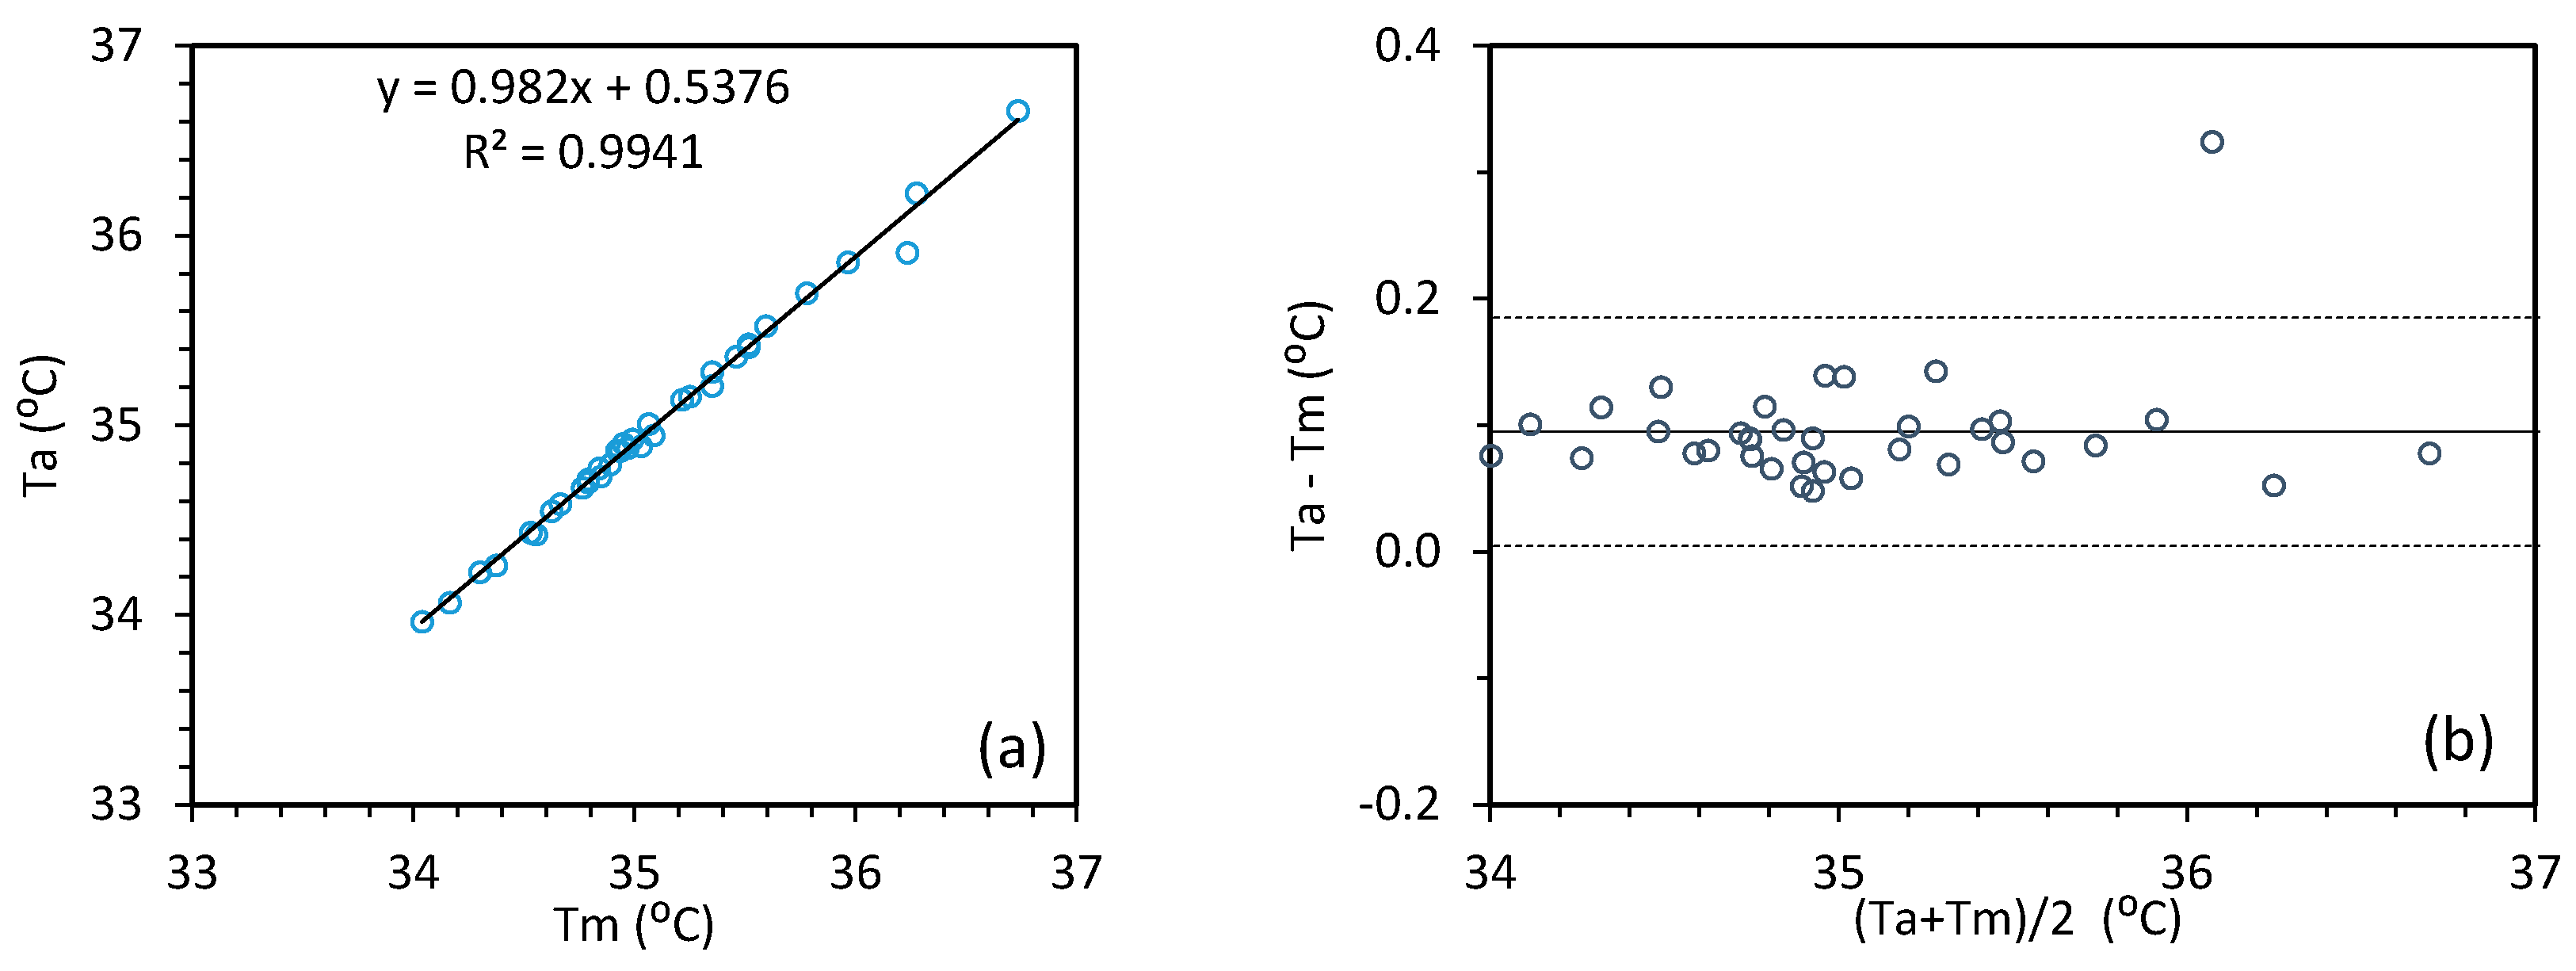
3.2. Canthi Temperature Measurement
4. Discussion
4.1. Image Registration Speed
4.2. Efffect of Image Quality on Registraton Accuracy
4.3. Effects of Other Factors on Registration Accuracy
5. Conclusions
Acknowledgments
Disclaimer
Author Contributions
Conflicts of Interest
References
- International Electrotechnical Commission (IEC)/International Organization for Standardization (ISO). IEC 80601-2-59: Particular Requirements for the Basic Safety and Essential Performance of Screening Thermographs for Human Febrile Temperature Screening; International Electrotechnical Commission: Geneva, Switzerland, 2017. [Google Scholar]
- Cai, J.; Cheng, Q.; Peng, M.; Song, Y. Fusion of infrared and visible images based on nonsubsampled contourlet transform and sparse K-SVD dictionary learning. Infrared Phys. Techn. 2017, 82, 85–95. [Google Scholar] [CrossRef]
- Ma, J.; Jiang, J.; Liu, C.; Li, Y. Feature guided Gaussian mixture model with semi-supervised EM and local geometric constraint for retinal image registration. Inf. Sci. 2017, 417, 128–142. [Google Scholar] [CrossRef]
- Sun, X.; Xu, T.; Zhang, J.; Zhao, Z.; Li, Y. An Automatic Multi-Target Independent Analysis Framework for Non-Planar Infrared-Visible Registration. Sensors 2017, 17, 1696. [Google Scholar] [CrossRef]
- Ma, J.; Chen, C.; Li, C.; Huang, J. Infrared and visible image fusion via gradient transfer and total variation minimization. Inf. Fusion 2016, 31, 100–109. [Google Scholar] [CrossRef]
- Han, J.; Pauwels, E.J.; De Zeeuw, P. Visible and infrared image registration in man-made environments employing hybrid visual features. Pattern Recognit. Lett. 2013, 34, 42–51. [Google Scholar] [CrossRef]
- Ma, J.; Zhao, J.; Ma, Y.; Tian, J. Non-rigid visible and infrared face registration via regularized Gaussian fields criterion. Pattern Recognit. 2015, 48, 772–784. [Google Scholar] [CrossRef]
- Liu, F.; Seipel, S. Infrared-visible image registration for augmented reality-based thermographic building diagnostics. Visual. Eng. 2015, 3, 16. [Google Scholar] [CrossRef]
- Raza, S.; Sanchez, V.; Prince, G.; Clarkson, J.P.; Rajpoot, N.M. Registration of thermal and visible light images of diseased plants using silhouette extraction in the wavelet domain. Pattern Recognit. 2015, 48, 2119–2128. [Google Scholar] [CrossRef]
- Nocedal, J.; Wright, S. Numerical Optimization; Springer Science & Business Media LLC: New York, NY, USA, 2006. [Google Scholar]
- Mattes, D.; Haynor, D.R.; Vesselle, H.; Lewellen, T.; Eubank, W. Non-Rigid Multimodality Image Registration. Med. Imag. 2001, 1609–1620. [Google Scholar]
- Thirion, J.-P. Image matching as a diffusion process: An analogy with Maxwell’s demons. Med. Image Anal. 1998, 2, 243–260. [Google Scholar] [CrossRef]
- Horn, B.K.; Schunck, B.G. Determining optical flow. Artif. Intell. 1981, 17, 185–203. [Google Scholar] [CrossRef]
- Gu, X.; Pan, H.; Liang, Y.; Castillo, R.; Yang, D.; Choi, D.; Castillo, E.; Majumdar, A.; Guerrero, T.; Jiang, S.B. Implementation and evaluation of various demons deformable image registration algorithms on a GPU. Phys. Med. Biol. 2009, 55, 207–219. [Google Scholar] [CrossRef] [PubMed]
- Zitova, B.; Flusser, J. Image registration methods: A survey. Image Vis. Comput. 2003, 21, 977–1000. [Google Scholar] [CrossRef]
- Pluim, J.P.; Maintz, J.A.; Viergever, M.A. Mutual-information-based registration of medical images: A survey. IEEE Trans. Med. Imaging 2003, 22, 986–1004. [Google Scholar] [CrossRef] [PubMed]
- Woods, R.P.; Mazziotta, J.C.; Cherry, S.R. MRI-PET registration with automated algorithm. J. Comput. Assist. Tomogr. 1993, 17, 536–546. [Google Scholar] [CrossRef] [PubMed]
- Hill, D.L.; Maurer, C.R., Jr.; Martin, A.J.; Sabanathan, S.; Hall, W.A.; Hawkes, D.J.; Rueckert, D.; Truwit, C.L. Assessment of Intraoperative Brain Deformation Using Interventional MR Imaging. In International Conference on Medical Image Computing and Computer-Assisted Intervention; Springer: Berlin/Heidelberg, Germany, 1999; pp. 910–919. [Google Scholar]
- Dwith, C.; Ghassemi, P.; Pfefer, J.; Casamento, J.; Wang, Q. Multi-modality image registration for effective thermographic fever screening. In Proceedings of the 2017 Multimodal Biomedical Imaging XII, San Francisco, CA, USA, 28 January–2 February 2017; p. 100570S. [Google Scholar] [CrossRef]
- Goshtasby, A.A. 2-D and 3-D Image Registration: For Medical, Remote Sensing, and Industrial Applications; Wiley-Interscience: Hoboken, NJ, USA, 2005. [Google Scholar]
- Maintz, J.A.; Viergever, M.A. A survey of medical image registration. Med. Image Anal. 1998, 2, 1–36. [Google Scholar] [CrossRef]
- Wang, Q.; Khanicheh, A.; Leiner, D.; Shafer, D.; Zobel, J. Endoscope field of view measurement. Biomed. Opt. Exp. 2017, 8, 1441–1454. [Google Scholar] [CrossRef] [PubMed]
- Viola, P.; Jones, M. Rapid object detection using a boosted cascade of simple features. In Proceedings of the 2001 IEEE Computer Society Conference on Computer Vision and Pattern Recognition (CVPR), Kauai, HI, USA, 8–14 December 2001; pp. I-511–I-518. [Google Scholar]
- Noulas, A.K.; Kröse, B.J. EM detection of common origin of multi-modal cues. In Proceedings of the 8th International Conference on Multimodal interfaces, Banff, AB, Canada, 2–4 November 2006; pp. 201–208. [Google Scholar]
- Ng, E.Y.; Kawb, G.; Chang, W. Analysis of IR thermal imager for mass blind fever screening. Microvasc. Res. 2004, 68, 104–109. [Google Scholar] [CrossRef] [PubMed]
- Asthana, A.; Zafeiriou, S.; Cheng, S.; Pantic, M. Robust discriminative response map fitting with constrained local models. In Proceedings of the IEEE Conference on Computer Vision and Pattern Recognition, Portland, OR, USA, 23–28 June 2013; pp. 3444–3451. [Google Scholar]
- International Organization for Standardization (ISO). ISO 12233: Photography—Electronic Still Picture Imaging—Resolution and Spatial Frequency Responses; International Organization for Standardization (ISO): Geneva, Switzerland, 2017. [Google Scholar]


| Methods | Coarse | Coarse—Demons | Coarse—Spline |
|---|---|---|---|
| Sub. M1 | 5.8 | 4.0 | 2.4 |
| Sub. M2 | 3.4 | 4.4 | 4.6 |
| Sub. M3 | 3.4 | 1.5 | 5.0 |
| Sub. M4 | 4.0 | 2.2 | 6.1 |
| Sub. M5 | 6.1 | 3.5 | 5.7 |
| Sub. M6 | 7.3 | 5.8 | 5.9 |
| Mean | 5.0 | 3.6 | 4.9 |
| SD | 1.6 | 1.5 | 1.3 |
| Methods | Coarse | Coarse—Demons | Coarse—Spline |
|---|---|---|---|
| Sub. L1 | 7.6 | 5.2 | 2.1 |
| Sub. L2 | 2.4 | 2.1 | 2.6 |
| Sub. L3 | 3.4 | 4.4 | 4.2 |
| Sub. L4 | 4.7 | 3.5 | 7.3 |
| Sub. L5 | 5.4 | 6.4 | 4.4 |
| Sub. L6 | 3.5 | 1.8 | 3.1 |
| Sub. L7 | 8.5 | 2.3 | 6.0 |
| Sub. L8 | 3.7 | 2.2 | 4.9 |
| Sub. L9 | 6.6 | 1.6 | 6.3 |
| Sub. L10 | 5.6 | 2.1 | 4.8 |
| Mean | 5.1 | 3.2 | 4.6 |
| SD | 1.9 | 1.6 | 1.7 |
© 2018 by the authors. Licensee MDPI, Basel, Switzerland. This article is an open access article distributed under the terms and conditions of the Creative Commons Attribution (CC BY) license (http://creativecommons.org/licenses/by/4.0/).
Share and Cite
Dwith Chenna, Y.N.; Ghassemi, P.; Pfefer, T.J.; Casamento, J.; Wang, Q. Free-Form Deformation Approach for Registration of Visible and Infrared Facial Images in Fever Screening. Sensors 2018, 18, 125. https://doi.org/10.3390/s18010125
Dwith Chenna YN, Ghassemi P, Pfefer TJ, Casamento J, Wang Q. Free-Form Deformation Approach for Registration of Visible and Infrared Facial Images in Fever Screening. Sensors. 2018; 18(1):125. https://doi.org/10.3390/s18010125
Chicago/Turabian StyleDwith Chenna, Yedukondala Narendra, Pejhman Ghassemi, T. Joshua Pfefer, Jon Casamento, and Quanzeng Wang. 2018. "Free-Form Deformation Approach for Registration of Visible and Infrared Facial Images in Fever Screening" Sensors 18, no. 1: 125. https://doi.org/10.3390/s18010125
APA StyleDwith Chenna, Y. N., Ghassemi, P., Pfefer, T. J., Casamento, J., & Wang, Q. (2018). Free-Form Deformation Approach for Registration of Visible and Infrared Facial Images in Fever Screening. Sensors, 18(1), 125. https://doi.org/10.3390/s18010125