
A Smartphone Indoor Localization Algorithm Based on WLAN Location Fingerprinting with Feature Extraction and Clustering


Abstract
:1. Introduction
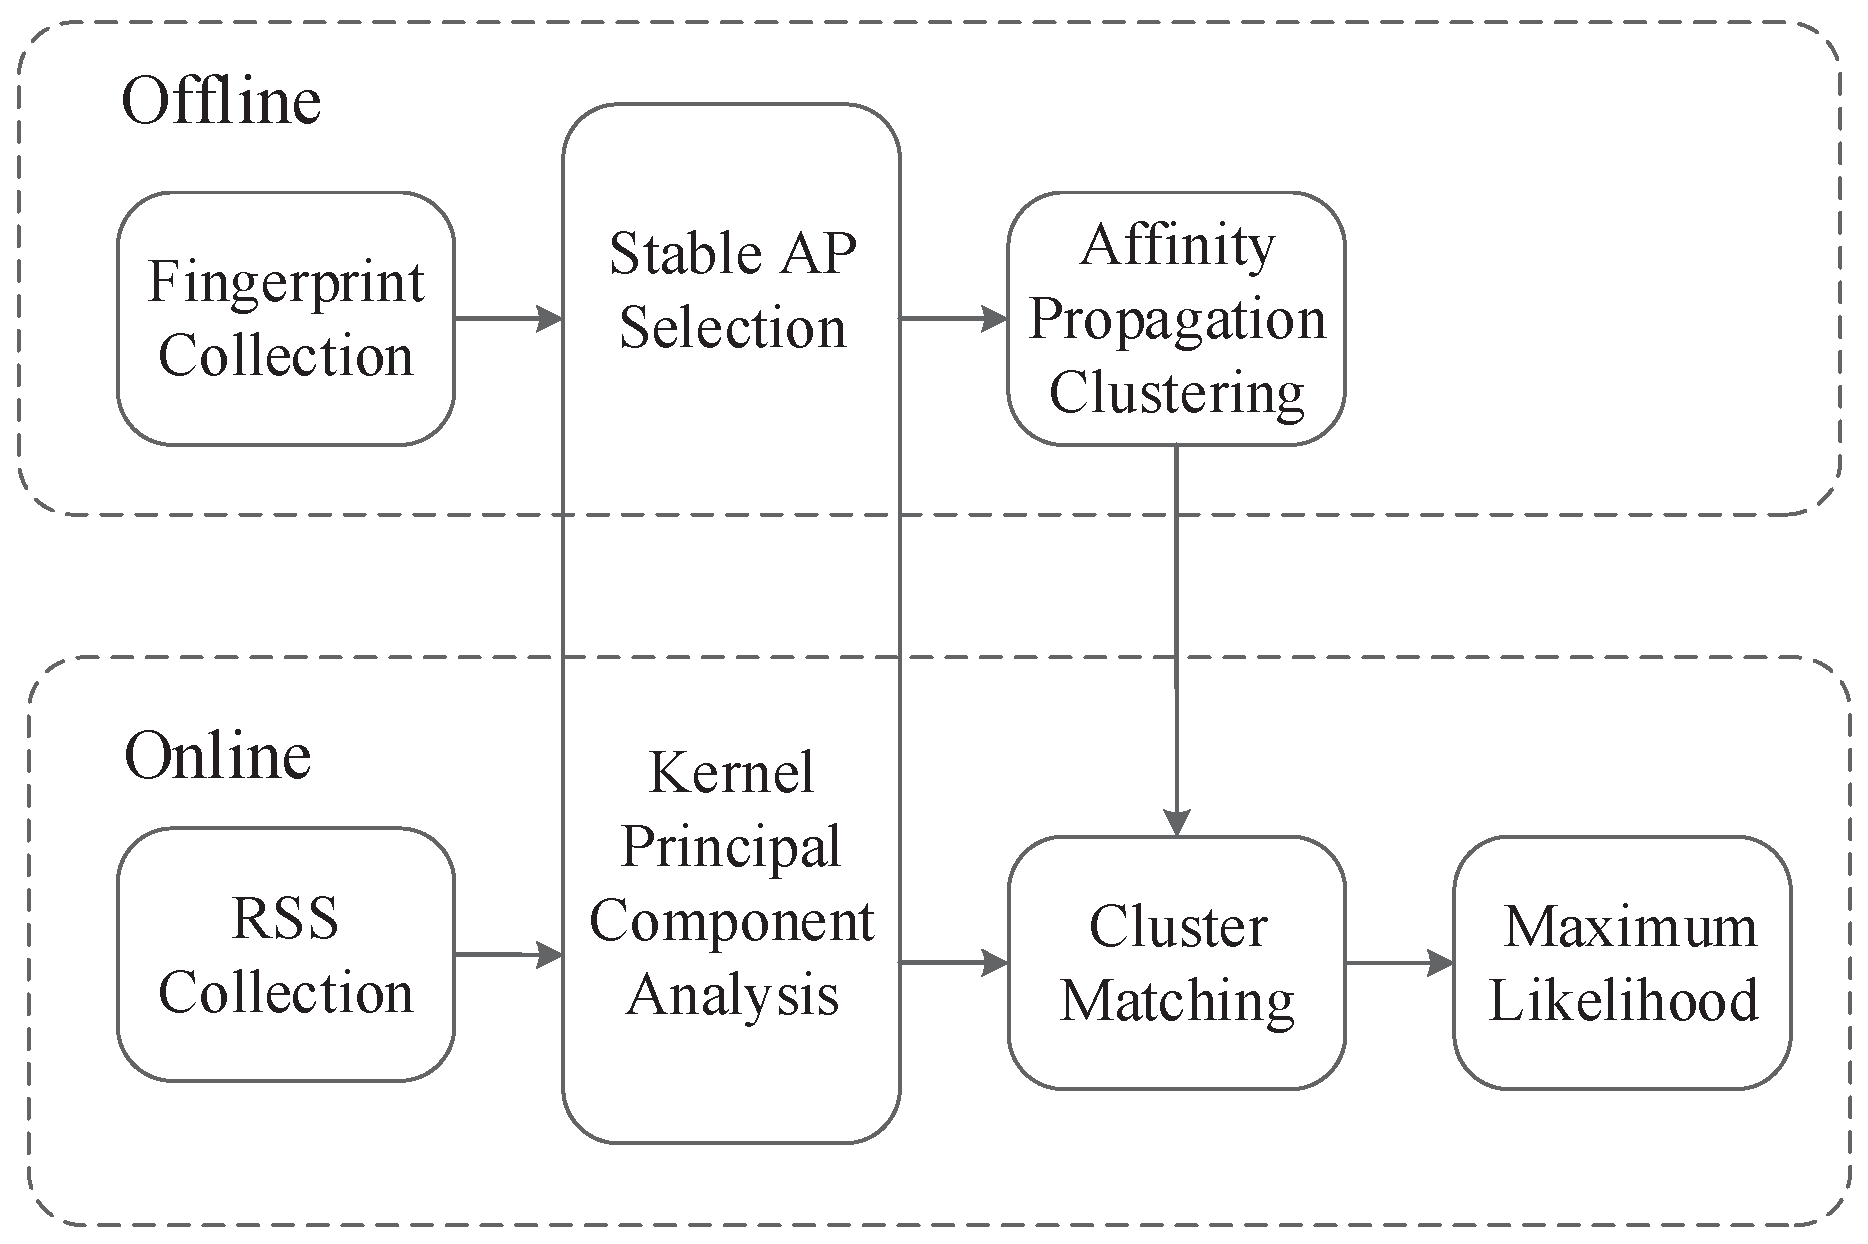
2. Modeling of Positioning System
2.1. Offline Stage
2.1.1. Fingerprint Collection
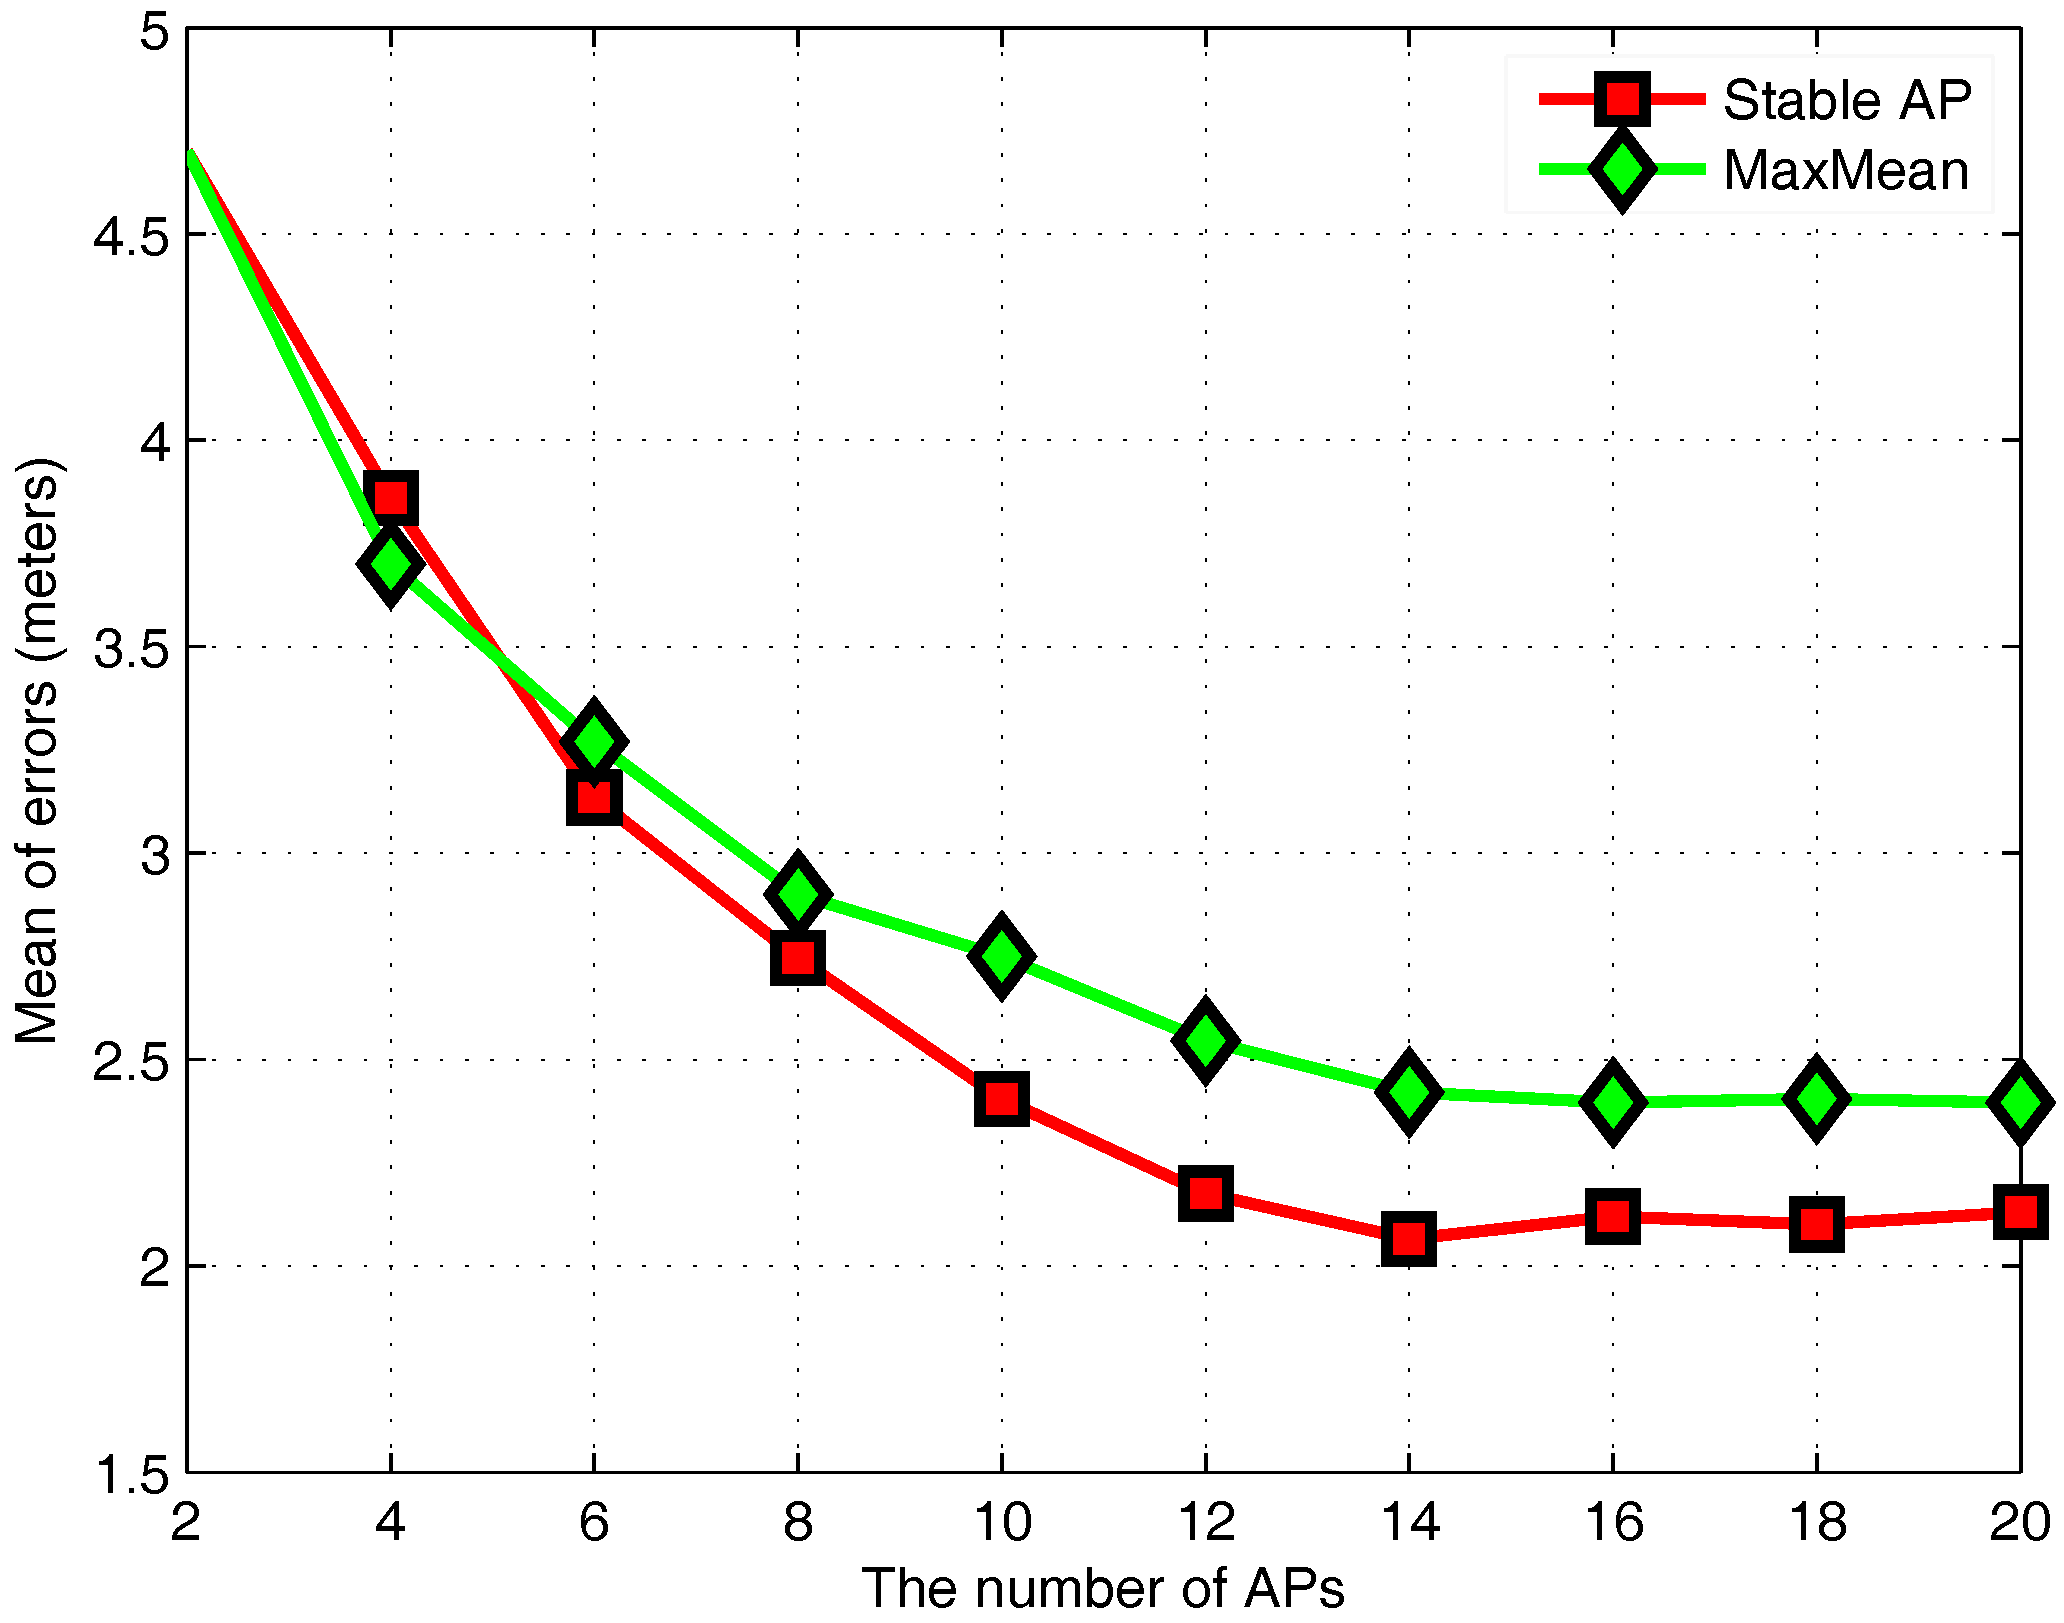
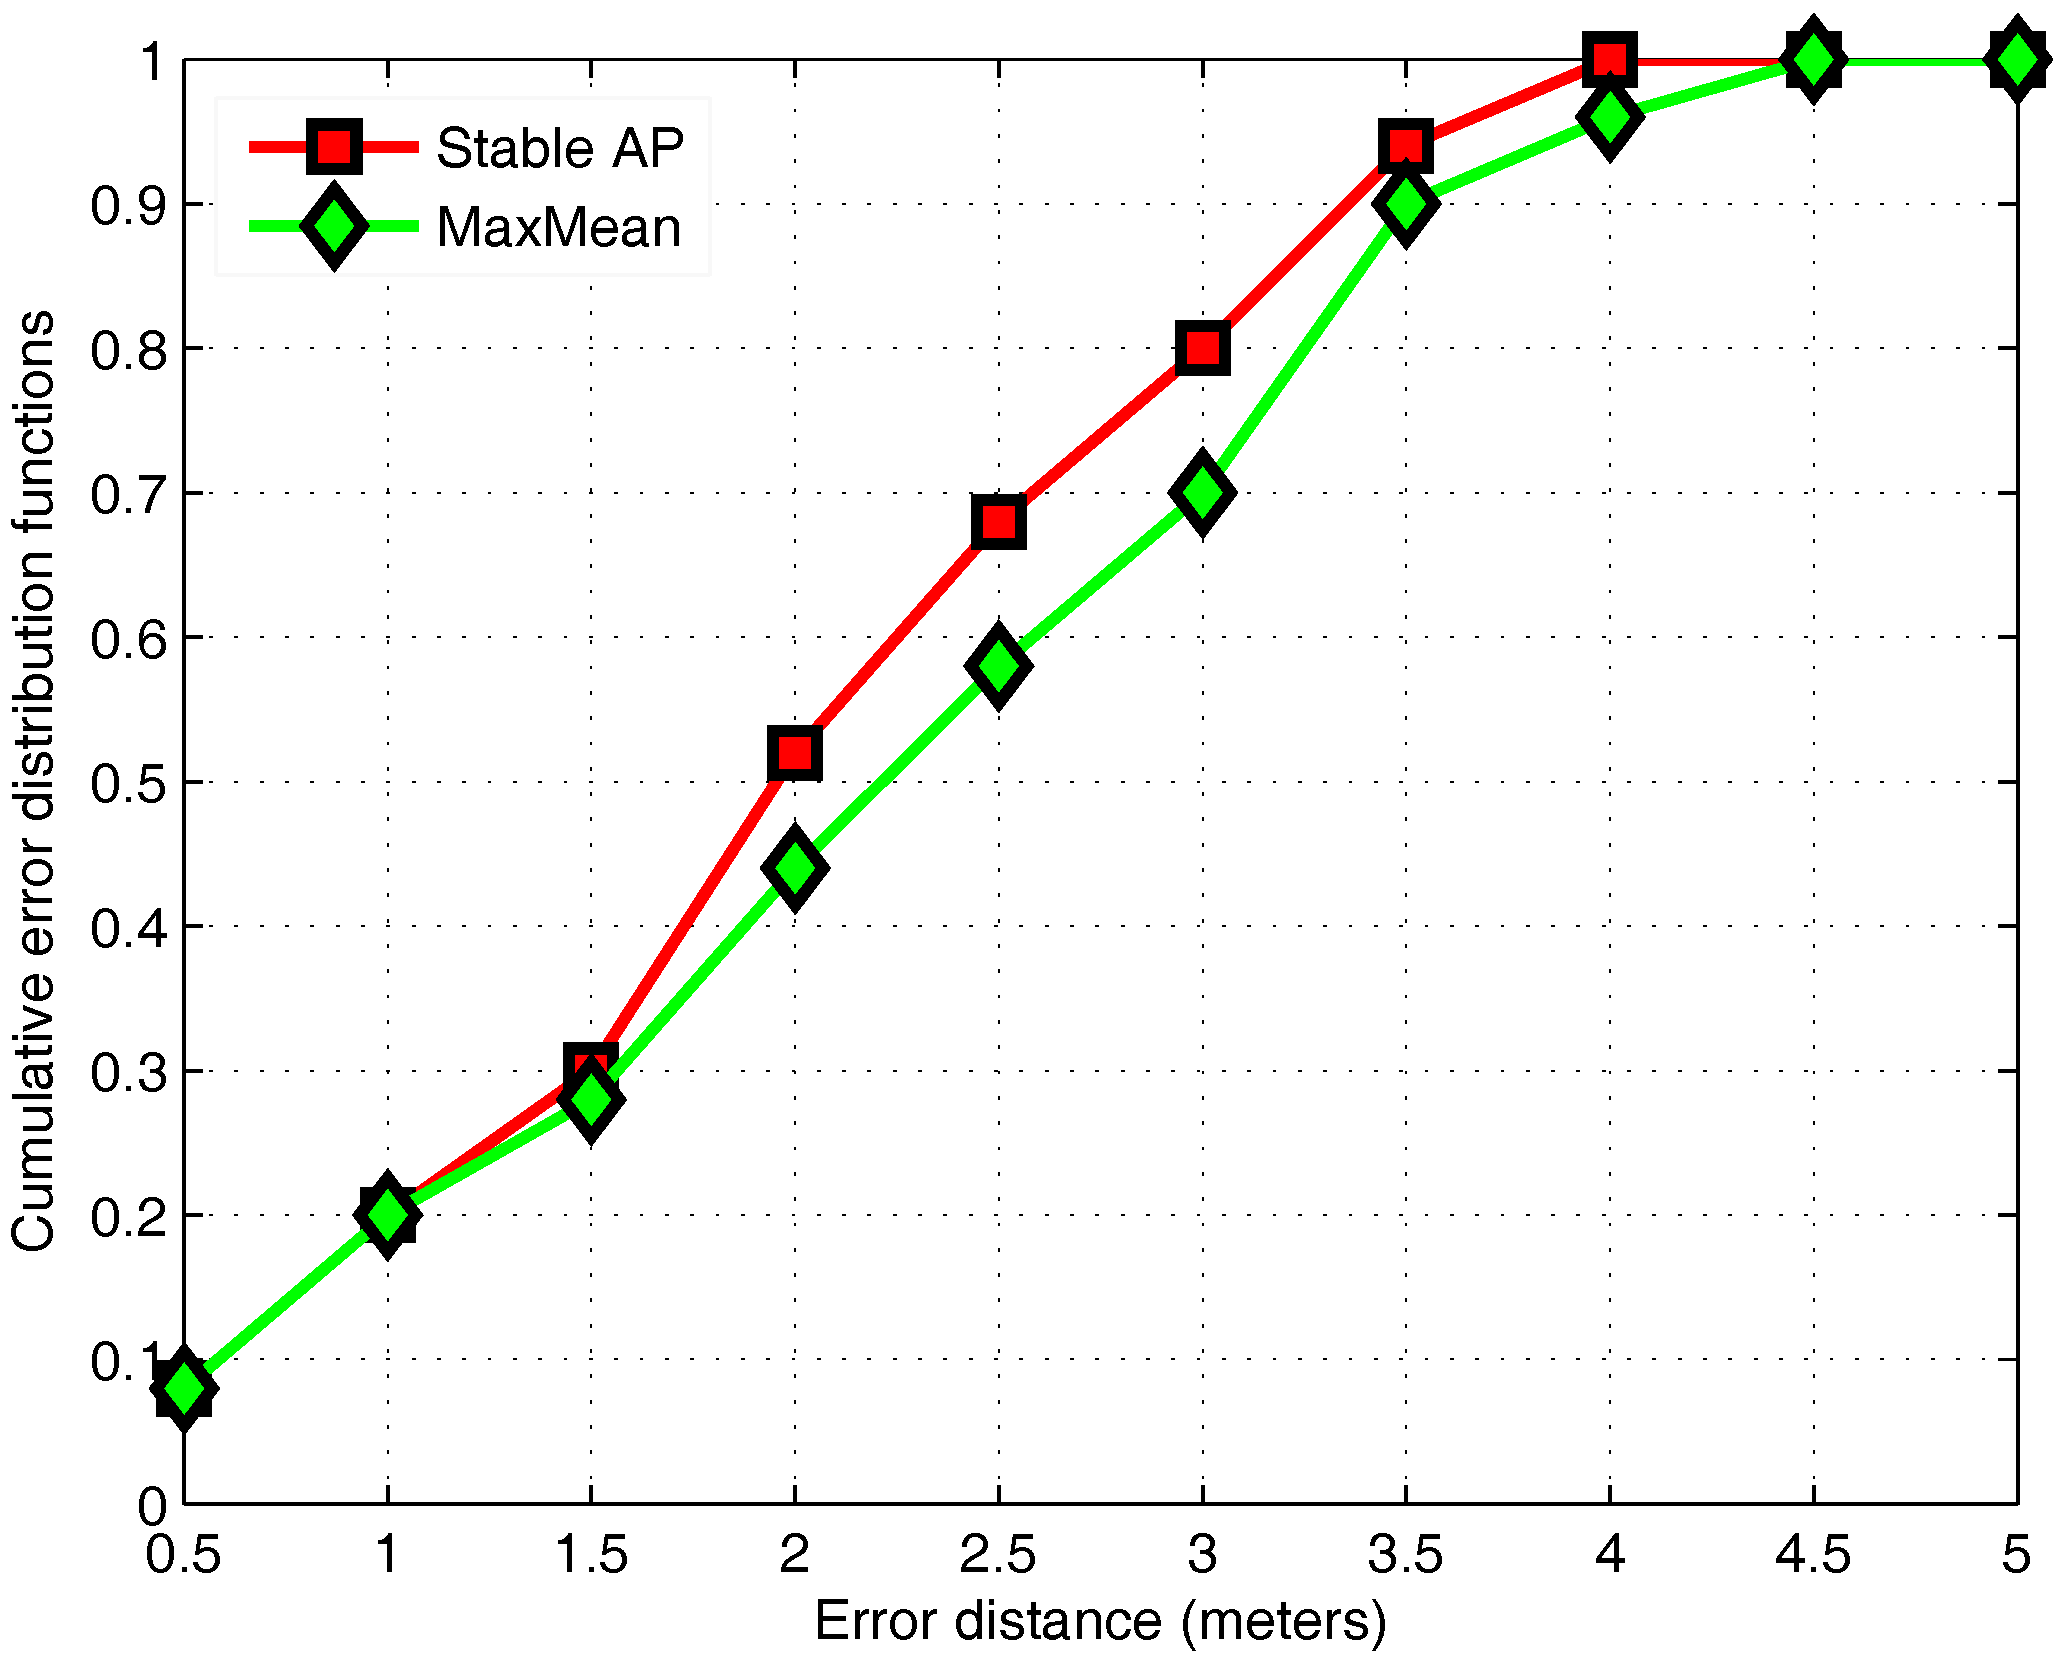
2.1.2. Stable AP Selection Alogorithm
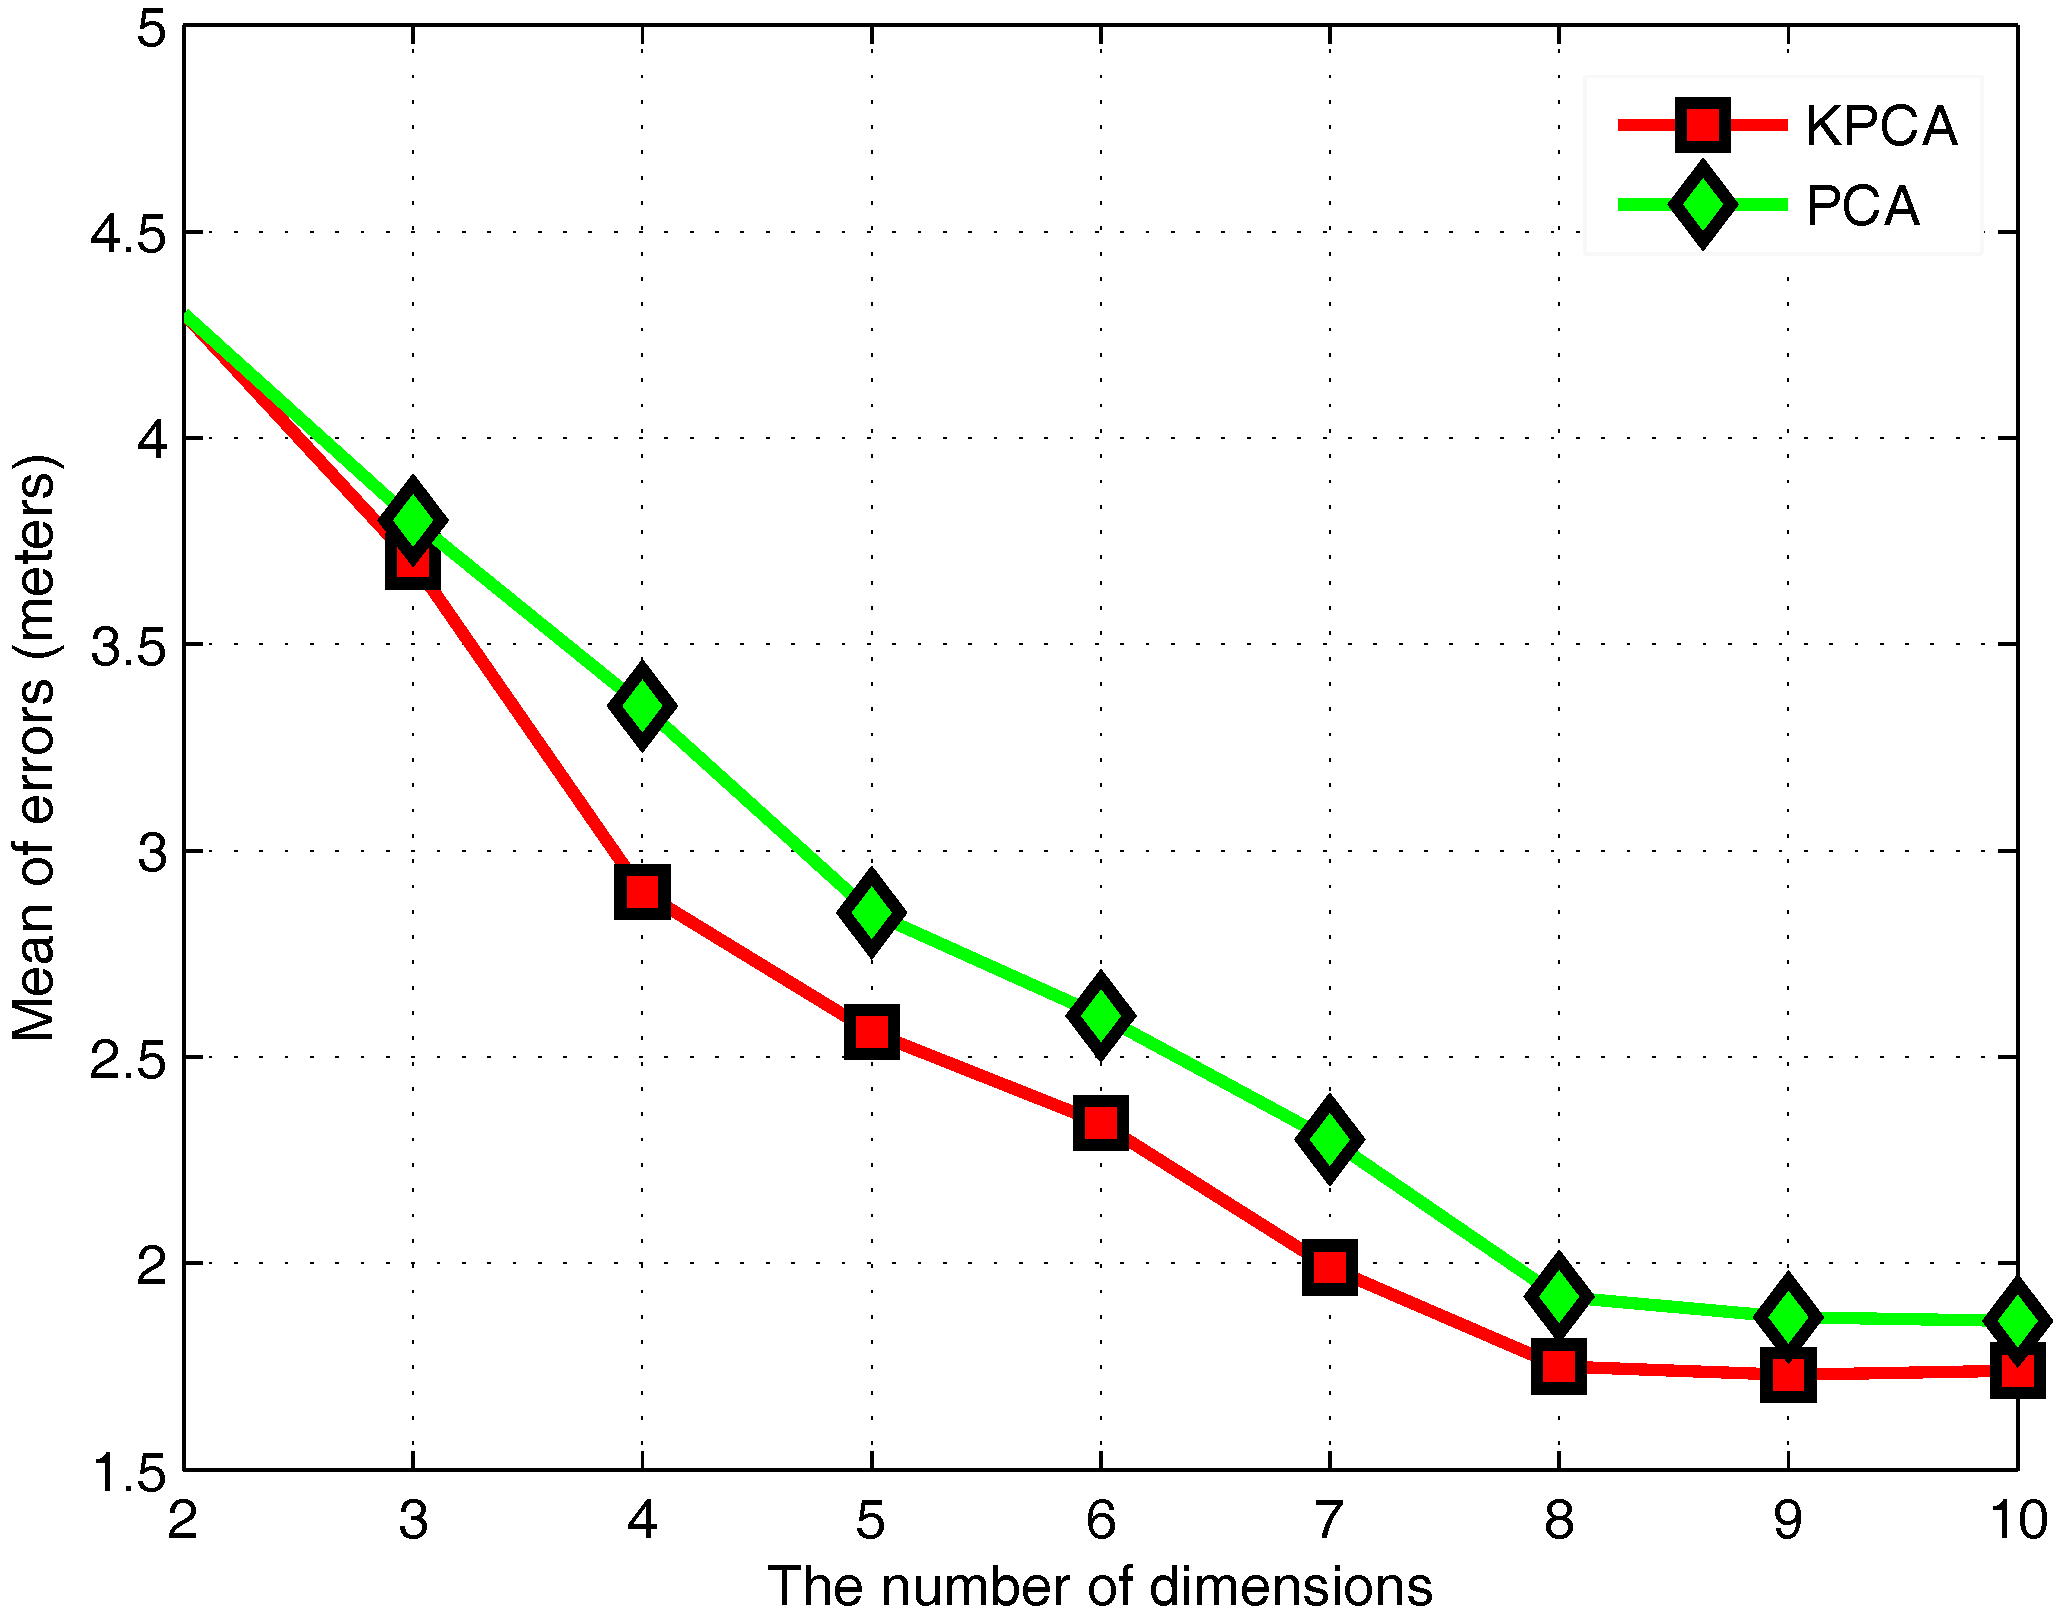
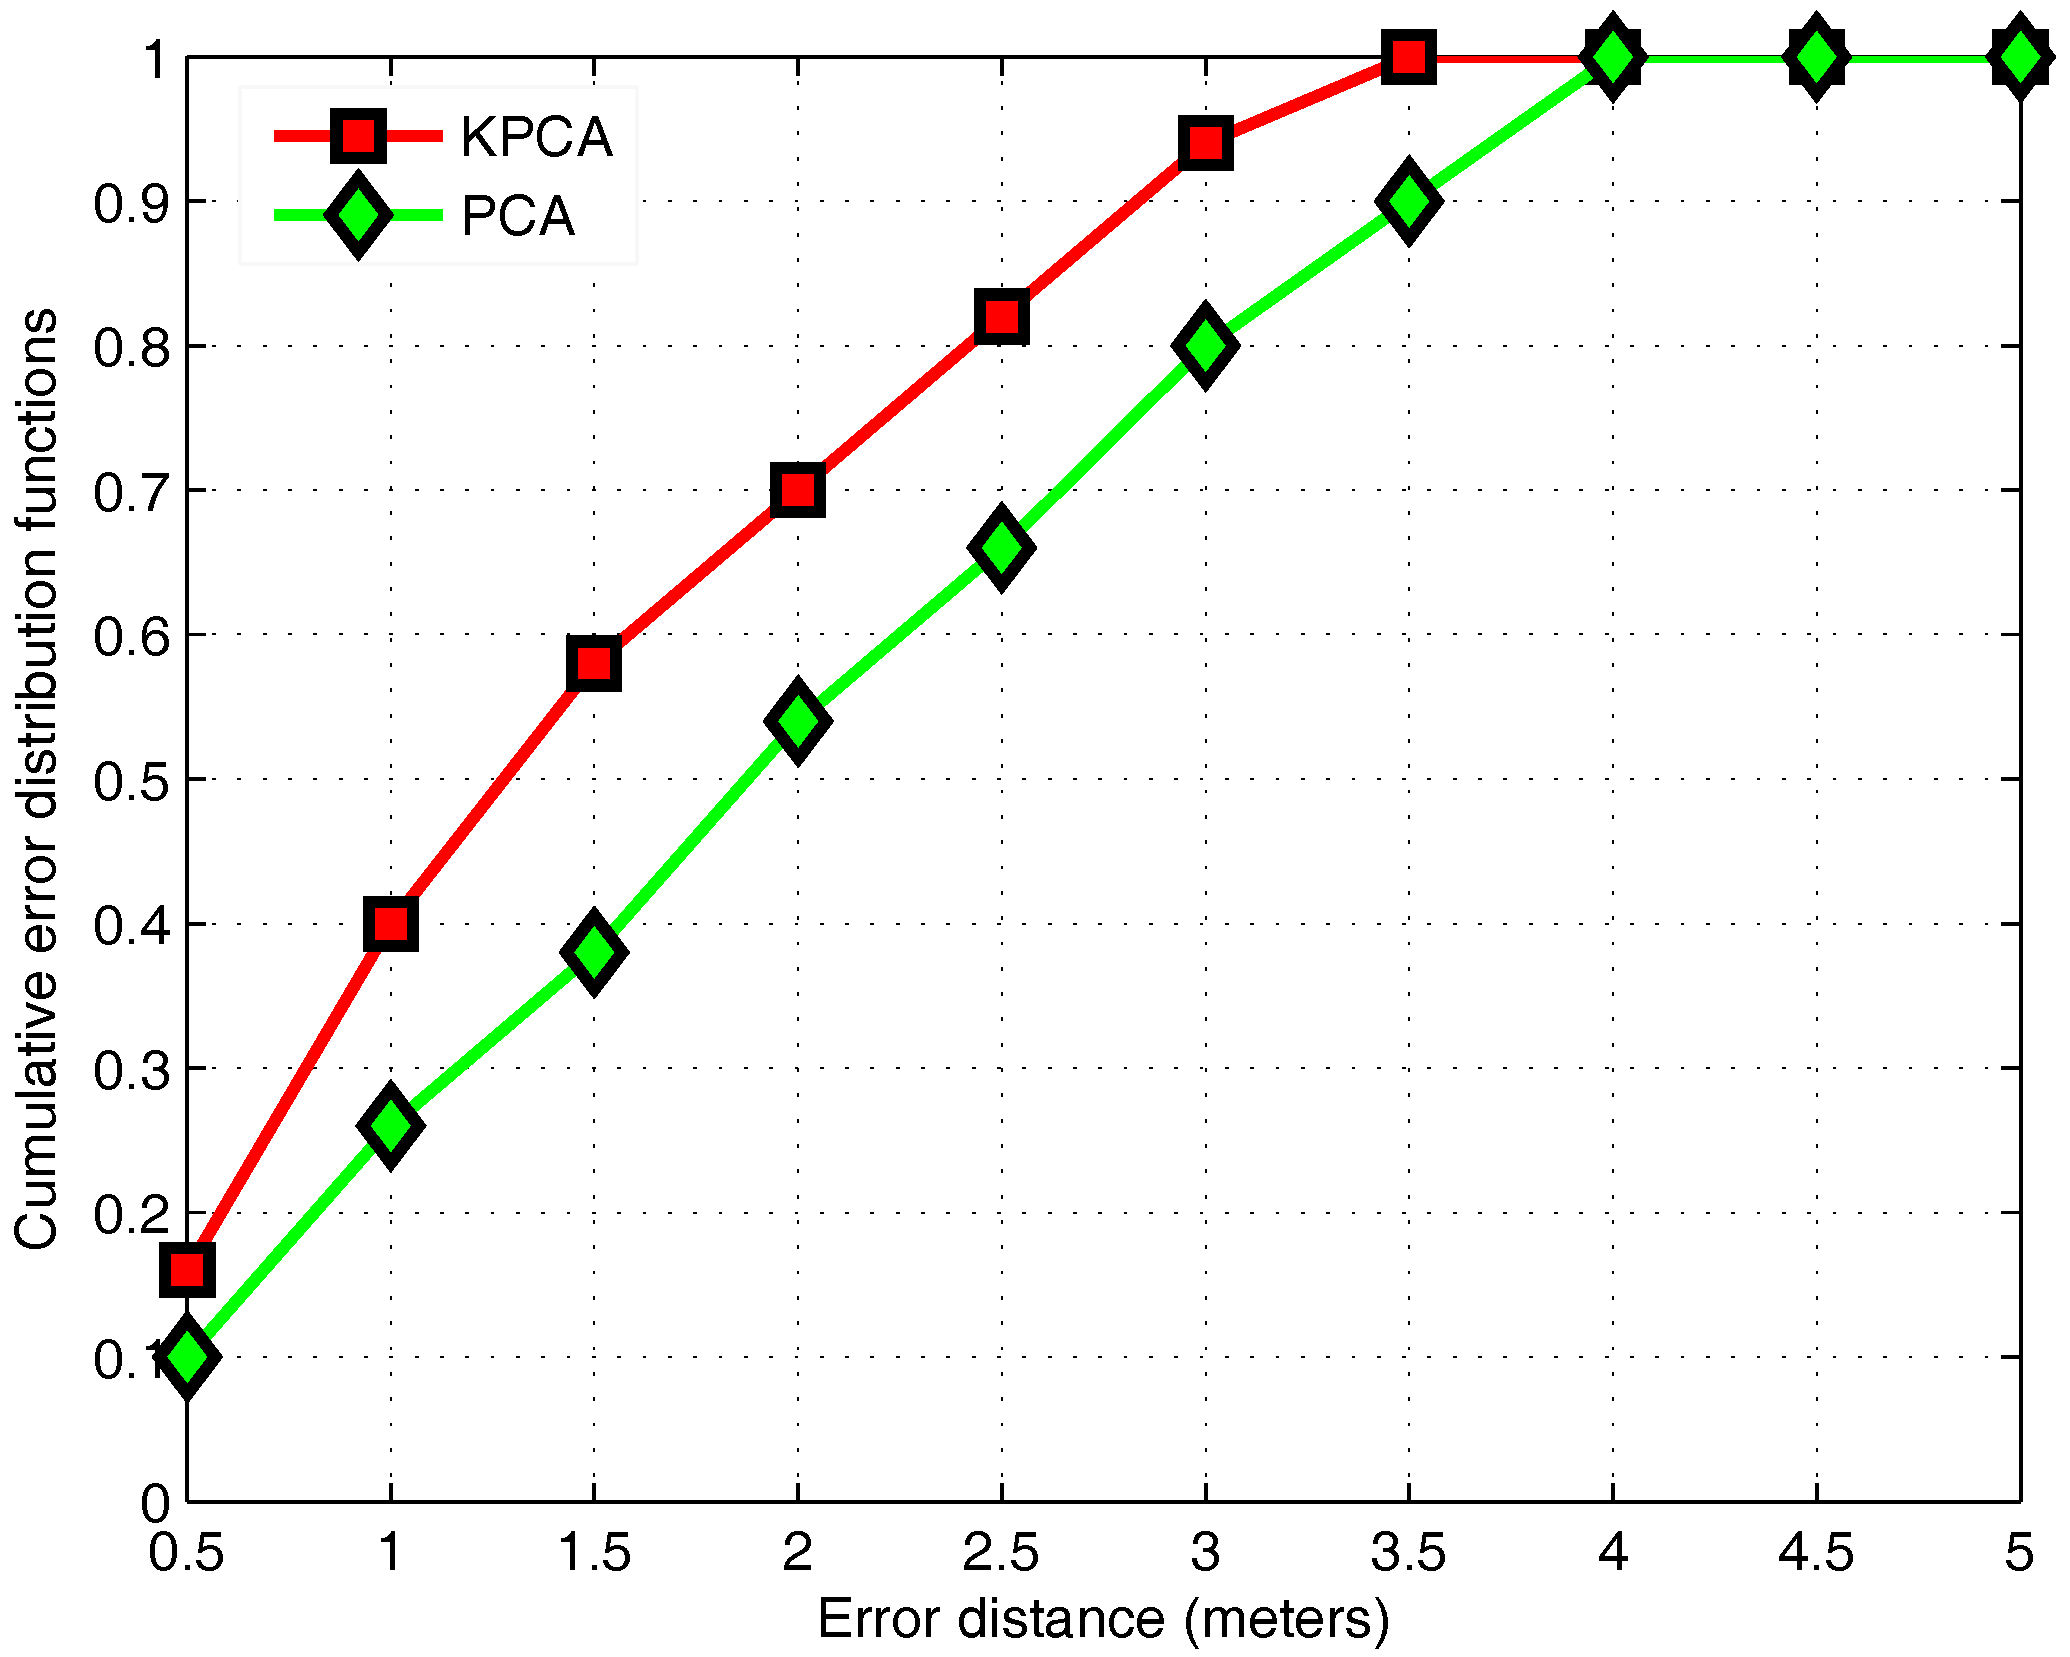
2.1.3. KPCA Algorithm
- is the input data in the low-dimensional space, and the Gaussian kernel matrix is calculated by Equation (17).
- The modified kernel matrix data is calculated by Equation (15).
- Calculate the eigenvalues and eigenvectors after modifying the kernel matrix. Arrange the eigenvalues from large to small. The former K eigenvalues and the corresponding eigenvectors are selected.
- The schemed orthogonal method is used to get the linearly independent vector group.
- The matrix transformed by Equation (16) is stored in the fingerprint database.
2.1.4. APC Algorithm
2.2. Online Stage
2.2.1. Cluster Matching
2.2.2. ML Estimate
3. Experimentation and Evaluation
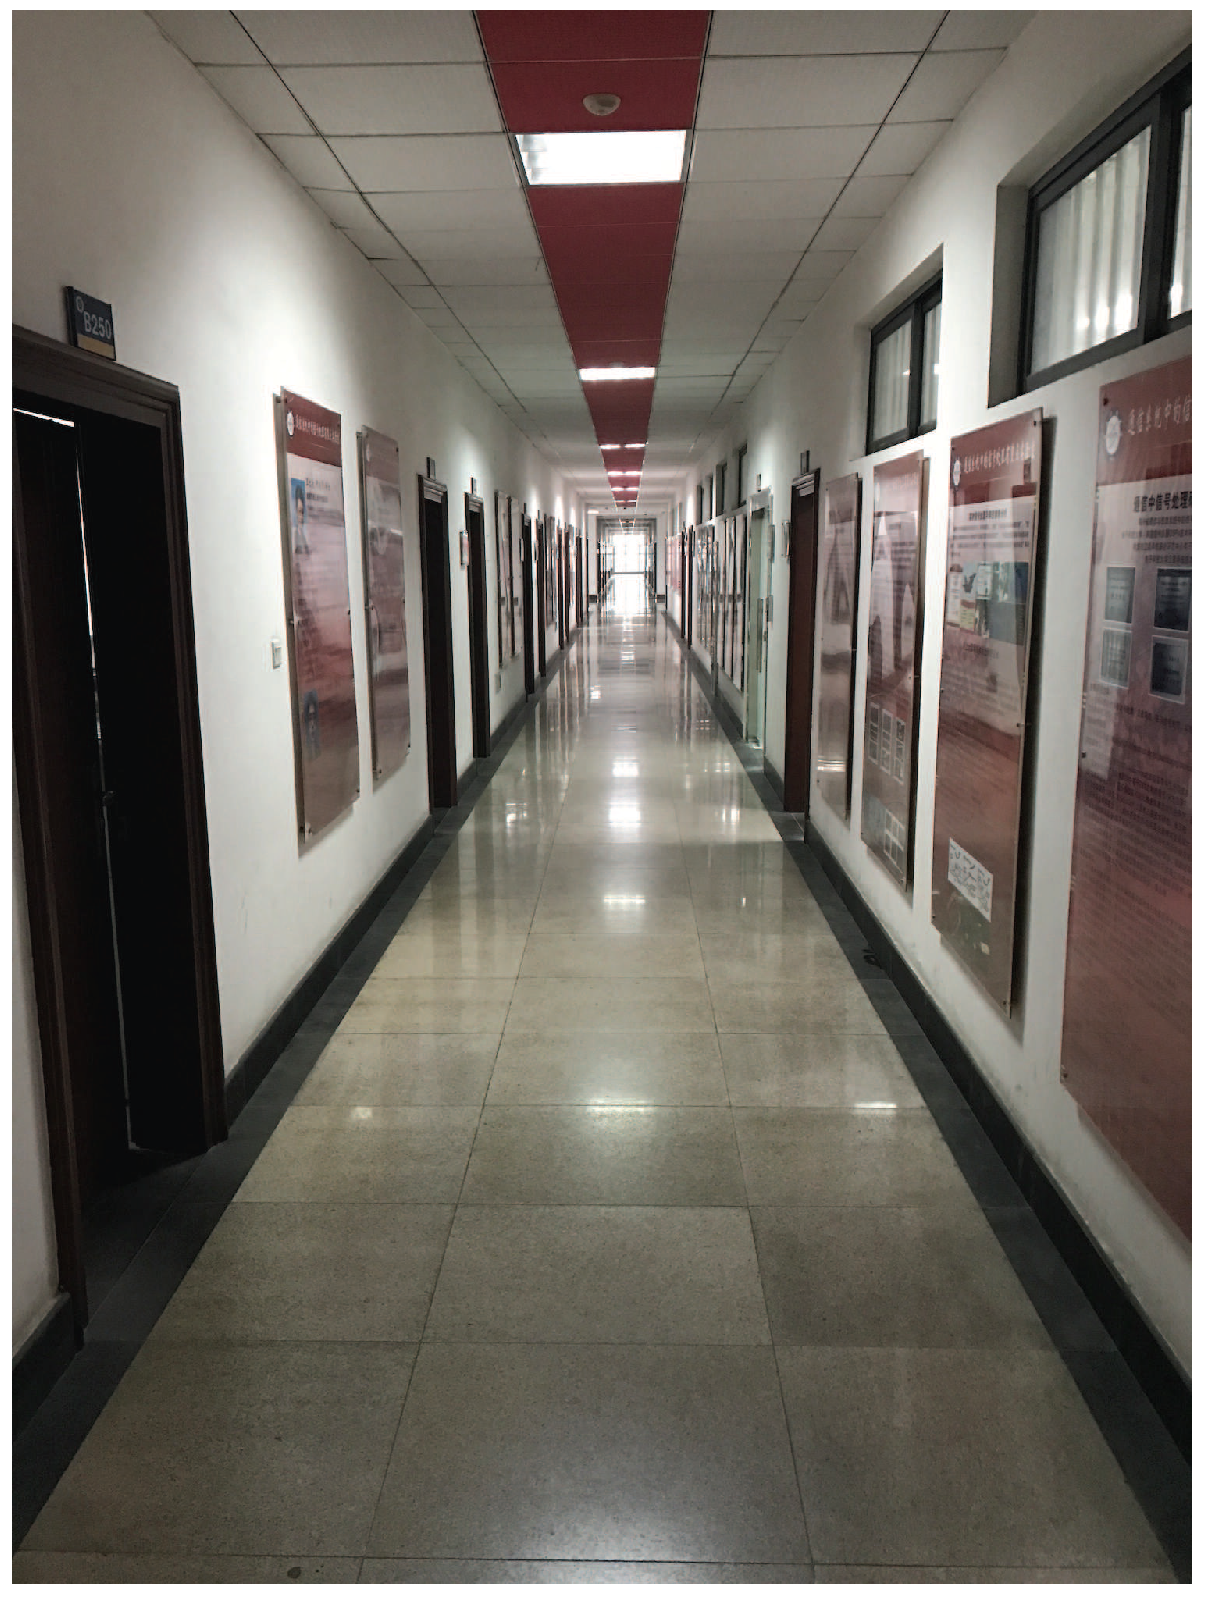
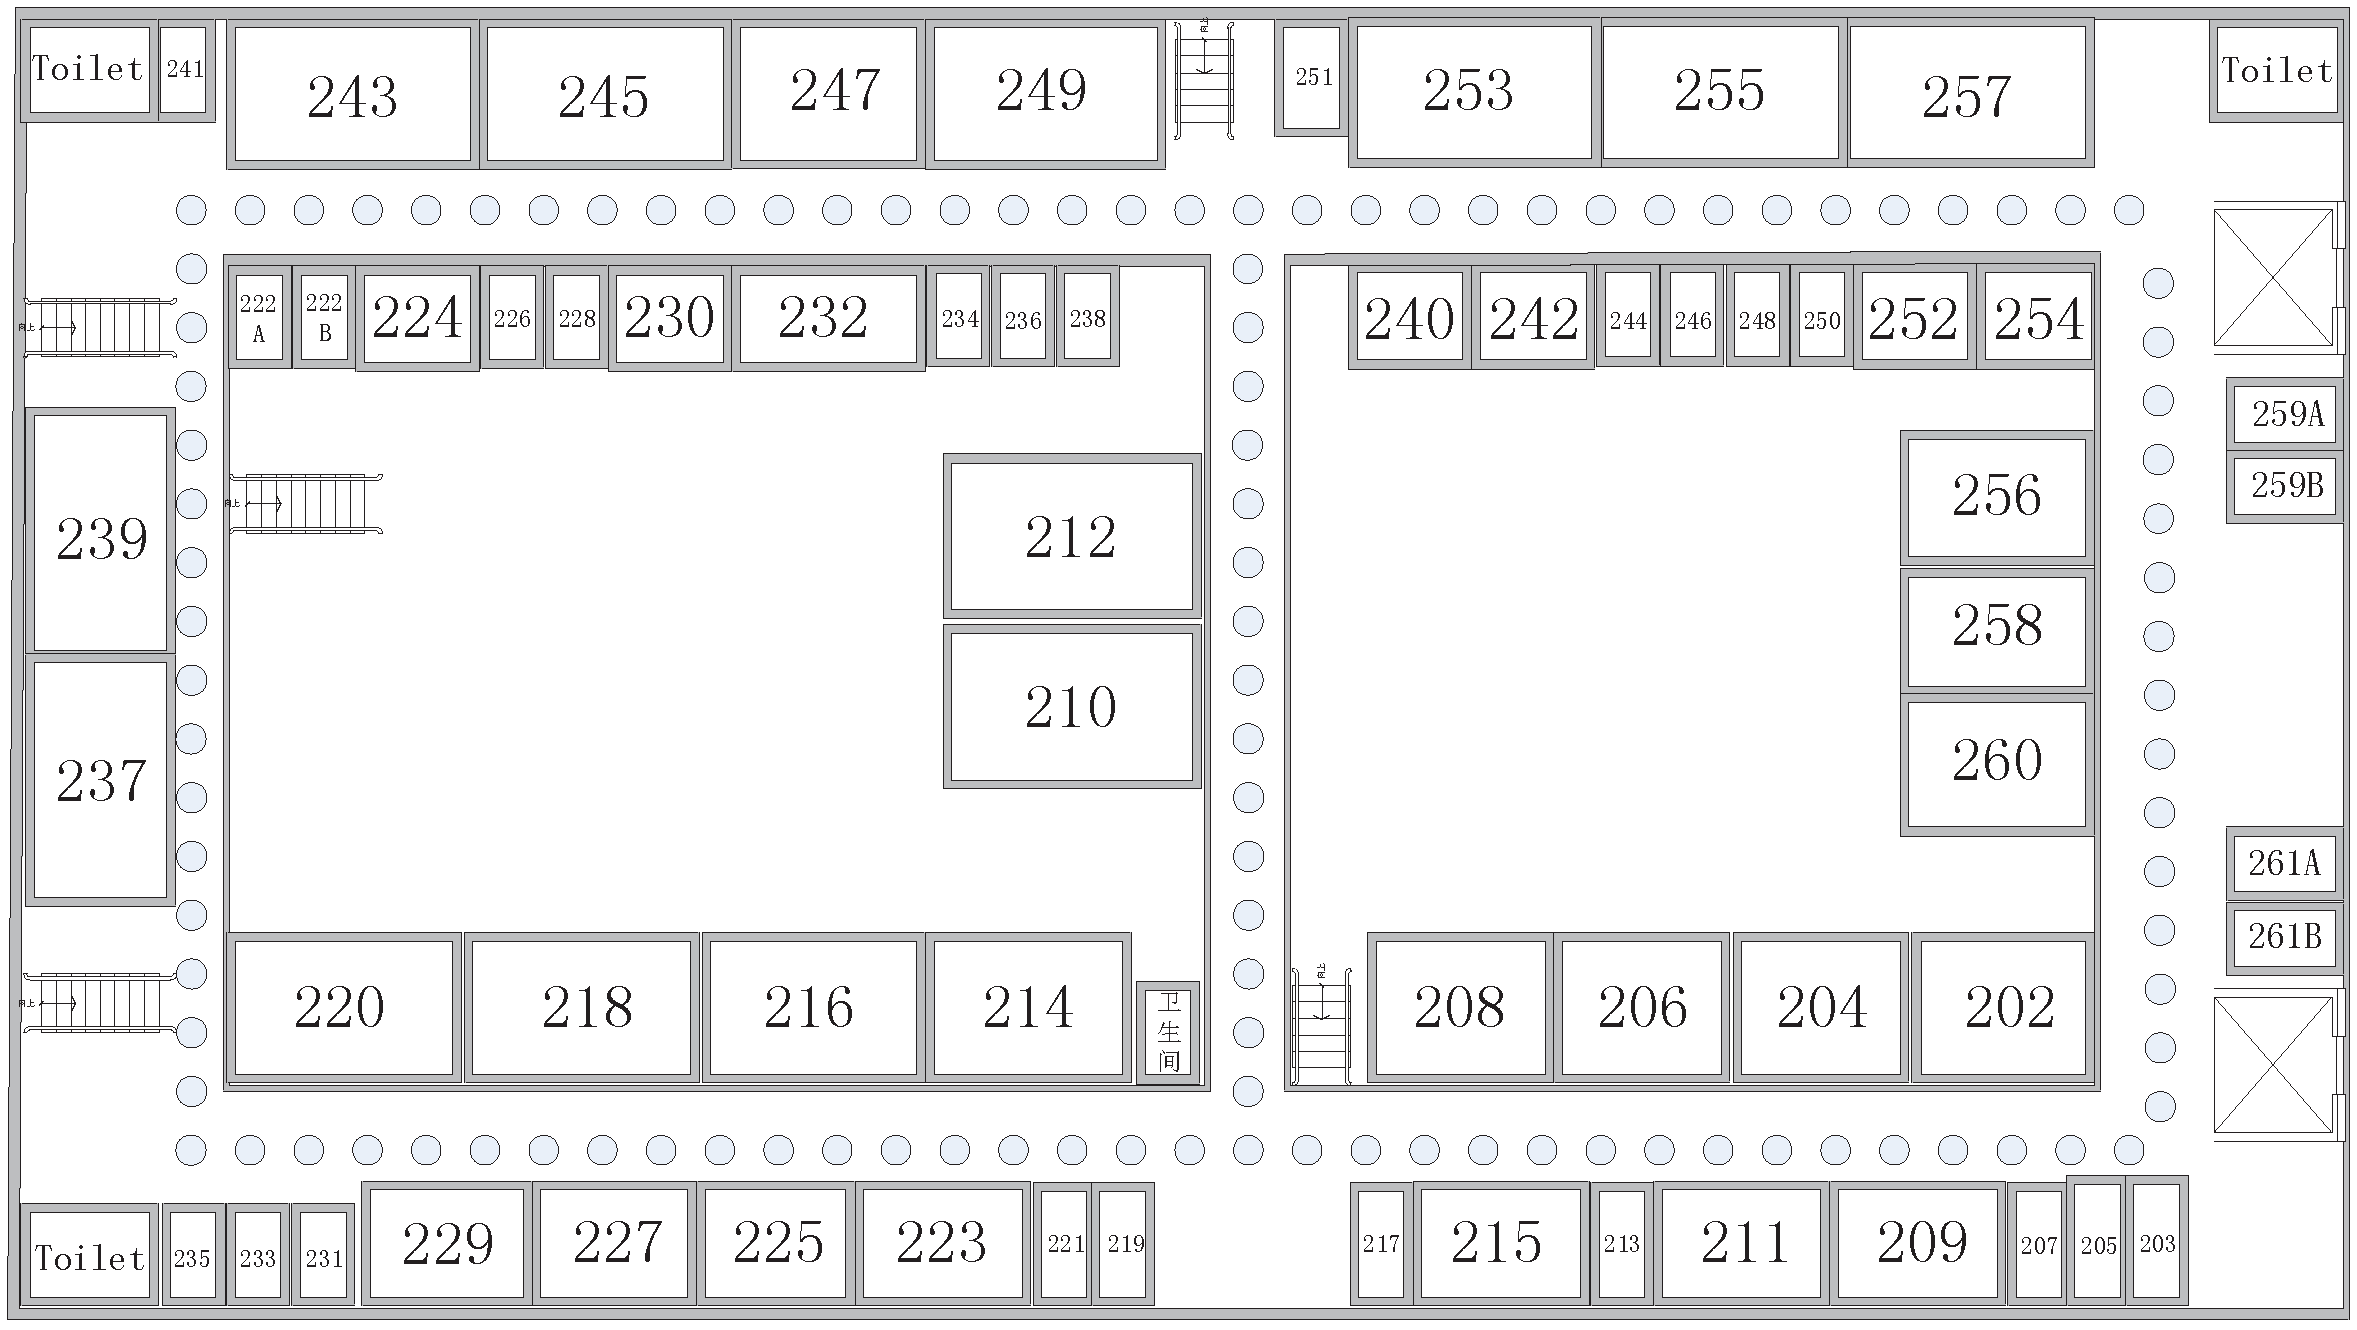
3.1. Experiment Setup
3.2. Fingerprint Collection
3.3. Stable AP Selection
3.4. KPCA Algorithm
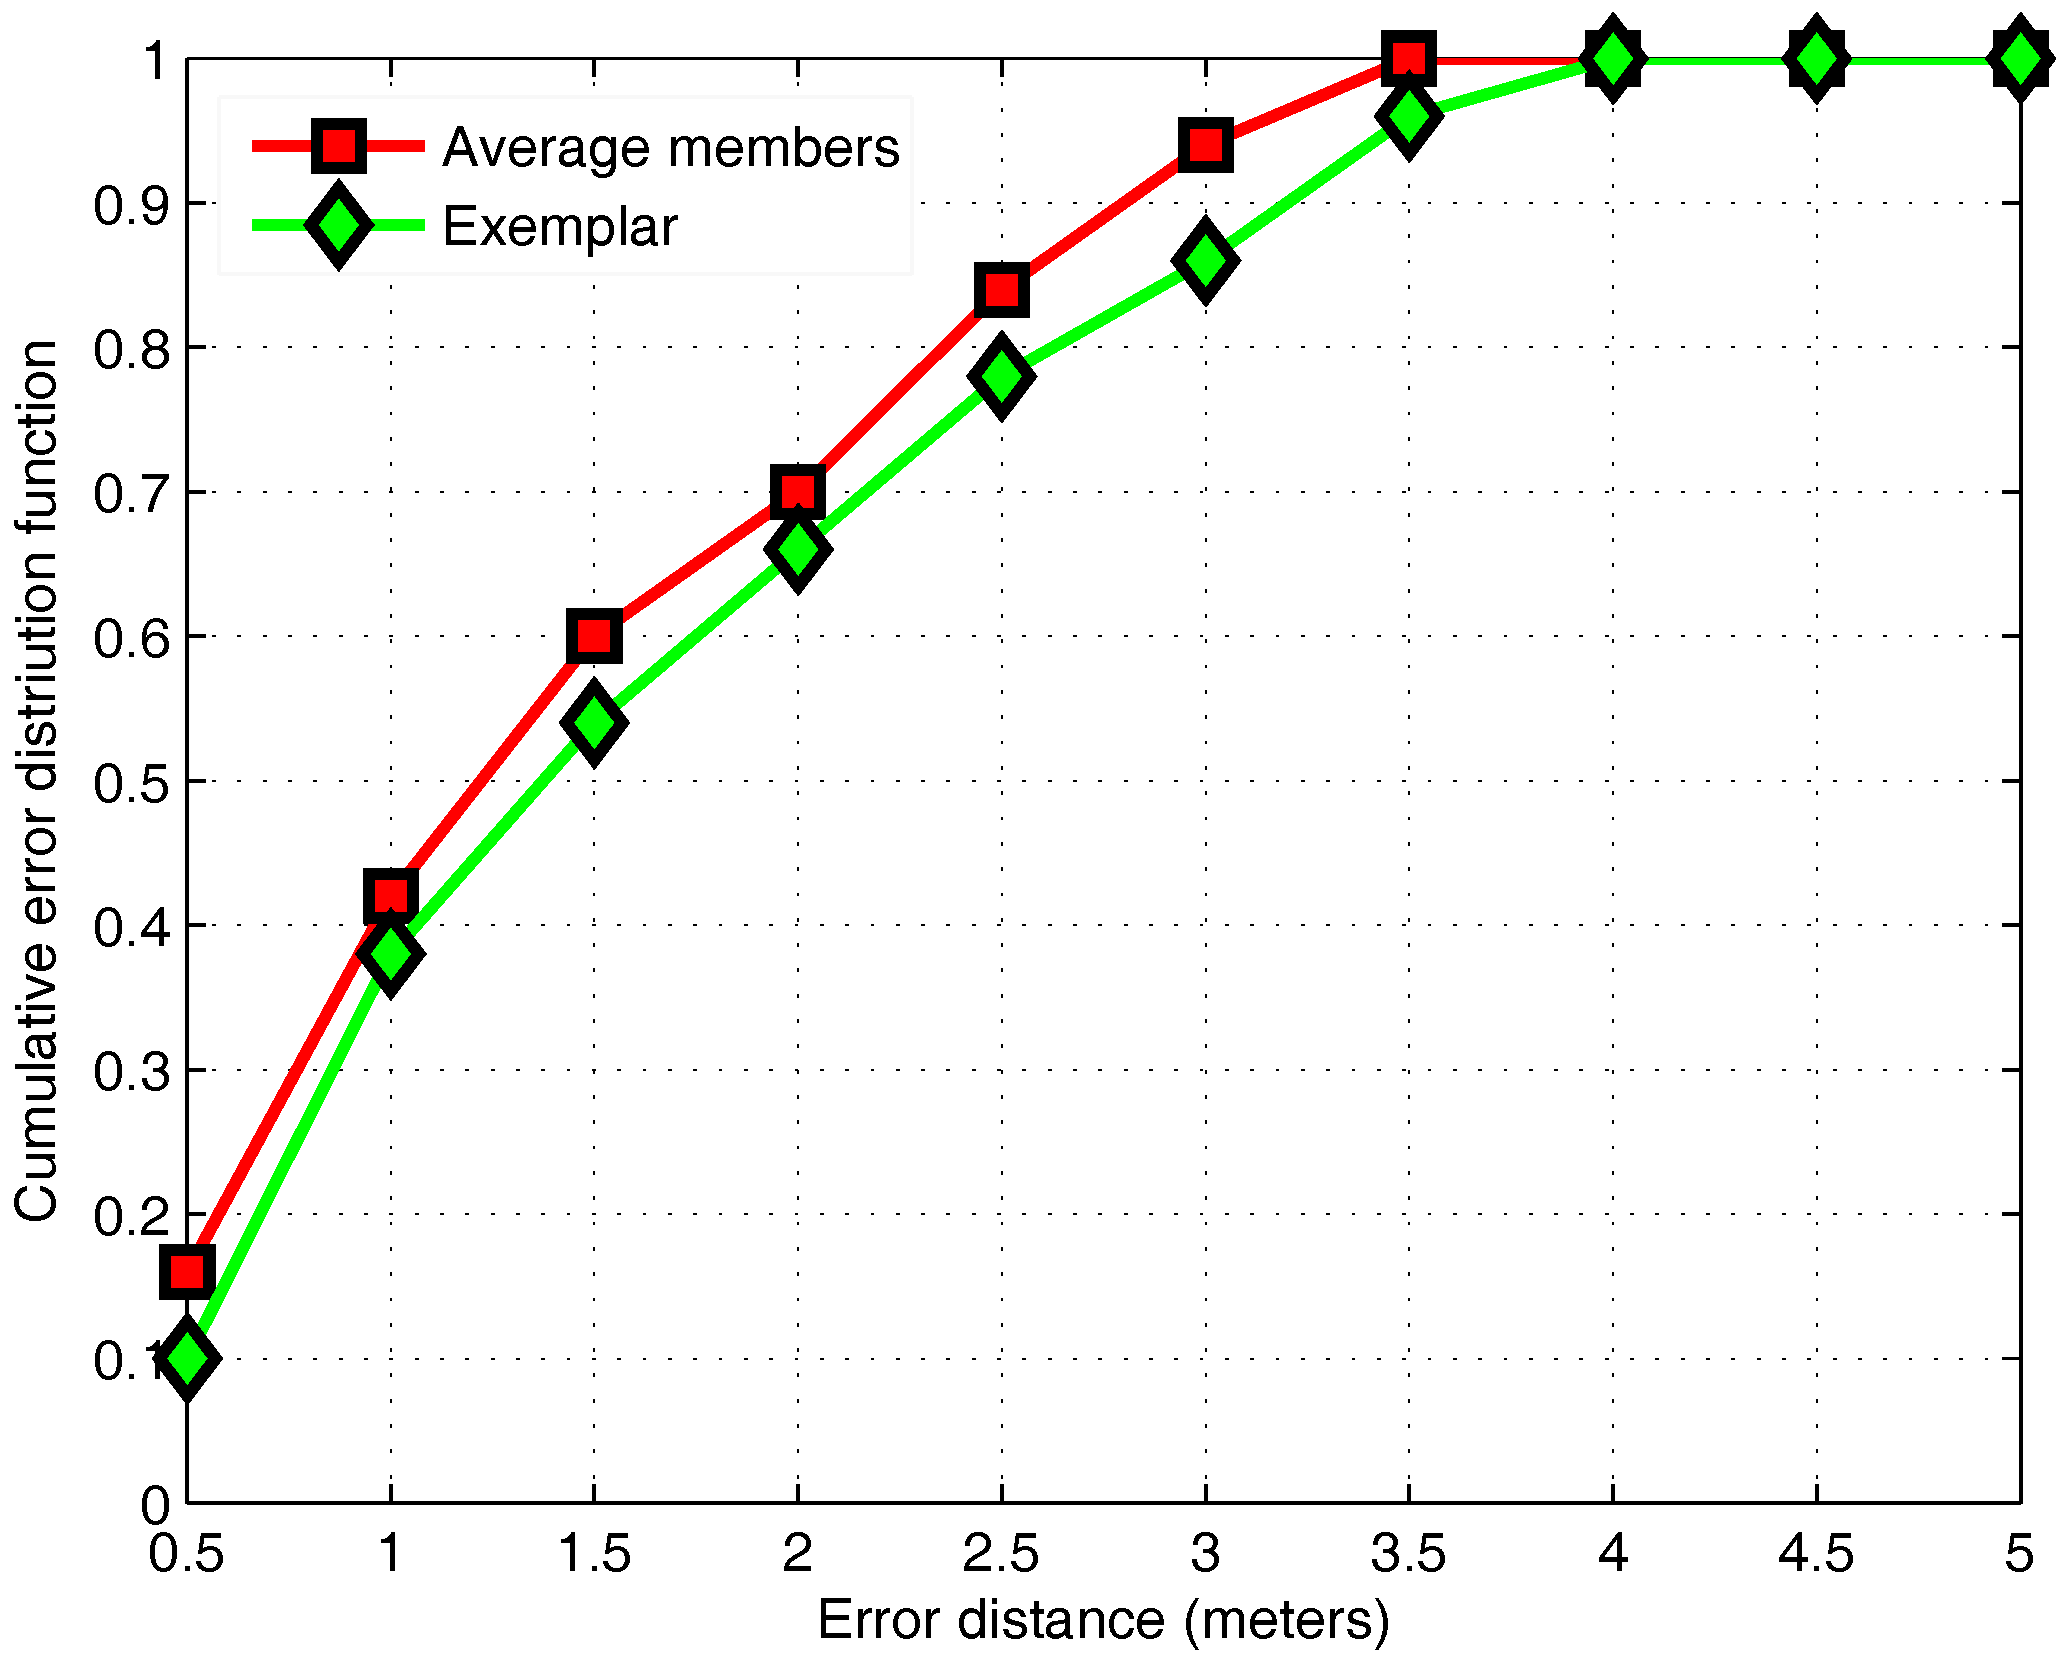
3.5. APC Algorithm
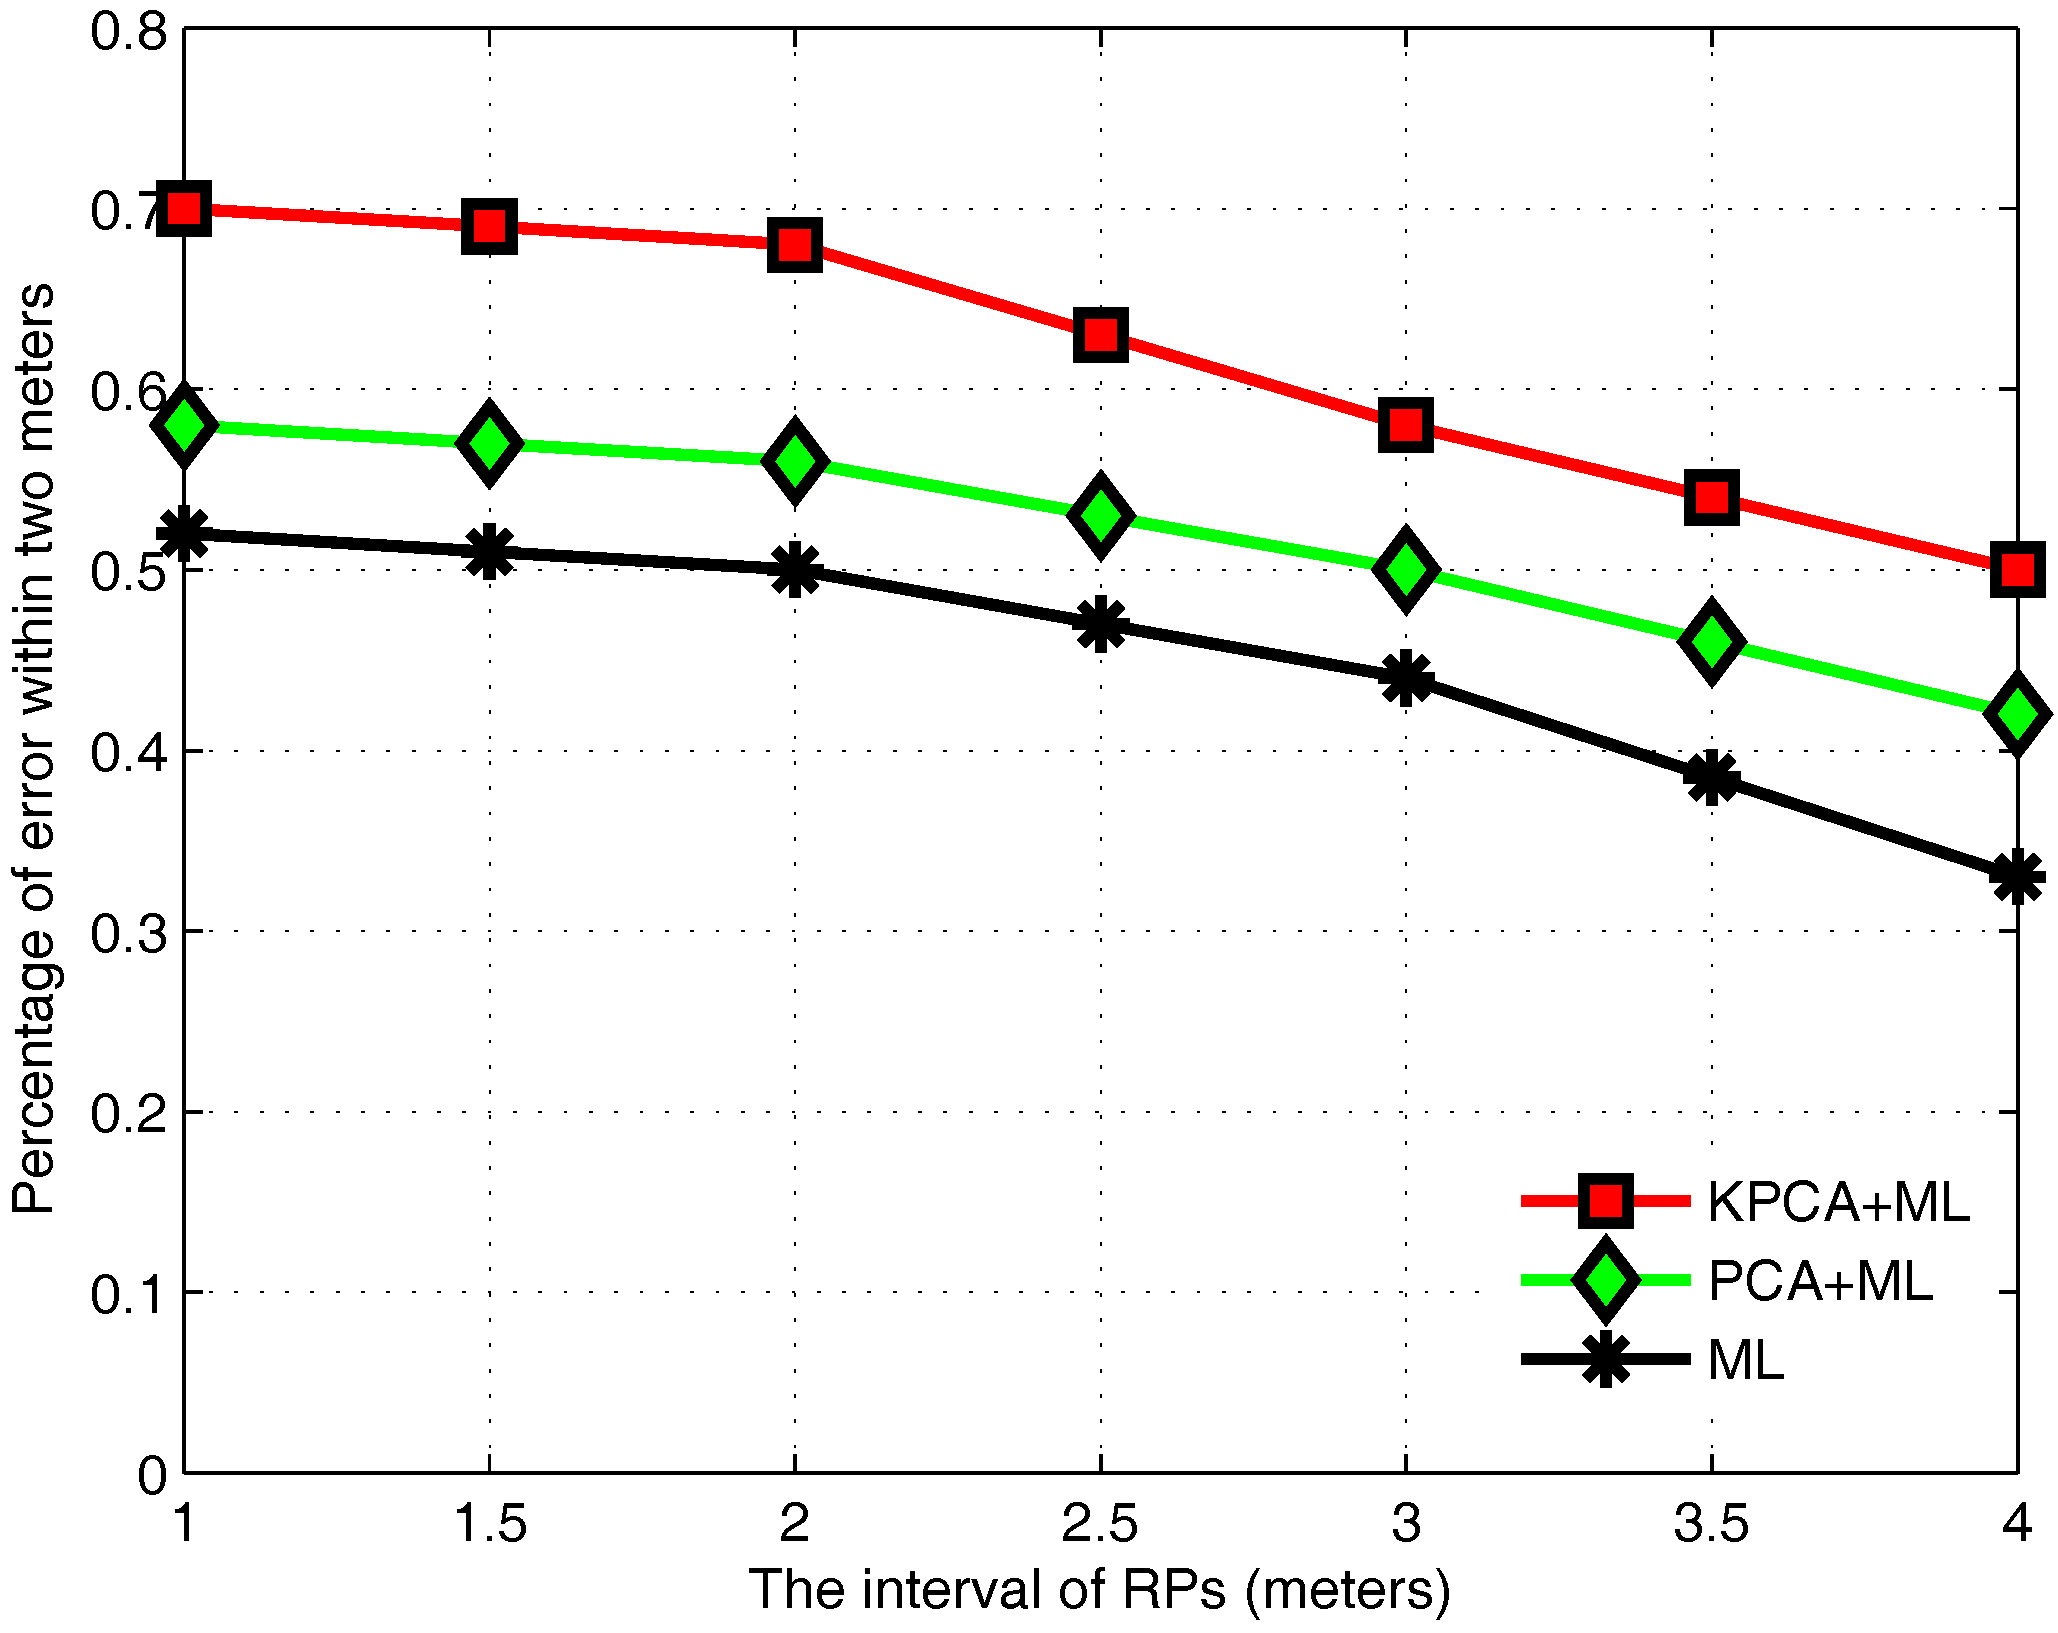
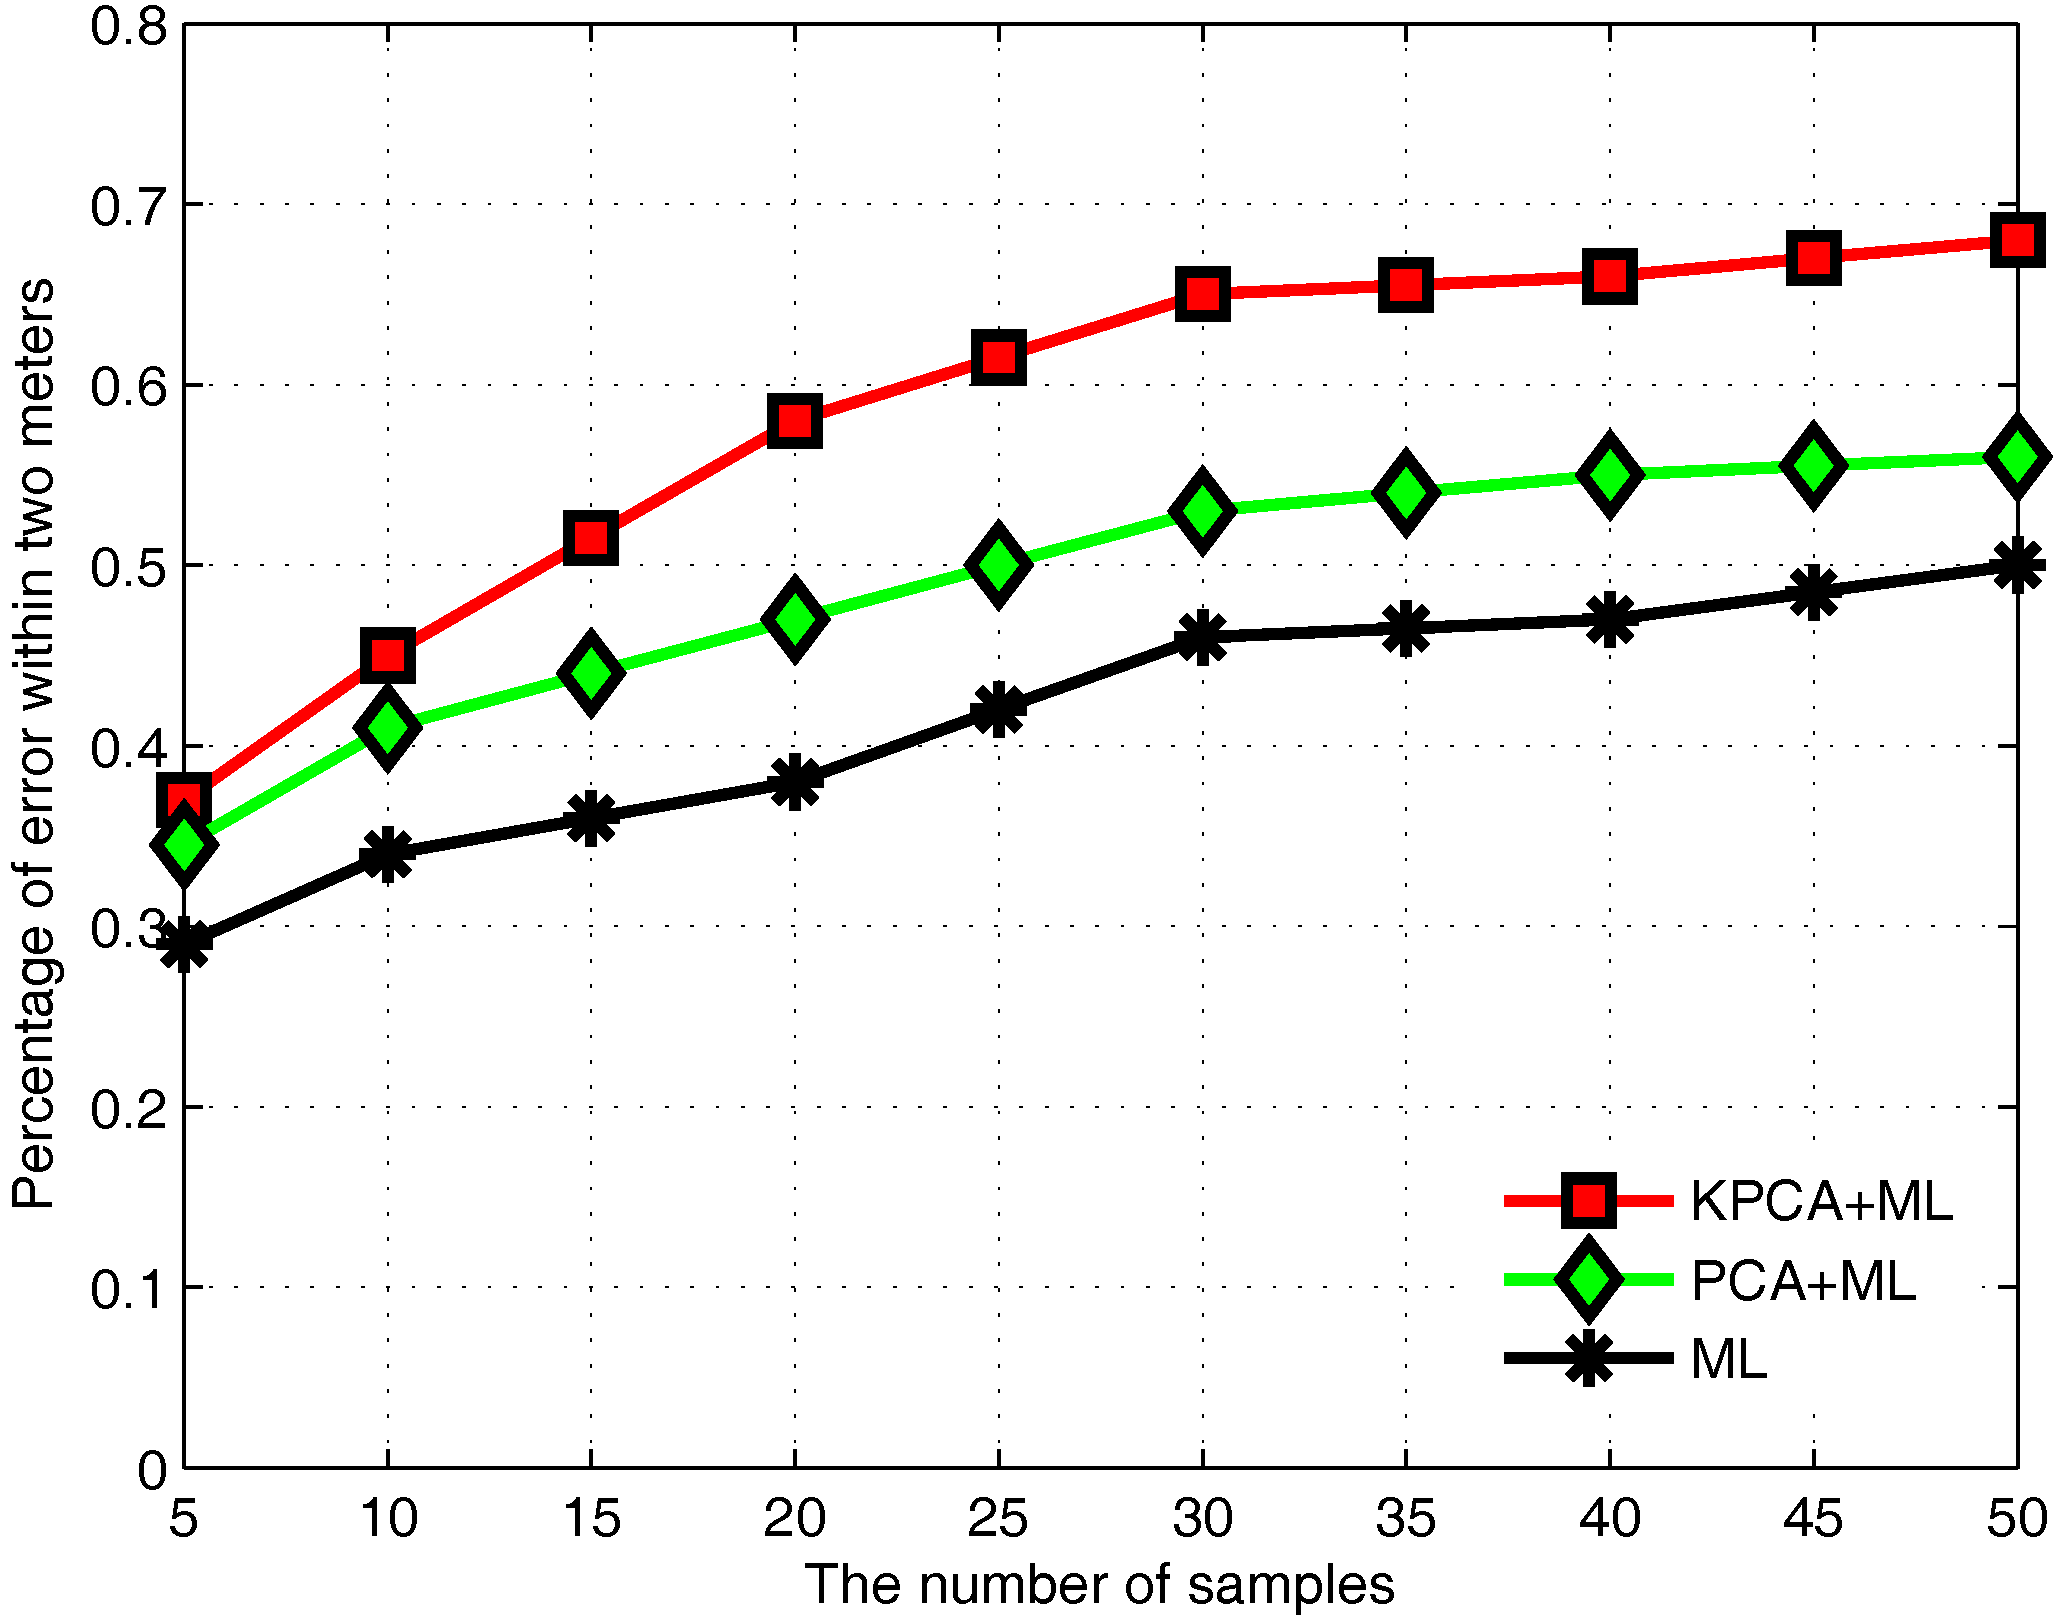
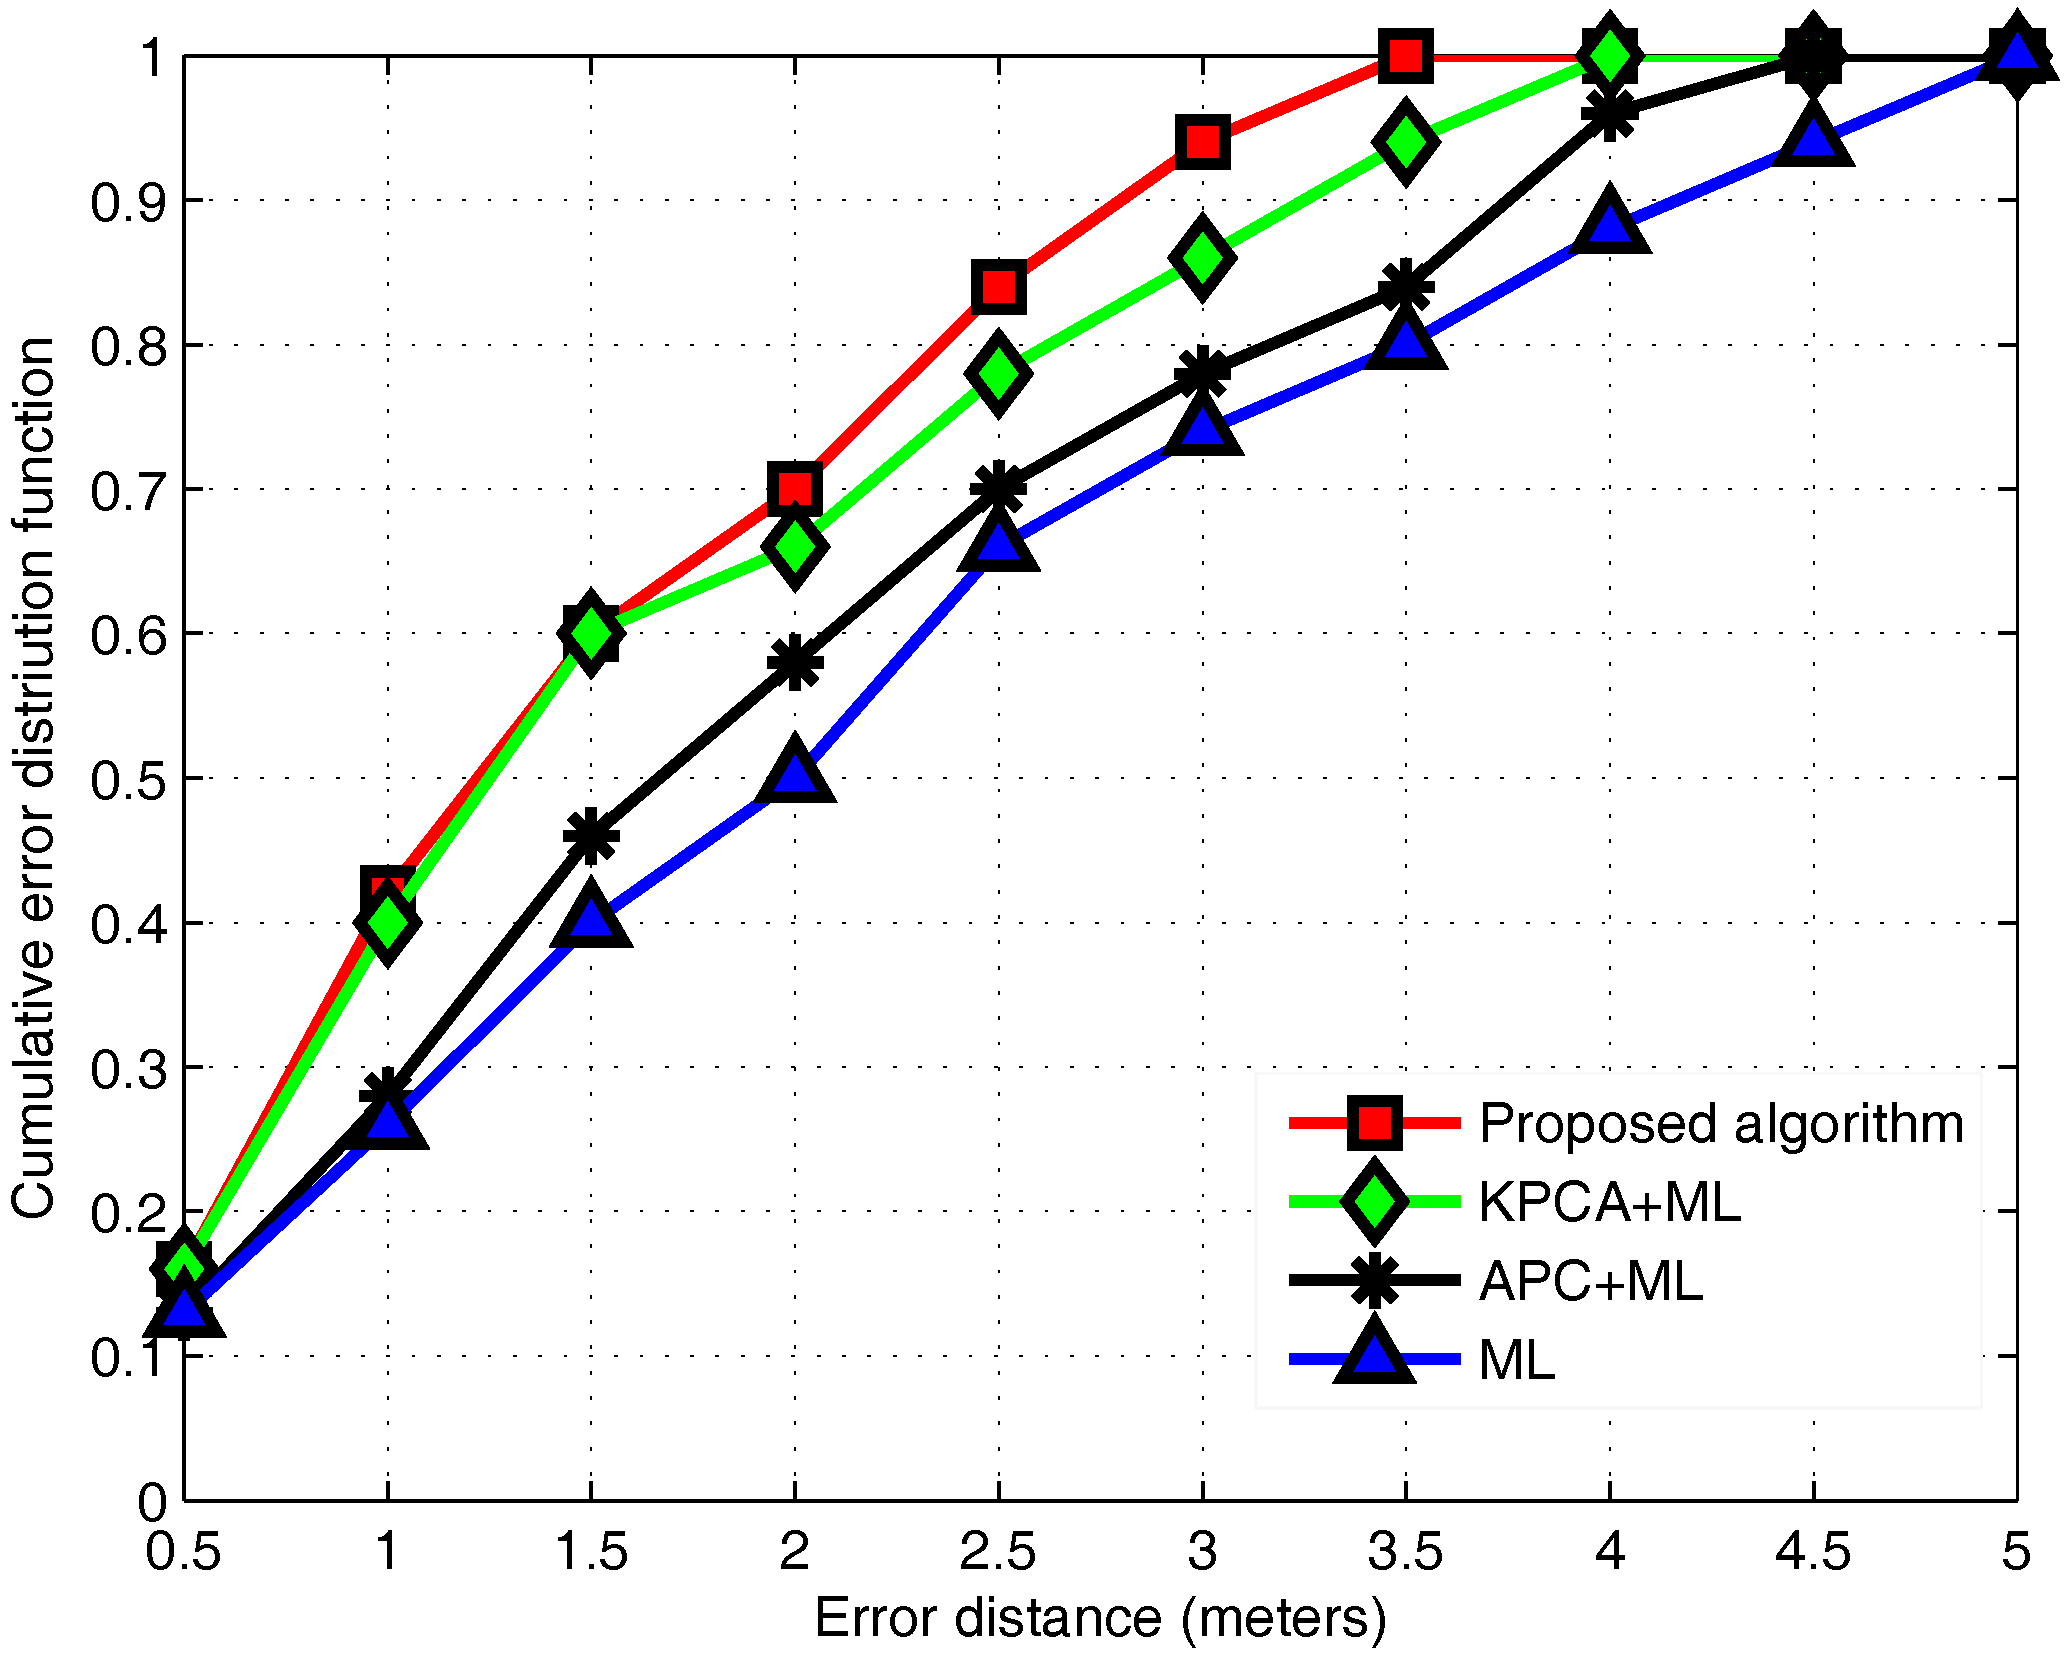
3.6. Performance Evaluation
4. Conclusions
Acknowledgments
Author Contributions
Conflicts of Interest
Abbreviations
| RSS | Received Signal Strength |
| APs | Access Points |
| RPs | Reference Points |
| KPCA | Kernel Principal Component Analysis |
| APC | Affine Propagation Clustering |
| ML | Maximum Likelihood |
| LBSs | Location-Based Services |
| 5G | the Fifth Generation Mobile Communication System |
| WLAN | Wireless Local Area Network |
| GPS | Global Position System |
| IR | Infrared |
| US | Ultrasound |
| RFID | Radio Frequency Identification |
| TOA | Time-Of-Arrival |
| AOA | Angle-Of-Arrival |
| KNN | K-Nearest-Neighbor |
| WKNN | Weighted K-Nearest Neighbor |
| PCA | Principal Component Analysis |
| CDF | Cumulative Distribution Function |
References
- Khalajmehrabadi, A.; Gatsis, N.; Akopian, D. Modern WLAN Fingerprinting Indoor Positioning Methods and Deployment Challenges. IEEE Commun. Surv. Tutor. 2017. [Google Scholar] [CrossRef]
- He, S.; Chan, S.H.G. Wi-Fi Fingerprint-Based Indoor Positioning: Recent Advances and Comparisons. IEEE Commun. Surv. Tutor. 2015, 18, 466–490. [Google Scholar] [CrossRef]
- Hwang, S.; Yu, D. GPS localization improvement of smartphones using built-in sensors. Int. J. Smart Home 2012, 6, 1–8. [Google Scholar]
- Paek, J.; Kim, J.; Govindan, R. Energy-efficient rate-adaptive GPS-based positioning for smartphones. In Proceedings of the 8th International Conference on Mobile Systems, Applications, and Services, San Francisco, CA, USA, 15–18 June 2010; pp. 299–314. [Google Scholar]
- Hauschildt, D.; Kirchhof, N. Advances in thermal infrared localization: Challenges and solutions. In Proceedings of the International Conference on Indoor Positioning and Indoor Navigation, Zr̎ich, Switzerland, 15–17 September 2010; pp. 1–8. [Google Scholar]
- Guerrero, L.A.; Vasquez, F.; Ochoa, S.F. An indoor navigation system for the visually impaired. Sensors 2012, 12, 8236–8258. [Google Scholar] [CrossRef] [PubMed]
- Medina, C.; Segura, J.C.; Angel, D.L.T. Ultrasound Indoor Positioning System Based on a Low-Power Wireless Sensor Network Providing Sub-Centimeter Accuracy. Sensors 2013, 13, 3501–3526. [Google Scholar] [CrossRef] [PubMed]
- Woodman, O.J.; Harle, R.K. Concurrent scheduling in the Active Bat location system. In Proceedings of the IEEE International Conference on Pervasive Computing and Communications Workshops, Mannheim, Germany, 29 March–2 April 2010; pp. 431–437. [Google Scholar]
- Saab, S.S.; Nakad, Z.S. A Standalone RFID Indoor Positioning System Using Passive Tags. IEEE Trans. Ind. Electron. 2011, 58, 1961–1970. [Google Scholar] [CrossRef]
- Liu, T.; Yang, L.; Lin, Q.; Guo, Y.; Liu, Y. Anchor-free backscatter positioning for RFID tags with high accuracy. In Proceedings of the IEEE Conference on Computer Communications, Toronto, ON, Canada, 27 April–2 May 2014; pp. 379–387. [Google Scholar]
- Koweerawong, C.; Wipusitwarakun, K.; Kaemarungsi, K. Indoor localization improvement via adaptive RSS fingerprinting database. In Proceedings of the International Conference on Information Networking, Bangkok, Thailand, 28–30 January 2013; pp. 412–416. [Google Scholar]
- Liu, X.C.; Zhang, S.; Zhao, Q.Y.; Lin, X.K. A real-time algorithm for fingerprint localization based on clustering and spatial diversity. In Proceedings of the International Congress on Ultra Modern Telecommunications and Control Systems and Workshops, Moscow, Russia, 18–20 October 2010; pp. 74–81. [Google Scholar]
- Du, Y.; Yang, D.; Xiu, C. A Novel Method for Constructing a WIFI Positioning System with Efficient Manpower. Sensors 2015, 15, 8358–8381. [Google Scholar] [CrossRef] [PubMed]
- Güvenc, I.; Chong, C.C. A Survey on TOA Based Wireless Localization and NLOS Mitigation Techniques. Commun. Surv. Tutor. IEEE 2009, 11, 107–124. [Google Scholar] [CrossRef]
- Tomic, S.; Beko, M.; Rui, D. Distributed RSS-AoA Based Localization with Unknown Transmit Powers. IEEE Wirel. Commun. Lett. 2016, 5, 392–395. [Google Scholar] [CrossRef]
- Fang, Y.; Deng, Z.; Xue, C.; Jiao, J.; Zeng, H.; Zheng, R.; Lu, S. Application of an improved K nearest neighbor algorithm in WiFi indoor positioning. In Proceedings of the China Satellite Navigation Conference (CSNC), Berlin, Heidelberg, 2 April 2015; pp. 517–524. [Google Scholar]
- Shin, B.; Lee, J.H.; Lee, T.; Seok Kim, H. Enhanced weighted K-nearest neighbor algorithm for indoor Wi-Fi positioning systems. In Proceedings of the International Conference on Computing Technology and Information Management, Seoul, Korea, 24–26 April 2012; pp. 574–577. [Google Scholar]
- Roos, T.; Myllymäki, P.; Tirri, H.; Misikangas, P.; Sievänen, J. A Probabilistic Approach to WLAN User Location Estimation. Int. J. Wirel. Inf. Netw. 2002, 9, 155–164. [Google Scholar] [CrossRef]
- Ren, W.; Xu, L.; Zou, D.; Deng, Z. Positioning algorithm using maximum likelihood estimation of RSSI difference in wireless sensor networks. J. Data Acquis. Proc. 2009, 24, 757–761. [Google Scholar]
- Deng, Z.A.; Xu, Y.B.; Ma, L. Joint access point selection and local discriminant embedding for energy efficient and accurate Wi-Fi positioning. KSII Trans. Int. Inf. Syst. (TIIS) 2012, 6, 794–814. [Google Scholar]
- Feng, C.; Au, W.S.A.; Valaee, S.; Tan, Z. Received-Signal-Strength-Based Indoor Positioning Using Compressive Sensing. IEEE Trans. Mob. Comput. 2012, 1112, 1983–1993. [Google Scholar] [CrossRef]
- Au, A.W.S.; Feng, C.; Valaee, S.; Reyes, S.; Sorour, S.; Markowitz, S.N.; Gold, D.; Gordon, K.; Eizenman, M. Indoor Tracking and Navigation Using Received Signal Strength and Compressive Sensing on a Mobile Device. IEEE Trans. Mob. Comput. 2013, 1210, 2050–2062. [Google Scholar] [CrossRef]
- Kaemarungsi, K.; Krishnamurthy, P. Analysis of WLAN’s received signal strength indication for indoor location fingerprinting. Pervasive Mob. Comput. 2012, 8, 292–316. [Google Scholar] [CrossRef]
- Fang, S.H.; Lin, T. Principal Component Localization in Indoor WLAN Environments. IEEE Trans. Mob. Comput. 2012, 11, 100–110. [Google Scholar] [CrossRef]
- Keerthi, S.S.; Lin, C.J. Asymptotic behaviors of support vector machines with gaussian kernel. Neural Comput. 2003, 15, 1667–1689. [Google Scholar] [CrossRef] [PubMed]
- Kushki, A.; Plataniotis, K.N.; Venetsanopoulos, A.N. Kernel-Based Positioning in Wireless Local Area Networks. IEEE Trans. Mob. Comput. 2007, 6, 689–705. [Google Scholar] [CrossRef]
- Youssef, M.A.; Agrawala, A.; Shankar, A.U. WLAN Location Determination via Clustering and Probability Distributions. In Proceedings of the IEEE International Conference on Pervasive Computing and Communications, Washington, DC, USA, 23–26 March 2013; pp. 143–150. [Google Scholar]


| kernel Parameter | = 0.2 | = 0.4 | = 0.6 | = 0.8 | = 1 |
|---|---|---|---|---|---|
| the mean of errors | 2.36 | 1.94 | 1.76 | 2.03 | 2.15 |
© 2017 by the authors. Licensee MDPI, Basel, Switzerland. This article is an open access article distributed under the terms and conditions of the Creative Commons Attribution (CC BY) license (http://creativecommons.org/licenses/by/4.0/).
Share and Cite
Luo, J.; Fu, L. A Smartphone Indoor Localization Algorithm Based on WLAN Location Fingerprinting with Feature Extraction and Clustering. Sensors 2017, 17, 1339. https://doi.org/10.3390/s17061339
Luo J, Fu L. A Smartphone Indoor Localization Algorithm Based on WLAN Location Fingerprinting with Feature Extraction and Clustering. Sensors. 2017; 17(6):1339. https://doi.org/10.3390/s17061339
Chicago/Turabian StyleLuo, Junhai, and Liang Fu. 2017. "A Smartphone Indoor Localization Algorithm Based on WLAN Location Fingerprinting with Feature Extraction and Clustering" Sensors 17, no. 6: 1339. https://doi.org/10.3390/s17061339
APA StyleLuo, J., & Fu, L. (2017). A Smartphone Indoor Localization Algorithm Based on WLAN Location Fingerprinting with Feature Extraction and Clustering. Sensors, 17(6), 1339. https://doi.org/10.3390/s17061339