
A Doppler Radar System for Sensing Physiological Parameters in Walking and Standing Positions


Abstract
:1. Introduction
2. Method
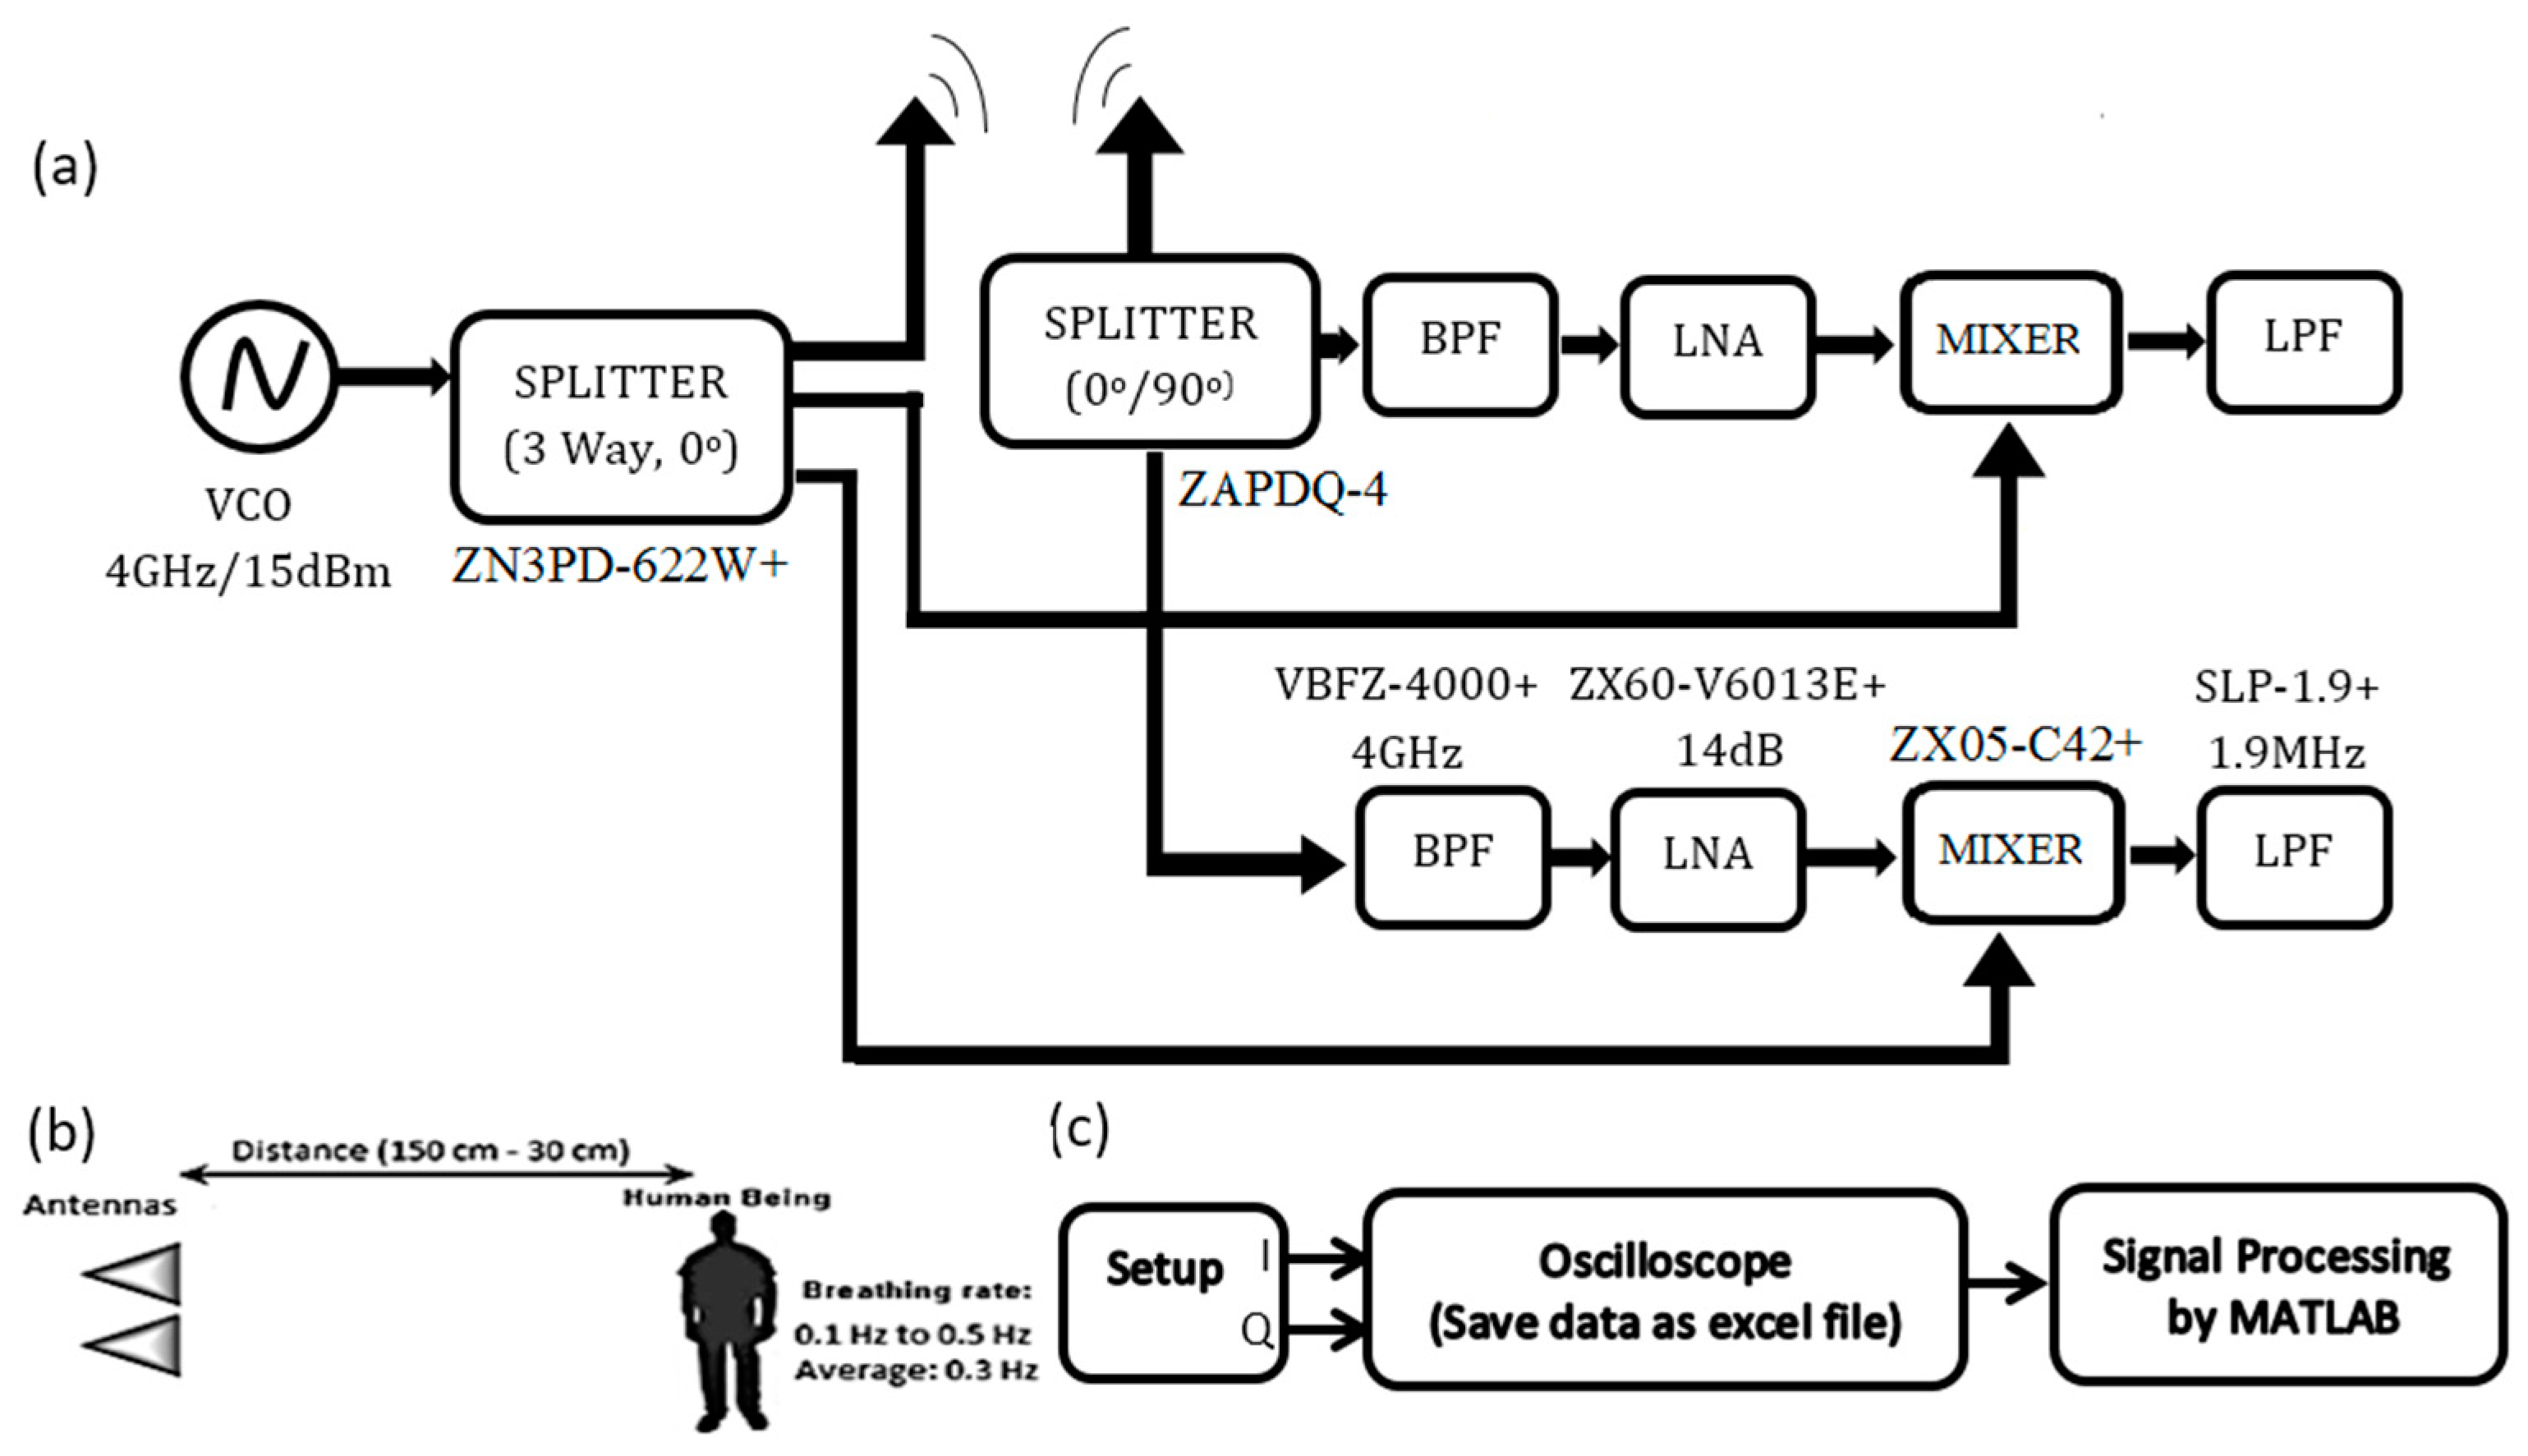
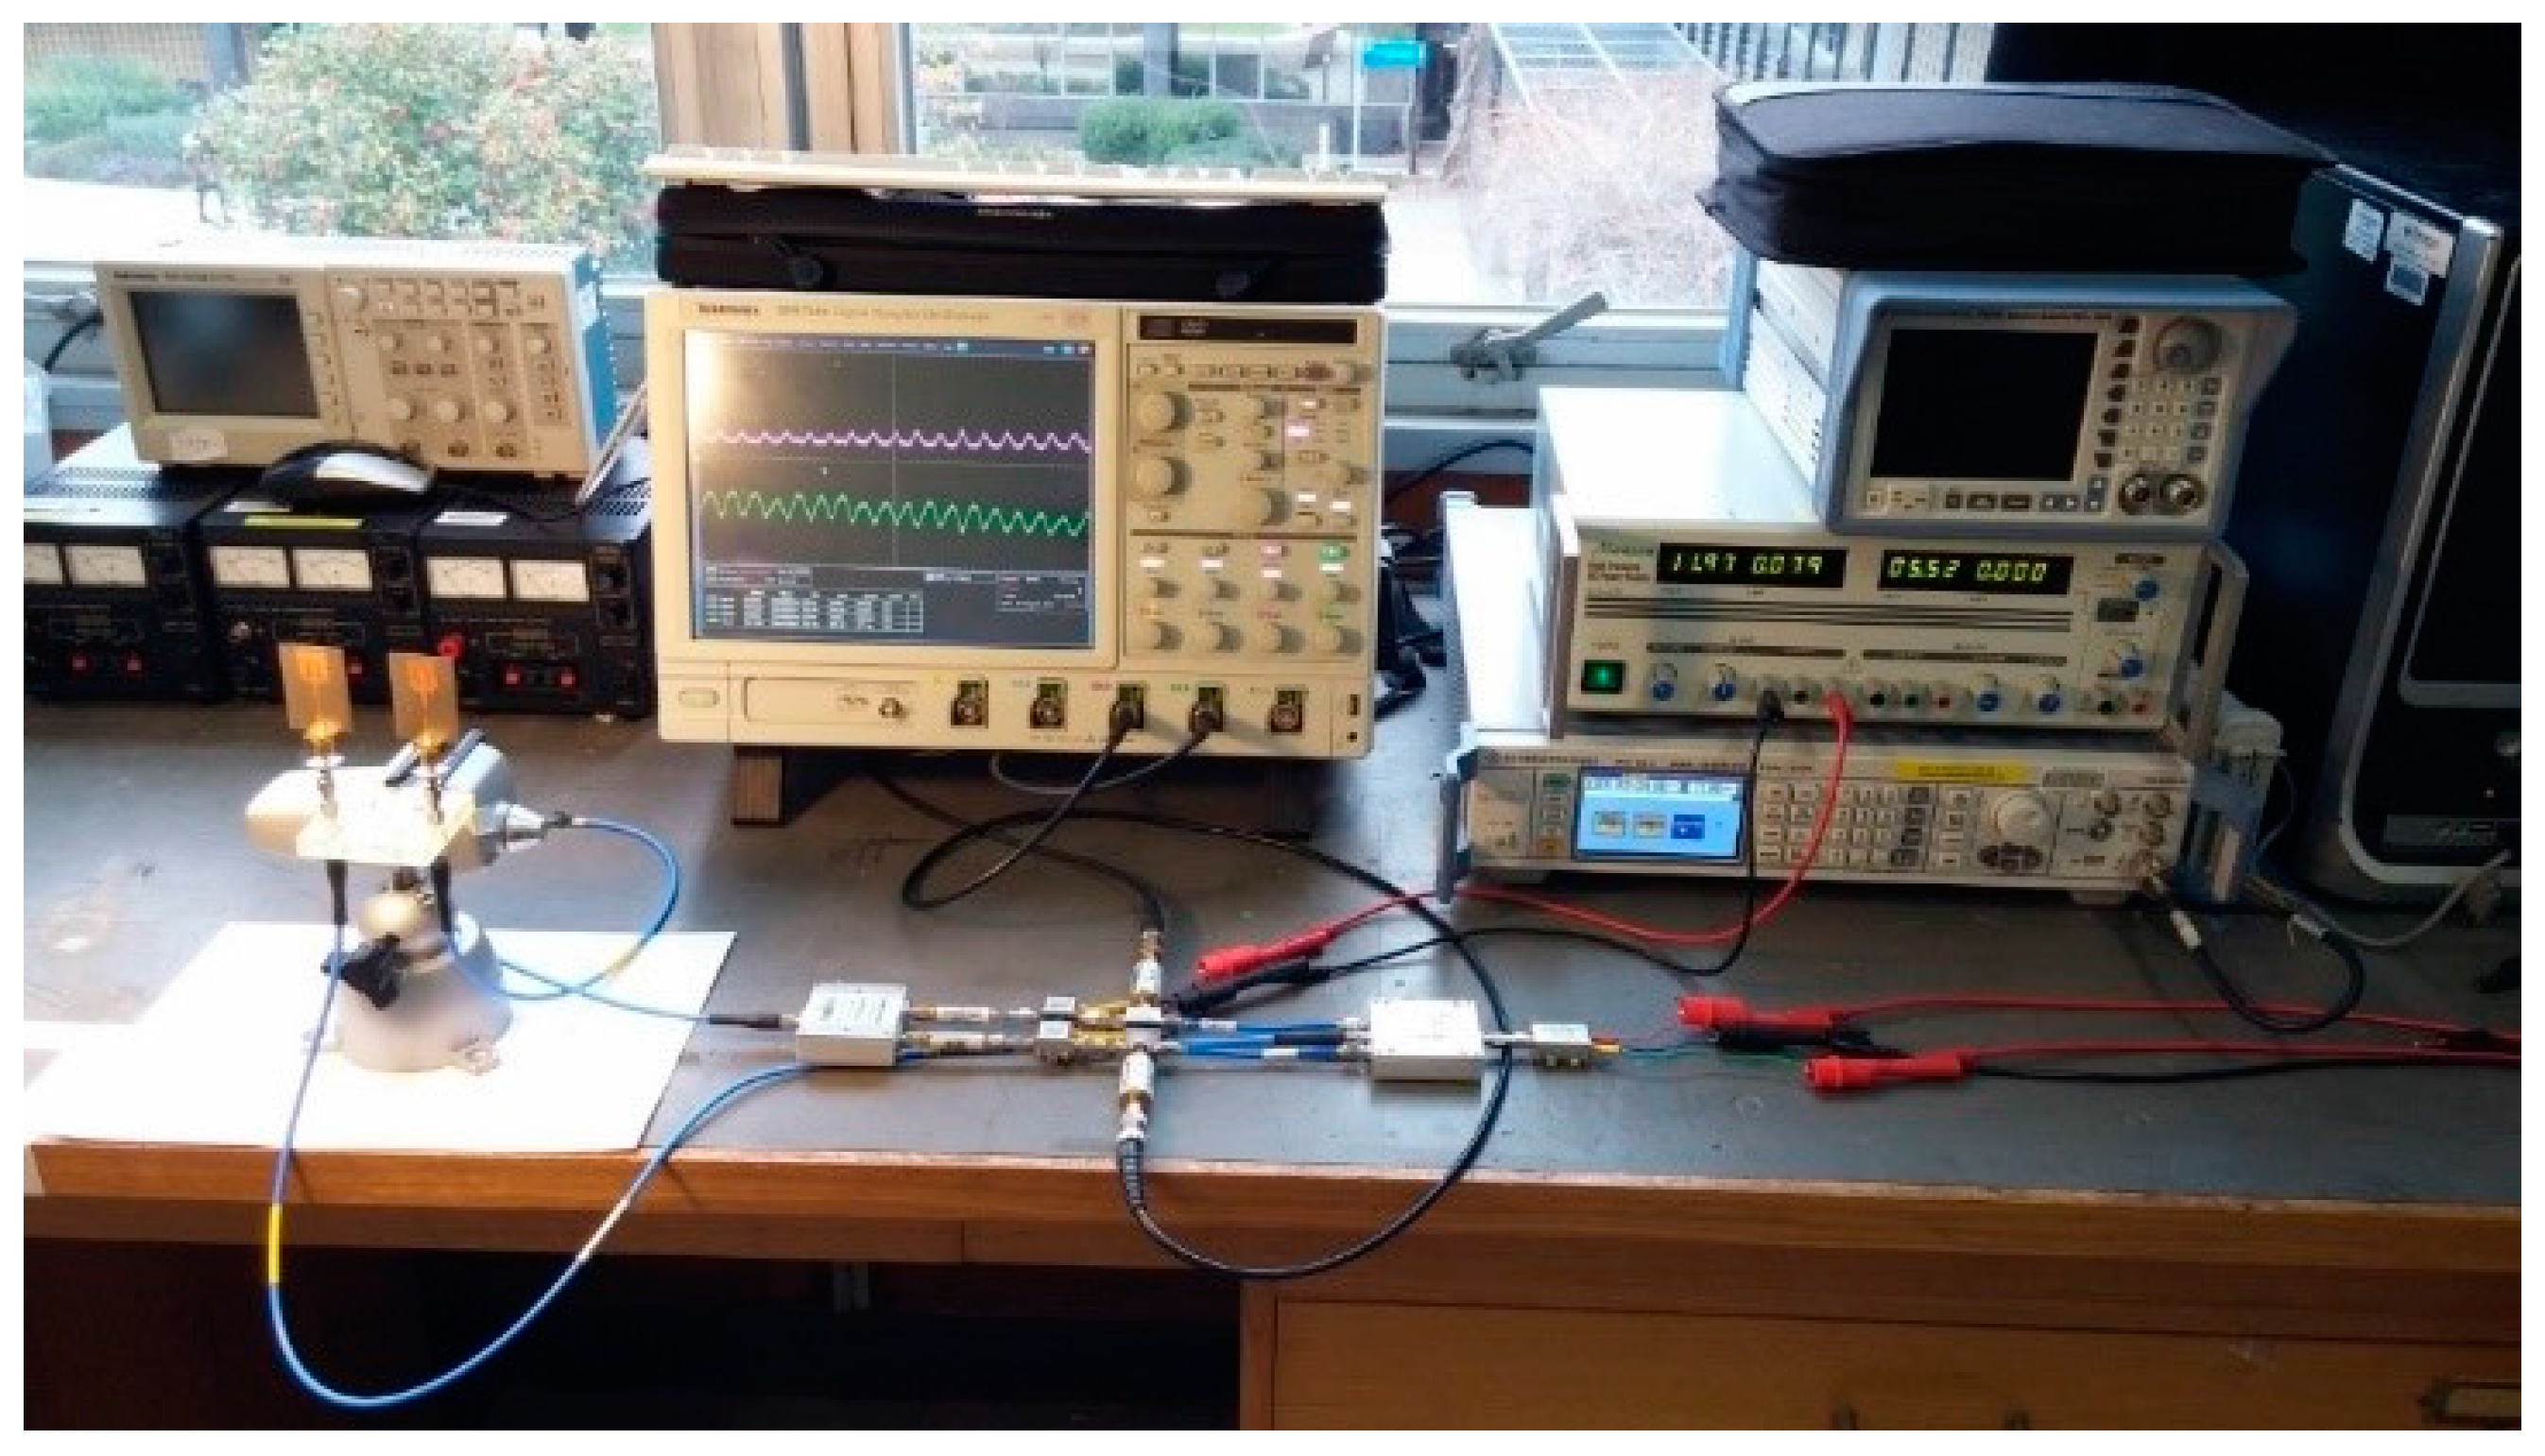
2.1. Experiment Setup
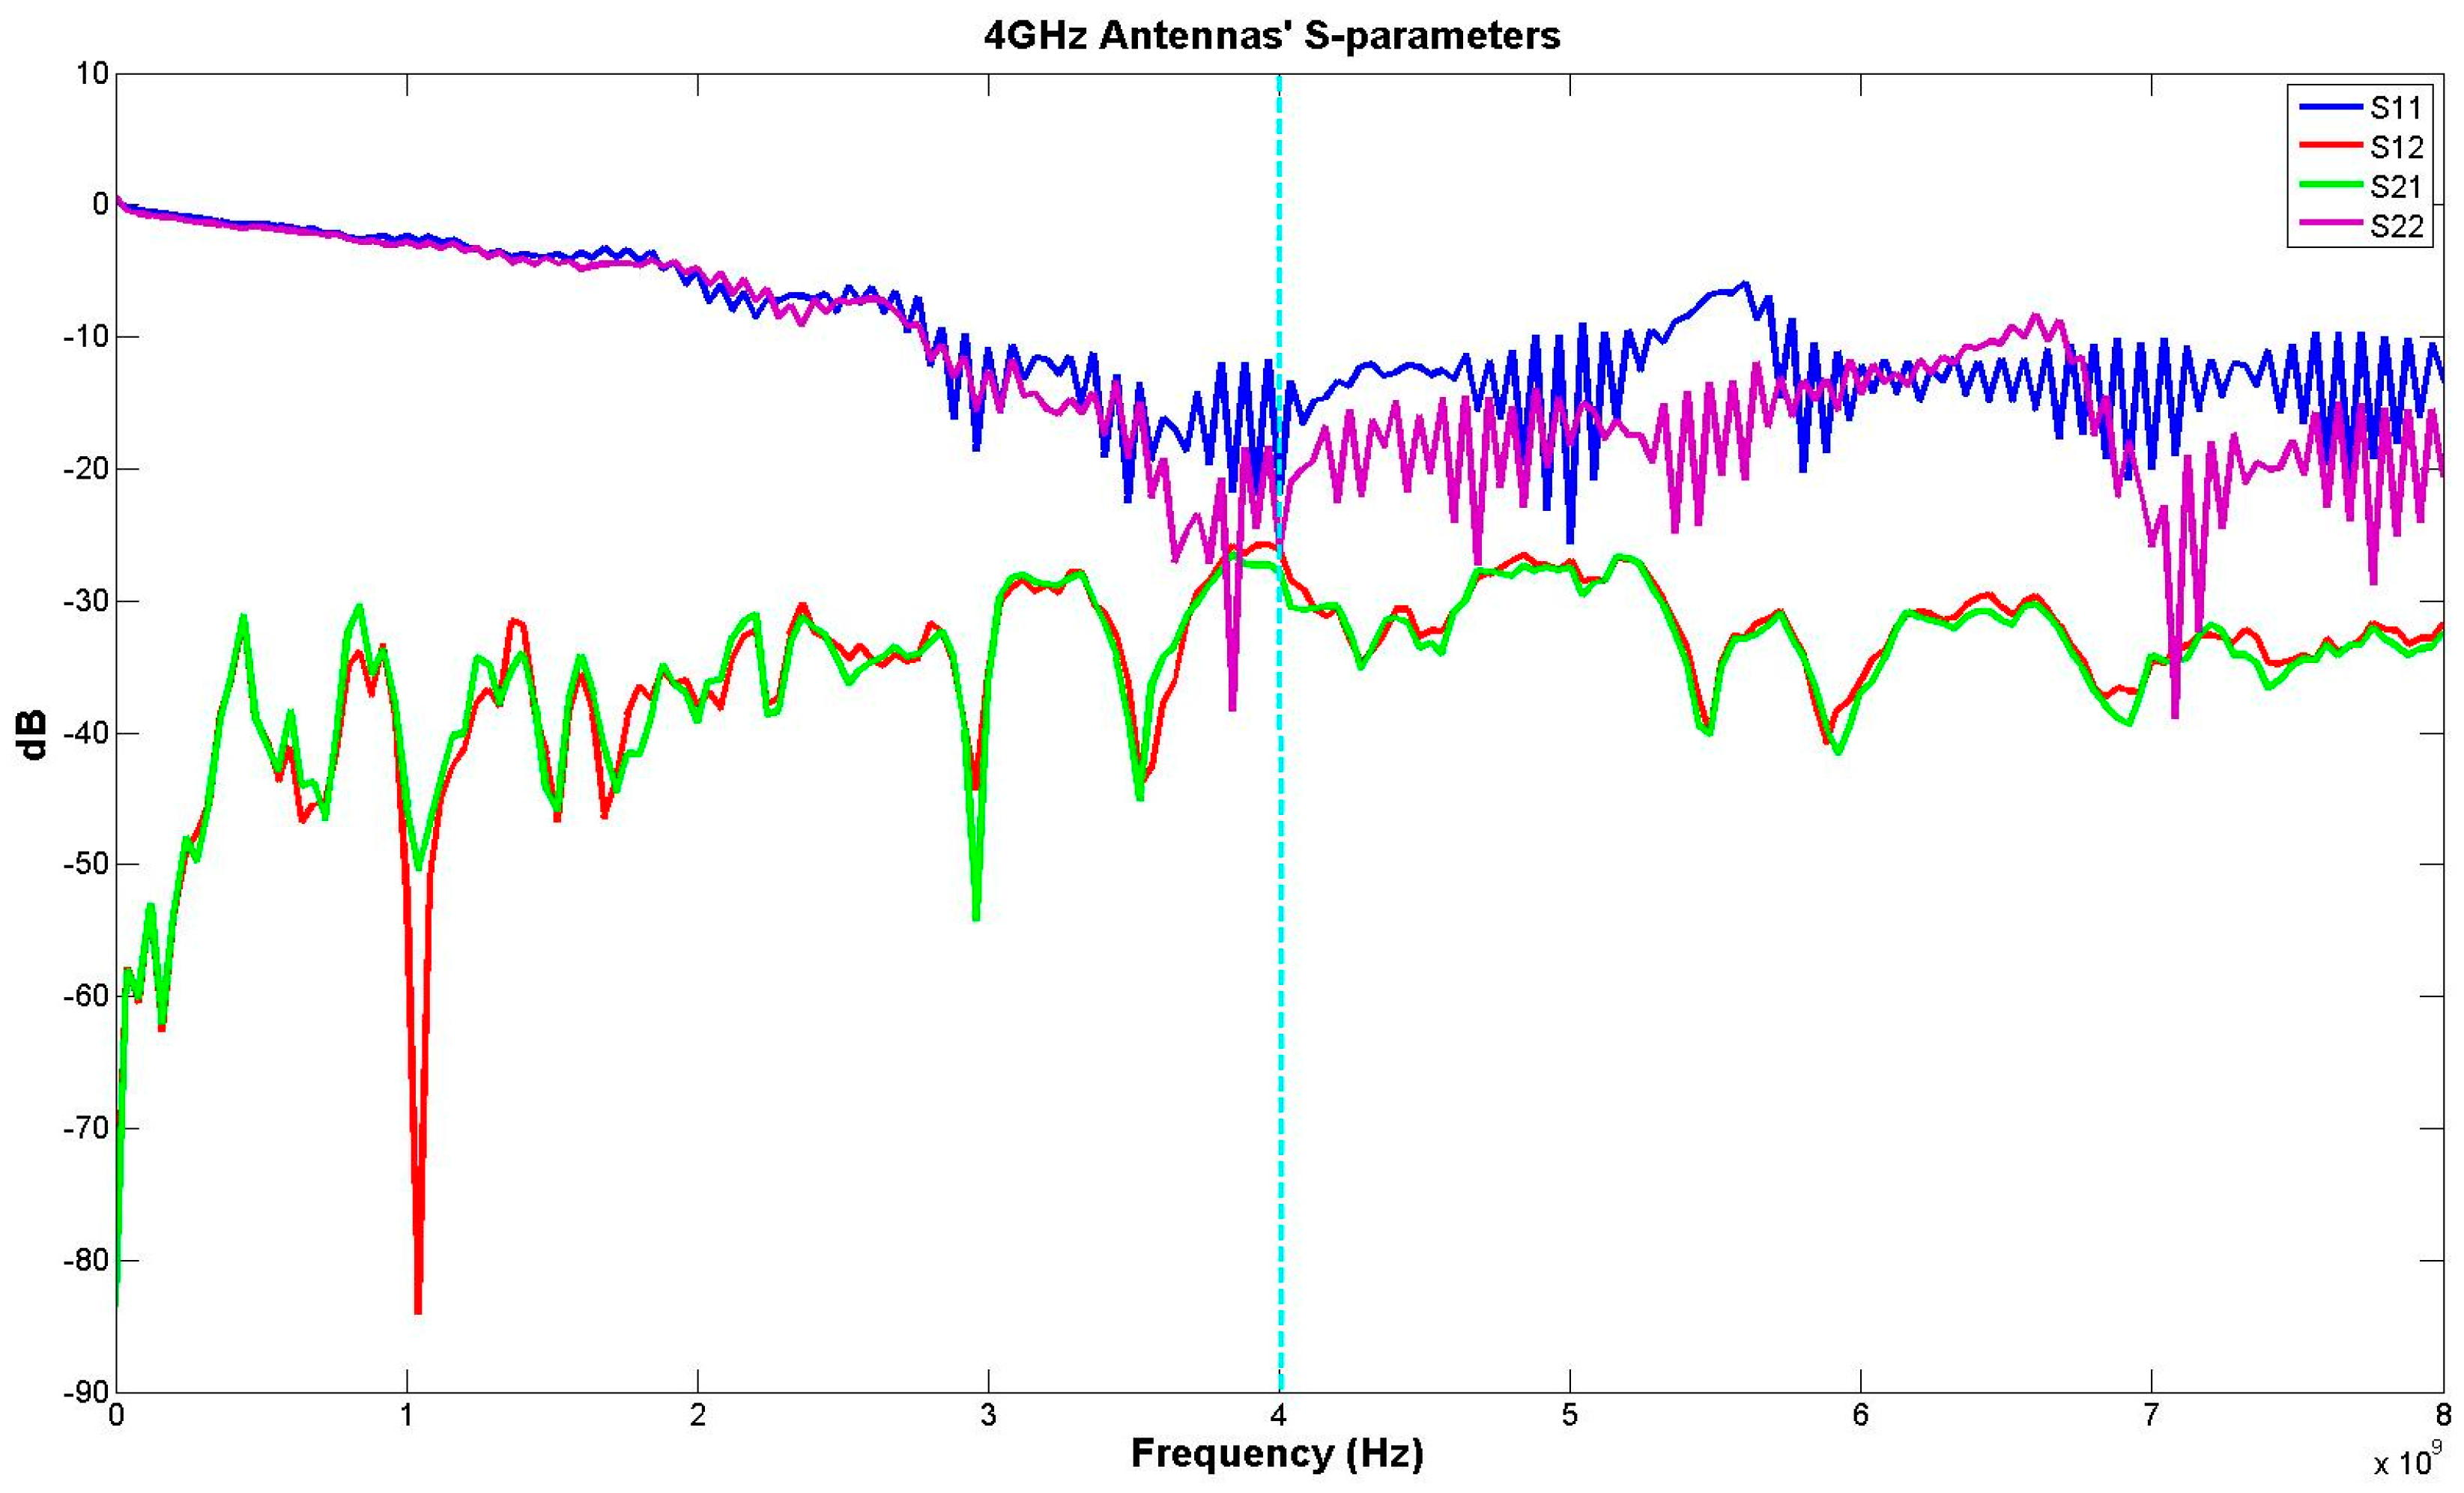
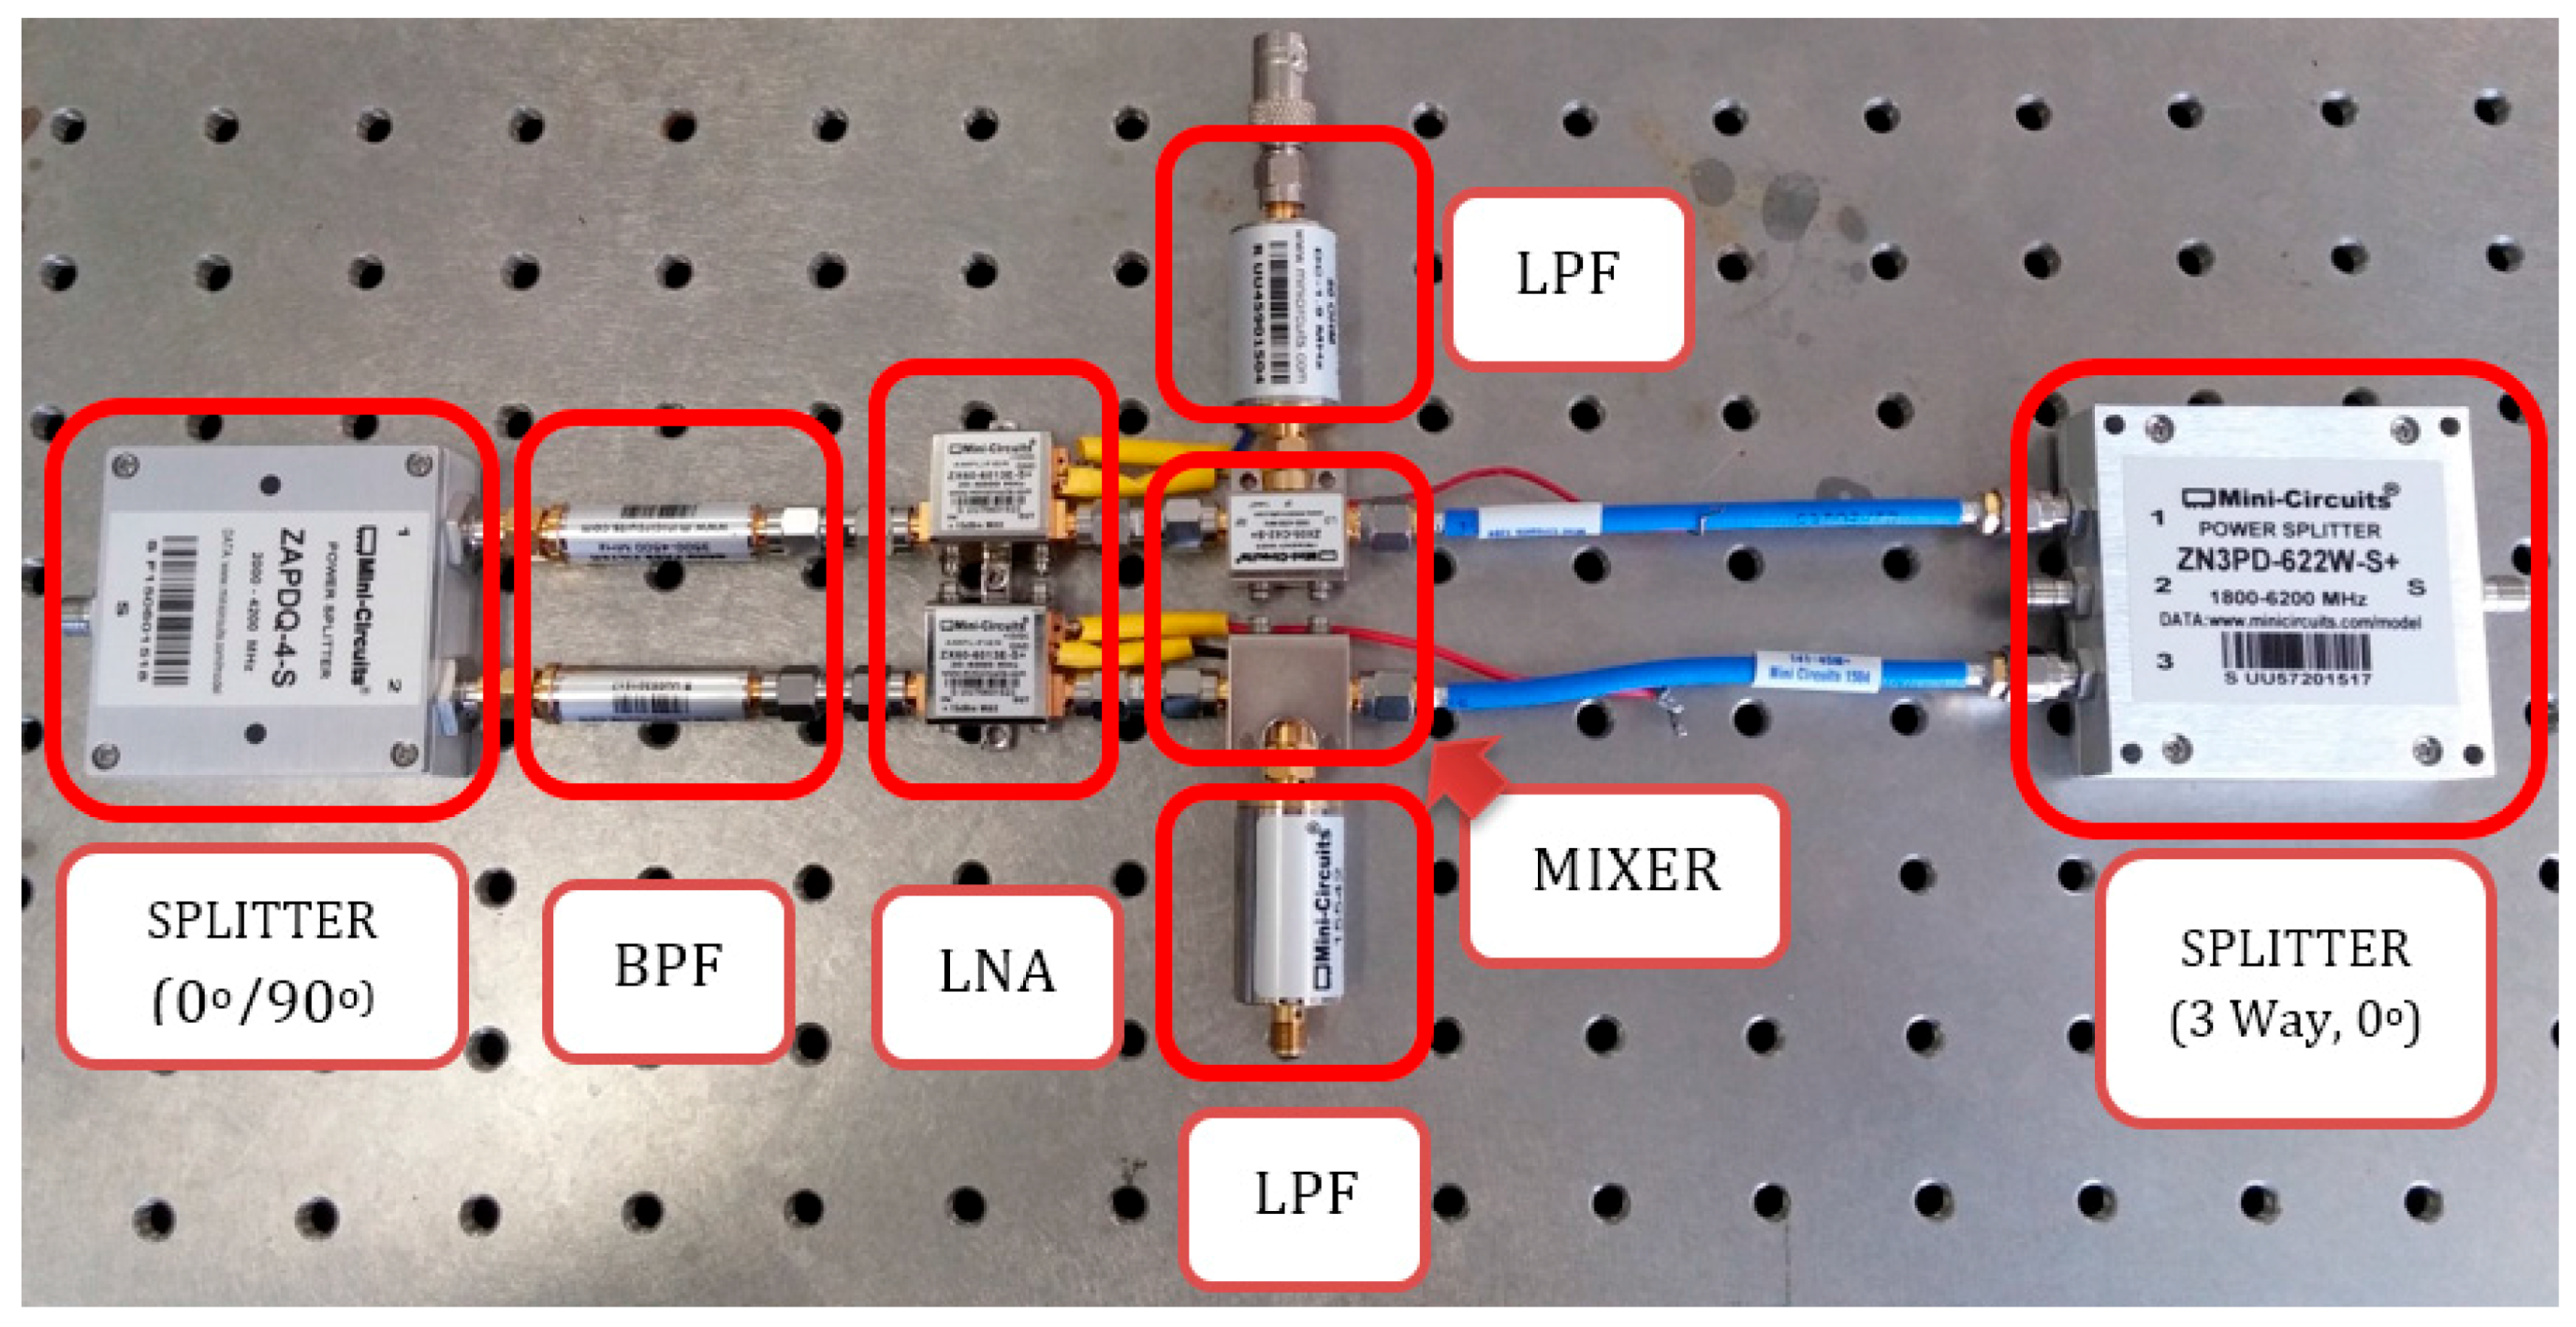
2.2. Hardware
2.3. Software
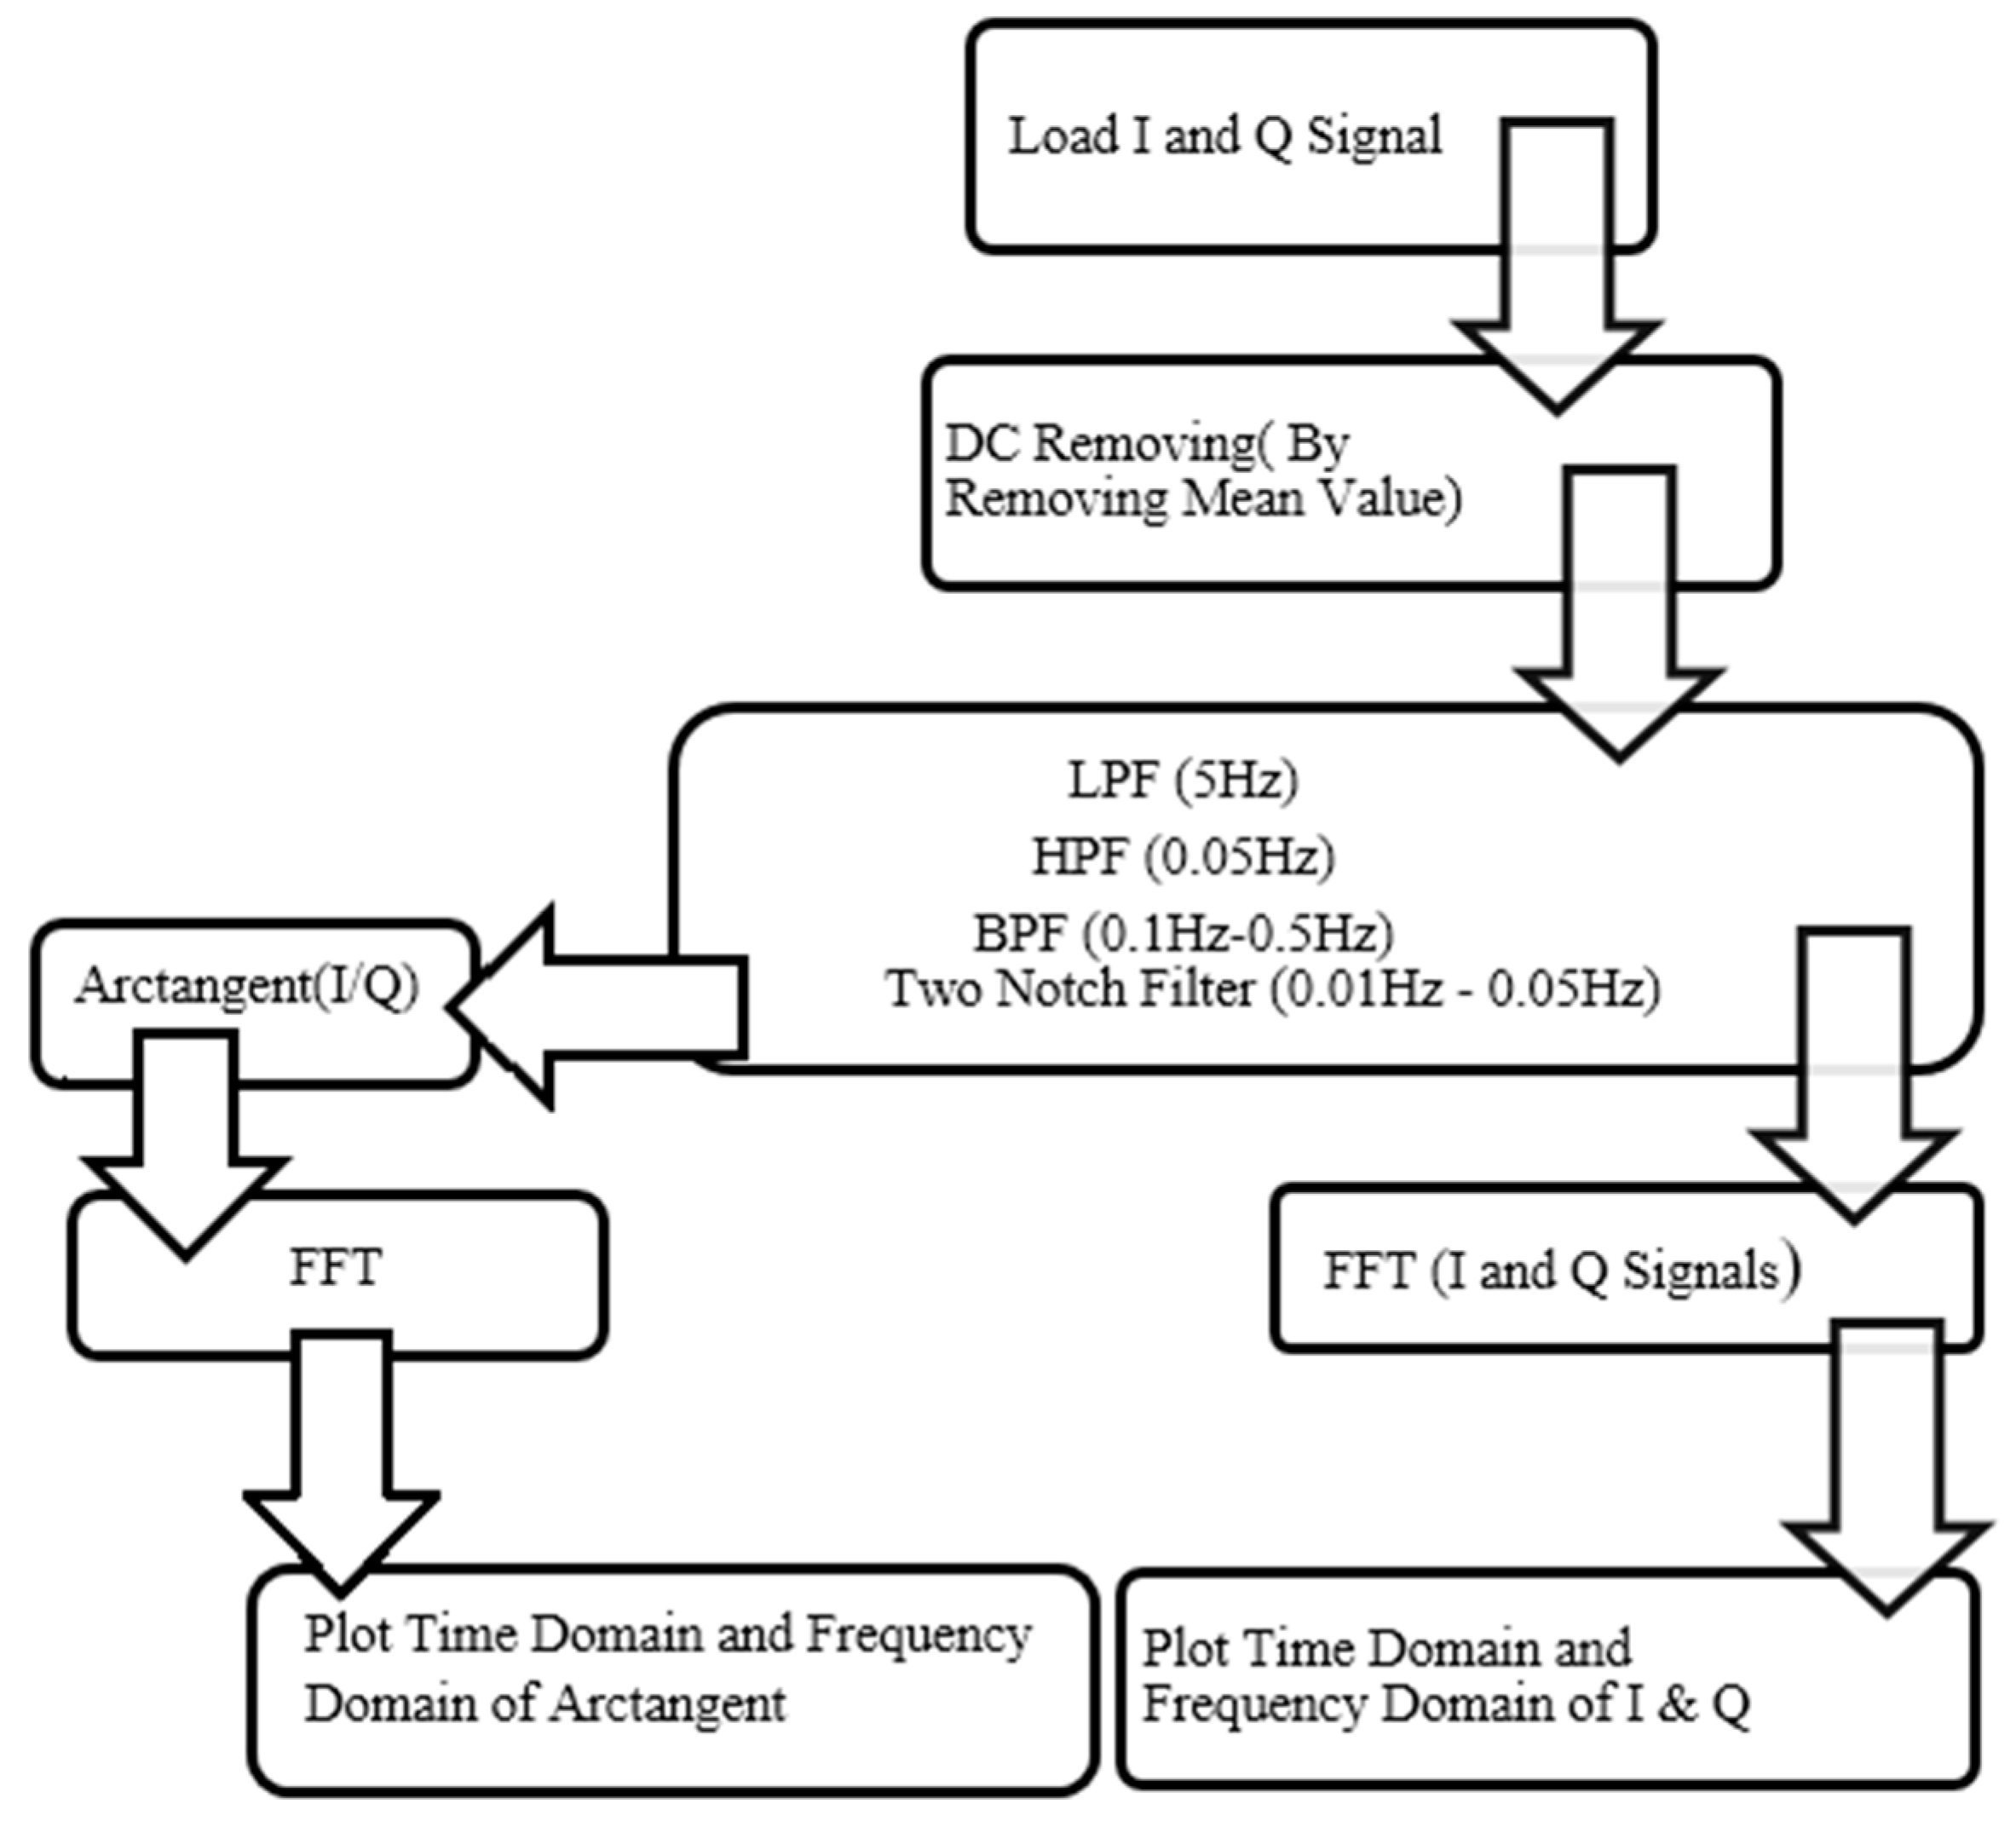
2.3.1. Data Acquisition
2.3.2. Arctangent Demodulation
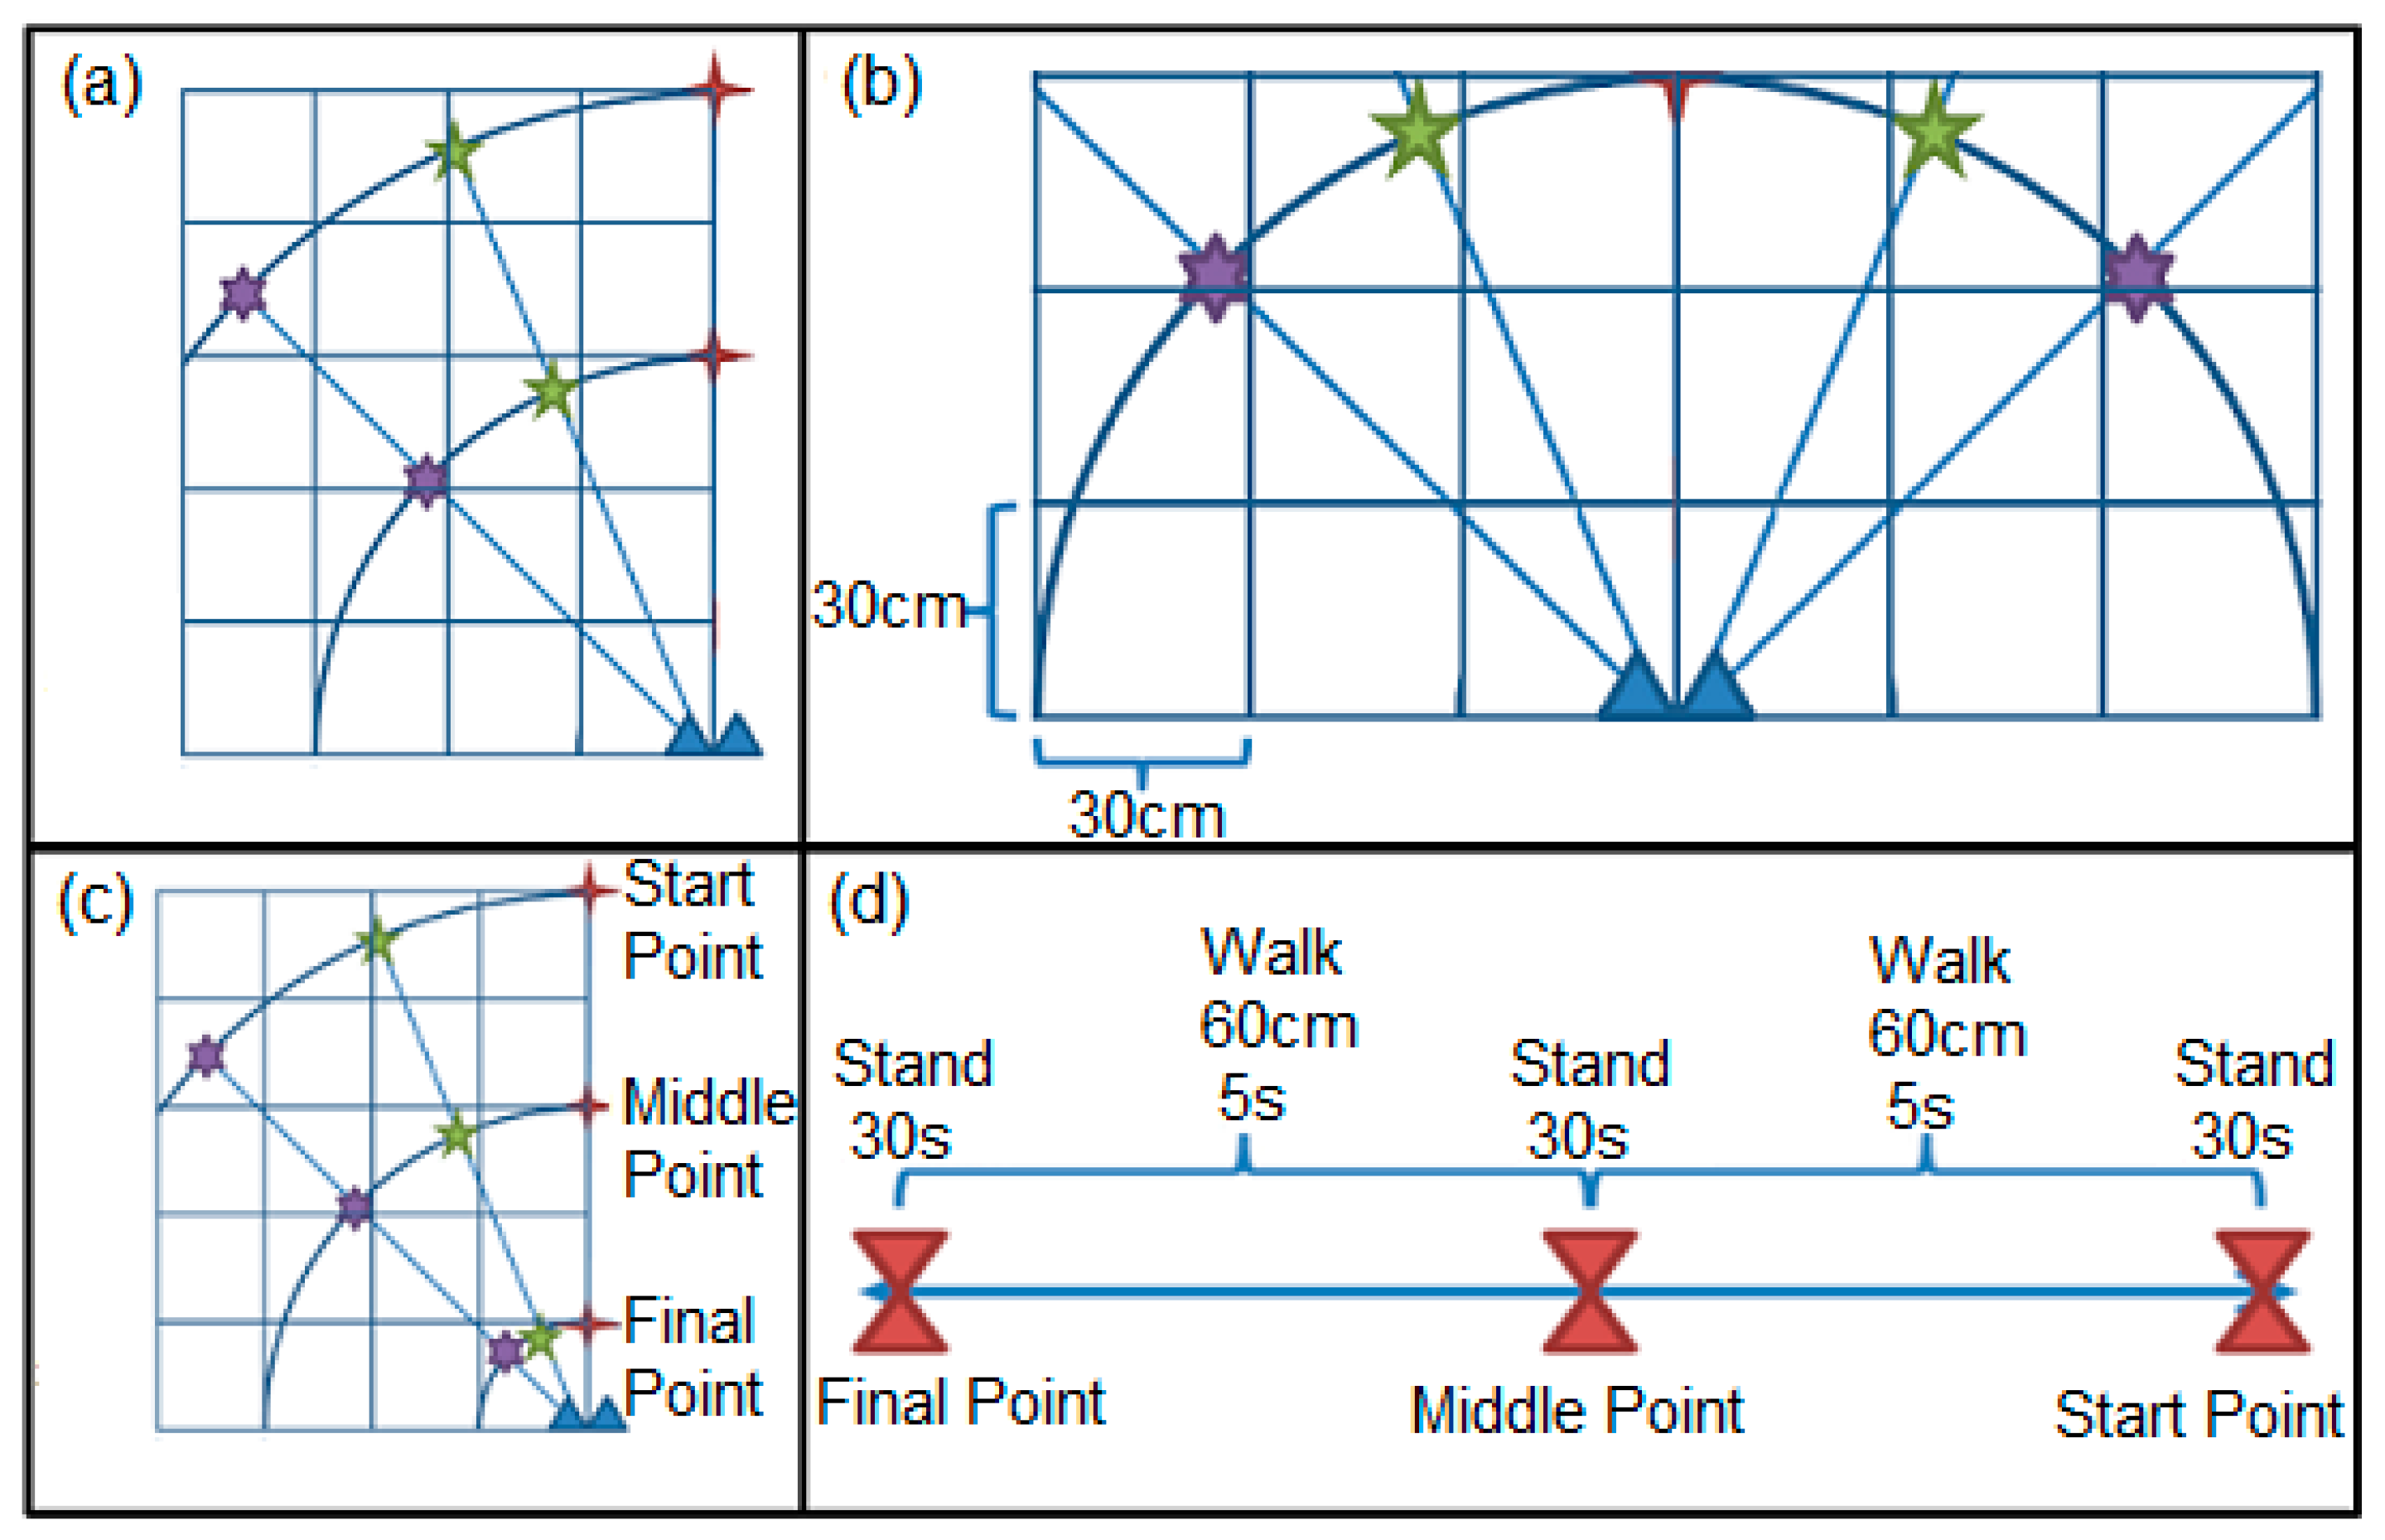
2.4. Experimental Protocol and Human Testing
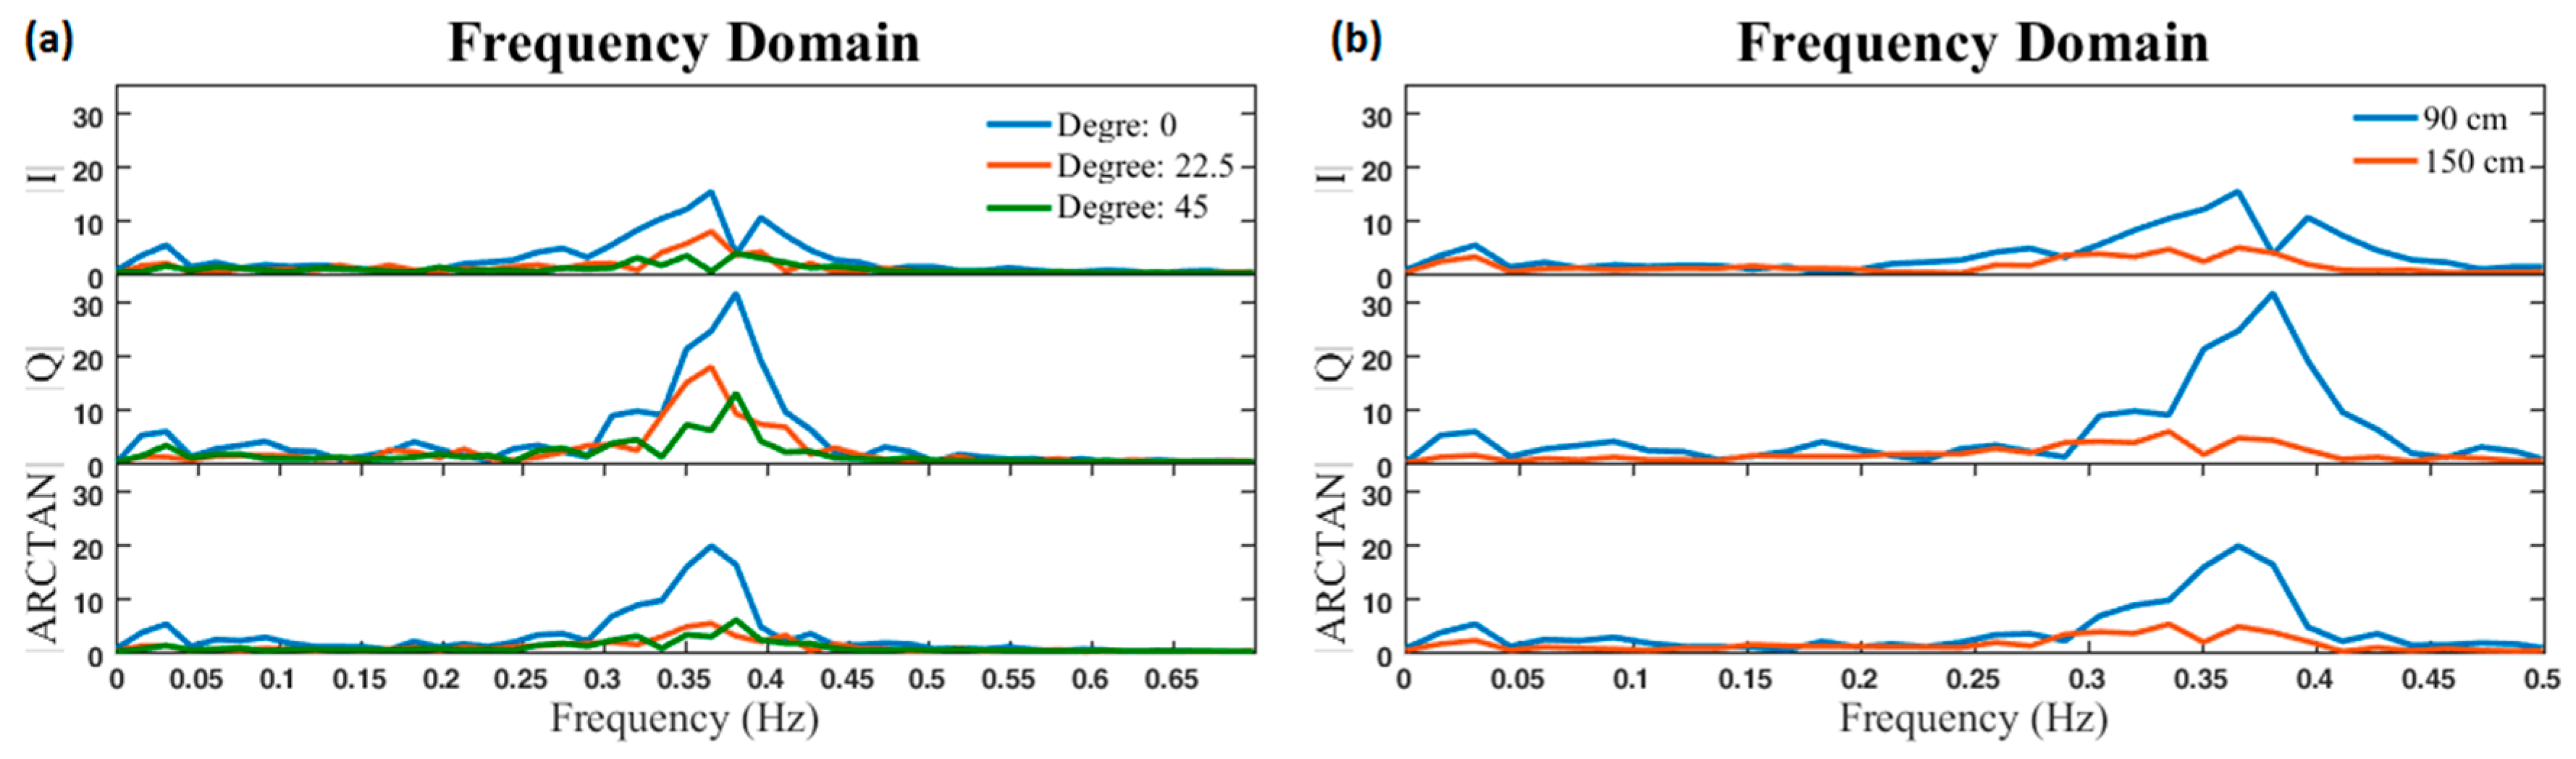
- Each target person stood at two different distances (90 cm and 150 cm), and three different angles (0°, 22.5°, and 45°), while facing the antennas and breathed normally for 50 s.
- Each target person stood at two different distances (90 cm and 150 cm) while not facing the antennas and breathed normally for 50 s (0° direction).
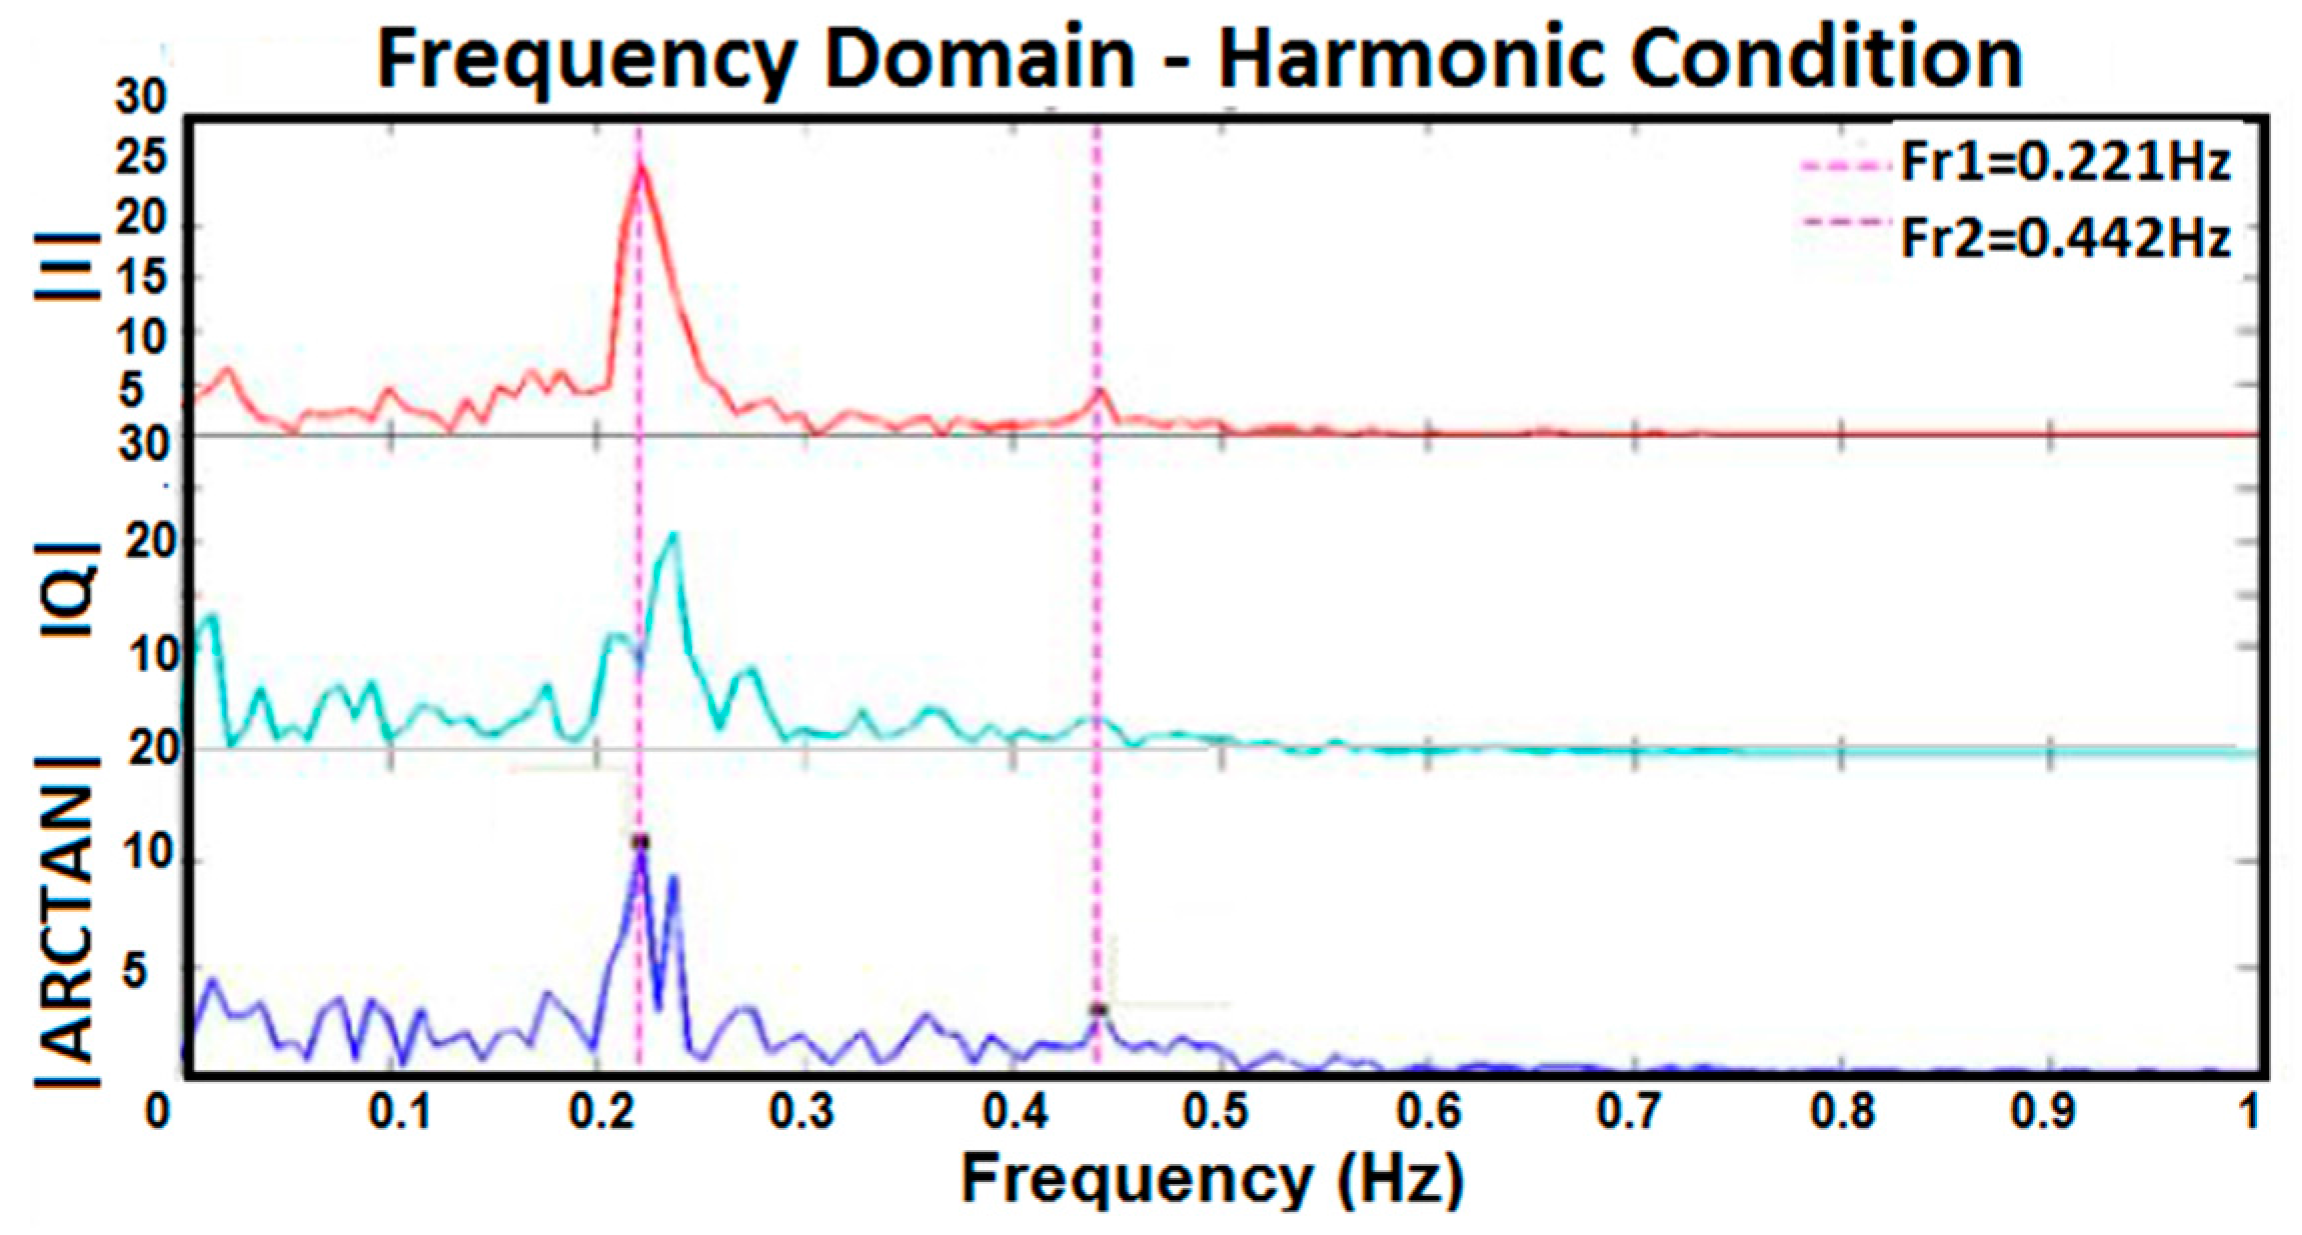
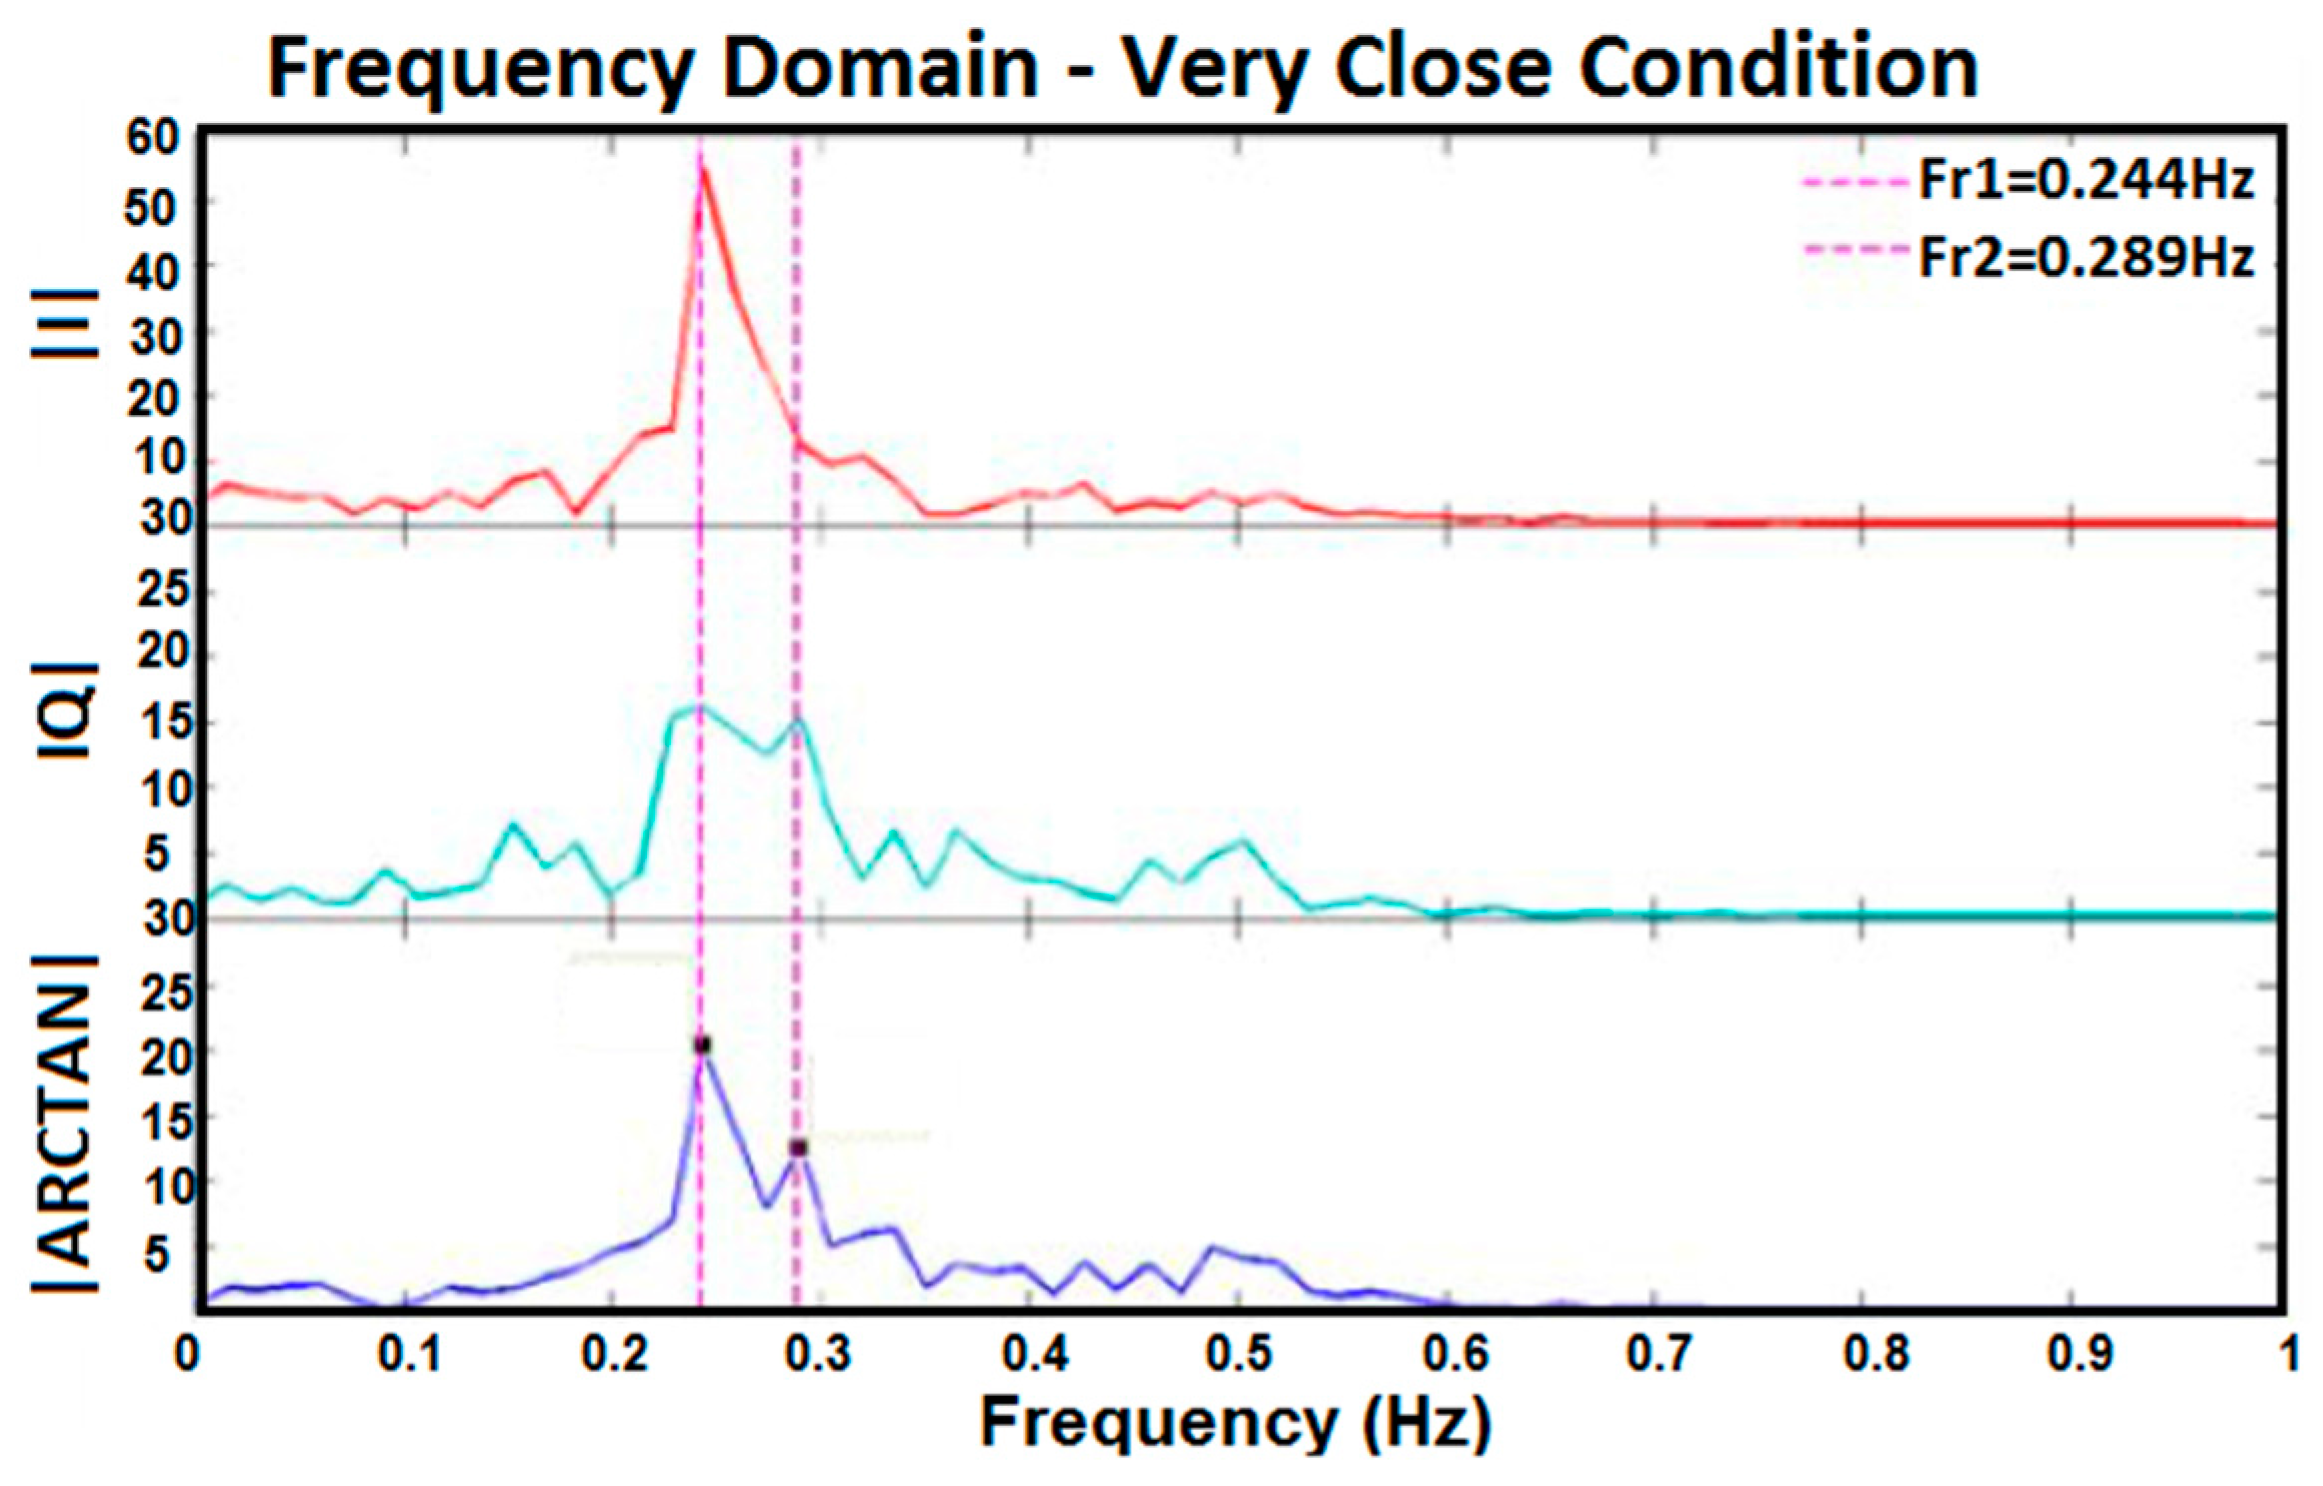
- Two subjects stood at the same distances (90 cm and 150 cm) and the same angles (22.5° and 45°) and breathed normally and simultaneously for 50 s to understand if the setup could realise different respiration rates.
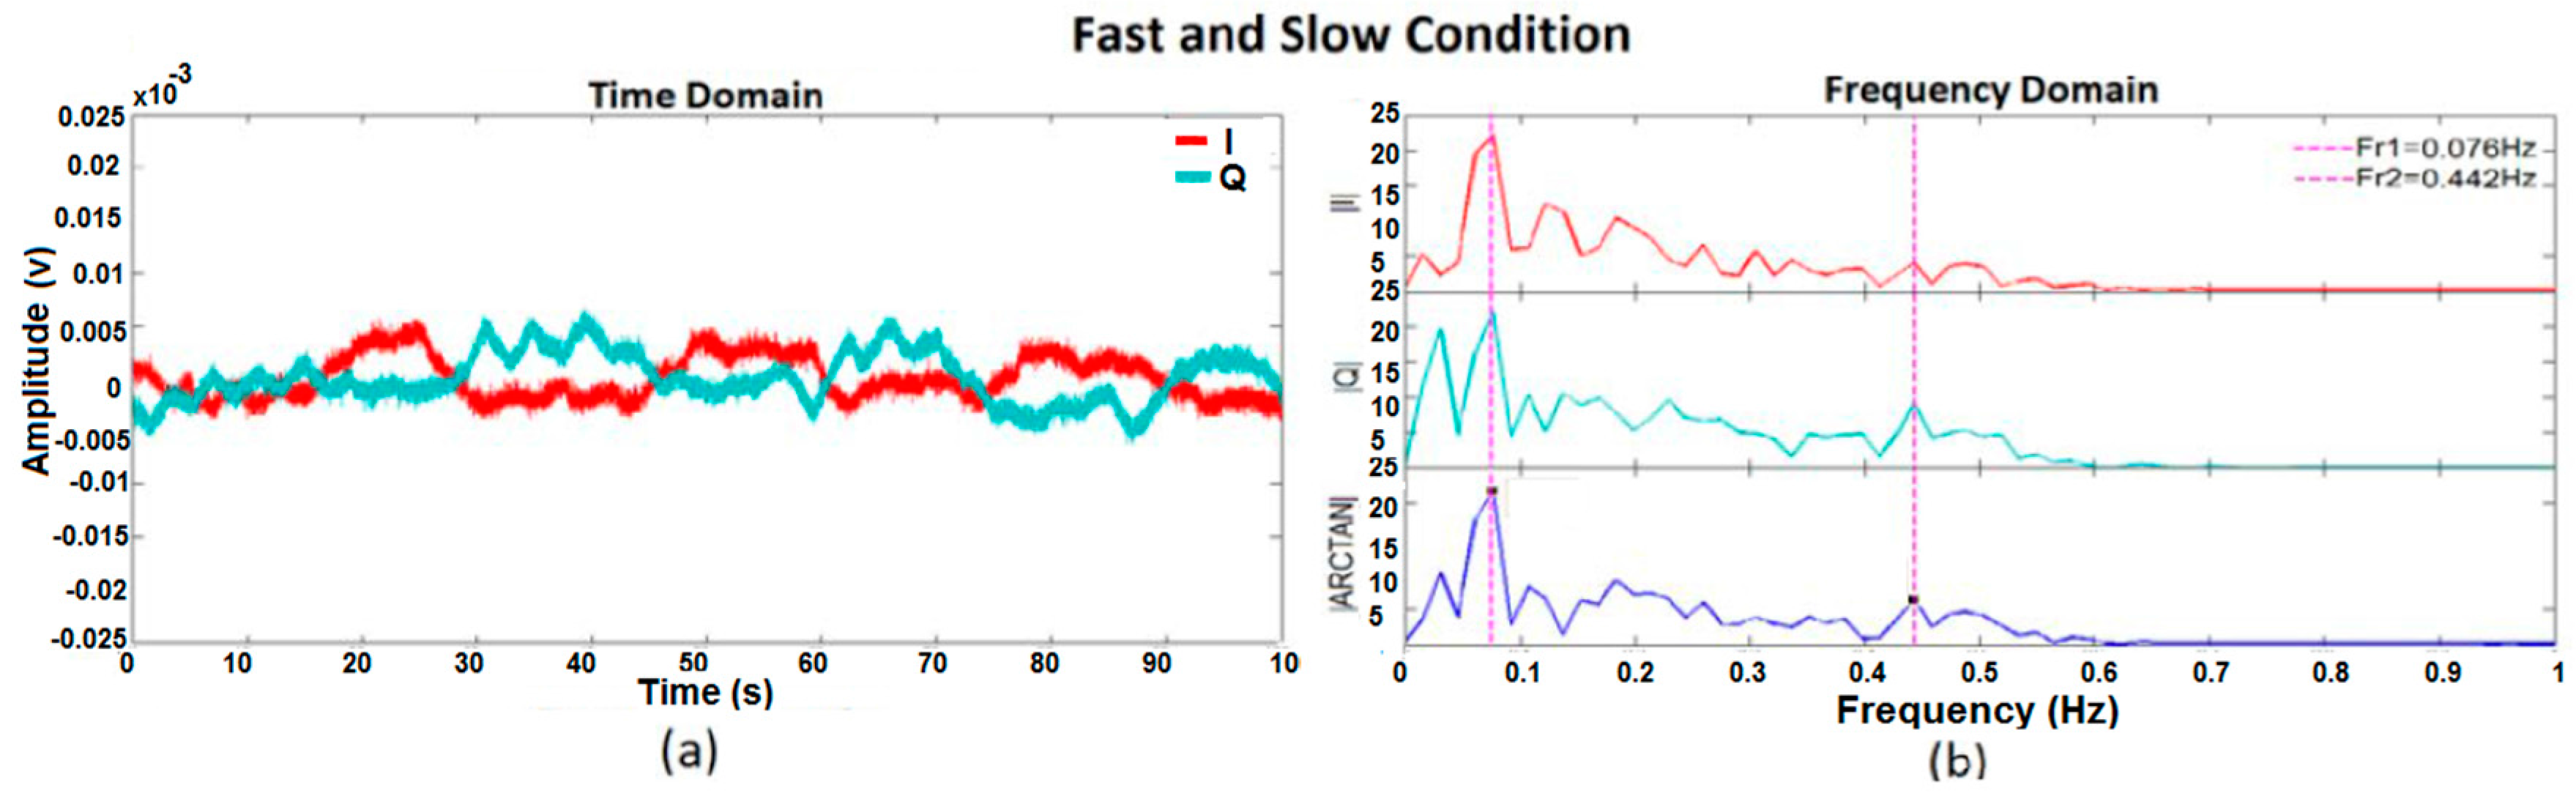
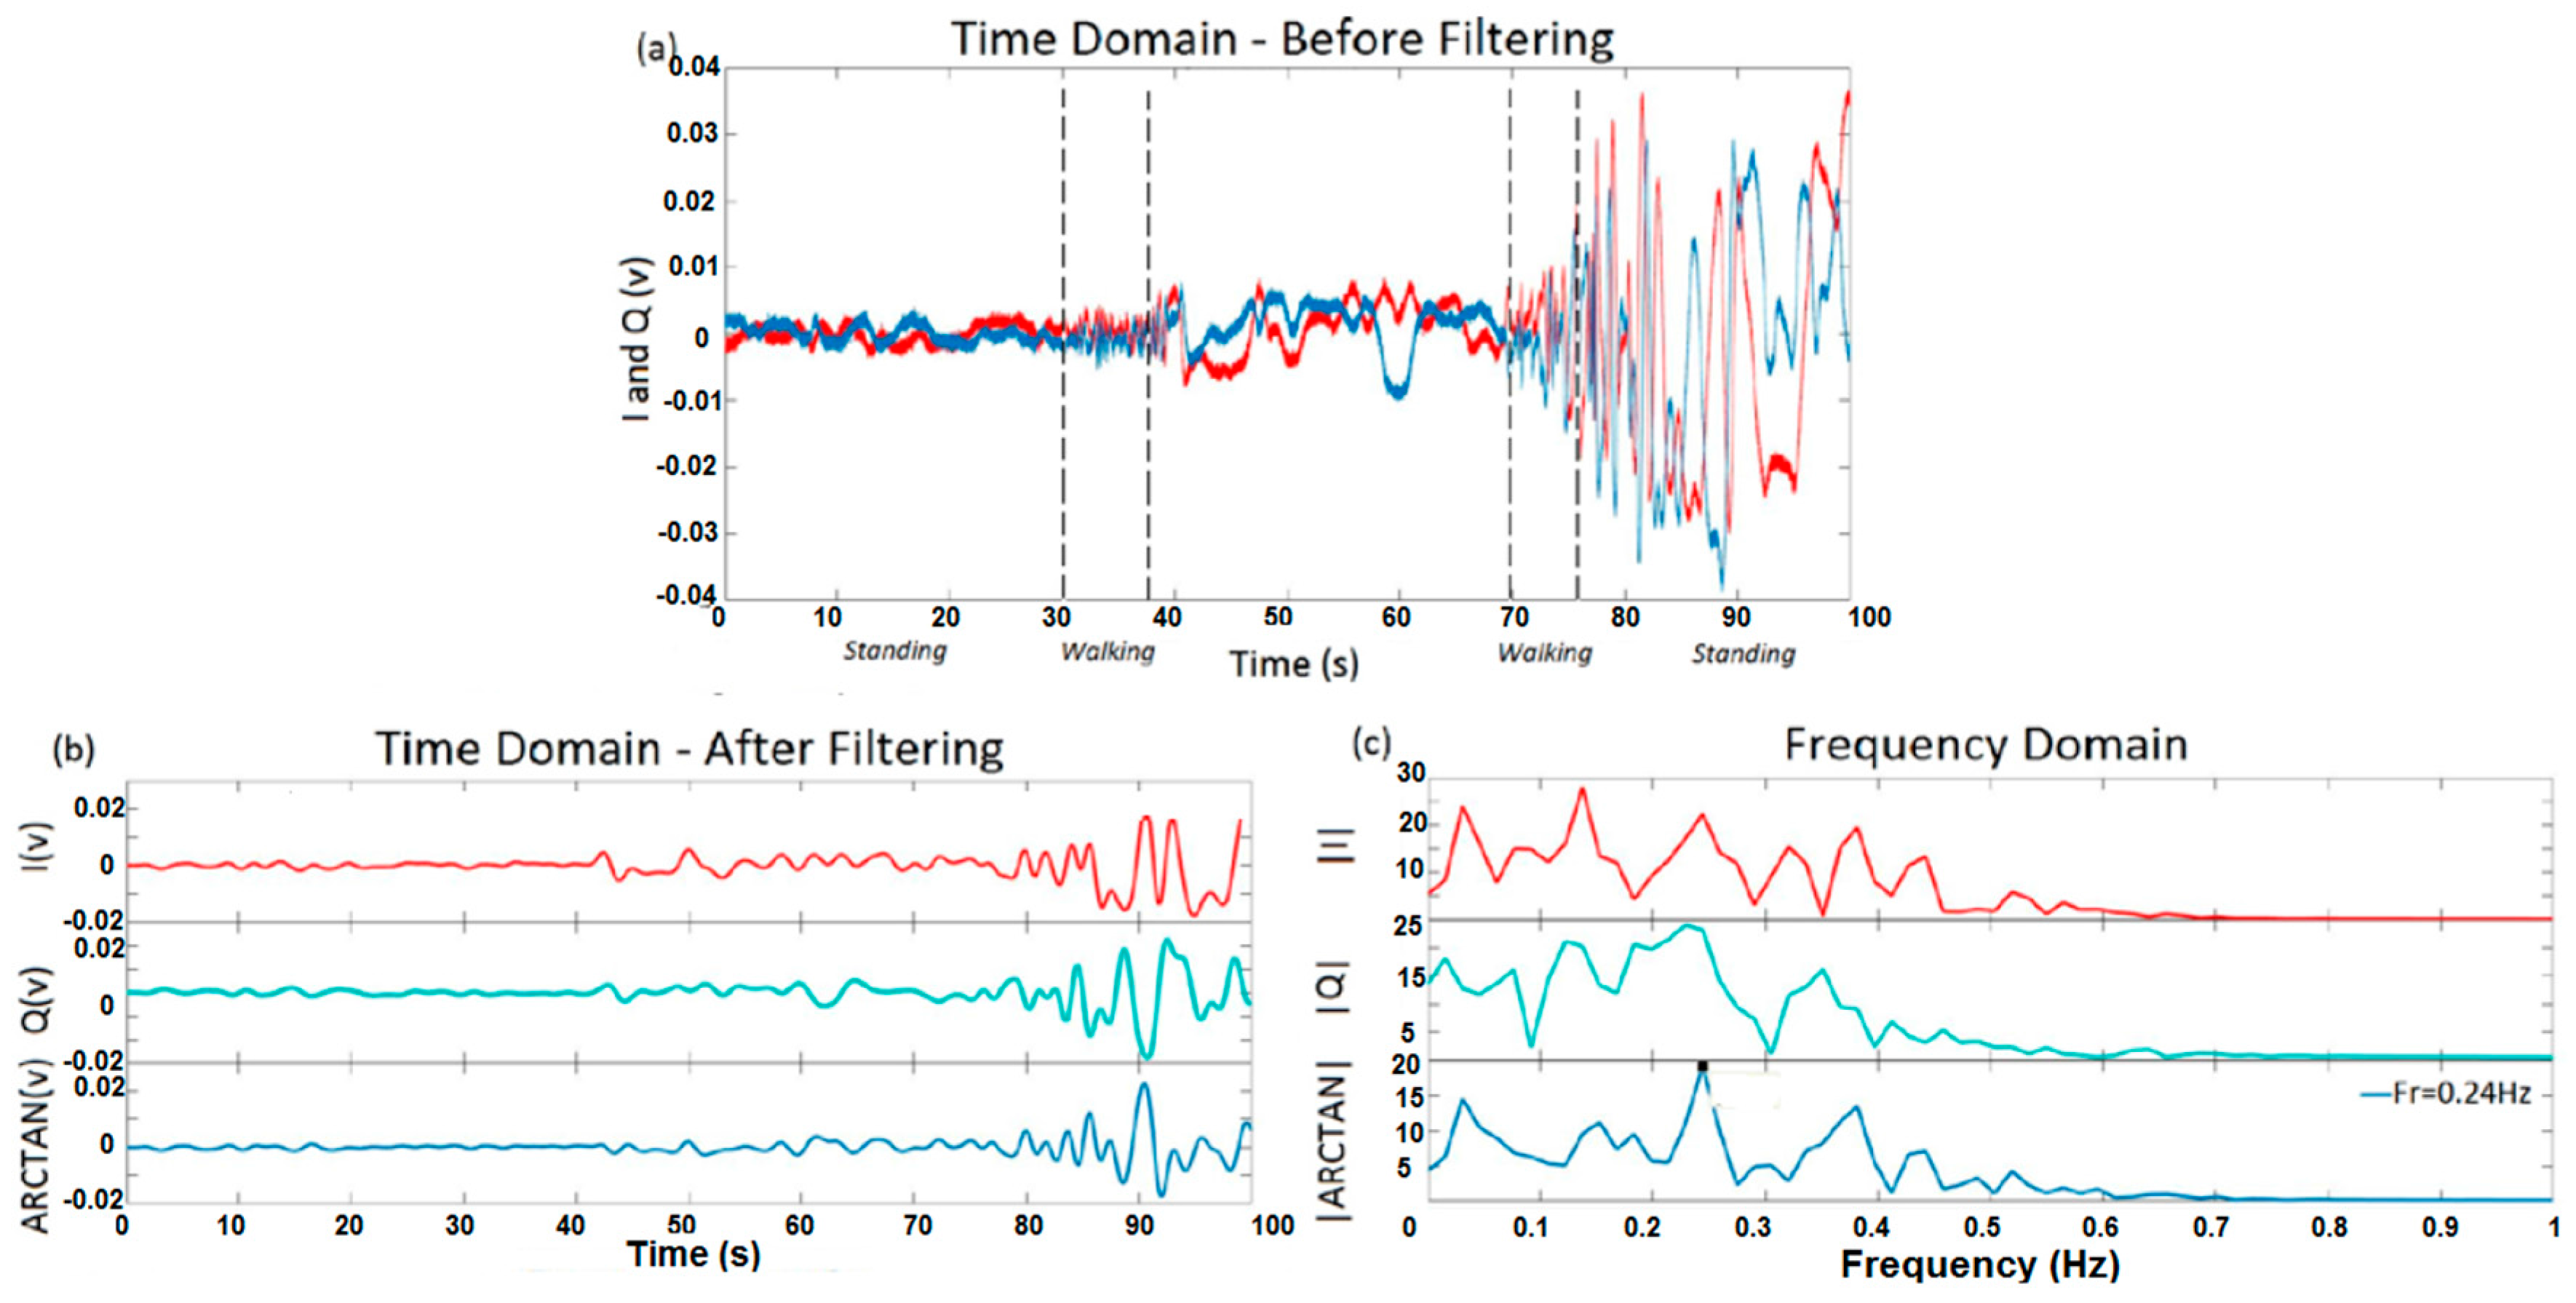
- Each subject walked a distance of between 30 cm and 150 cm and in three different directions (0°, 22.5°, and 45°) for 50 s at a constant speed, without standing still, to find out whether or not the setup could measure the respiration rate during walking.
- The position of test protocols:
- At first, each subject stood at a distance of 150 cm from the antennas for 30 s, and then walked at a distance of between 150 cm and 90 cm from the antennas for 10 s.
- Afterward, the subject stood at a distance of 90 cm from the antennae for 30 s, and then walked at a distance of between 90 cm and 30 cm from the antennas in 10 s.
- Finally, the subject stood at a distance of 30 cm from the antennas for 30 s.
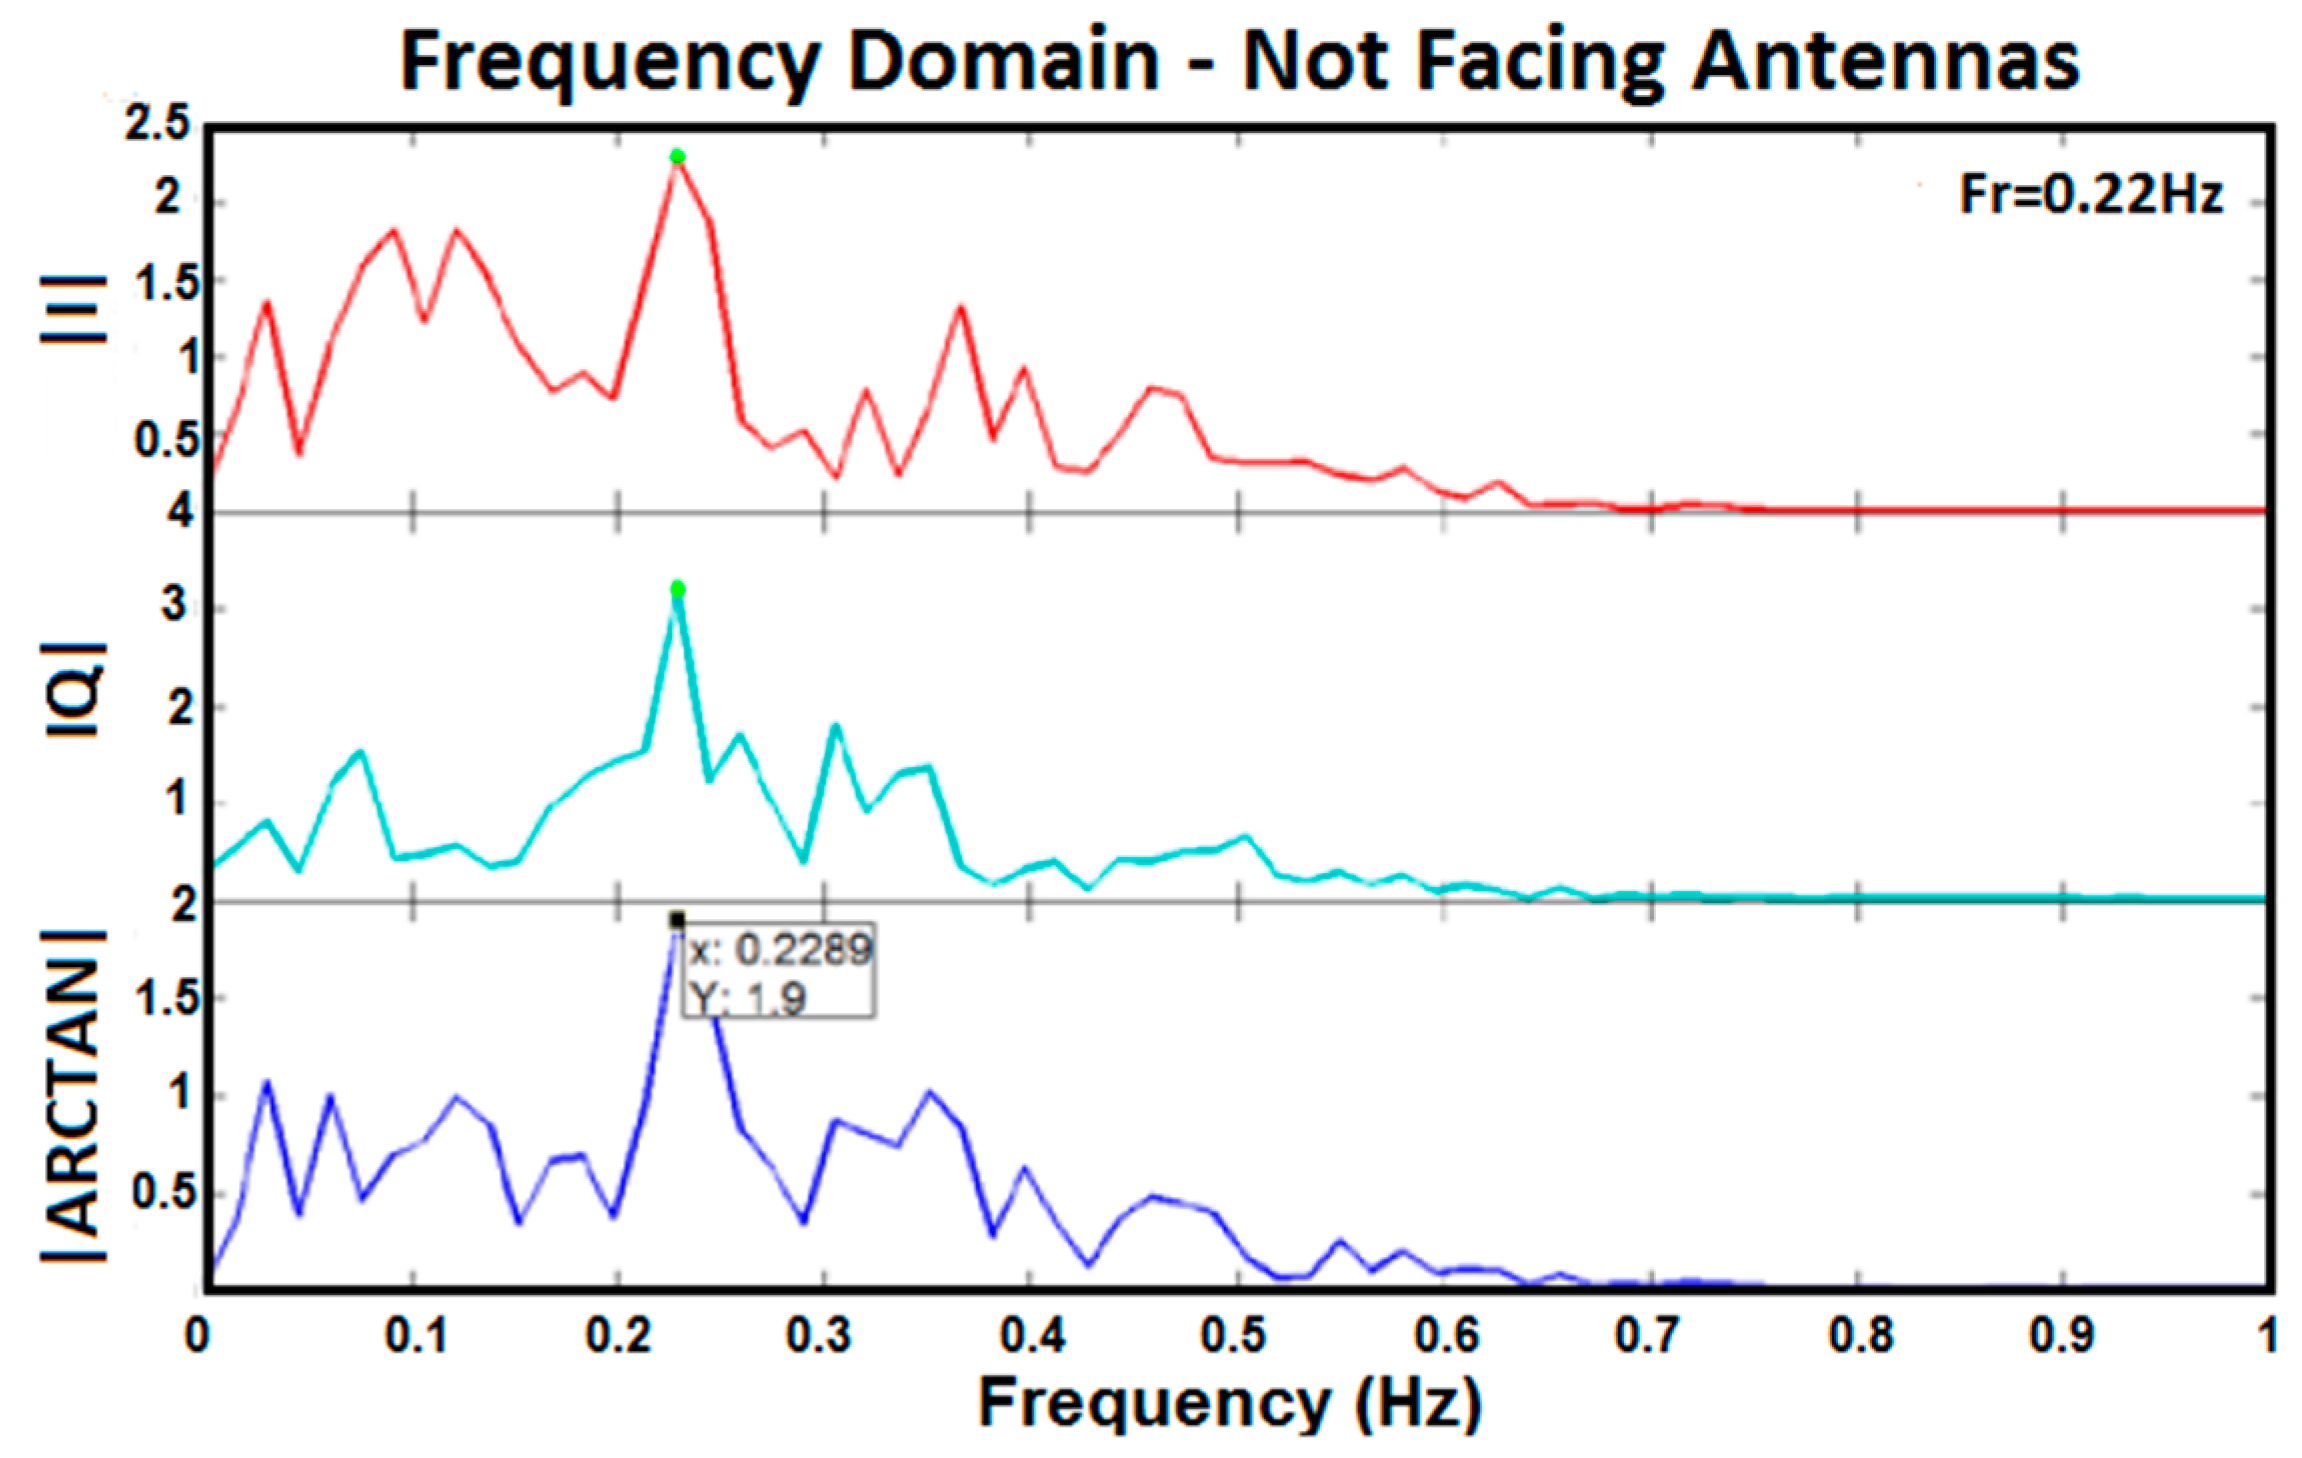
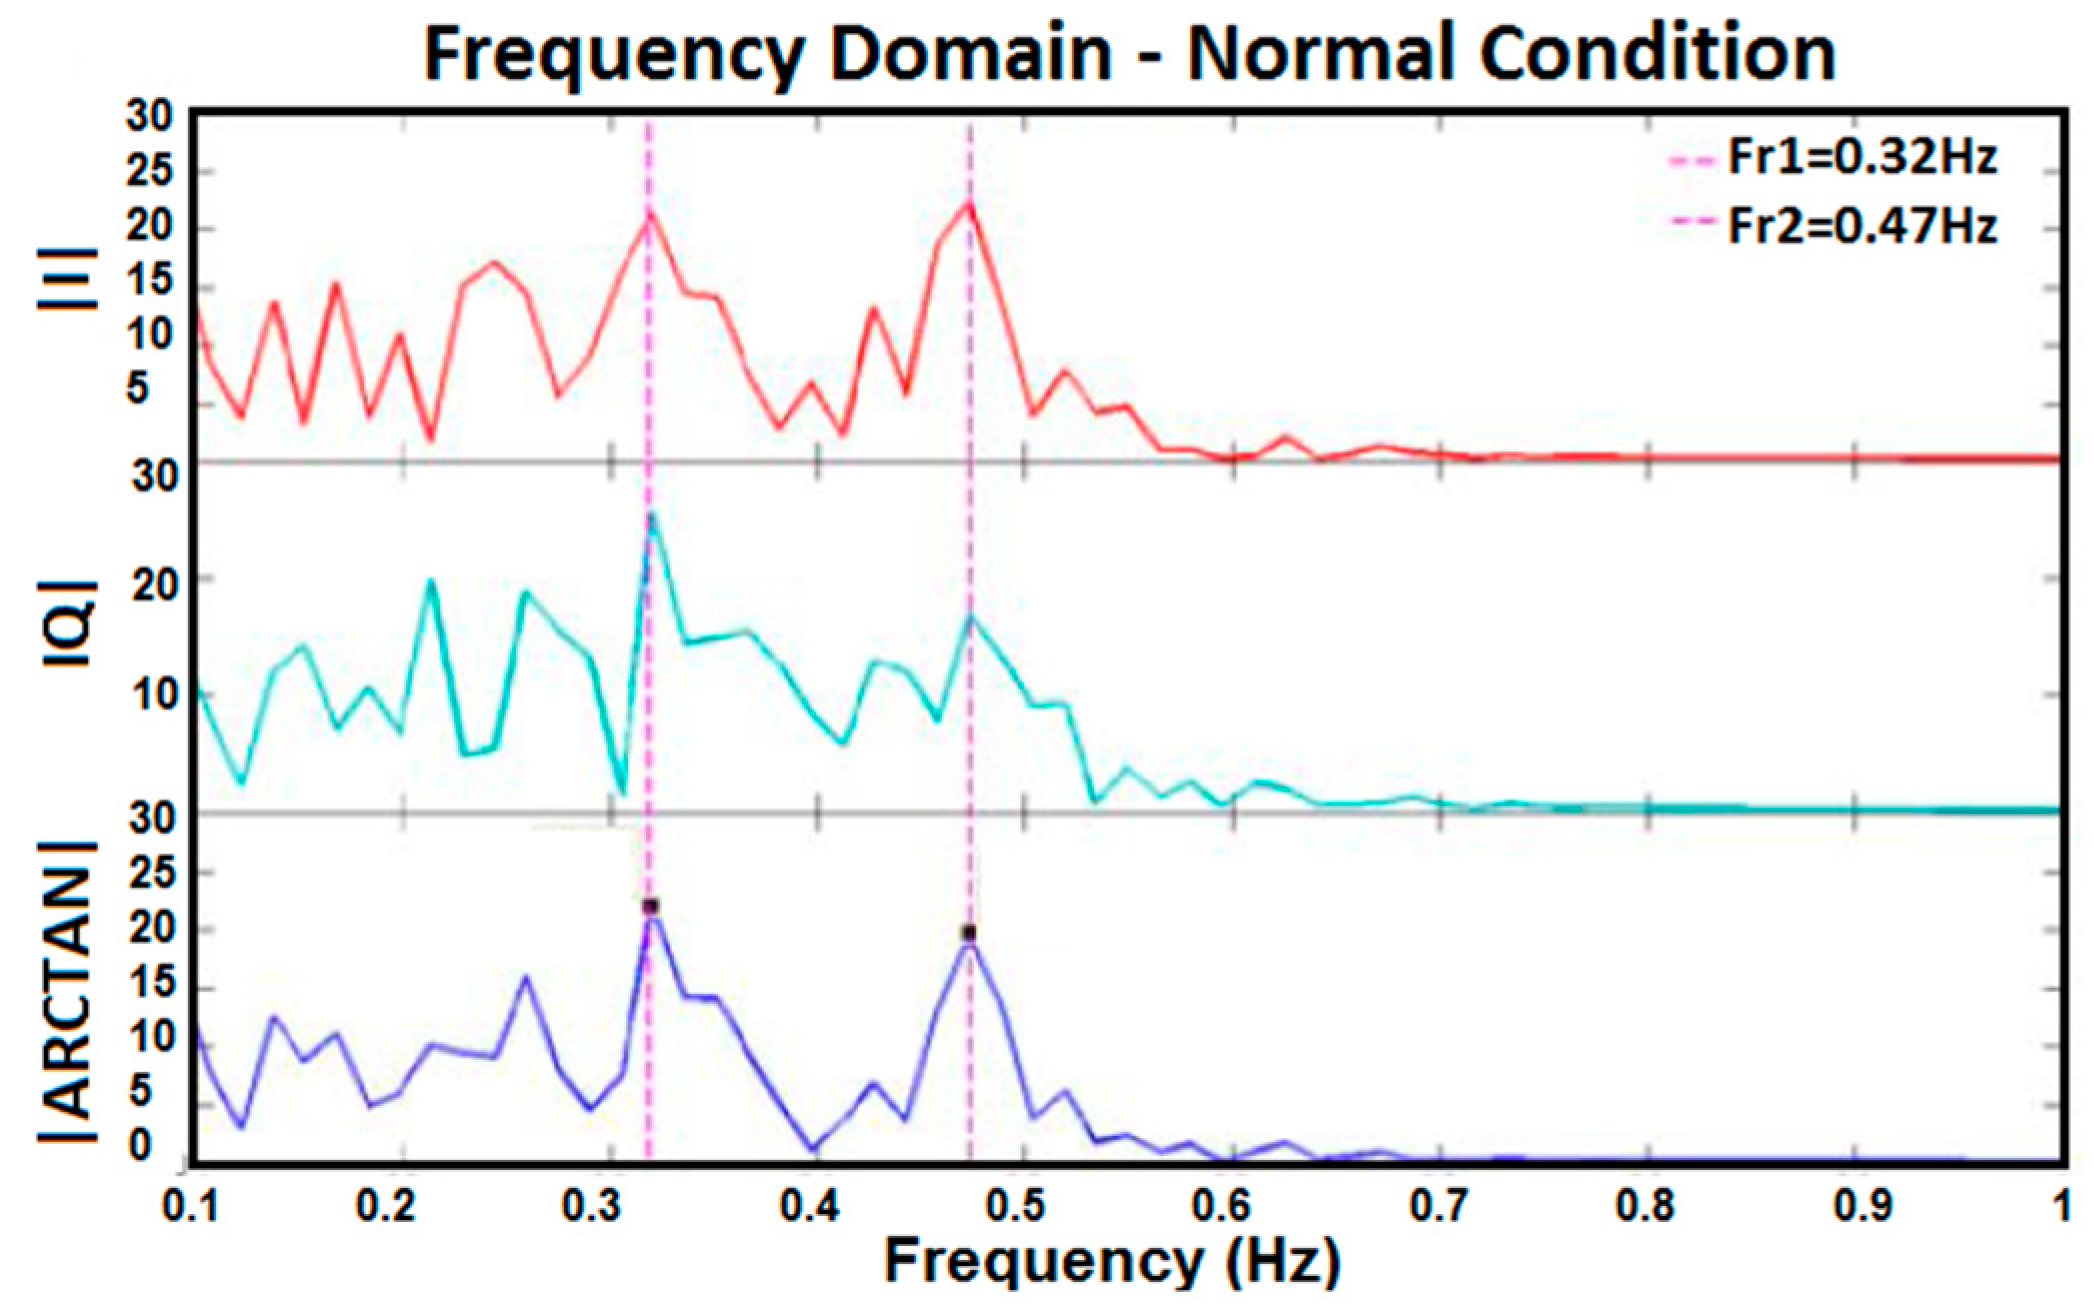
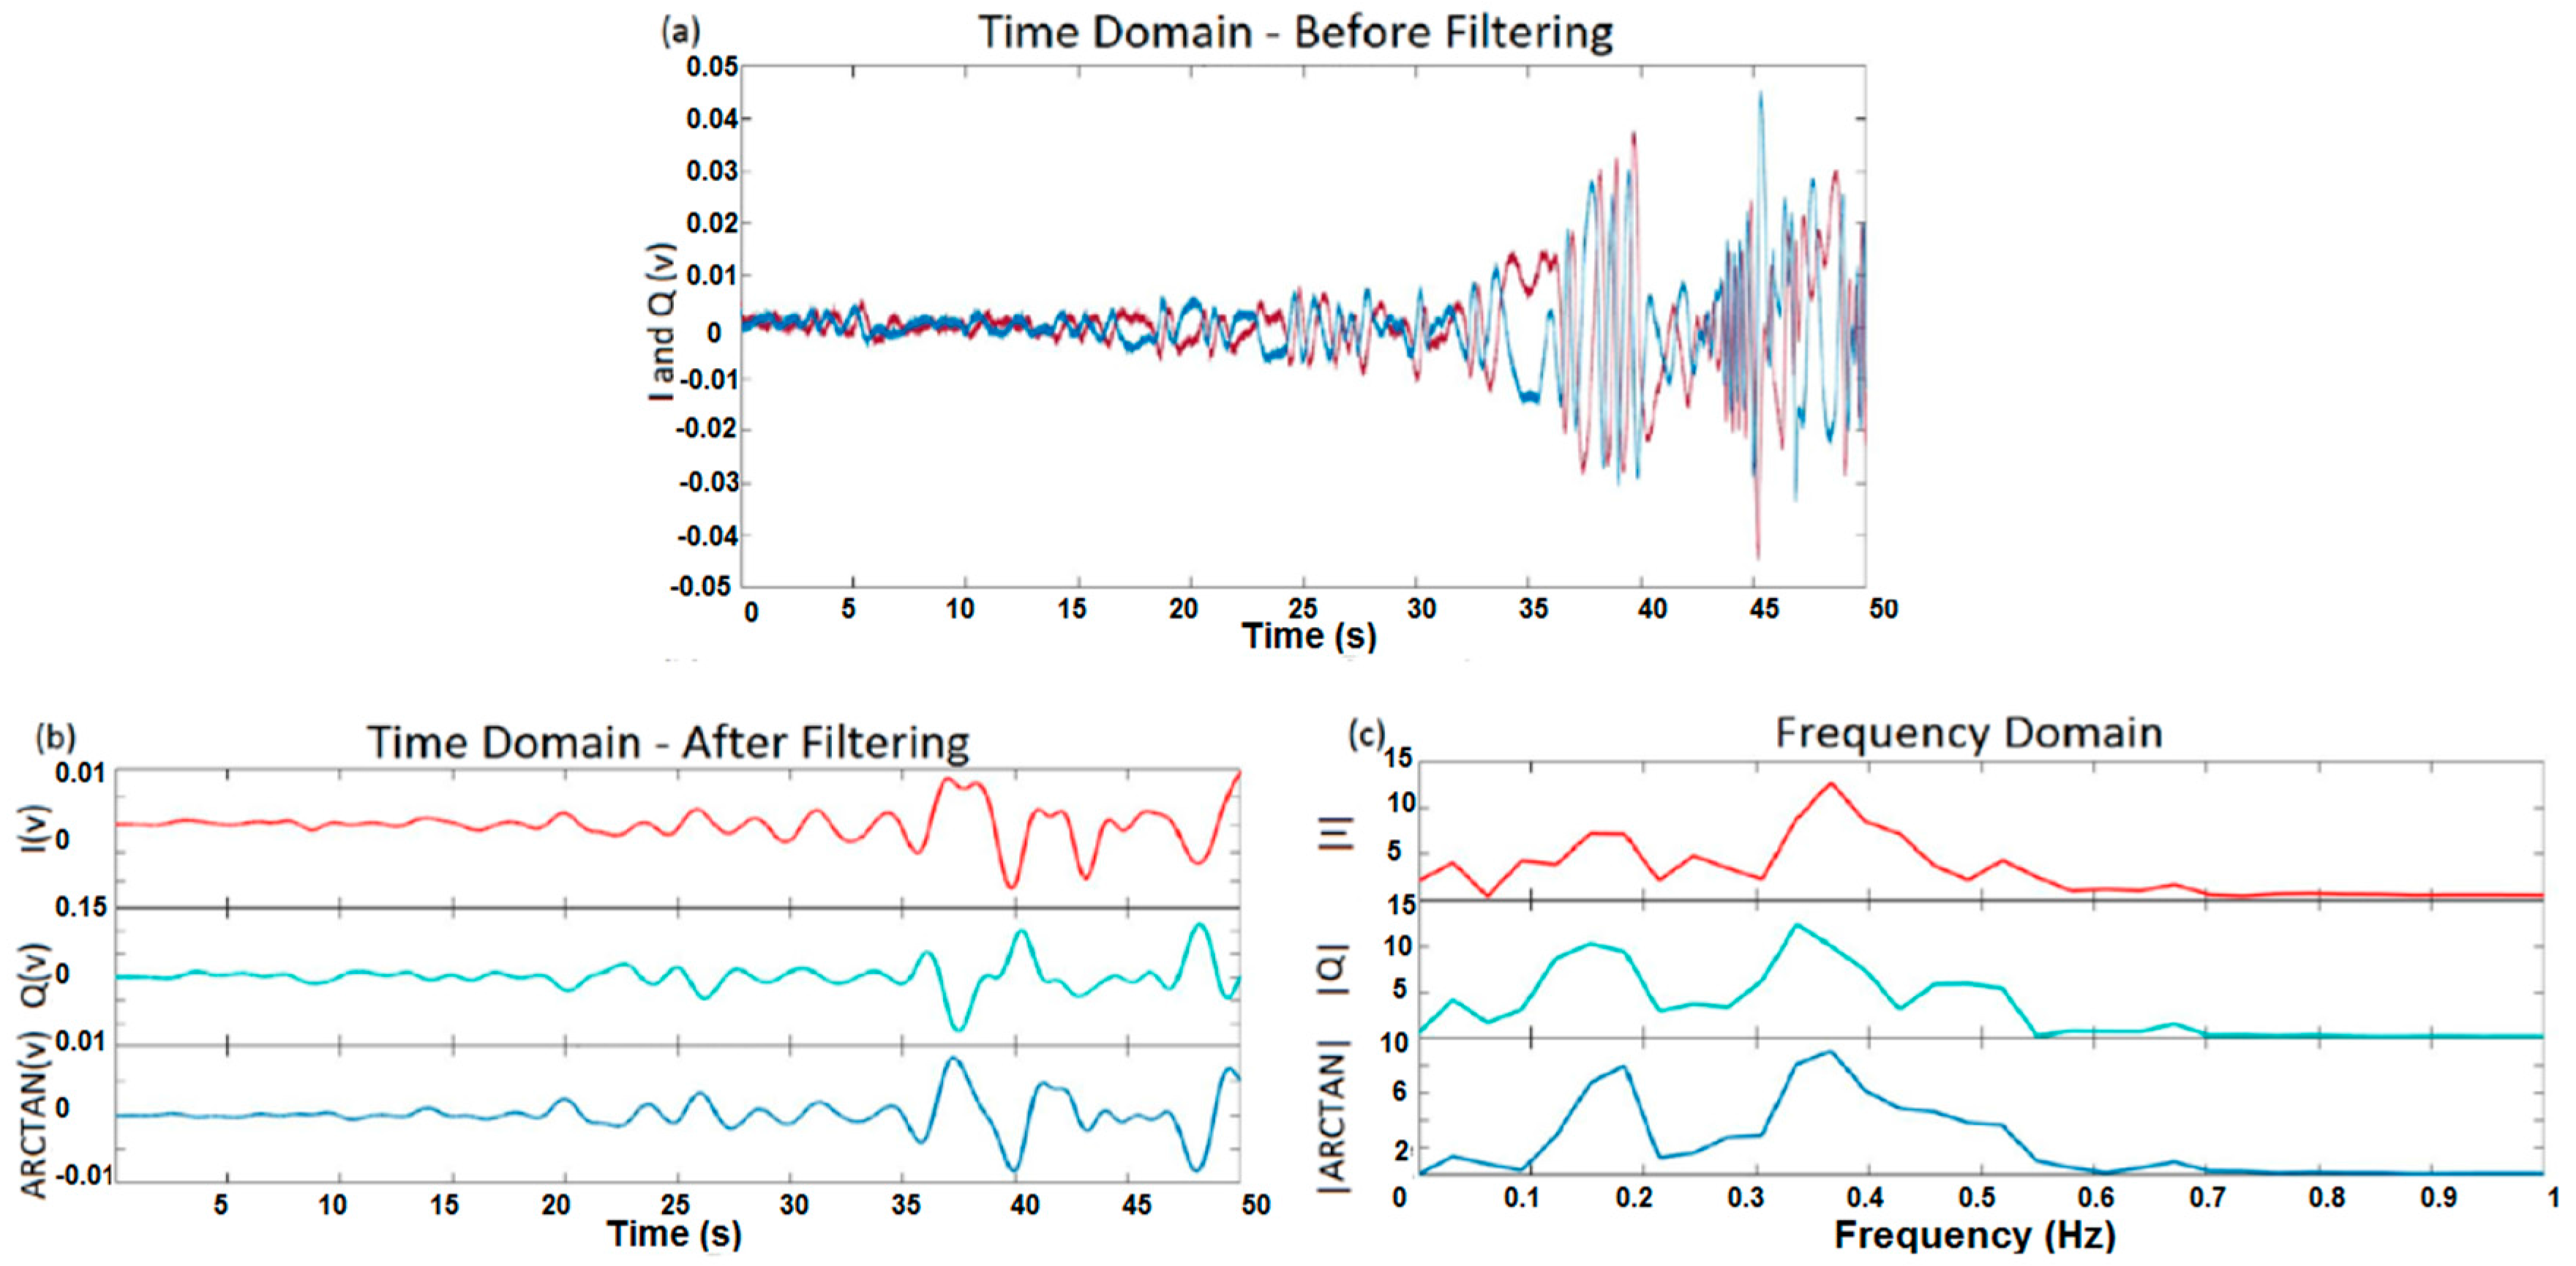
3. Experimental Results and Discussion
4. Conclusions
Acknowledgments
Author Contributions
Conflicts of Interest
References
- Chioukh, L.; Boutayeb, H.; Wu, K. F/nf Harmonic Radar System with Optimal Detection of Vital Signs. In Proceedings of the 42nd European Microwave Conference (EuMC), Amsterdam, The Netherlands, 29 October–1 November 2012.
- Park, B.K.; Boric-Lubecke, O.; Lubecke, V.M. Arctangent Demodulation with DC Offset Compensation in Quadrature Doppler Radar Receiver Systems. IEEE Trans. Microw. Theory Tech. 2007, 55, 1073–1079. [Google Scholar] [CrossRef]
- Rahman, M.S.; Jang, B.J.; Kim, K.D. A New Digital Signal Processor for Doppler Radar Cardiopulmonary Monitoring System. In Proceedings of the International Conference on Electrical and Computer Engineering (ICECE), Dhaka, Bangladesh, 20–22 December 2008.
- Thotahewa, K.M.S.; Redoute, J.M.; Yuce, M.R. A Low-Power Wearable Dual-Band Wireless Body Area Network System: Development and Experimental Evaluation. IEEE Trans. Microw. Theory Tech. 2014, 62, 2802–2811. [Google Scholar] [CrossRef]
- Fortino, G.; Giannantonio, R.; Gravina, R.; Kuryloski, P.; Jafari, R. Enabling Effective Programming and Flexible Management of Efficient Body Sensor Network Applications. IEEE Trans. Hum. Mach. Syst. 2013, 43, 115–133. [Google Scholar] [CrossRef]
- Yuce, M.R.; Khan, J. Wireless Body Area Networks: Technology, Implementation and Applications; Pan Stanford Publishing: Singapore, 2011. [Google Scholar]
- Baboli, M.; Singh, A.; Soll, B. Good Night: Sleep Monitoring Using a Physiological Radar Monitoring System Integrated with a Polysomnography System. IEEE Microw. Mag. 2015, 16, 34–41. [Google Scholar] [CrossRef]
- Girbau, D.; Ramos, A.; Lázaro, A.; Villarino, R. Remote Sensing of Vital Signs based on Doppler Radar and Zigbee Interface. In Proceedings of the 41st European Microwave Conference (EuMC), Manchester, UK, 10–13 October 2011.
- Sirisha, N.; Rani, A.D.S.; Barua, P.; Anuradha, D.; Kuloor, R. FPGA Implementation of Doppler Processing for Human Heart-beat Detection and Ranging Through a Barrier using UWB SFCW approach. In Proceedings of the 9th International Radar Symposium India (IRSI-13), Bangalore, India, 10–14 December 2013.
- Buxi, D.; Redoute, J.M.; Yuce, M.R. Cuffless Blood Pressure Estimation from the Carotid Pulse Arrival Time using Continuous Wave Radar. In Proceedings of the 37th Annual International Conference of the IEEE Engineering in Medicine and Biology Society (EMBC), Milan, Italy, 25–29 August 2015.
- Aardal, Ø.; Hamran, S.E.; Berger, T.; Paichard, Y.; Lande, T.S. Chest Movement Estimation from Radar Modulation caused by Heartbeats. In Proceedings of the IEEE Biomedical Circuits and Systems Conference (BioCAS), San Diego, CA, USA, 10–12 November 2011.
- Girbau, D.; Ramos, A.; Lázaro, A.; Villarino, R. Remote Sensing of Vital Signs Using a Doppler Radar and Diversity to Overcome Null Detection. IEEE Sens. J. 2012, 12, 512–518. [Google Scholar] [CrossRef]
- Droitcour, A.D.; Boric-Lubecke, O.; Lubecke, V.M.; Lin, J.; Kovacs, G.T.A. Range Correlation and I/Q Performance Benefits in Single-chip Silicon Doppler Radars for Noncontact Cardiopulmonary Monitoring. IEEE Trans. Microw. Theory Tech. 2004, 52, 838–848. [Google Scholar] [CrossRef]
- Ossberger, G.; Buchegger, T.; Schimback, E.; Stelzer, A.; Weigel, R. Non-invasive Respiratory Movement Detection and Monitoring of Hidden Humans using Ultra Wideband Pulse Radar. In Proceedings of the International Workshop on Ultra Wideband Systems Joint with Conference on Ultrawideband Systems and Technologies, Joint UWBST & IWUWBS, Kyoto, Japan, 18–21 May 2004.
- Massagram, W.; Hafner, N.M.; Park, B.K.; Lubecke, V.M.; Host-Madsen, A.; Boric-Lubecke, O. Feasibility of Heart Rate Variability Measurement from Quadrature Doppler Radar Using Arctangent Demodulation with DC Offset Compensation. In Proceedings of the 29th Annual International Conference of the IEEE Engineering in Medicine and Biology Society, Lyon, France, 23–26 August 2007.
- Yu, X.; Li, C.; Lin, J. Noise Analysis for Noncontact Vital Sign Detectors. In Proceedings of the IEEE 11th Annual Wireless and Microwave Technology Conference (WAMICON), Melbourne Beach, FL, USA, 12–13 April 2010.
- Li, C.; Ling, J.; Li, J.; Lin, J. Accurate Doppler Radar Noncontact Vital Sign Detection Using the RELAX Algorithm. IEEE Trans. Instrume. Meas. 2010, 59, 687–695. [Google Scholar]
- Lien, P.H.; Lin, F.L.; Chuang, H.R. Computer Simulation of the RF System Effects on a Millimeter-wave Doppler Radar for Human Vital-signal Estimation. In Proceedings of the 6th European Radar Conference EuRAD, Rome, Italy, 30 September–2 October 2009.
- Mercuri, M.; Soh, P.J.; Pandey, G.; Karsmakers, P.; Vandenbosch, G.A.E.; Leroux, P.; Schereus, D. Analysis of an Indoor Biomedical Radar-Based System for Health Monitoring. IEEE Trans. Microw. Theory Tech. 2013, 61, 2061–2068. [Google Scholar] [CrossRef]
- Wang, F.K.; Fang, C.H.; Horng, T.S.; Peng, K.C.; Li, J.Y.; Chen, C.C. Concurrent Vital Sign and Position Sensing of Multiple Individuals Using Self-Injection-Locked Tags and Injection-Locked I/Q Receivers with Arctangent Demodulation. IEEE Trans. Microw. Theory Techn. 2013, 61, 4689–4699. [Google Scholar] [CrossRef]
- Wang, F.K.; Li, C.J.; Hsiao, C.H.; Horng, T.S.; Lin, J.; Peng, K.C.; Jau, J.K.; Li, J.Y.; Chen, C.C. A Novel Vital-Sign Sensor Based on a Self-Injection-Locked Oscillator. IEEE Trans. Microw. Theory Tech. 2010, 58, 4112–4120. [Google Scholar] [CrossRef]
- Gravina, R.; Alinia, P.; Ghasemzadeh, H.; Fortino, G. Multi-Sensor Fusion in Body Sensor Networks: State-of-the-art and research challenges. Inf. Fusion 2017, 35, 68–80. [Google Scholar] [CrossRef]


| References | P/S 1 | NSST 2 | NV 3 | ST 4 | SR 5 (Meter) | Technology | Frequency |
|---|---|---|---|---|---|---|---|
| [10] | Lying | 1 | 10 | HB 6 | on Body | CW 8 Radar | 1 GHz |
| [7] | Vertical: Standing/facing Antenna | 1 | 1 | RR 7 | No Contact | CW 8 Doppler Radar | 2.45 GHz |
| [4] | Standing/walking | 1 and 2 | 1 | HB 6 | Wearable Sensor | UWB 9 Wireless Communication | 3.5–4.5 GHz |
| [14] | Standing | 1 | 1 | RR 7 | 1 to 5 | UWB 9 Radar | - |
| [2,15] | Sitting/Supine | 1 | 3 | HB 6 | 1 | Quadrature Doppler Radar | 2.4 GHz |
| [8] | Standing | 1 | 1 | HB 6/RR 7 | Doppler Radar | 2.4 GHz | |
| [1] | Standing | 1 | 1 | HB 6/RR 7 | 1 | CW 8 Radar | 12 GHz/24 GHz |
| [9] | Standing | 1 | 1 | HB 6/RR 7 | 0.55 | UWB 9 Radar/Stepped Frequency CW 8 | 3 GHz |
| [16] | Sitting | 1 | 1 | HB 6/RR 7 | 1 | Doppler Radar | 5.8 GHz |
| [11] | Lying | 1 | 1 | HB 6 | 0.5 | Radar | 10, 15/18 GHz |
| [3] | Simulation | HB 6 | Direct Conversion Doppler Radar | 2.4 GHz | |||
| [17] | Sitting | 1 | 1 | HB 6 | Doppler Radar | 5.8 GHz/20 GHz | |
| [18] | Simulation | HB 6/RR 7 | 0.5, 1 & 2 | Millimetre-Wave Doppler Radar | 60 GHz | ||
| [19] | Walking | 1 | 2 | Target Position | 5 × 5 | UWB 9 Radar | 2.45 GHz |
| [20,21] | Walking | Multi | HB 6/RR 7 | 8 × 8 | Injection Locked I/Q Receivers | 2.4 GHz | |
| This Work | Standing/walking | 1 and 2 | 8 | RR 6 | 0.3–1.5 | CW 8 Radar | 4 GHz |
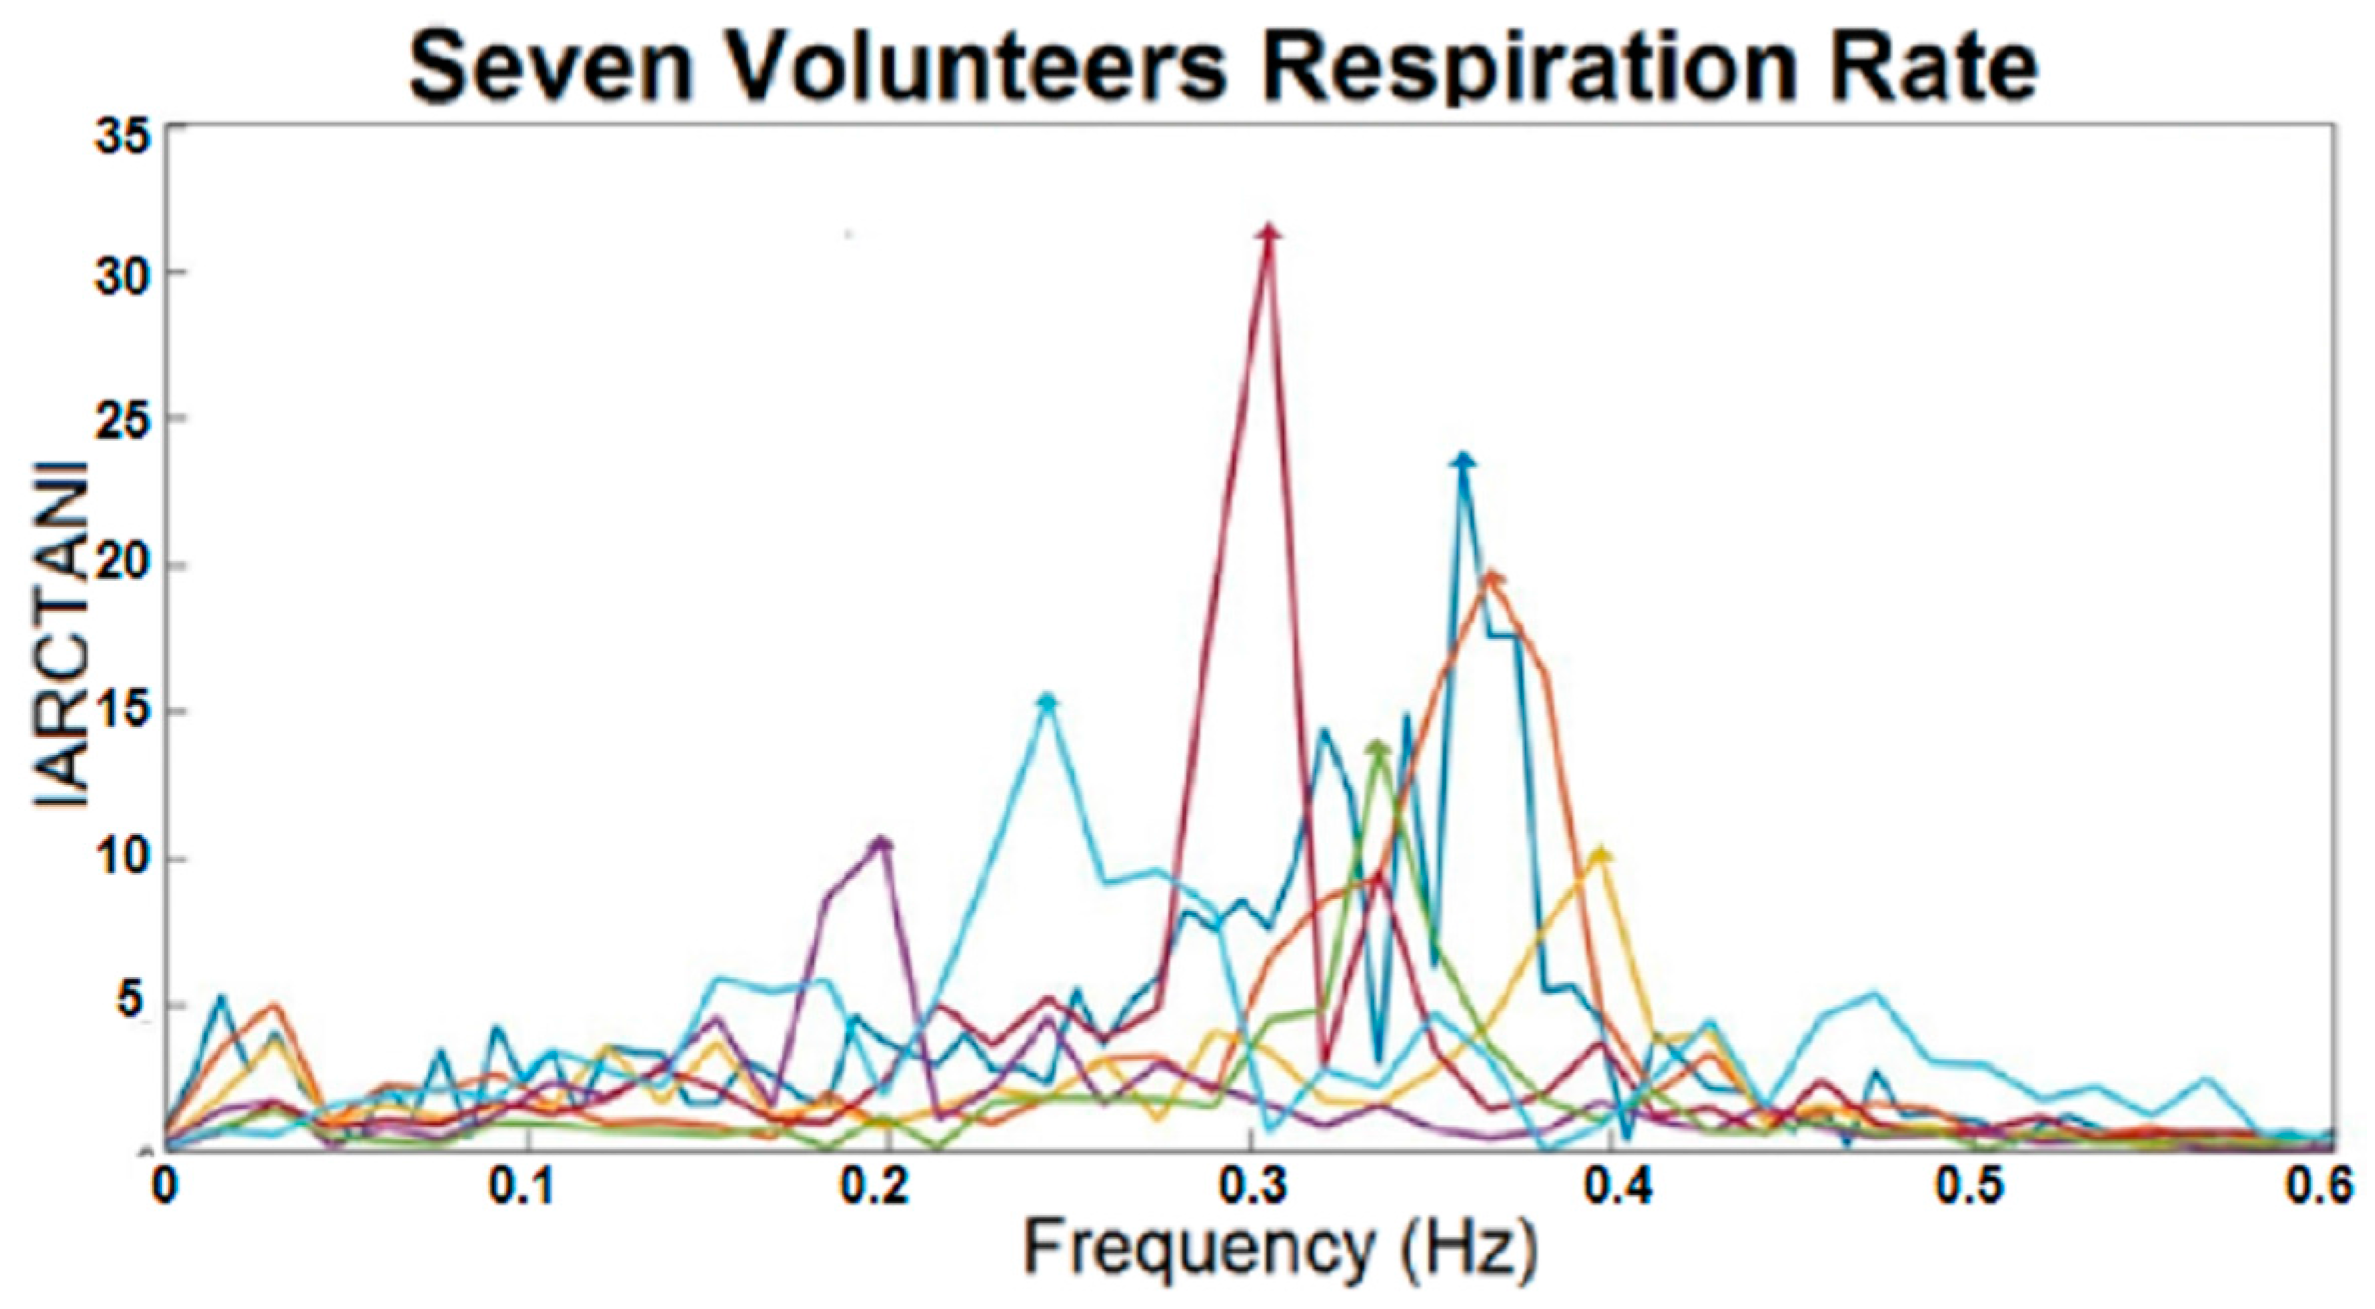
| Colour Representing Each Subject | Respiration Rate (Hz) |
|---|---|
 | 0.3052 |
 | 0.2441 |
 | 0.3586 |
 | 0.3357 |
 | 0.3662 |
 | 0.3967 |
 | 0.1984 |
© 2017 by the authors. Licensee MDPI, Basel, Switzerland. This article is an open access article distributed under the terms and conditions of the Creative Commons Attribution (CC BY) license ( http://creativecommons.org/licenses/by/4.0/).
Share and Cite
Pour Ebrahim, M.; Sarvi, M.; Yuce, M.R. A Doppler Radar System for Sensing Physiological Parameters in Walking and Standing Positions. Sensors 2017, 17, 485. https://doi.org/10.3390/s17030485
Pour Ebrahim M, Sarvi M, Yuce MR. A Doppler Radar System for Sensing Physiological Parameters in Walking and Standing Positions. Sensors. 2017; 17(3):485. https://doi.org/10.3390/s17030485
Chicago/Turabian StylePour Ebrahim, Malikeh, Majid Sarvi, and Mehmet Rasit Yuce. 2017. "A Doppler Radar System for Sensing Physiological Parameters in Walking and Standing Positions" Sensors 17, no. 3: 485. https://doi.org/10.3390/s17030485
APA StylePour Ebrahim, M., Sarvi, M., & Yuce, M. R. (2017). A Doppler Radar System for Sensing Physiological Parameters in Walking and Standing Positions. Sensors, 17(3), 485. https://doi.org/10.3390/s17030485