An Ultra-High Element Density pMUT Array with Low Crosstalk for 3-D Medical Imaging


Abstract
: A ∼1 MHz piezoelectric micromachined ultrasonic transducer (pMUT) array with ultra-high element density and low crosstalk is proposed for the first time. This novel pMUT array is based on a nano-layer spin-coating lead zirconium titanium film technique and can be fabricated with high element density using a relatively simple process. Accordingly, key fabrication processes such as thick piezoelectric film deposition, low-stress Si-SOI bonding and bulk silicon removal have been successfully developed. The novel fine-pitch 6 × 6 pMUT arrays can all work at the desired frequency (∼1 MHz) with good uniformity, high performance and potential IC integration compatibility. The minimum interspace is ∼20 μm, the smallest that has ever been achieved to the best of our knowledge. These arrays can be potentially used to steer ultrasound beams and implement high quality 3-D medical imaging applications.1. Introduction
Ultrasonography is an indispensable method for medical imaging. Its importance shows in several ways. Firstly, it is inexpensive compared with other imaging techniques (CT, PET or MRI); secondly, it is harmless to the patient in medical practice; thirdly, with ultrasonography it is easy to get real-time imagery [1–5]. Advances in electronics over the years have brought extraordinary improvements to all the parts of ultrasound imagers but little to the transducer [6–9]. Regarding the existing 2-D transducer arrays, some of their significant challenges include complex fabrication, high manufacture cost and bulky volume [10–12]. Commercial 2-D transducer probes are bulky structures and typically limited to arrays with an element pitch of 100 μm. The large pitch and scale of the transducer array limits the operation frequency, which will heavily influence the axial and lateral resolution of the ultrasonic imaging. With the development of MEMS, piezoelectric micromachined ultrasonic transducers (pMUT) [13–15] have become a very promising alternative to replace traditional bulk ceramic transducers. Some pMUT prototypes with miniaturized size, good performance and excellent consistency have been reported [16–18]. However, for the existing pMUT structure, it is still difficult to fabricate compact arrays. The smallest interspace of extant pMUT arrays is about 30 μm achieving by DRIE from the back through the whole wafer [19]. The element density has thus become the bottleneck to the development of pMUT arrays. Increasing the element density is crucial to realize 2-D pMUT arrays for practical 3-D medical imaging. Moreover, the crosstalk between different elements of the array should be controlled while reducing the interspace [20].
In our previous work, we reported on the manufacture of 6 × 6 pMUT arrays with element pitches down to 250 μm [21,22] and 150 μm [23] using a conventional silicon wet-etching method. Recently, we also reported some initial results on the reverse-bonding structure [15]. However, there is no report on device performance and simulation.
In this paper, a ∼1 MHz pMUT array based on an Si-SOI wafer bonding technique with ultra-high element density and low crosstalk is proposed for the first time. The minimum interspace is ∼20 μm. The layer-by-layer spin-coating nano-thickness lead zirconium titanium (PZT) film technique is feasible to obtain high frequency.
2. Experimental Section
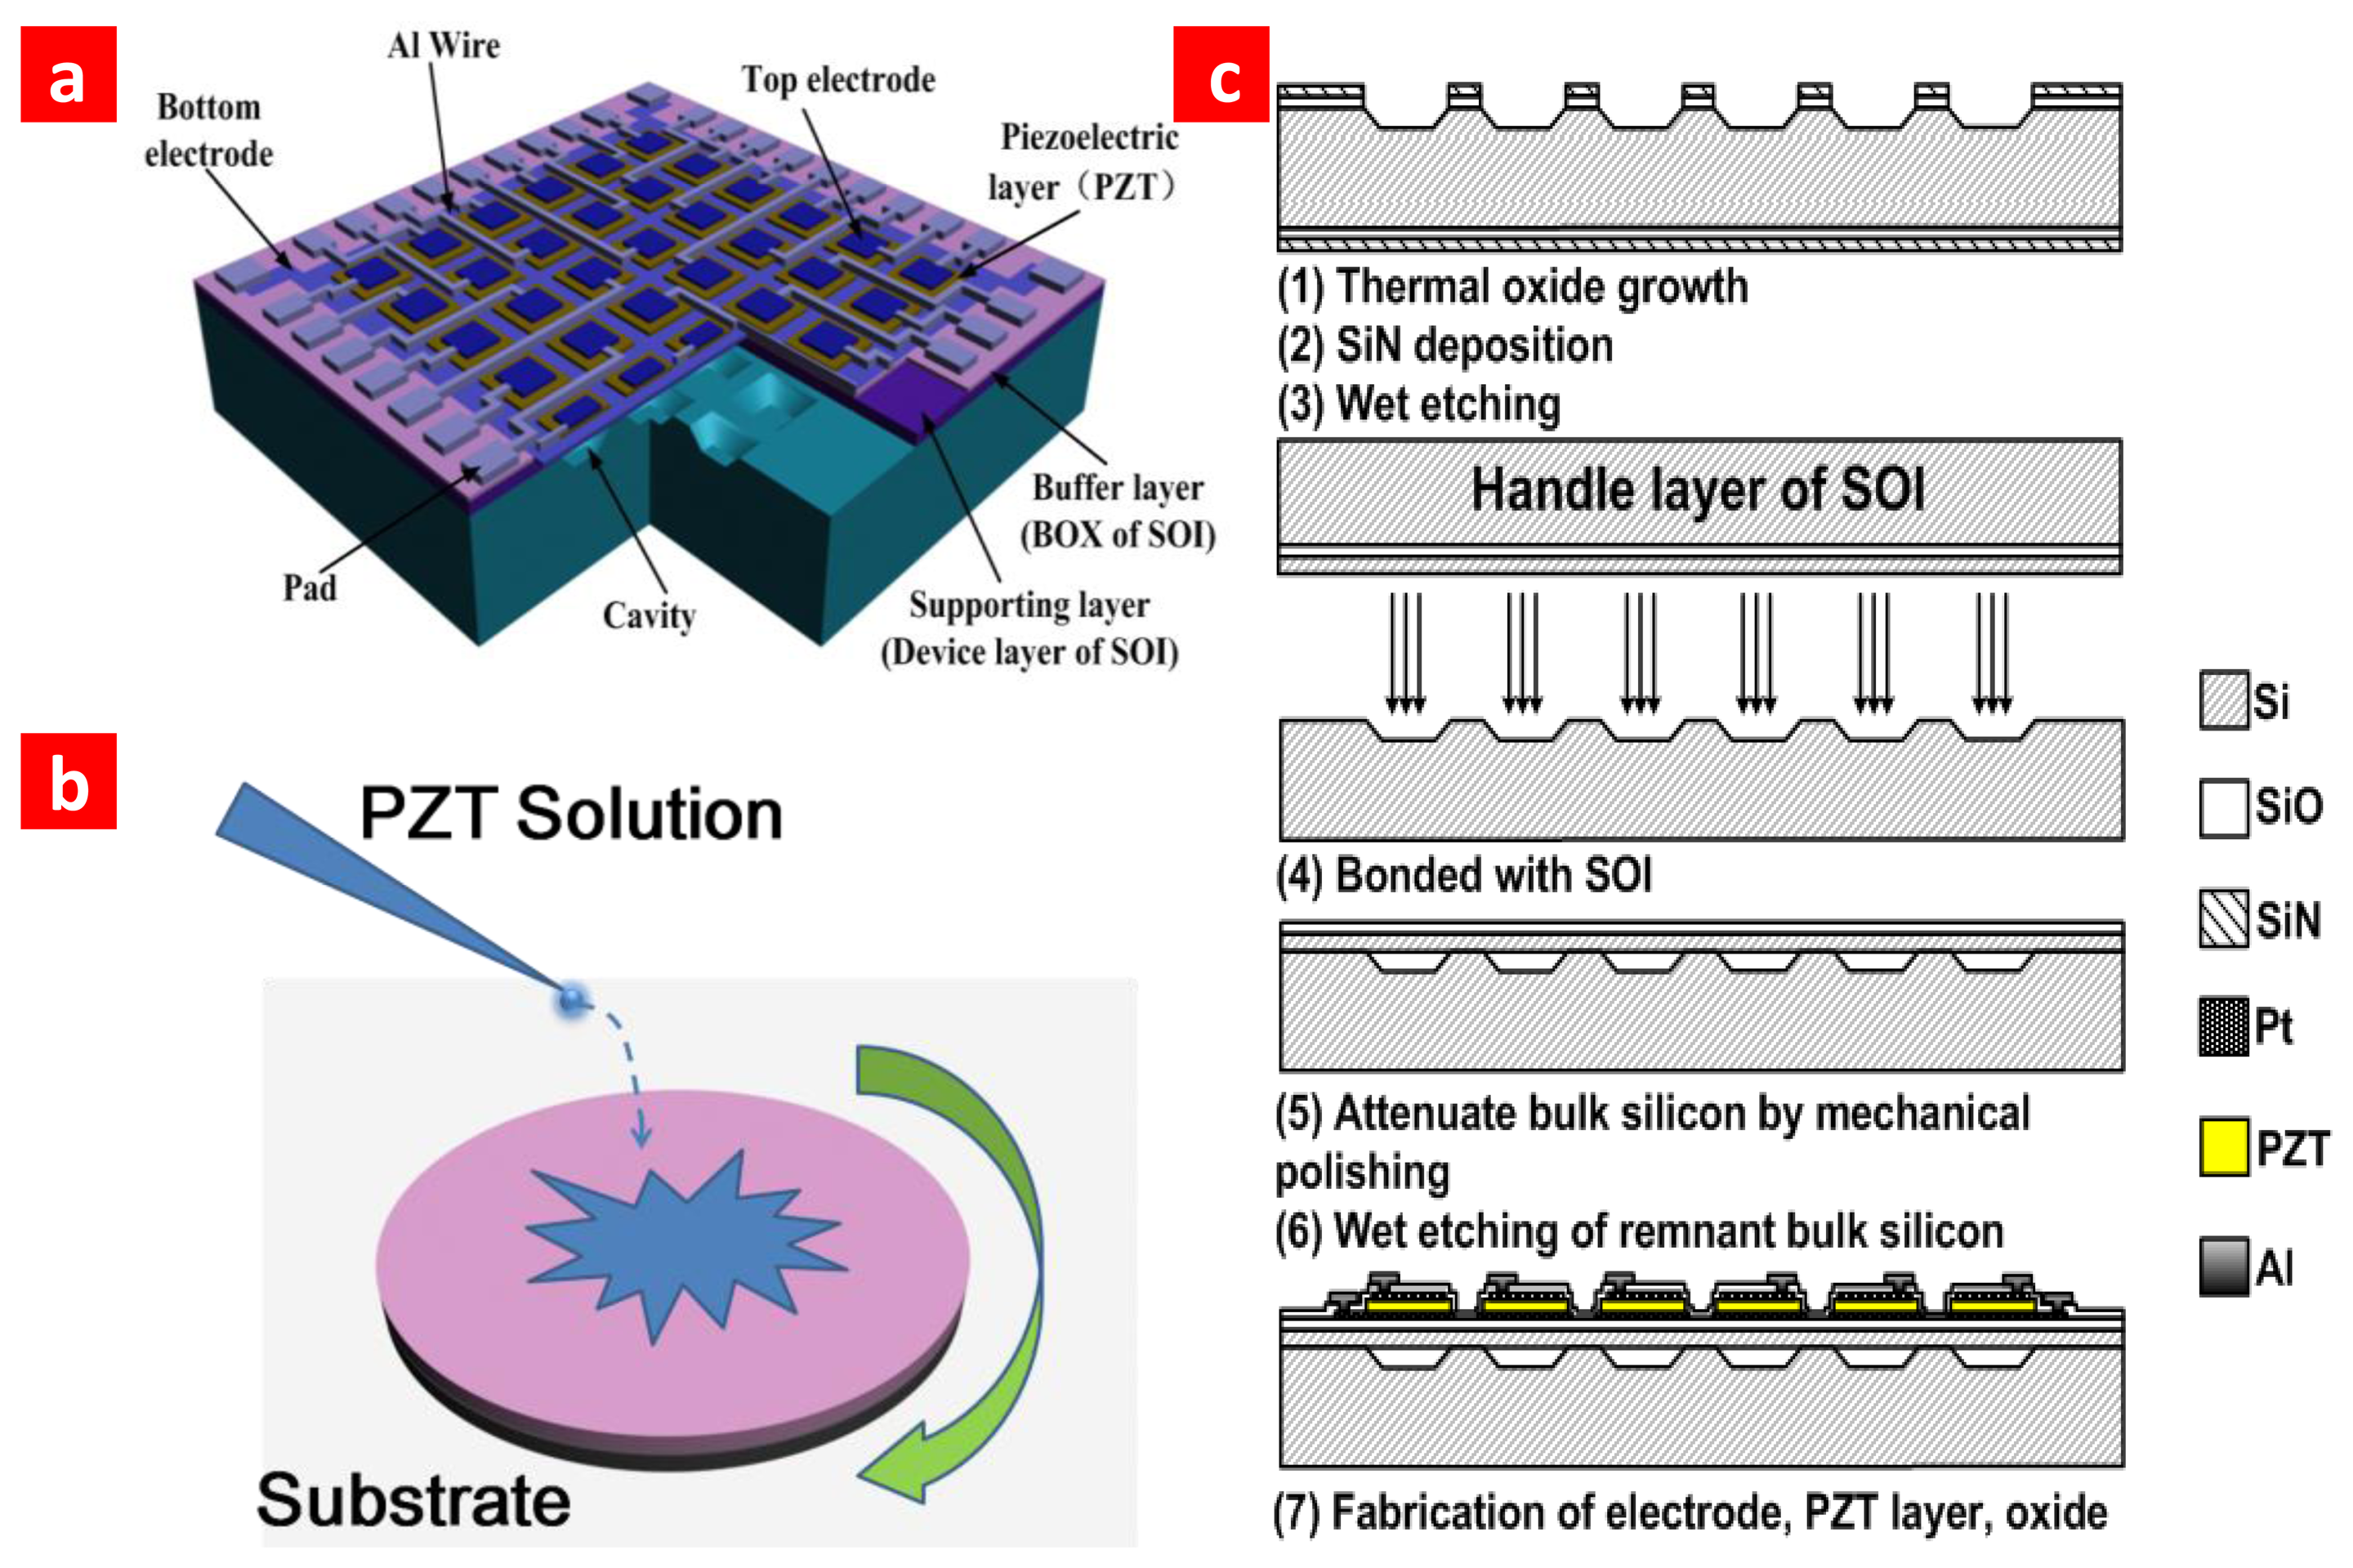
Figure 1a shows a pictorial diagram of our novel pMUT array. The piezoelectric layer is sandwiched between electrodes. A four-edge clamped membrane structure is designed to develop a high-frequency device. A schematic depiction of spin-coating PZT film is shown in Figure 1b. Thickness parameters of the structure are listed in Table 1. Each layer is estimated to be 100 nm. As previously reported, the 2 μm PZT film can be fabricated by layer-by-layer spin-coating PZT solution [15]. The fabrication process of the pMUT array is shown schematically in Figure 1c. First, high-density cavities were etched by potassium hydroxide (KOH) etching solution. Then the wafer was bonded to the device layer of SOI. To simplify fabrication and reduce residual stress, the Si wafer and SOI were bonded in atmosphere. The maximum temperature the wafer exposed in our process is 900 °C. We could use PT/PZT/PT structure to reduce the temperature to 600–700 °C [24]. This would make this technology compatible for IC integration.
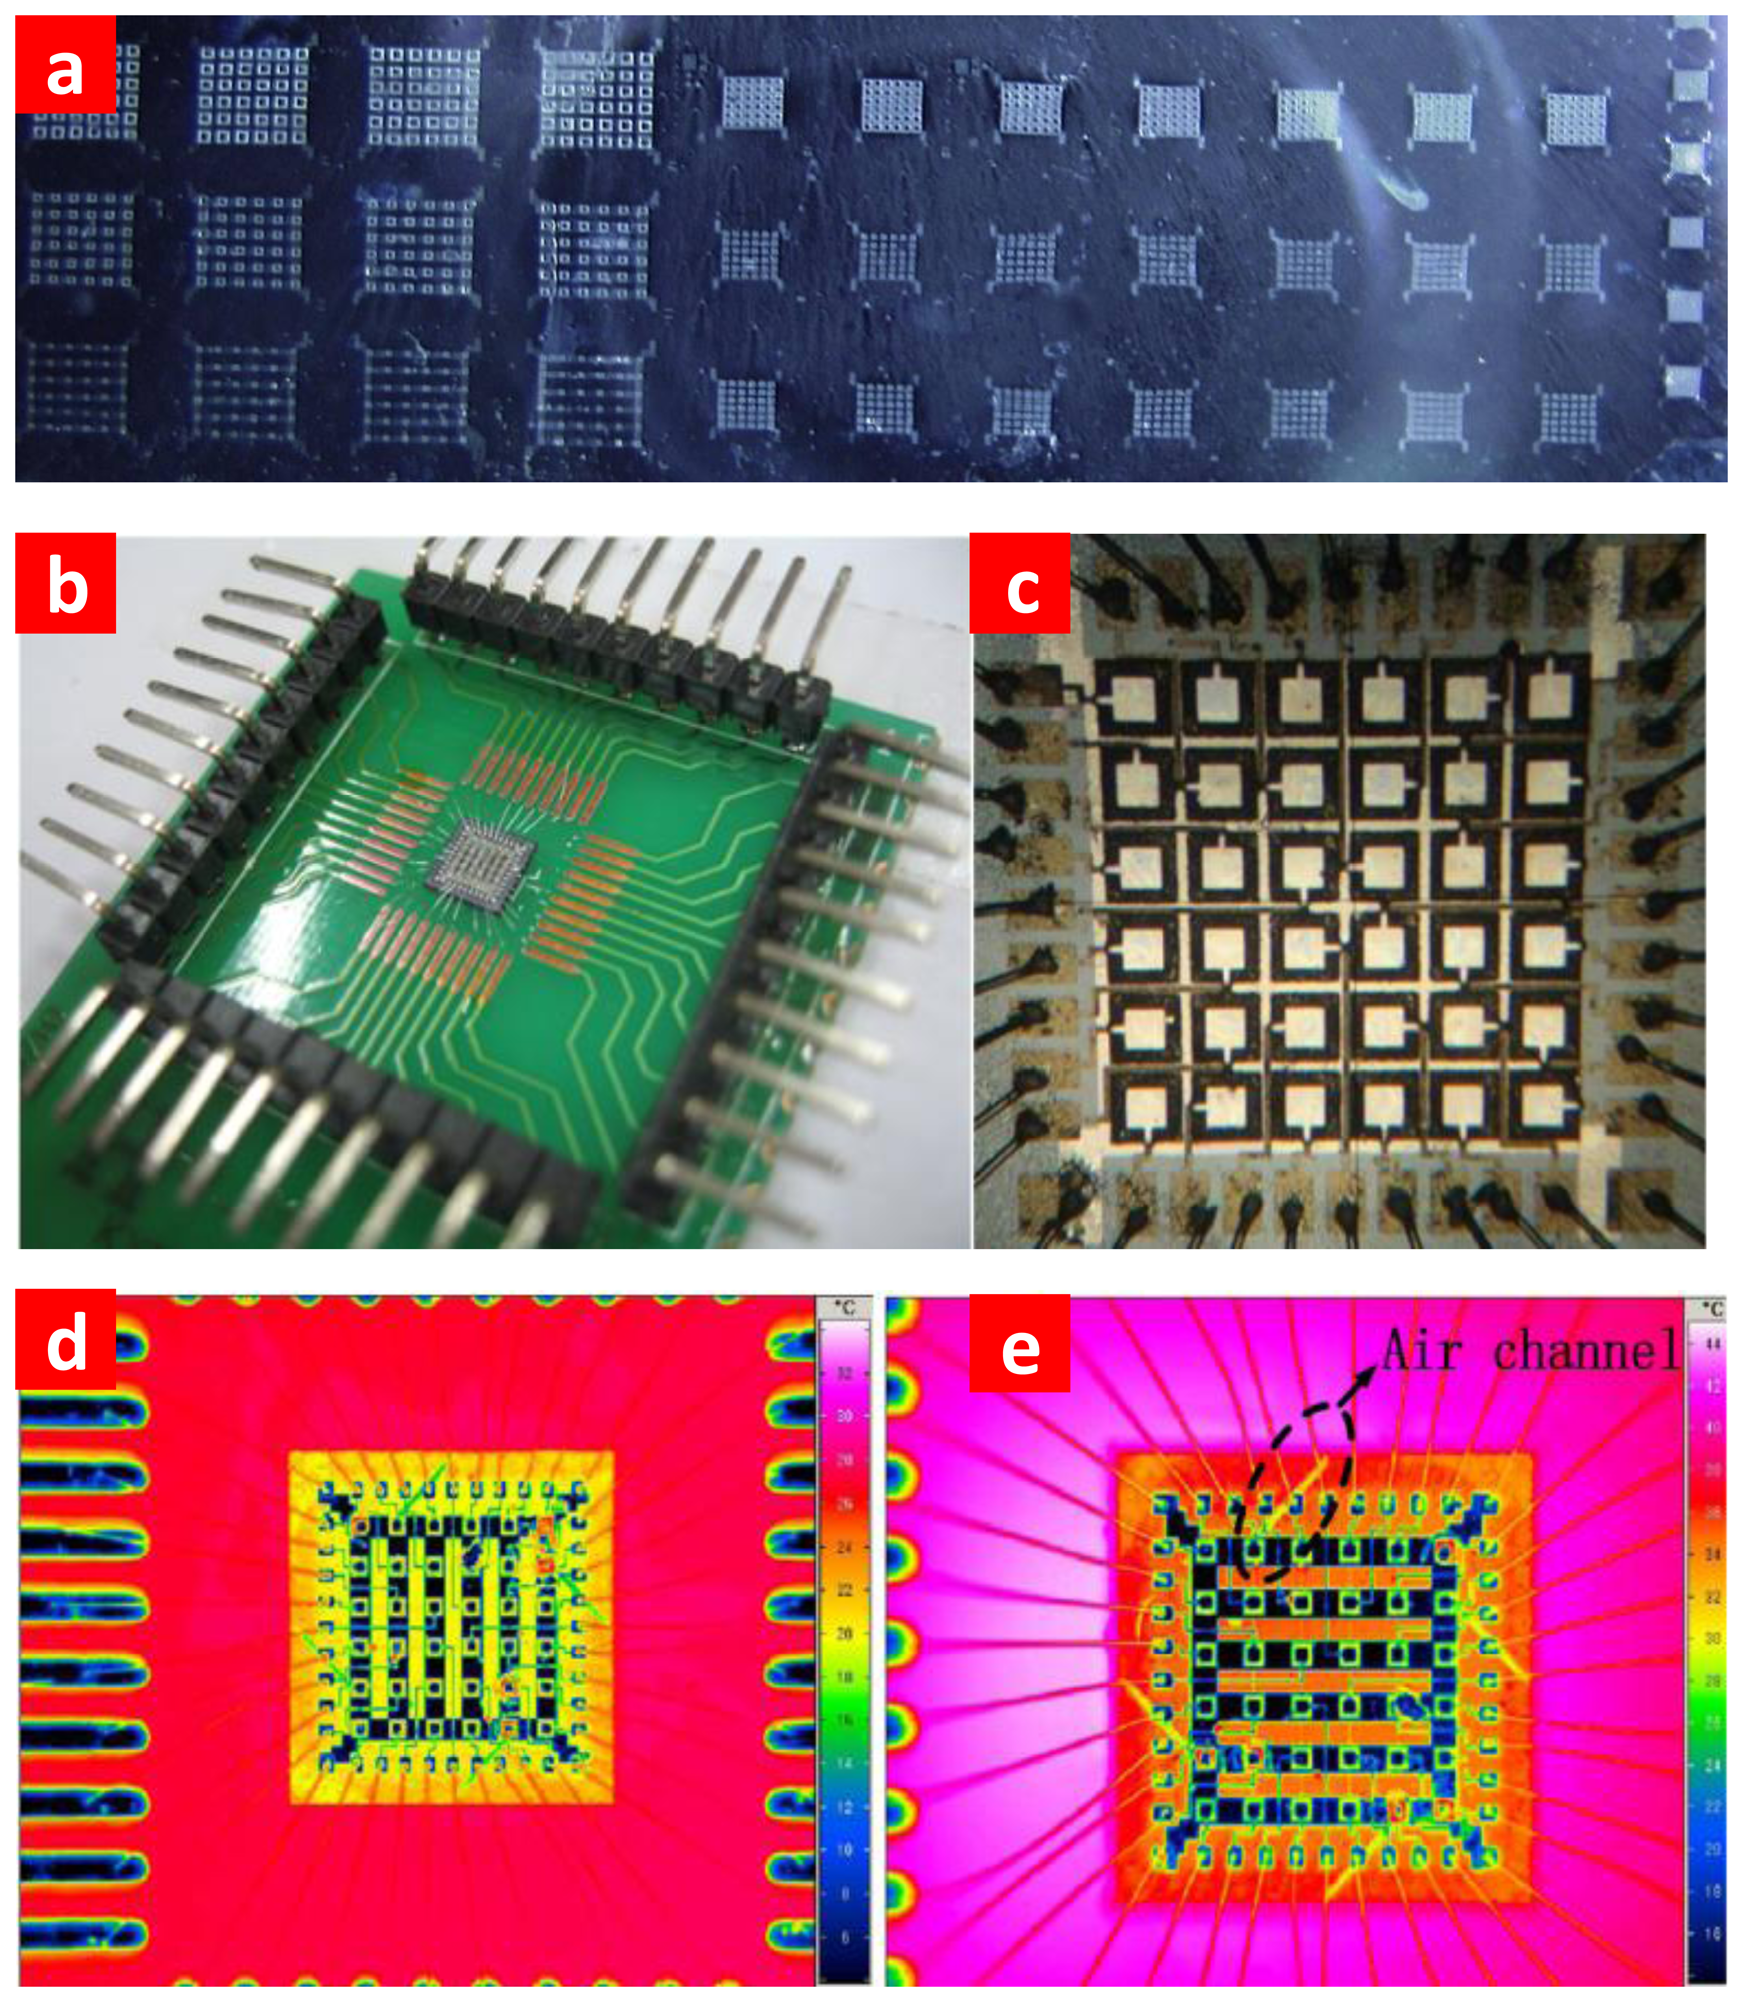
The wafer after SOI bonding is shown in Figure 2a. Photograph of the sample and full view of the high-density array are shown in Figure 2b,c. In order to avoid blowing up during annealing, an air channel structure was designed. To confirm that the air channel is complete and unblocked after fabrication, we used a thermal infrared imager (Image IR) to analyze the underneath structure. The thermal infrared image was captured by a Fluke Ti45. As the thermal conductivity of the air and silicon are different, we can see the air channel stretched to the edge in Figure 2d,e. From the infrared photos shown in Figure 2d,e, the air channel extends to the edge without blocking.
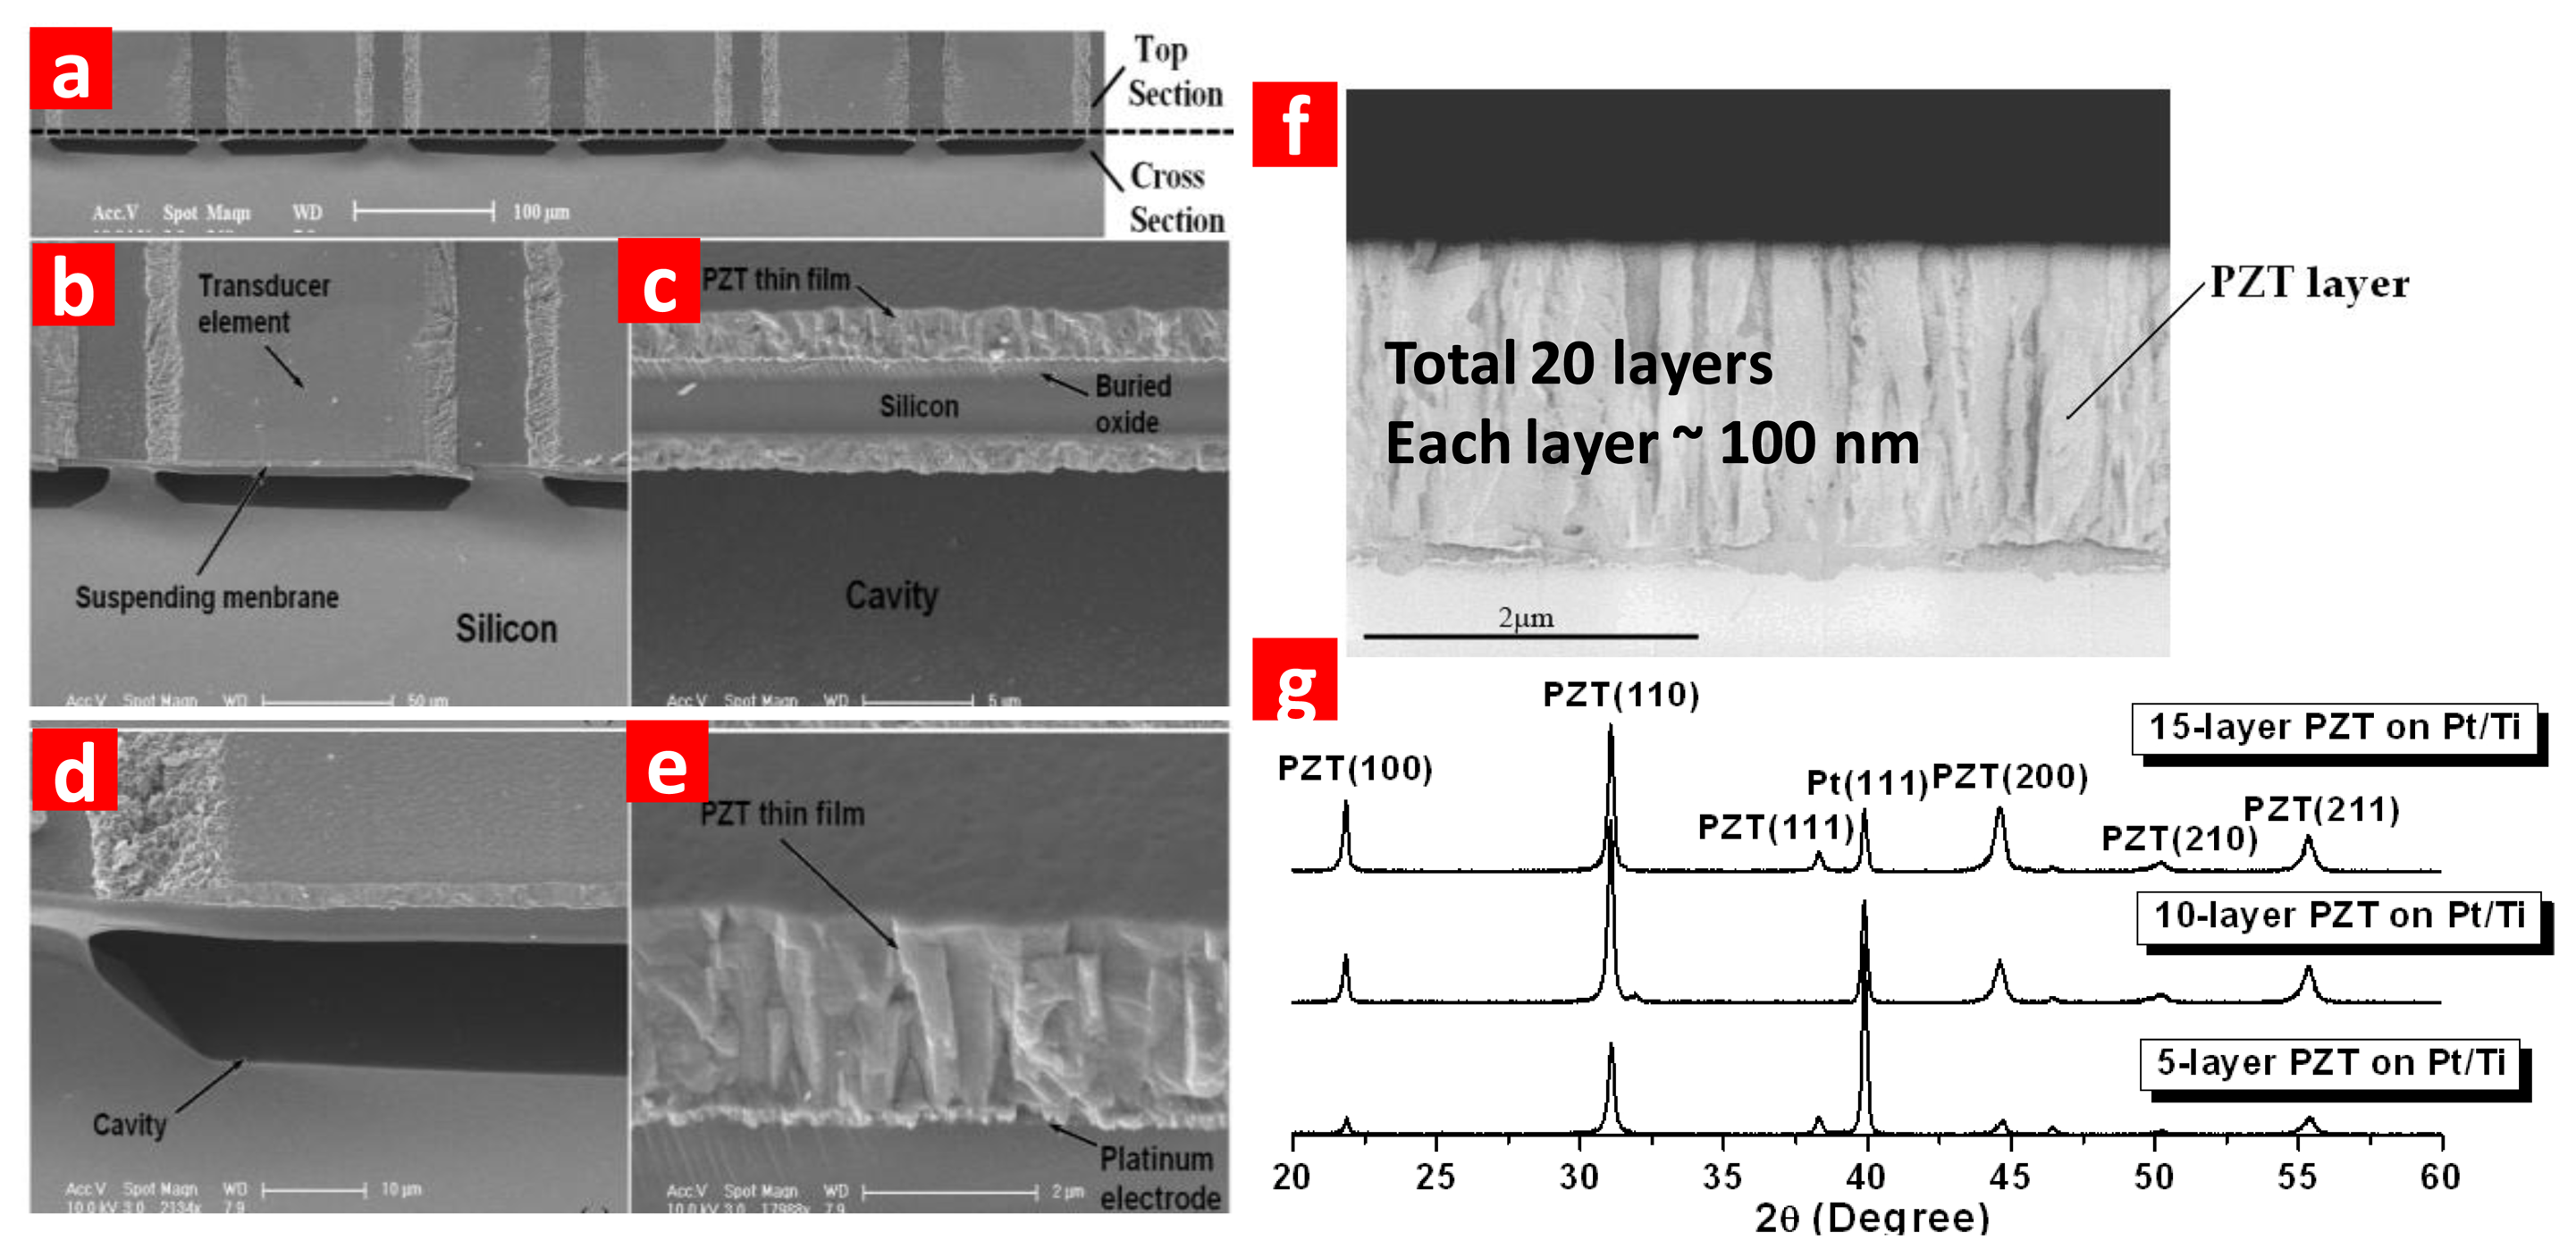
SEM photos in Figure 3a–e clearly show the element surface, the multi-layer structure and the ∼20 μm interspace. The fabricated transducers need to be poled before testing. Lead zirconium titanium (PZT) is used as piezoelectric layer. As transduction layer, thicker PZT brings enhanced driving capability to the device and improved sensitivity. SEM photo and XRD result of the PZT film prepared by an optimized sol-gel method are shown in Figure 3f,g.
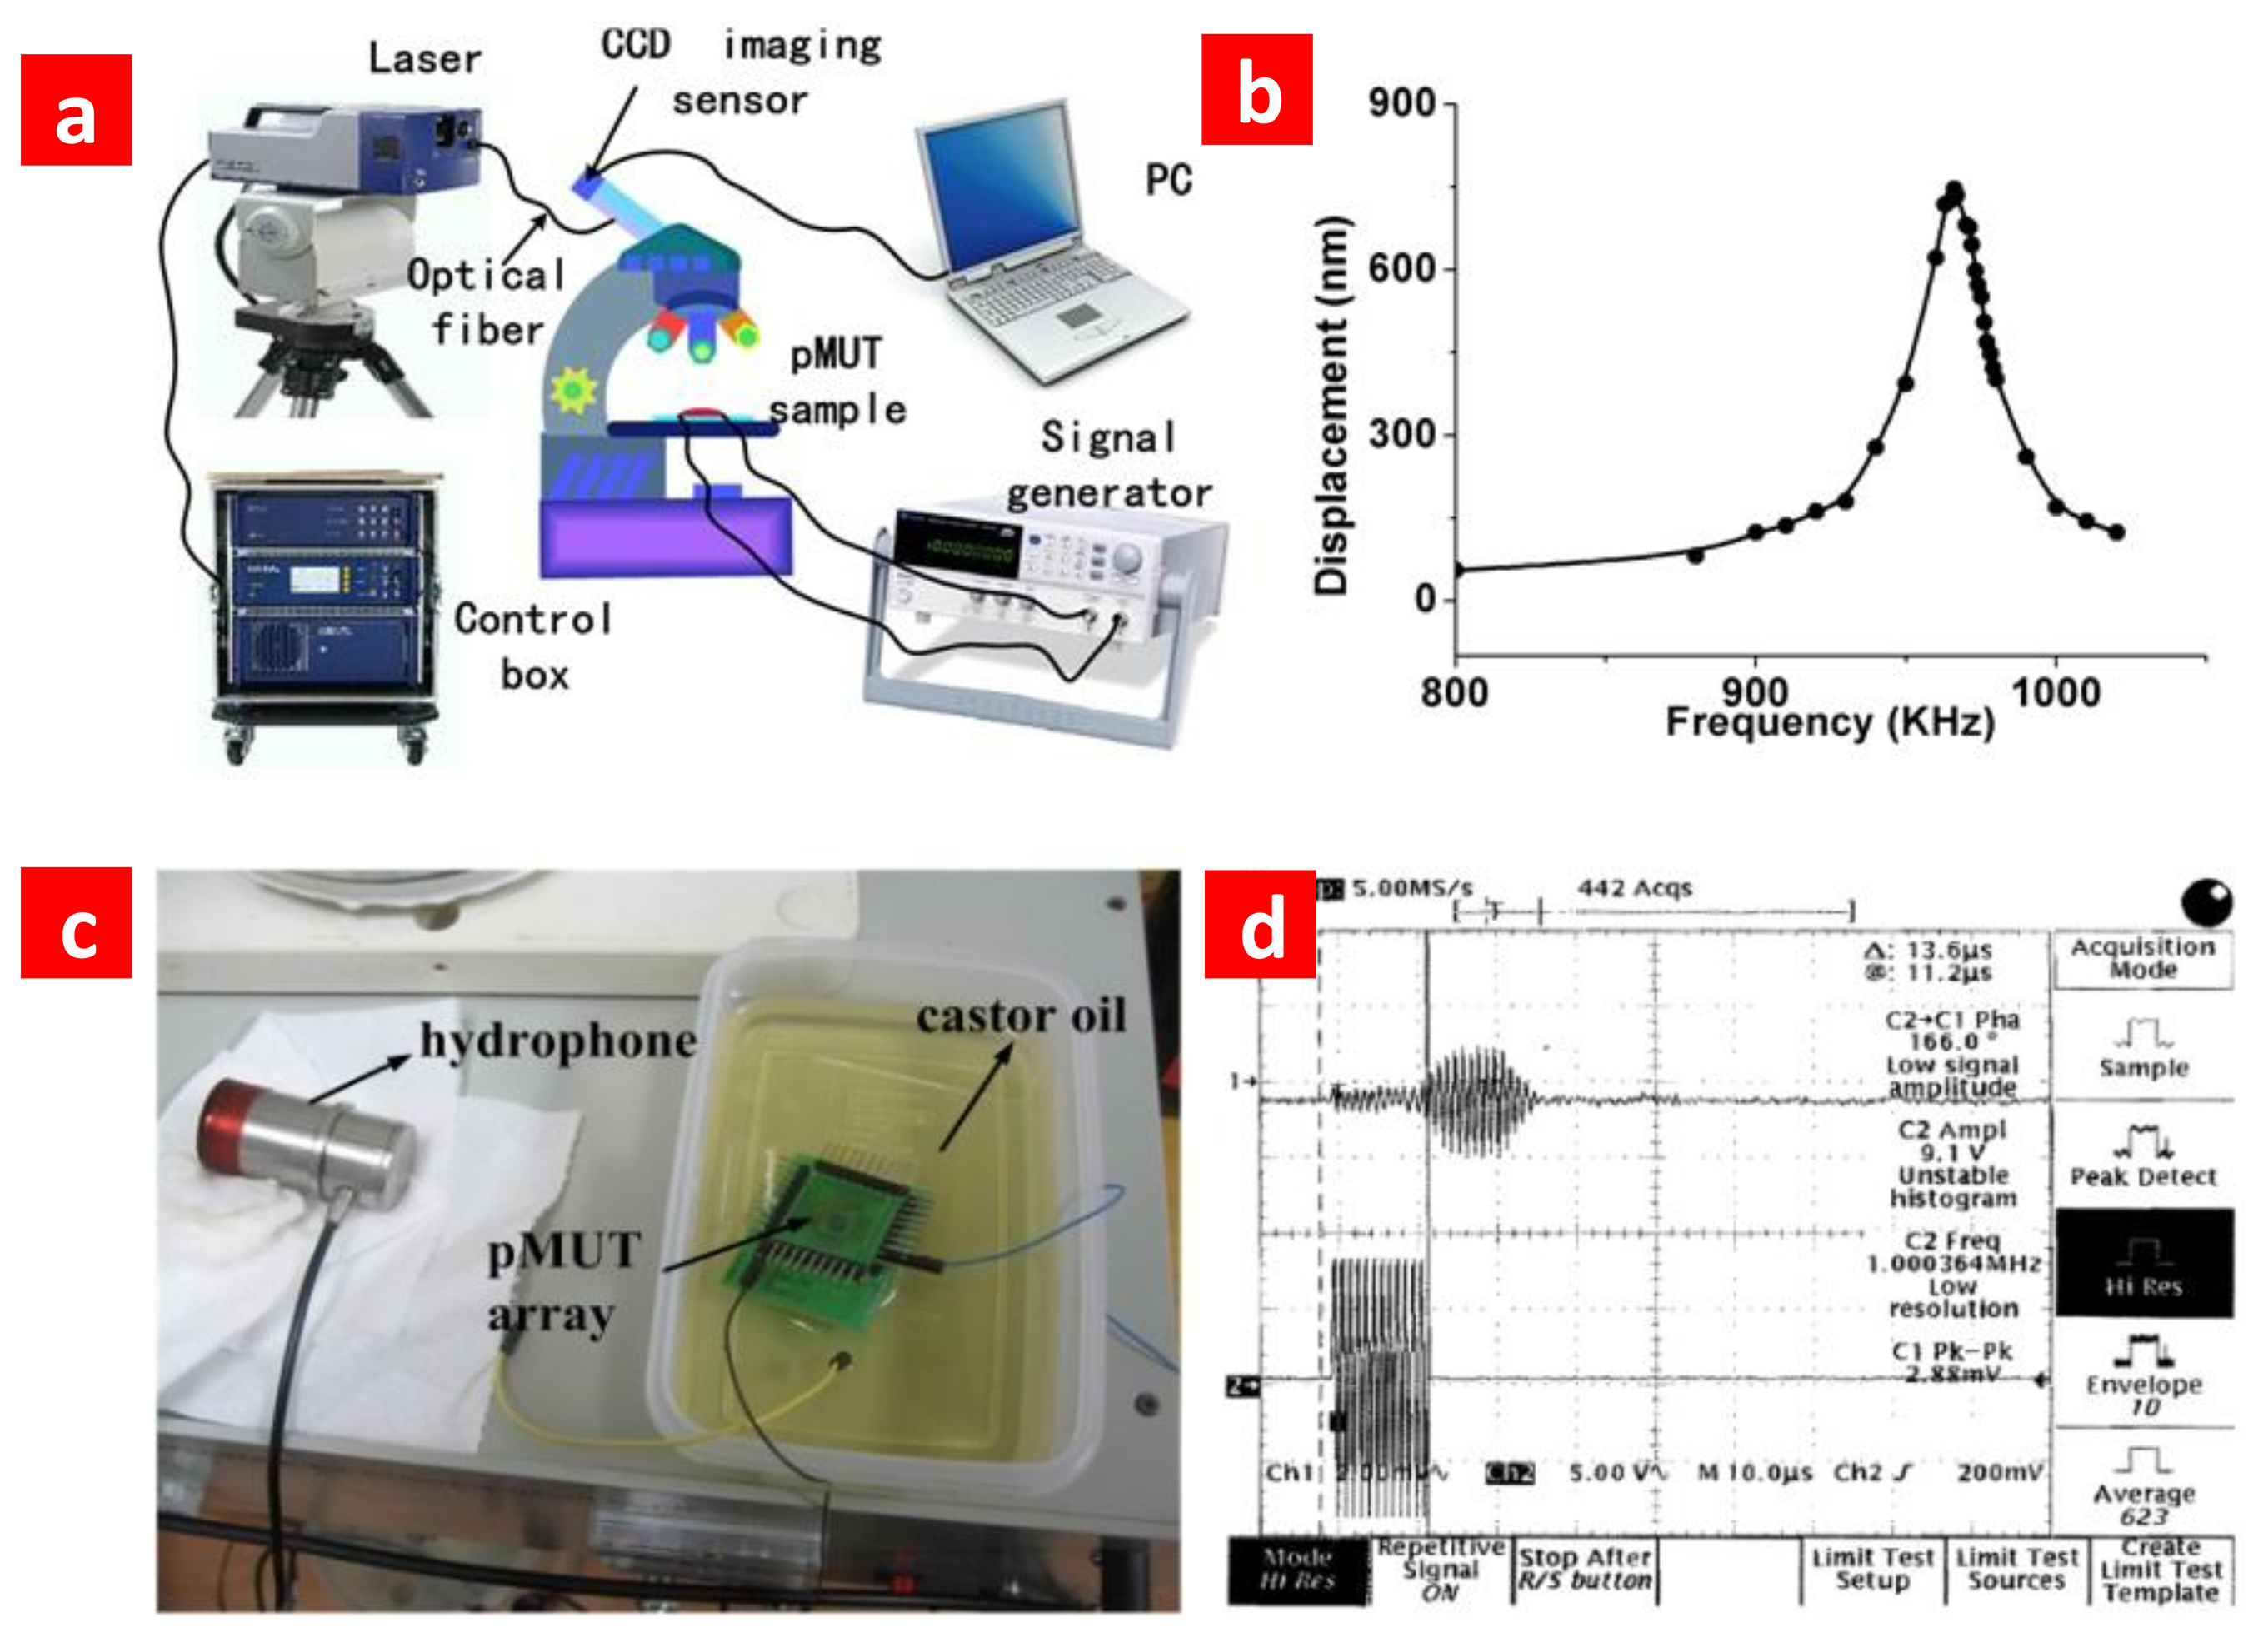
We used a laser vibrometer (Polytec PSV-400) to directly observe the acoustic characteristic of the fabricated arrays, as shown in Figure 4a. Vibration under different signal stimulus is shown in Figure 4b. The resonance frequency acquired by vibration test is well consistent with the result of the impedance analysis. In order to reduce the crosstalk we took some special precautions during the designing of the pMUT array. The PZT was etched to separate each independent element. As a result, according to the vibration testing results the crosstalk between adjacent elements can be neglected. The cross talk is no more than the environment noise, and the SNR of the device while operated under 4 V voltage is about 43 dB. The bandwidth of PMUT with element size 200 × 200 μm2 is 50 kHz, which could be estimated through vibration results in Figure 4b. We also tested the functionality of the fabricated pMUT array in a liquid environment, and the experiment set and test result is shown in Figure 4c,d. The resulta show that it can work well under castor oil.
The cross-talk between different elements in the array is a crucial problem. In order to demonstrate the crosstalk effect experimentally, we apply stimulation signal on one element and test the output signal of the adjacent element by vibration testing (Figure 4). We didn't detect obvious output signal from the adjacent element. The output of the adjacent element has no different with the noise signal when we didn't apply any input signal. That means the cross-talk can be neglected.
3. Results and Discussion
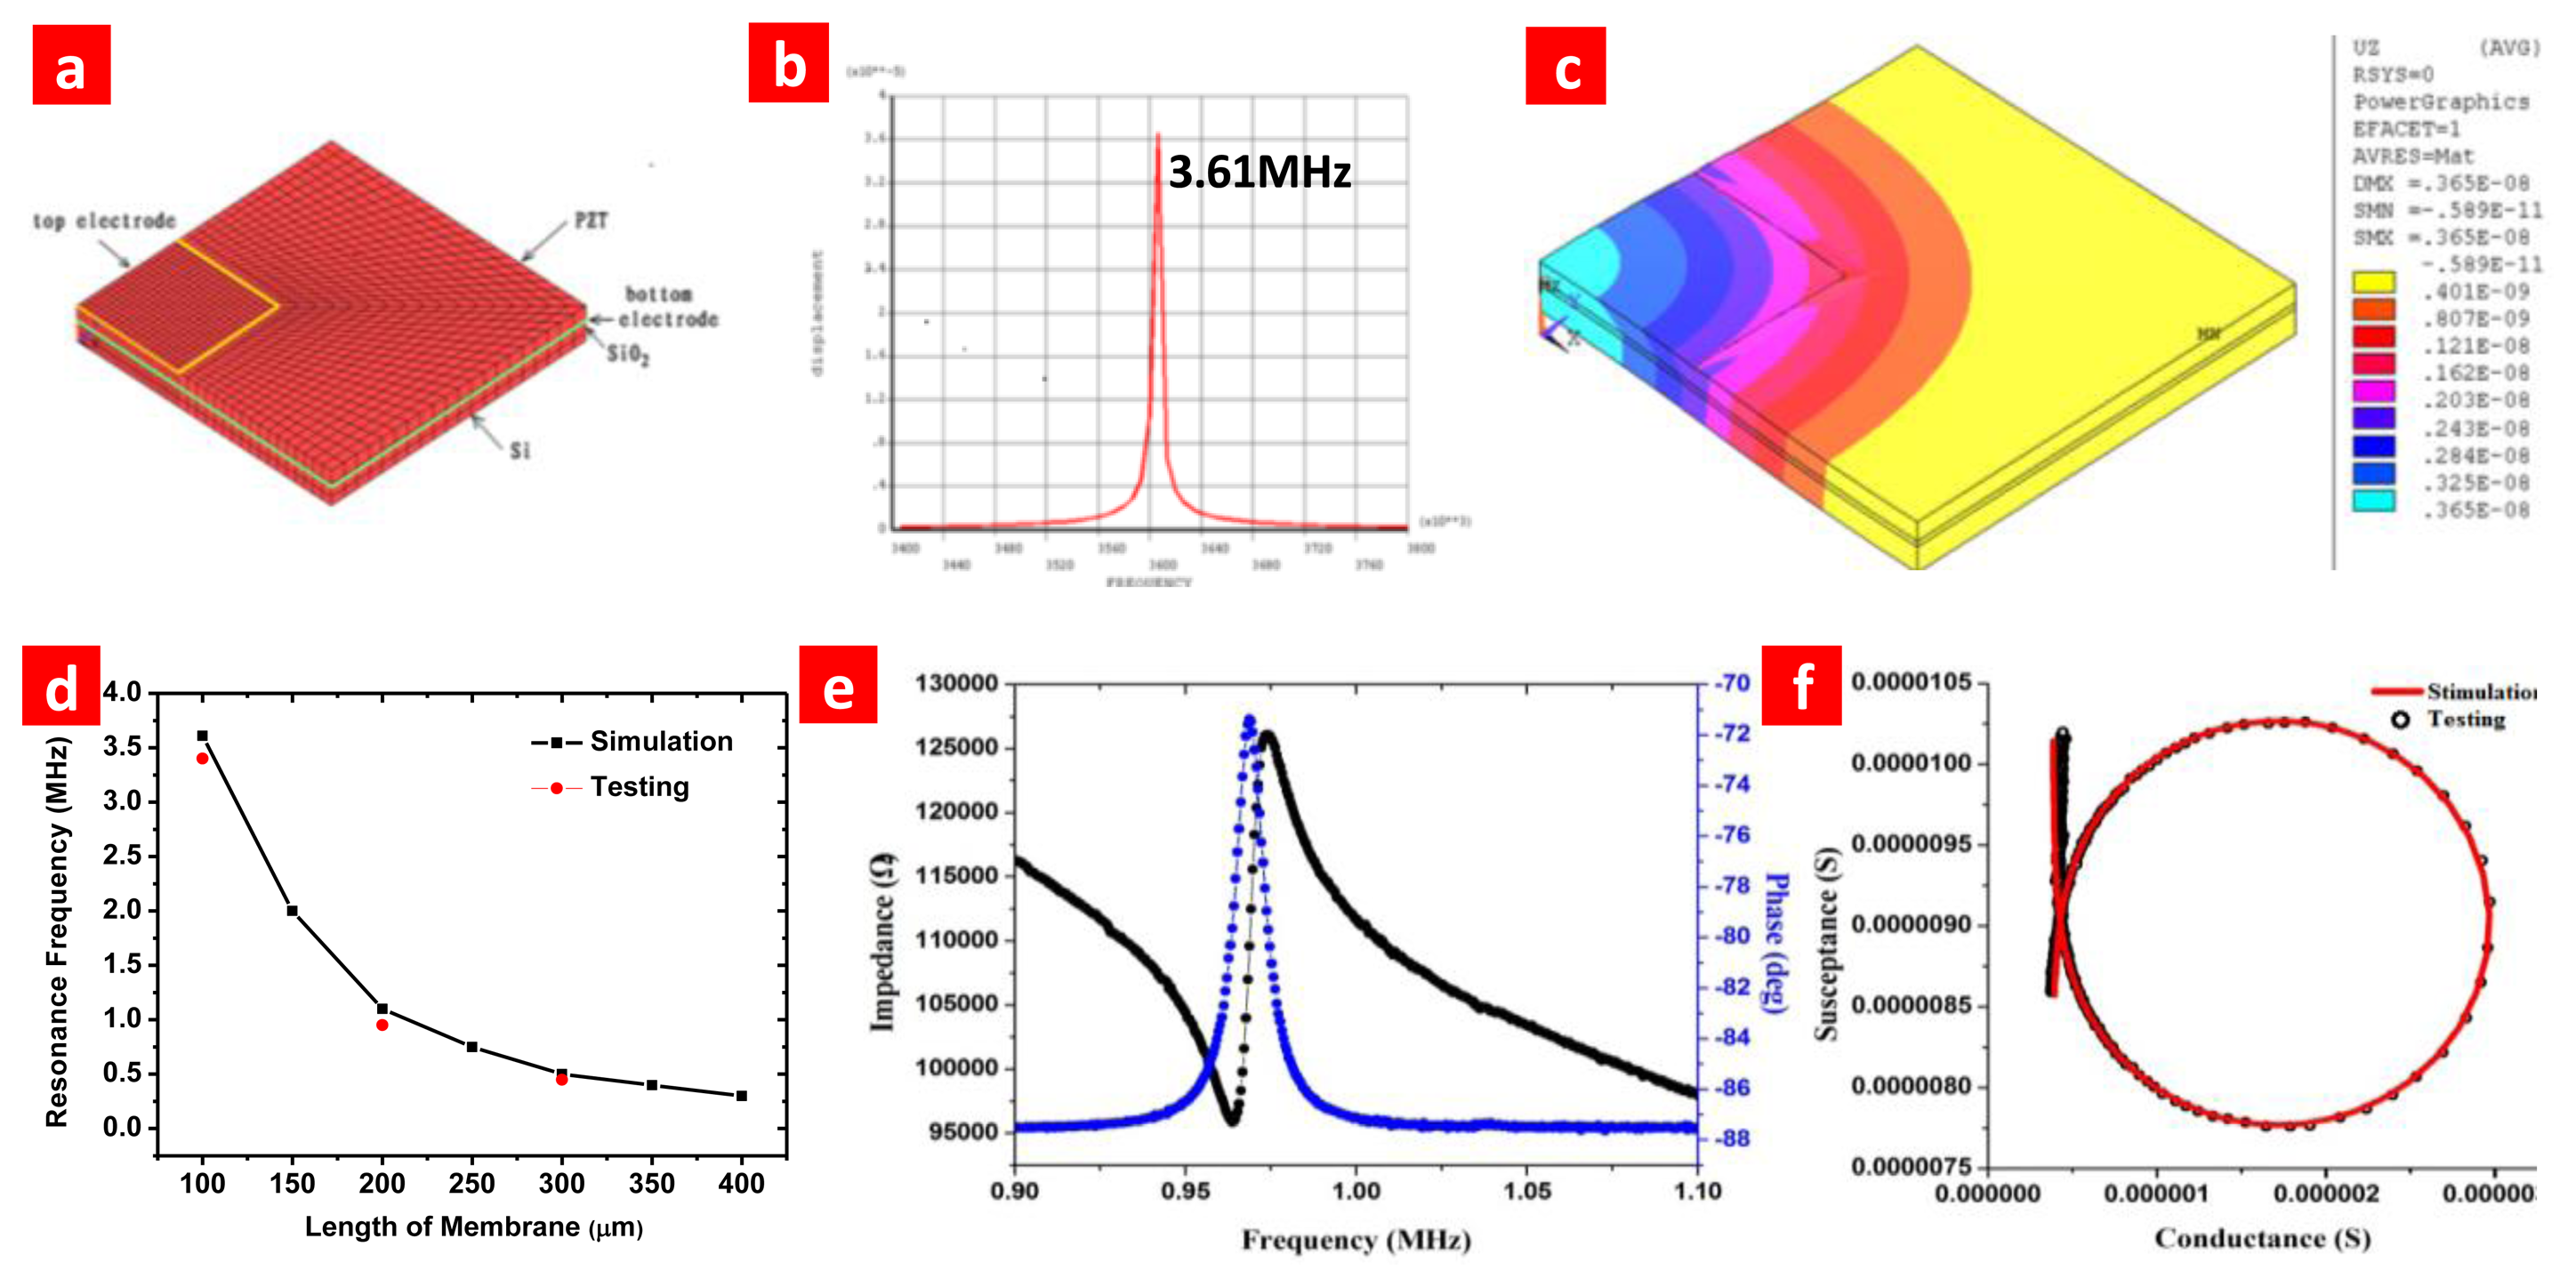
For a 2-μm thick PZT film, its resonance frequency at d33 mode should be about 500 MHz to 1 GHz. Our PZT is resonant at d31 mode, which is related to a few MHz. In order to demonstrate this, we make numerical simulation with ANSYS. As shown in Figure 5a, an ANSYS model was established for the pMUT. As shown in Figure 5b, harmonic analysis of the model in d31 mode shows the resonance frequency is about 3.611 MHz (the element size is 100 μm × 100 μm, other parameters are shown in Table 1).
The thickness of each layer is modeled by the finite element method (FEM) to make a trade-off between transmitting ultrasonic pressure and receiving sensitivity. Element size is used to achieve different resonance frequencies. The FEM model and harmonic analysis of a pMUT element with element size 100 μm × 100 μm are shown in Figure 5a,b. The vibration amplitude of the PZT film is shown in Figure 5c. Capacitances of elements with different size are listed in Table 2. Their capacitances are considerably high compared with that of bulk ceramic transducer which are normally less than 10 pF. Impedance analysis is used to measure the resonance frequency (fr) of transducer. Impedance spectrum is shown in Figure 5d,e. The fr is around 1 to 3.6 MHz and can meet the requirement of medical imaging application well [25]. The experimental results fit well with the simulation as Figure 5f shows. Coupling coefficient keff and quality factor Q can be extracted by equivalent circuit. The fabricated pMUT have relatively high keff and Q. The PZT Stiffness coefficient and piezoelectric matrix parameter are listed in Table 3. The main parameters used in the simulation are listed in Table 4.
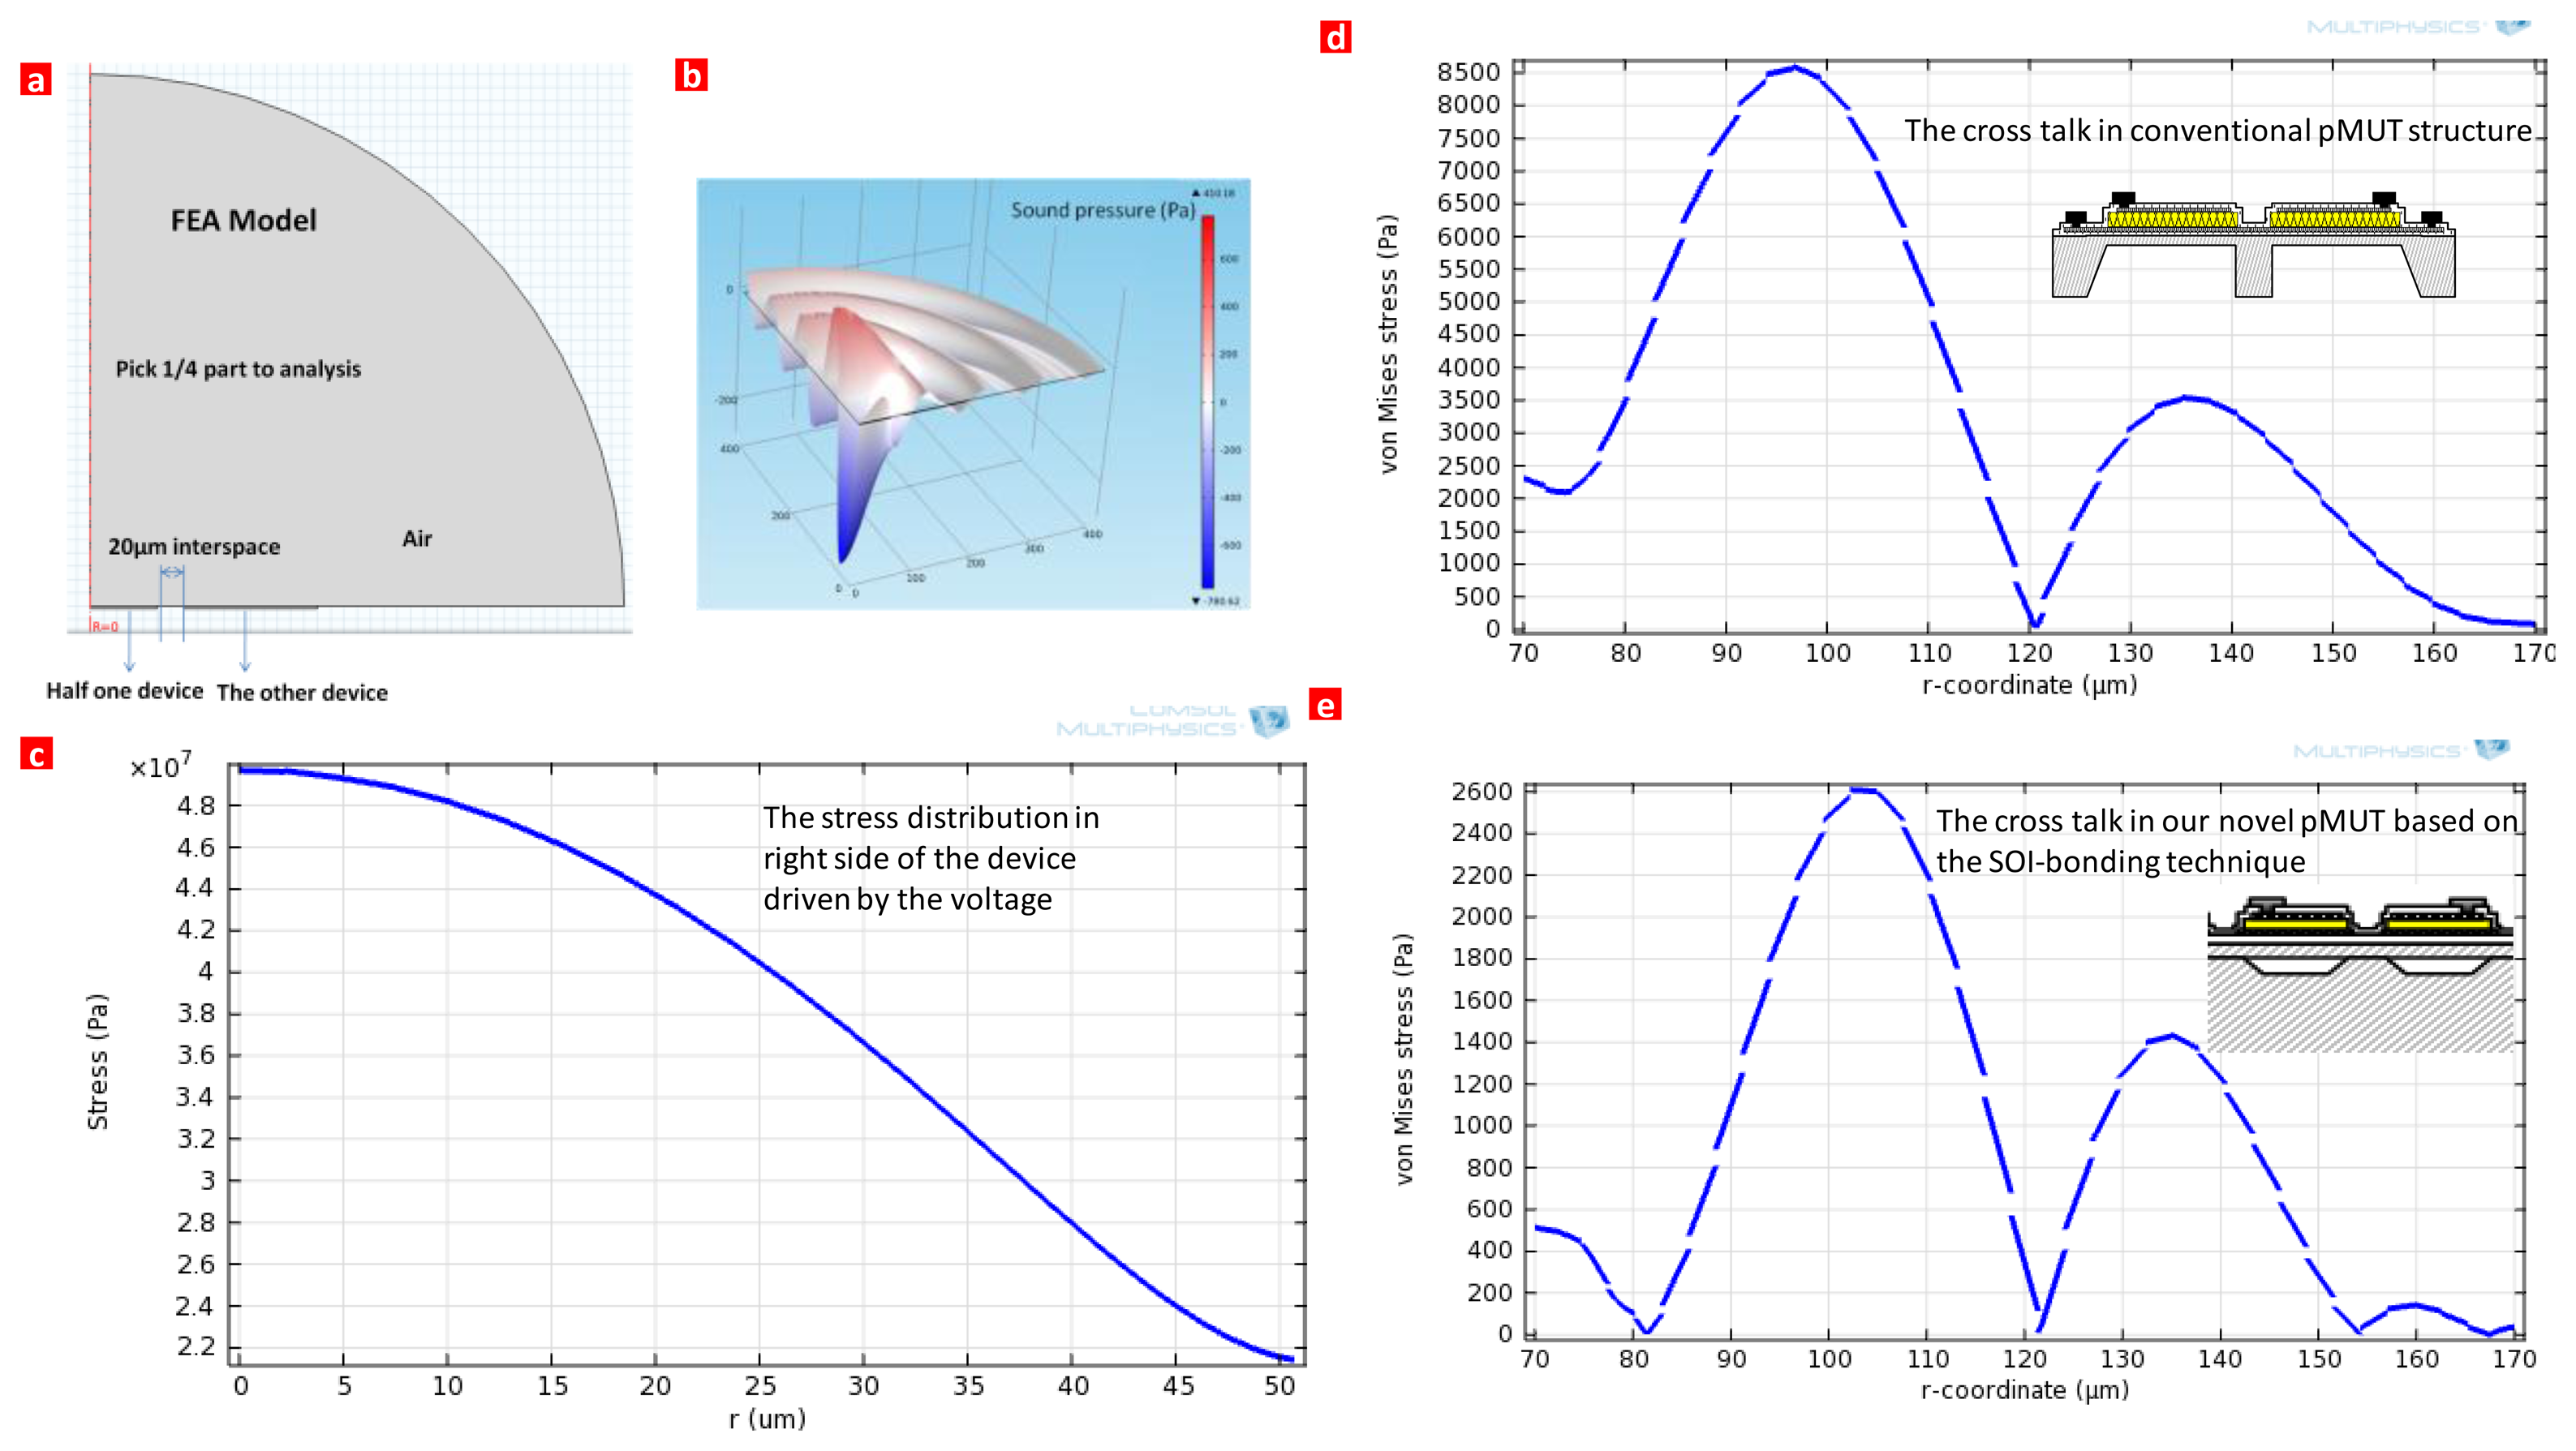
The cross-talk effect is simulated theoretically. Figure 6 shows a numerical simulation of the cross talk effect in pMUT. Figure 6a shows a FEA model for the cross talk in the pMUTs. The left one is driven by the voltage to see the stress distribution in the other device. If the stress in the left one device is quite low compared with the right device, we can conclude that the cross talk is minimized. A quarter is enough due to the symmetry of the structure. Figure 6b shows the sound pressure distribution in the air. Figure 6c shows the stress distribution in the left half one device with maximum stress up to 5 × 10⁷ Pa. Figure 6d shows the cross talk of the conventional pMUT structure with maximum stress to 8.5 × 10³ Pa. As shown in Figure 6e, the cross talk of our novel pMUT structure with maximum stress was just 2.6 × 10³ Pa. Compared to the conventional device, the cross talk effect is reduced more than 3-fold by this design.
4. Conclusions
A novel pMUT array with ultra-high element density, low crosstalk and excellent performance was designed and demonstrated for the first time. The nano-layer PZT film is a feasible technique to obtain high frequency. Each layer is estimated at 100 nm. The 2 μm PZT film was fabricated by a nano-layer spin-coating PZT solution. The interspace of pMUT elements is the smallest that has ever been achieved. The developed arrays have ∼1 MHz resonance frequency, a modest quality factor. They can be used to form and steer ultrasound beams with strong directionality and high radiation acoustic power. High-resolution 3-D digital ultrasonic medical imaging system, especially in some cutting-edge areas such as intravascular imaging for clinical evaluation could be implemented using these novel pMUT arrays.
Acknowledgments
This work was supported by the National Natural Science Foundation of China (61025021, 60936002, 51072089, and 61020106006), the National Key Project of Science and Technology (2011ZX02403-002). He Tian is additionally supported by the Ministry of Education Scholarship of China.
Conflict of Interest
The authors declare no conflict of interest.
References
- Tournemaine, N.; Chetanneau, A.; Digabel-Chabay, C.; Weber, J.; Peltier, P.; Chatal, J.F.; Gillot, P. Difficulties of the X-ray computed tomographic diagnosis of pelvic tumor recurrence: Comparison with other medical imaging techniques (ultrasonography, immunoscintigraphy). Ann. Radiol. (Paris) 1988, 31, 426–432. [Google Scholar]
- Doppler Sonographic Imaging of the Vascular System. Report of the Ultrasonography Task Force. Council on Scientific Affairs, American Medical Association: In JAMA; 1991; Volume 265, pp. 2382–2387.
- Campani, R. State of the Art in Ultrasonography and Present Day Imaging Modalities of the Breast. Proceedings of the 38th Congress of the Italian Association of Medical Radiology (SIRM), Milan, Italy, 23−27 May 1998; Volume 27 Suppl. 2, pp. S133–S281.
- Ultrasonic Imaging of the Abdomen. Report of the Ultrasonography Task Force. Council on Scientific Affairs, American Medical Association: In JAMA; 1991; Volume 265, pp. 1726–1731.
- Gudmundsen, T.E.; Vinje, B.; Ostensen, H.; Pedersen, H.K. Ultrasonography in medical imaging. Influence on diagnostic routines. Clin. Imaging 1994, 18, 31–35. [Google Scholar]
- Tian, H.; Ren, T.L.; Xie, D.; Wang, Y.F.; Zhou, C.J.; Feng, T.T.; Fu, D.; Yang, Y.; Peng, P.G.; Wang, L.G.; et al. Graphene-on-paper sound source devices. ACS Nano 2011, 5, 4878–4885. [Google Scholar]
- Tian, H.; Xie, D.; Yang, Y.; Ren, T.L.; Zhang, G.; Wang, Y.F.; Zhou, C.J.; Peng, P.G.; Wang, L.G.; Liu, L.T. A novel solid-state thermal rectifier based on reduced graphene oxide. Sci. Rep. 2012, 2, 523. [Google Scholar]
- Tian, H.; Xie, D.; Yang, Y.; Ren, T.L.; Wang, Y.F.; Zhou, C.J.; Peng, P.G.; Wang, L.G.; Liu, L.T. Single-layer graphene sound-emitting devices: Experiments and modeling. Nanoscale 2012, 4, 2272–2277. [Google Scholar]
- Tian, H.; Xie, D.; Yang, Y.; Ren, T.L.; Wang, Y.F.; Zhou, C.J.; Peng, P.G.; Wang, L.G.; Liu, L.T. Static behavior of a graphene-based sound-emitting device. Nanoscale 2012, 4, 3345–3349. [Google Scholar]
- Noble, R.A.; Davies, R.R.; Day, M.M.; Koker, L.; King, D.O.; Brunson, K.M.; Jones, A.R.D.; McIntosh, J.S.; Hutchins, D.A.; Robertson, T.J.; et al. A cost-effective and manufacturable route to the fabrication of high-density 2D micromachined ultrasonic transducer arrays and (CMOS) signal conditioning electronics on the same silicon substrate. Ultrason. Symp. 2001, 2, 941–944. [Google Scholar]
- Guyonvarch, J.; Certon, D.; Ratsimandresy, L.; Patat, F.; Lethiecq, M. Analytical 2D model of transducer arrays for predicting elementary electroacoustic response and directivity pattern. Ultrason. Symp. 2002, 2, 1217–1220. [Google Scholar]
- Oralkan, O.; Ergun, A.S.; Cheng, C.H.; Johnson, J.A.; Karaman, M.; Lee, T.H.; Khuri-Yakub, B.T. Volumetric imaging using 2D capacitive Micromachined Ultrasonic Transducer Arrays (CMUTs): Initial results. Ultrason. Symp. 2002, 2, 1083–1086. [Google Scholar]
- Pedersen, T.; Zawada, T.; Hansen, K.; Lou-Moeller, R.; Thomsen, E. Fabrication of high-frequency pMUT arrays on silicon substrates. IEEE Trans. Ultrason. Ferroelectr. Freq. Control 2010, 57, 1470–1477. [Google Scholar]
- Ferrer-Costa, C.; Gelpi, J.L.; Zamakola, L.; Parraga, I.; de la Cruz, X.; Orozco, M. PMUT: A web-based tool for the annotation of pathological mutations on proteins. Bioinformatics 2005, 21, 3176–3178. [Google Scholar]
- Wang, Y.F.; Ren, T.L.; Yang, Y.; Chen, H.; Zhou, C.J.; Wang, L.G.; Liu, L.T. High-Density Pmut Array for 3-D Ultrasonic Imaging Based on Reverse-Bonding Structure. Proceedings of the 2011 IEEE 24th International Conference on Micro Electro Mechanical Systems (MEMS), Cancun, Mexico, 23–27 January 2011; pp. 1035–1038.
- Zhuang, X.F.; Ergun, A.S.; Oralkan, O.; Wygant, I.O.; Khuri-Yakub, B.T. Interconnection and Packaging for 2D Capacitive Micromachined Ultrasonic Transducer Arrays Based on Through-Wafer Trench Isolation. Proceedings of the MEMS 2006: 19th IEEE International Conference on Micro Electro Mechanical Systems, Technical Digest, Istanbul, Turkey, 22–26 January 2006; pp. 270–273.
- Zhuang, X.F.; Ergun, A.S.; Huang, Y.L.; Wygant, I.O.; Oralkan, O.; Khuri-Yakub, B.T. Integration of trench-isolated through-wafer interconnects with 2d capacitive micromachined ultrasonic transducer arrays. Sens. Actuat. A Phys. 2007, 138, 221–229. [Google Scholar]
- Lin, D.S.; Zhuang, X.; Wodnicki, R.; Woychik, C.G.; Oralkan, O.; Kupnik, M.; Khuri-Yakub, B.T. Packaging of Large and Low-Pitch Size 2D Ultrasonic Transducer Arrays. Proceedings of the MEMS 2010: 23rd IEEE International Conference on Micro Electro Mechanical Systems, Technical Digest, Wanchai, Hong Kong, 24–28 January 2010; pp. 508–511.
- Dausch, D.E.; Castellucci, J.B.; Chou, D.R.; von Ramm, O.T. Theory and operation of 2-D array piezoelectric micromachined ultrasound transducers. IEEE Trans. Ultrason. Ferroelectr. Freq. Control 2008, 55, 2484–2492. [Google Scholar]
- Mo, J.H.; Fowlkes, J.B.; Robinson, A.L.; Carson, P.L. Crosstalk reduction with a micromachined diaphragm structure for integrated ultrasound transducer arrays. IEEE Trans. Ultrason. Ferroelectr. Freq. Control 1992, 39, 48–53. [Google Scholar]
- Ren, T.L.; Chen, H.; Yang, Y.; Zhu, Y.P.; Fu, D.; Wang, C.; Wu, X.M.; Cai, J.; Liu, L.T.; Li, Z.J. Micromachined Piezoelectric Acoustic Device. Proceedings of the 2009 2nd International Workshop on Electron Devices and Semiconductor Technology, Mumbai, Indian, 1–2 June 2009; pp. 213–218.
- Wang, Y.F.; Yang, Y.; Ren, T.L.; Chen, H.; Liao, W.J.; Kong, X.M.; Wang, L.G.; Zhou, C.J.; Fu, D.; Liu, L.T. Ultrasonic Transducer Array Design For Medical Imaging Based on MEMS Technologies. Proceedings of the 2010 3rd International Conference on Biomedical Engineering and Informatics (BMEI 2010), Yantai, China, 16–18 October 2010; Volume 1–7, pp. 666–669.
- Fu, D.; Ren, T.L.; Chen, H.; Yang, Y.; Kong, X.M.; Ren, Y.; Liao, W.J.; Liu, L.T. A Novel Method for Fabricating 2-D Array Piezoelectric Micromachined Ultrasonic Transducers for Medical Imaging. Proceedings of the 18th IEEE International Symposium on the Applications of Ferroelectrics, Xian, China, 23–27 August 2009.
- Ren, T.L.; Zhang, L.T.; Liu, L.T.; Li, Z.J. Silicon-based PbTiO3/Pb(Zr,Ti)O-3/PbTiO3 sandwich structure. Jpn. J. Appl. Phys. 2001, 2363–2366. [Google Scholar]
- Li, H.; Li, Y.C.; Zhou, D.; Peng, J.; Luo, H.S.; Dai, J.Y. Application of PMNPT Single Crystal in a 3.2 MHz Phased-Array Ultrasonic Medical Imaging Transducer. Proceedings of the 2007 Sixteenth IEEE International Symposium on the Applications of Ferroelectrics, Nara, Japan, 27–31 May 2007; Volumes 1 and 2, pp. 569–571.


| Functions | Materials | Thickness (μm) | Fabrication method |
|---|---|---|---|
| Wire and pad | Al | 1.1 | DC sputtering |
| Passivation layer | SiO2 | 0.3 | PECVD |
| Top electrode | Pt | 0.2 | RF sputtering |
| Piezoelectric layer | PZT | 2.0 | Sol-gel |
| Bottom electrode | Pt | 0.2 | RF sputtering |
| Adhesive layer | Ti | 0.03 | DC sputtering |
| Stress buffer | SiO2 | 1 | BOX layer of SOI |
| Supporting layer | Si | 3 | Device layer of SOI |
| Bulk silicon | Si | 520 | 4-inch Si wafer |
| Element length (μm) | Capacitance (pF) | fr (kHz) | Q | keff |
|---|---|---|---|---|
| 100 | 42 | 3387 | 60.97 | 3.07% |
| 200 | 152 | 970 | 95.94 | 2.15% |
| 300 | 385 | 480 | 63.61 | 2.78% |
| PZT Thin Film Stiffness Coefficient (GPa) | c11 | c12 | c13 | c33 | c44 |
| 135 | 67.4 | 68.1 | 113 | 22.2 | |
| Bulk PZT 4 Stiffness Coefficient (GPa) | c11 | c12 | c13 | c33 | c44 |
| 132 | 71 | 73 | 115 | 30 | |
| PZT Thin Film Strain piezoelectric Coefficient (C/m2) | e31 | e33 | e15 | ||
| −1.86 | 9 | 9.8 | |||
| Bulk PZT 4 Strain piezoelectric Coefficient (C/m2) | e31 | e33 | e15 | ||
| −4.1 | 14.1 | 10.5 | |||
| Material | Modulus of Elasticity (GPa) | Poisson Ratio | Density(Kg/m3) | Relative Dielectric Constant |
|---|---|---|---|---|
| PZT | / | / | 7400 | 540 |
| Si | 120 | 0.42 | 2331 | 12.1 |
| SiO2 | 78 | 0.17 | 2250 | 4.6 |
| Pt | 95 | 0.33 | 21500 | / |
| TiO2 | 230 | 0.27 | 4000 | 85 |
© 2013 by the authors; licensee MDPI, Basel, Switzerland. This article is an open access article distributed under the terms and conditions of the Creative Commons Attribution license (http://creativecommons.org/licenses/by/3.0/).
Share and Cite
Yang, Y.; Tian, H.; Wang, Y.-F.; Shu, Y.; Zhou, C.-J.; Sun, H.; Zhang, C.-H.; Chen, H.; Ren, T.-L. An Ultra-High Element Density pMUT Array with Low Crosstalk for 3-D Medical Imaging. Sensors 2013, 13, 9624-9634. https://doi.org/10.3390/s130809624
Yang Y, Tian H, Wang Y-F, Shu Y, Zhou C-J, Sun H, Zhang C-H, Chen H, Ren T-L. An Ultra-High Element Density pMUT Array with Low Crosstalk for 3-D Medical Imaging. Sensors. 2013; 13(8):9624-9634. https://doi.org/10.3390/s130809624
Chicago/Turabian StyleYang, Yi, He Tian, Yu-Feng Wang, Yi Shu, Chang-Jian Zhou, Hui Sun, Cang-Hai Zhang, Hao Chen, and Tian-Ling Ren. 2013. "An Ultra-High Element Density pMUT Array with Low Crosstalk for 3-D Medical Imaging" Sensors 13, no. 8: 9624-9634. https://doi.org/10.3390/s130809624
APA StyleYang, Y., Tian, H., Wang, Y.-F., Shu, Y., Zhou, C.-J., Sun, H., Zhang, C.-H., Chen, H., & Ren, T.-L. (2013). An Ultra-High Element Density pMUT Array with Low Crosstalk for 3-D Medical Imaging. Sensors, 13(8), 9624-9634. https://doi.org/10.3390/s130809624