Novel RF Interrogation of a Fiber Bragg Grating Sensor Using Bidirectional Modulation of a Mach-Zehnder Electro-Optical Modulator


Abstract
: We propose and experimentally demonstrate the novel radio-frequency (RF) interrogation of a fiber Bragg grating (FBG) sensor using bidirectional modulation of a Mach-Zehnder electro-optical modulator (MZ-EOM). Based on the microwave photonic technique and active detection, the transfer function of the proposed system was obtained, and the time delay was calculated from the change in the free spectral range (FSR) at different wavelengths over the optimal measuring range. The results show that the time delay and the wavelength variation have a good linear relationship, with a gradient of 9.31 ps/nm. An actual measurement taken with a sensing FBG for temperature variation shows the relationship with a gradient of 0.93 ps/10 °C. The developed system could be used for FBG temperature or strain sensing and other multiplexed sensor applications.1. Introduction
The use of fiber Bragg gratings (FBGs) in sensor applications has been extensively studied for the past 20 years. FBGs are lightweight, offer low power consumption and multiplexing capability, are resistant to electromagnetic wave interference, and offer high sensitivity to strain and temperature. FBG sensors, because of their small size, are ideal for the health monitoring of smart structures since they can easily be embedded inside structural members [1]. Several FBG sensing interrogation methods, which can be classified into passive detection and active detection, have been reported [2], and successful schemes include the use of scanning Fabry-Perot or acoustic filters, tuning lasers, and charge coupled device (CCD) spectrometers. Each of these approaches has its own advantages, and commercial systems that make use of these techniques are now available.
Recently, FBG sensor interrogation systems employing a Mach-Zehnder electro-optical modulator (MZ-EOM) have gained the attention of researchers due to the capability of the MZ-EOM in handling fast signal processing speeds. By adopting fiber Sagnac-loop-based microwave photonic filtering, the high-frequency wavelength variation of a sensing FBG can be converted into the intensity change of the recovered RF signal [3]. Through the use of a dispersion compensation fiber, an FBG interrogator can convert the sensing wavelength variation measurement to a time-domain measurement at a speed on the order of megasamples per second [4]. Bidirectional modulation of MZ-EOMs has been used to obtain optical fiber chromatic dispersion measurements [5]. In this paper, we propose and demonstrate the RF interrogation of an FBG sensor using the bidirectional modulation of an MZ-EOM.
2. Measurement Method
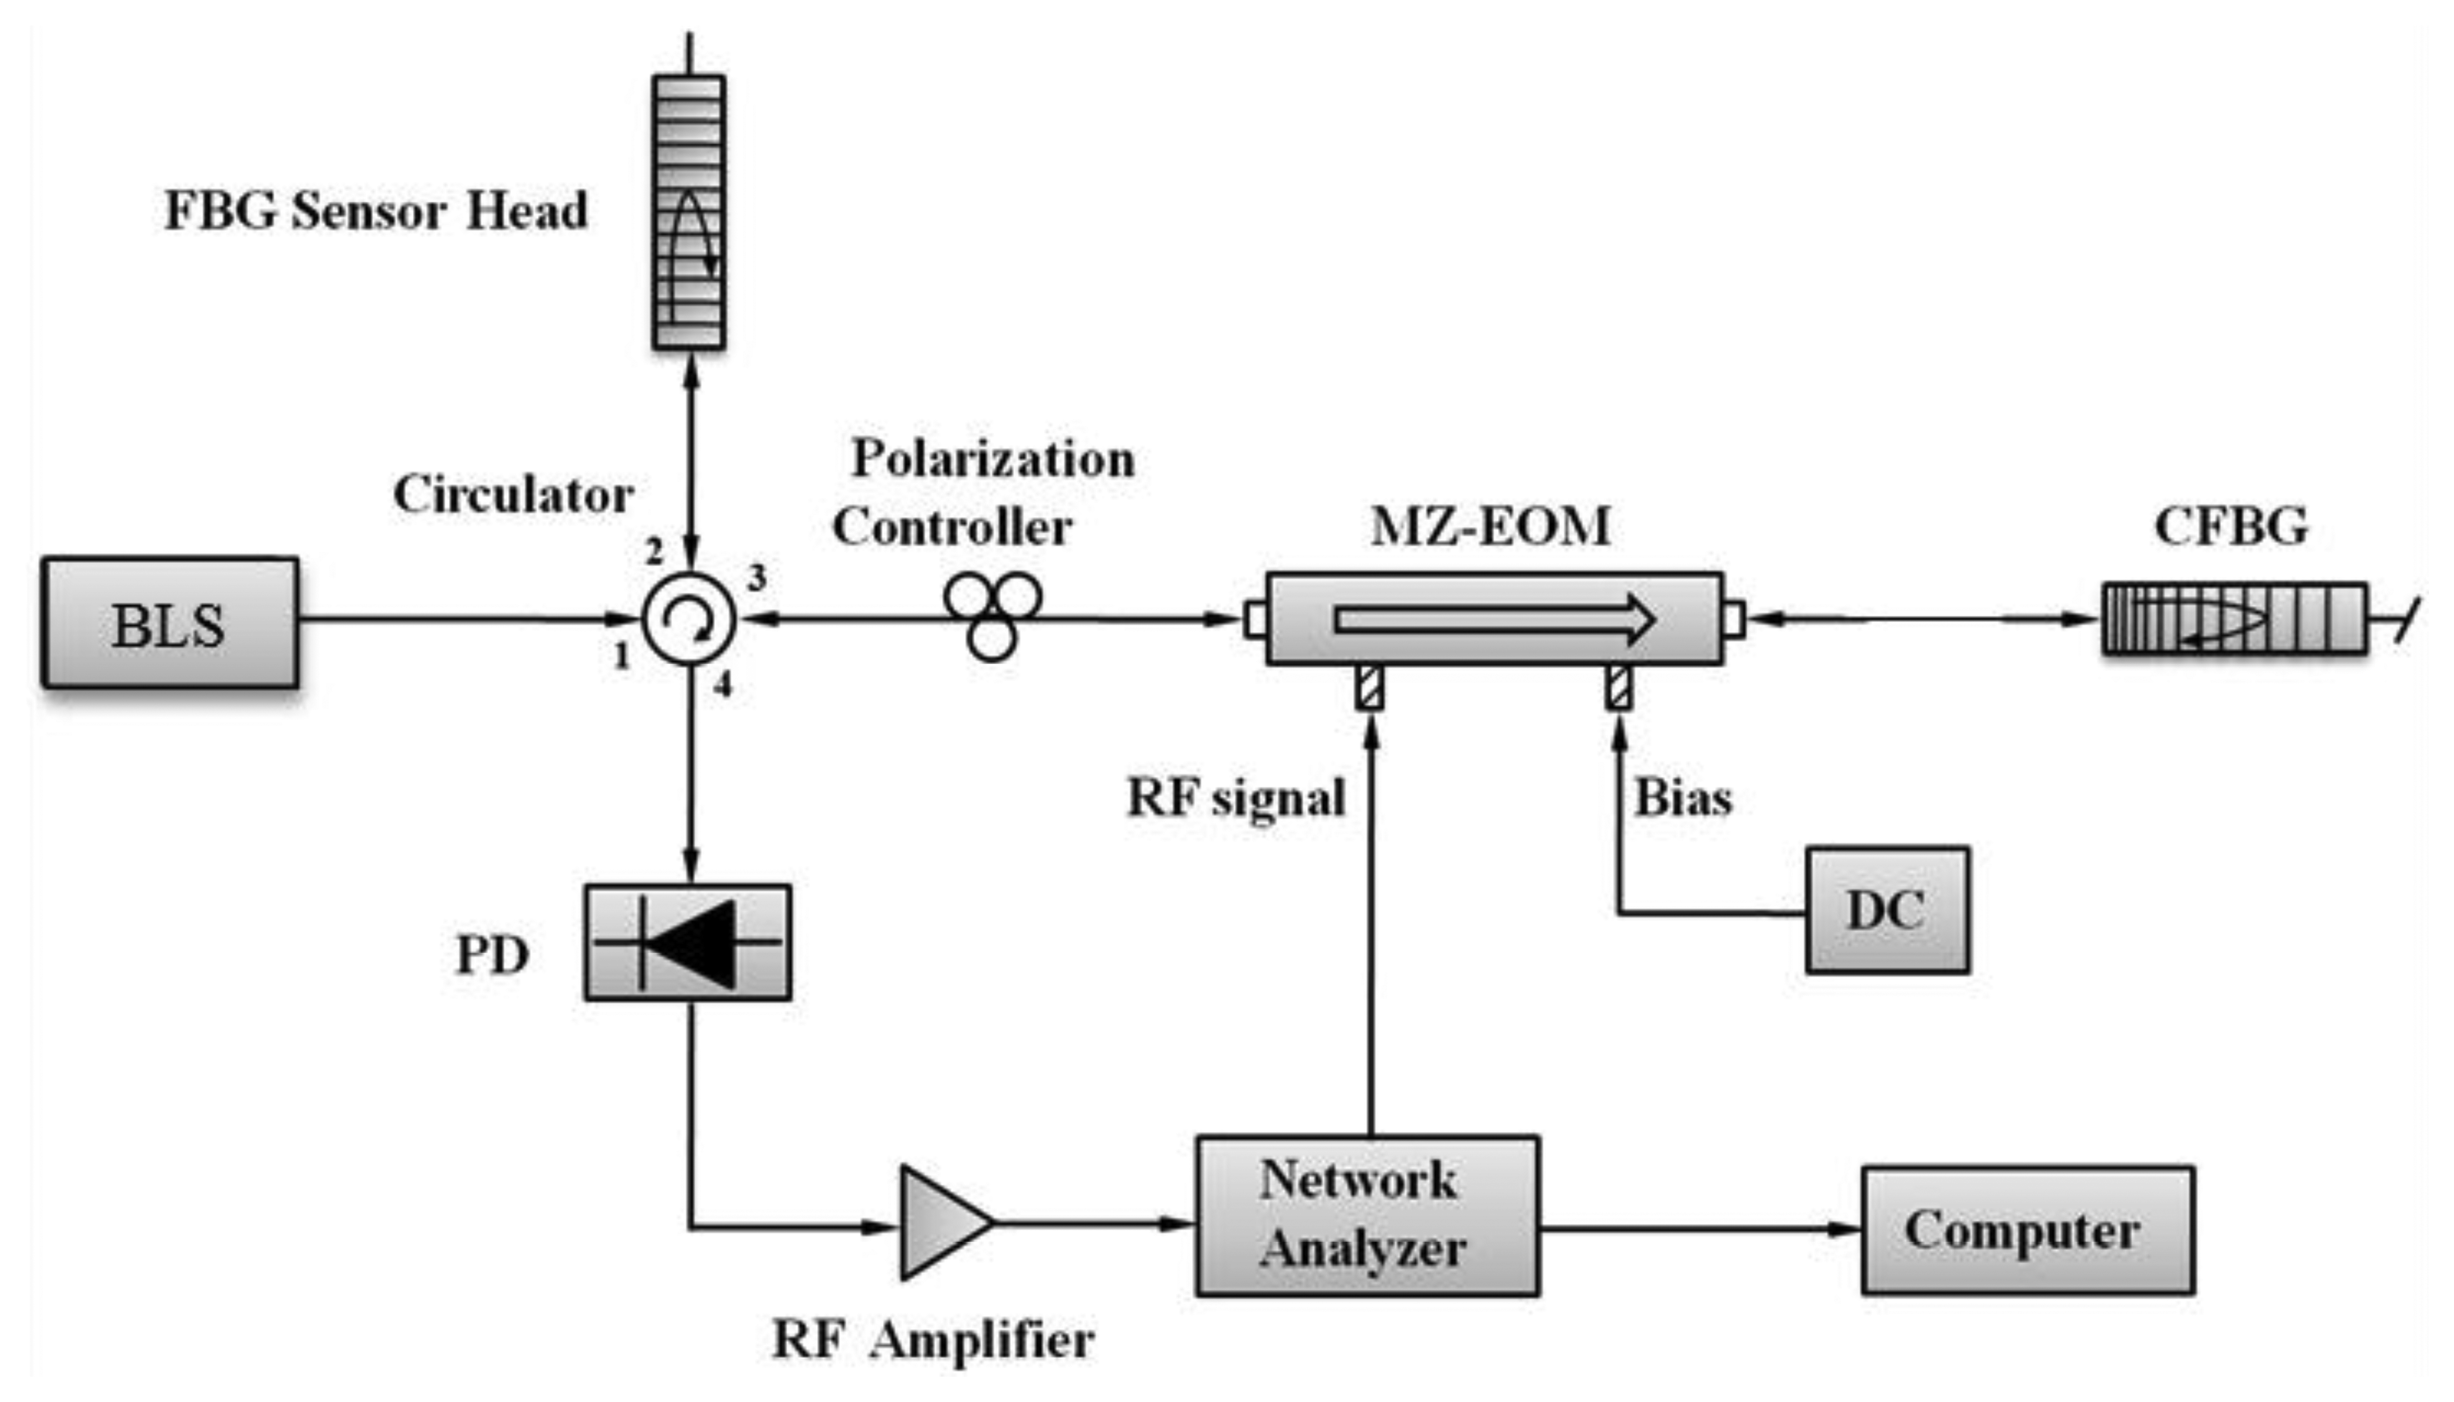
The proposed RF interrogation structure of an FBG sensor, which consists mainly of a broadband light source (BLS), FBG, MZ-EOM, chirped fiber Bragg grating (CFBG), and photodetector (PD), is shown in Figure 1.
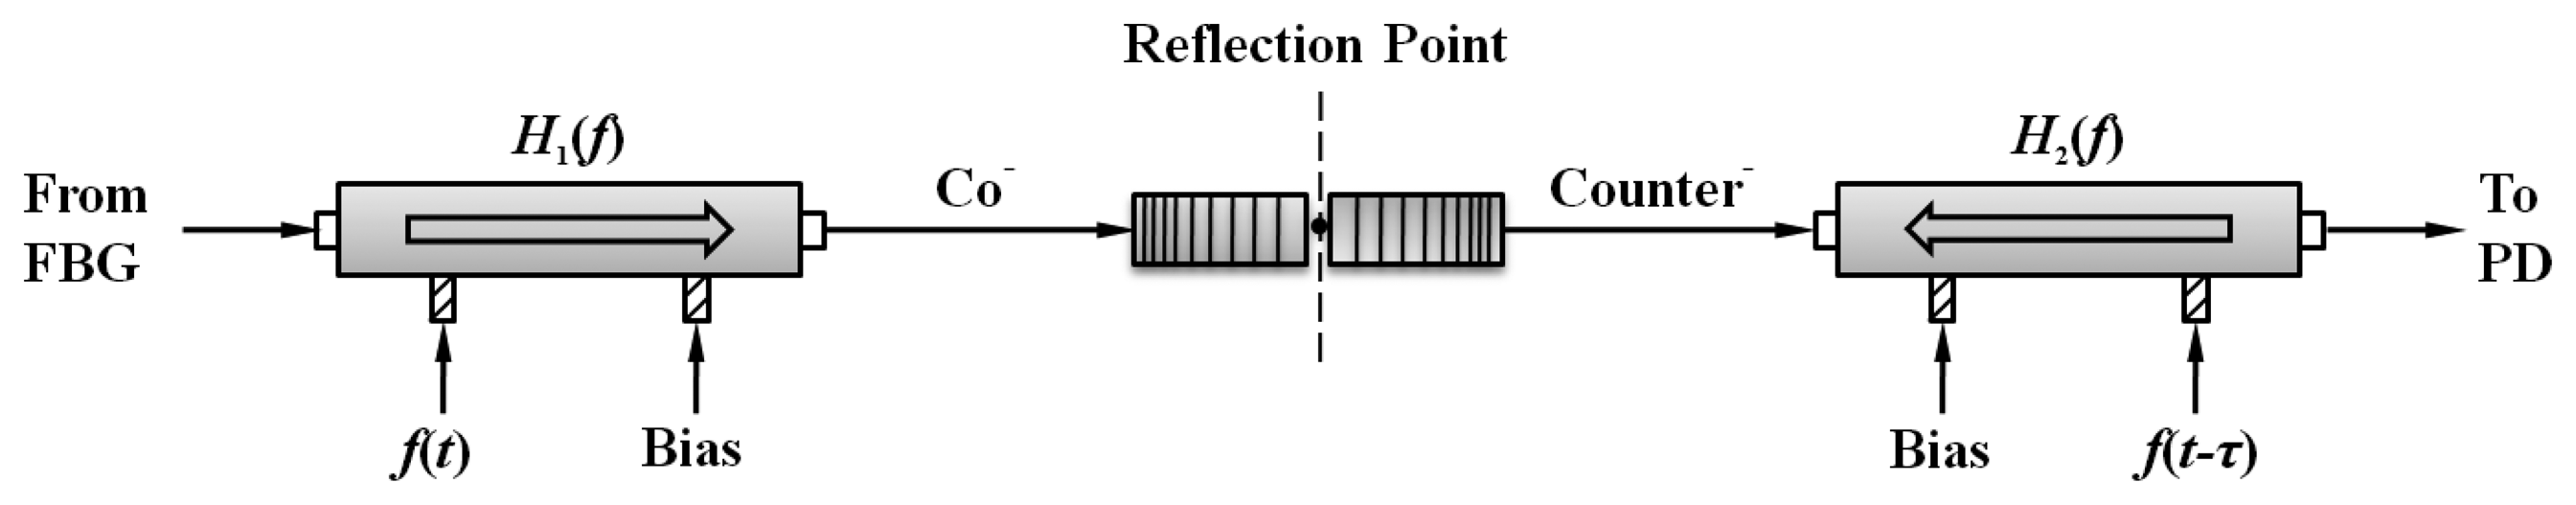
Light from the BLS passes through port 1 of a four-port circulator and is reflected by the FBG sensor head in port 2. After passing through port 3 and polarization controller, the light is modulated by an RF signal via the MZ-EOM with co-propagation, i.e., propagation in the same direction as the light (as indicated by the arrow in the diagram of the MZ-EOM shown in Figure 1). The unidirectional modulated light is reflected by the CFBG and is modulated by an RF signal via the MZ-EOM with counter-propagation, i.e., propagation in the opposite direction to the light. The bidirectional modulated light is received by the PD and measured by the network analyzer (NA). The modulating process in Figure 1 can be considered as an equivalent model, shown in Figure 2, with two MZ-EOMs cascaded in series [5].
The travel time in terms of the wavelength of the proposed structure, τ(λ), can be expressed as:
The time delay, Δτ, which is the difference in the travel time for two wavelengths (λ1, λ2), can be expressed as:
In the course of propagation, the first MZ-EOM in Figure 2 causes the forward propagating light in Figure 1 to experience co-propagating modulation by the RF signal f(t). On the other hand, the second MZ-EOM in Figure 2 causes the back-reflected light in Figure 1 to experience counter-propagating modulation caused by the RF signal f(t-τ). Assuming that the modulation indices are very small and the biasing is set at the quadrature point, we can obtain an expression for the output optical power Pout(t) at the PD as [5]:
The DC and harmonic components in Equation (3) are eliminated at the PD and the NA because all vector NAs use a tuned-receiver (narrow-band) architecture to reject harmonic and spurious signals. Consequently, if it is assumed that m1=m2=m, the total transfer function H(f) measured at the NA can be written as:
Upon measuring the change in the FSR based on the wavelength variation, the travel time and time delay can be calculated from Equations (1,2,5).
3. Experiments and Discussion
For the experimental setup shown in Figure 1, we used a BLS with a power of -1.5 dBm/nm around 1,550 nm (LiComm OFB-BCM-21AP), an FBG sensor head with a central wavelength of 1,549.96 nm, an MZ-EOM with a bandwidth of 10 GHz (Photoline MXAN-LN-10), a CFBG with a central wavelength of 1,550.48 nm, a chirped bandwidth of 2.88 nm, a grating length of 27.4 mm, a PD with a bandwidth of 25 GHz (New Focus Model 1414), an RF amplifier with a gain of 25 dB (Mini-Circuits ZHL-6A), and an NA with an output RF signal of 10 dBm and 1601 sampling points (Agilent E5061B). The DC bias voltage was set at 2.50 V. Due to the polarization effect, one polarization controller had to be added in front of the MZ-EOM, and the optical fiber length between the MZ-EOM and CFBG was 2.562 m.
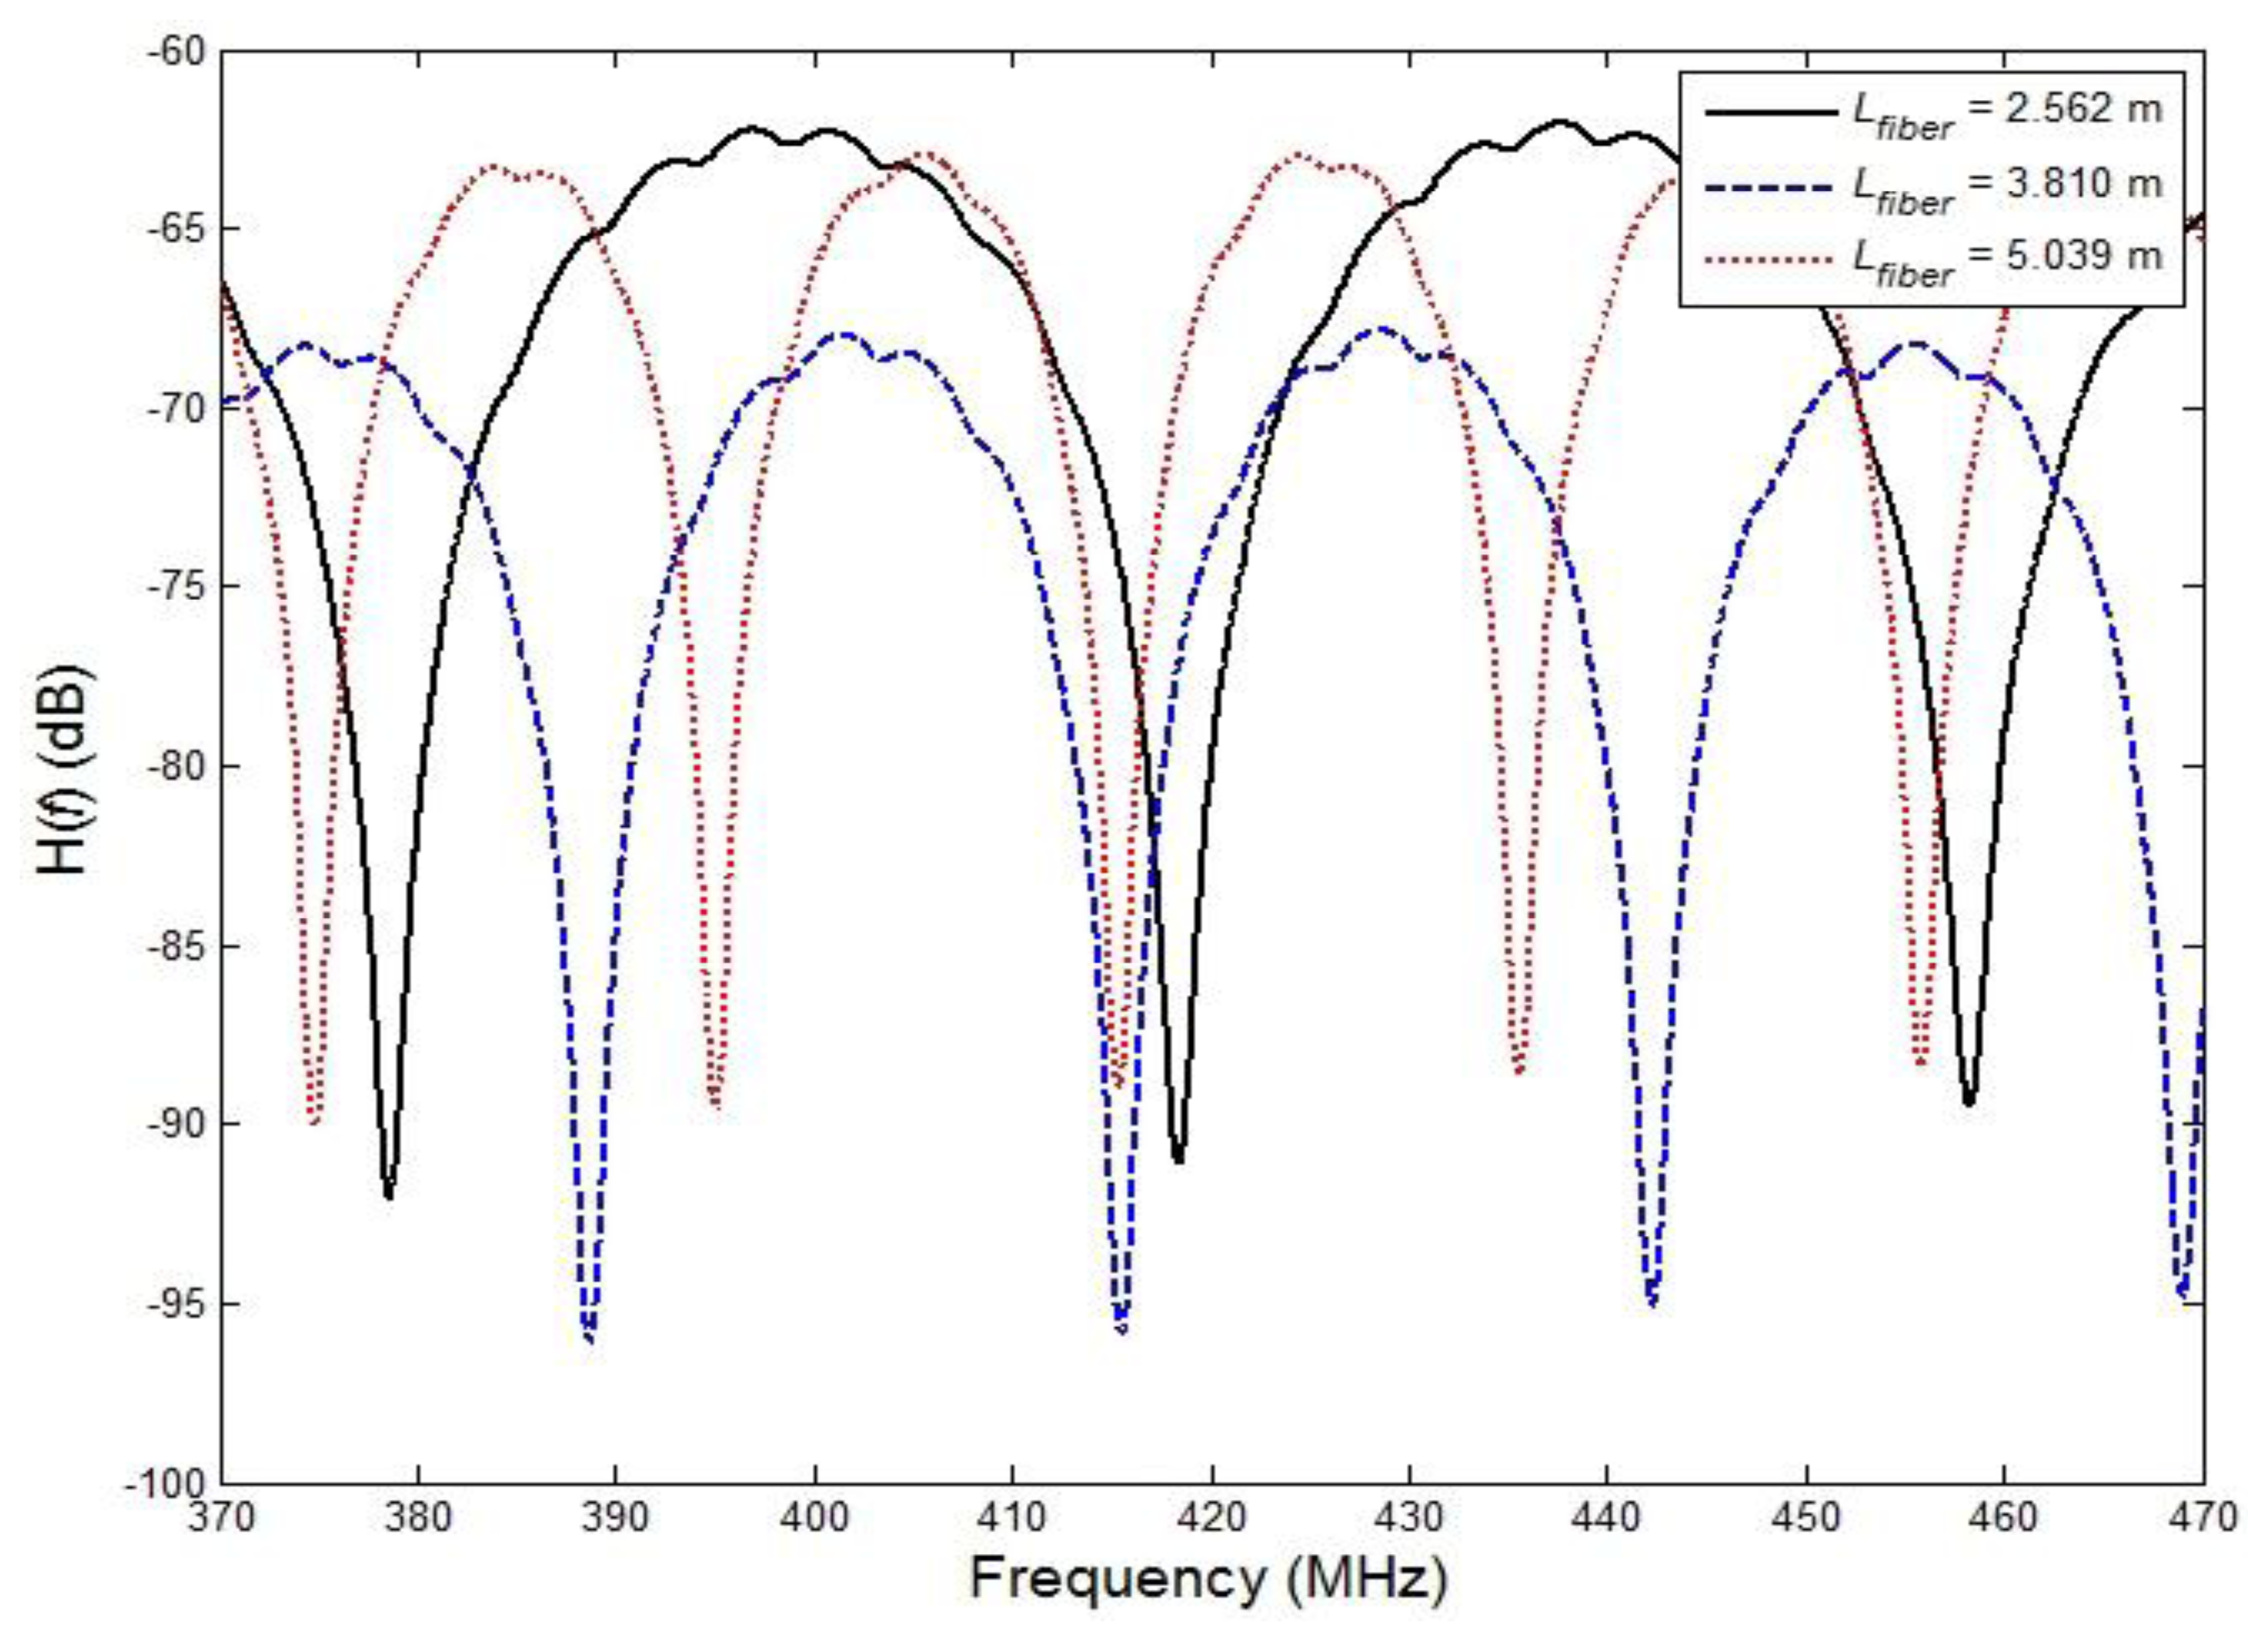
Figure 3 shows the experimental results obtained with the proposed RF interrogation system, namely the transfer function H(f) for three different optical fiber lengths between the MZ-EOM and CFBG over a modulation frequency range of 370 MHz to 470 MHz. From the peak values, it can be determined that the FSRs in Equation (5) and the travel times in Equation (1) for Lfiber= 2.562 m, 3.810 m, and 5.039 m are 39.853238 MHz and 25.09206 ns, 26.803879 MHz and 37.30803 ns, and 20.260937 MHz and 49.35606 ns, respectively. Obviously, as the optical fiber length increases, the FSR is reduced and the travel time increases. To distinguish the wavelength variation, it is very helpful if the optical fiber length can be as short as possible. Furthermore, the characteristics of the two transfer functions, H1(f) and H2(f), should be quite different, except when the modulation frequency range is significantly lower than the bandwidth of the MZ-EOM, in which case the optimal measuring range should be selected near a frequency of 500 MHz.
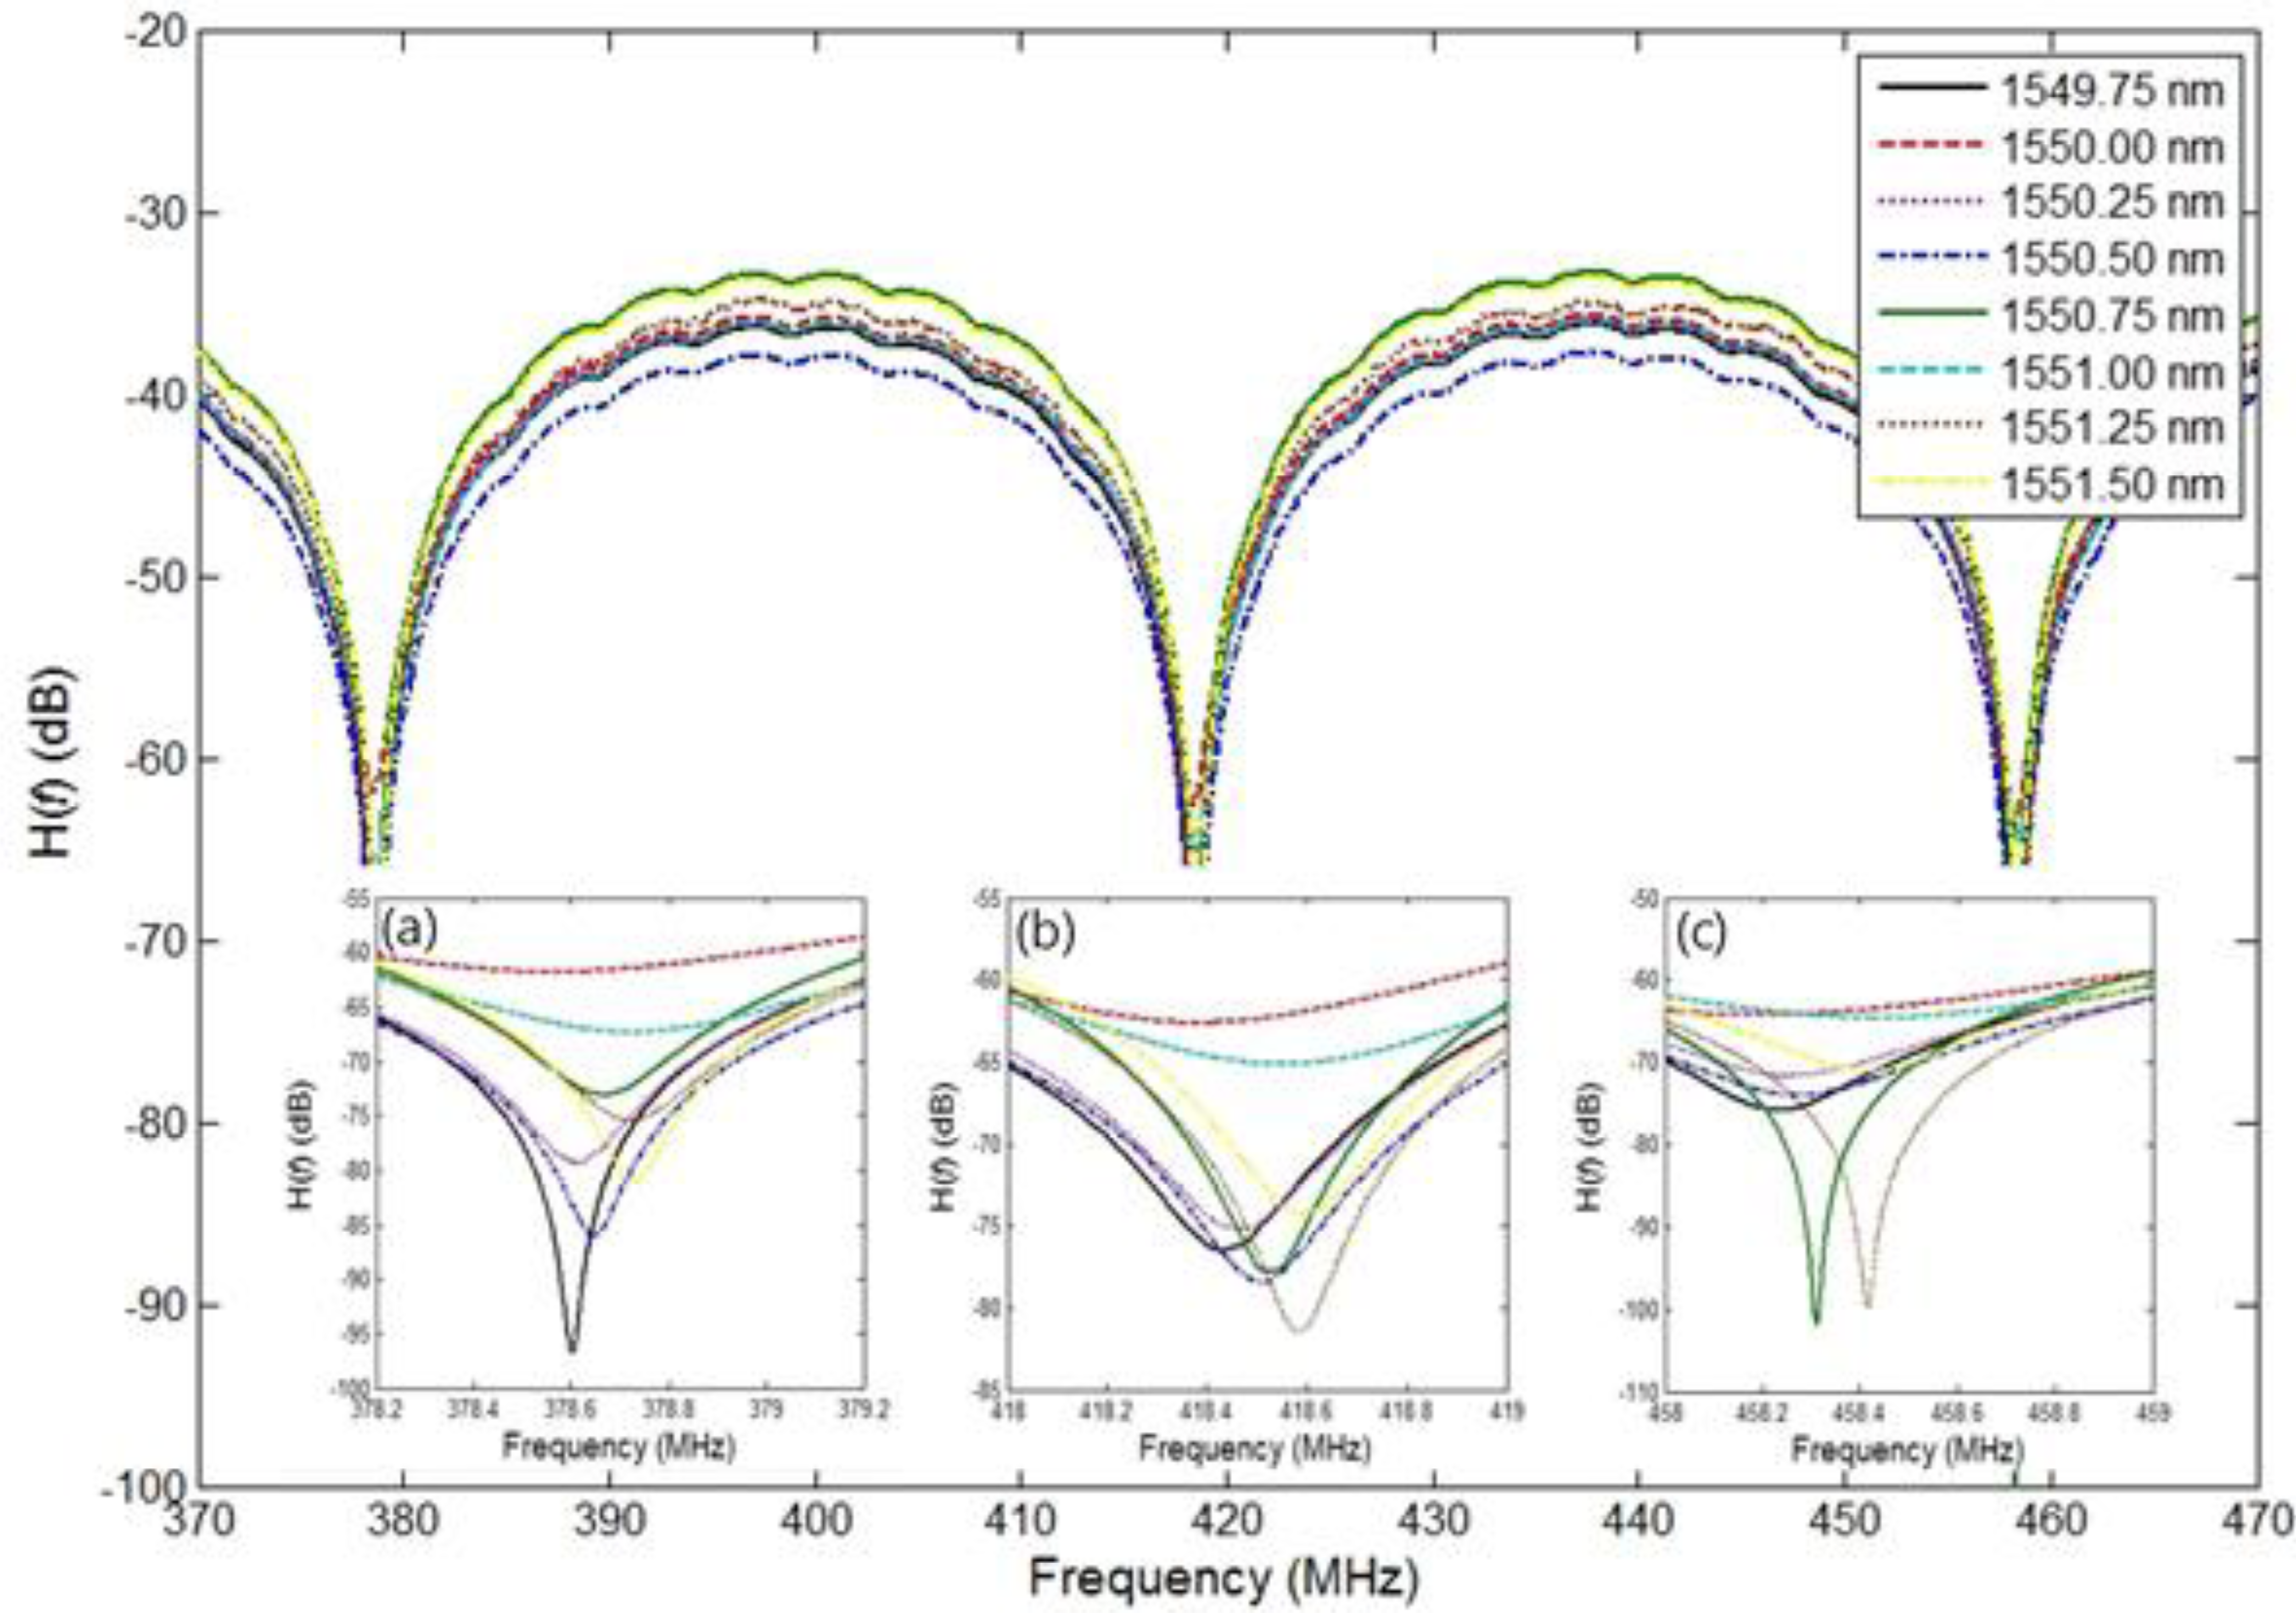
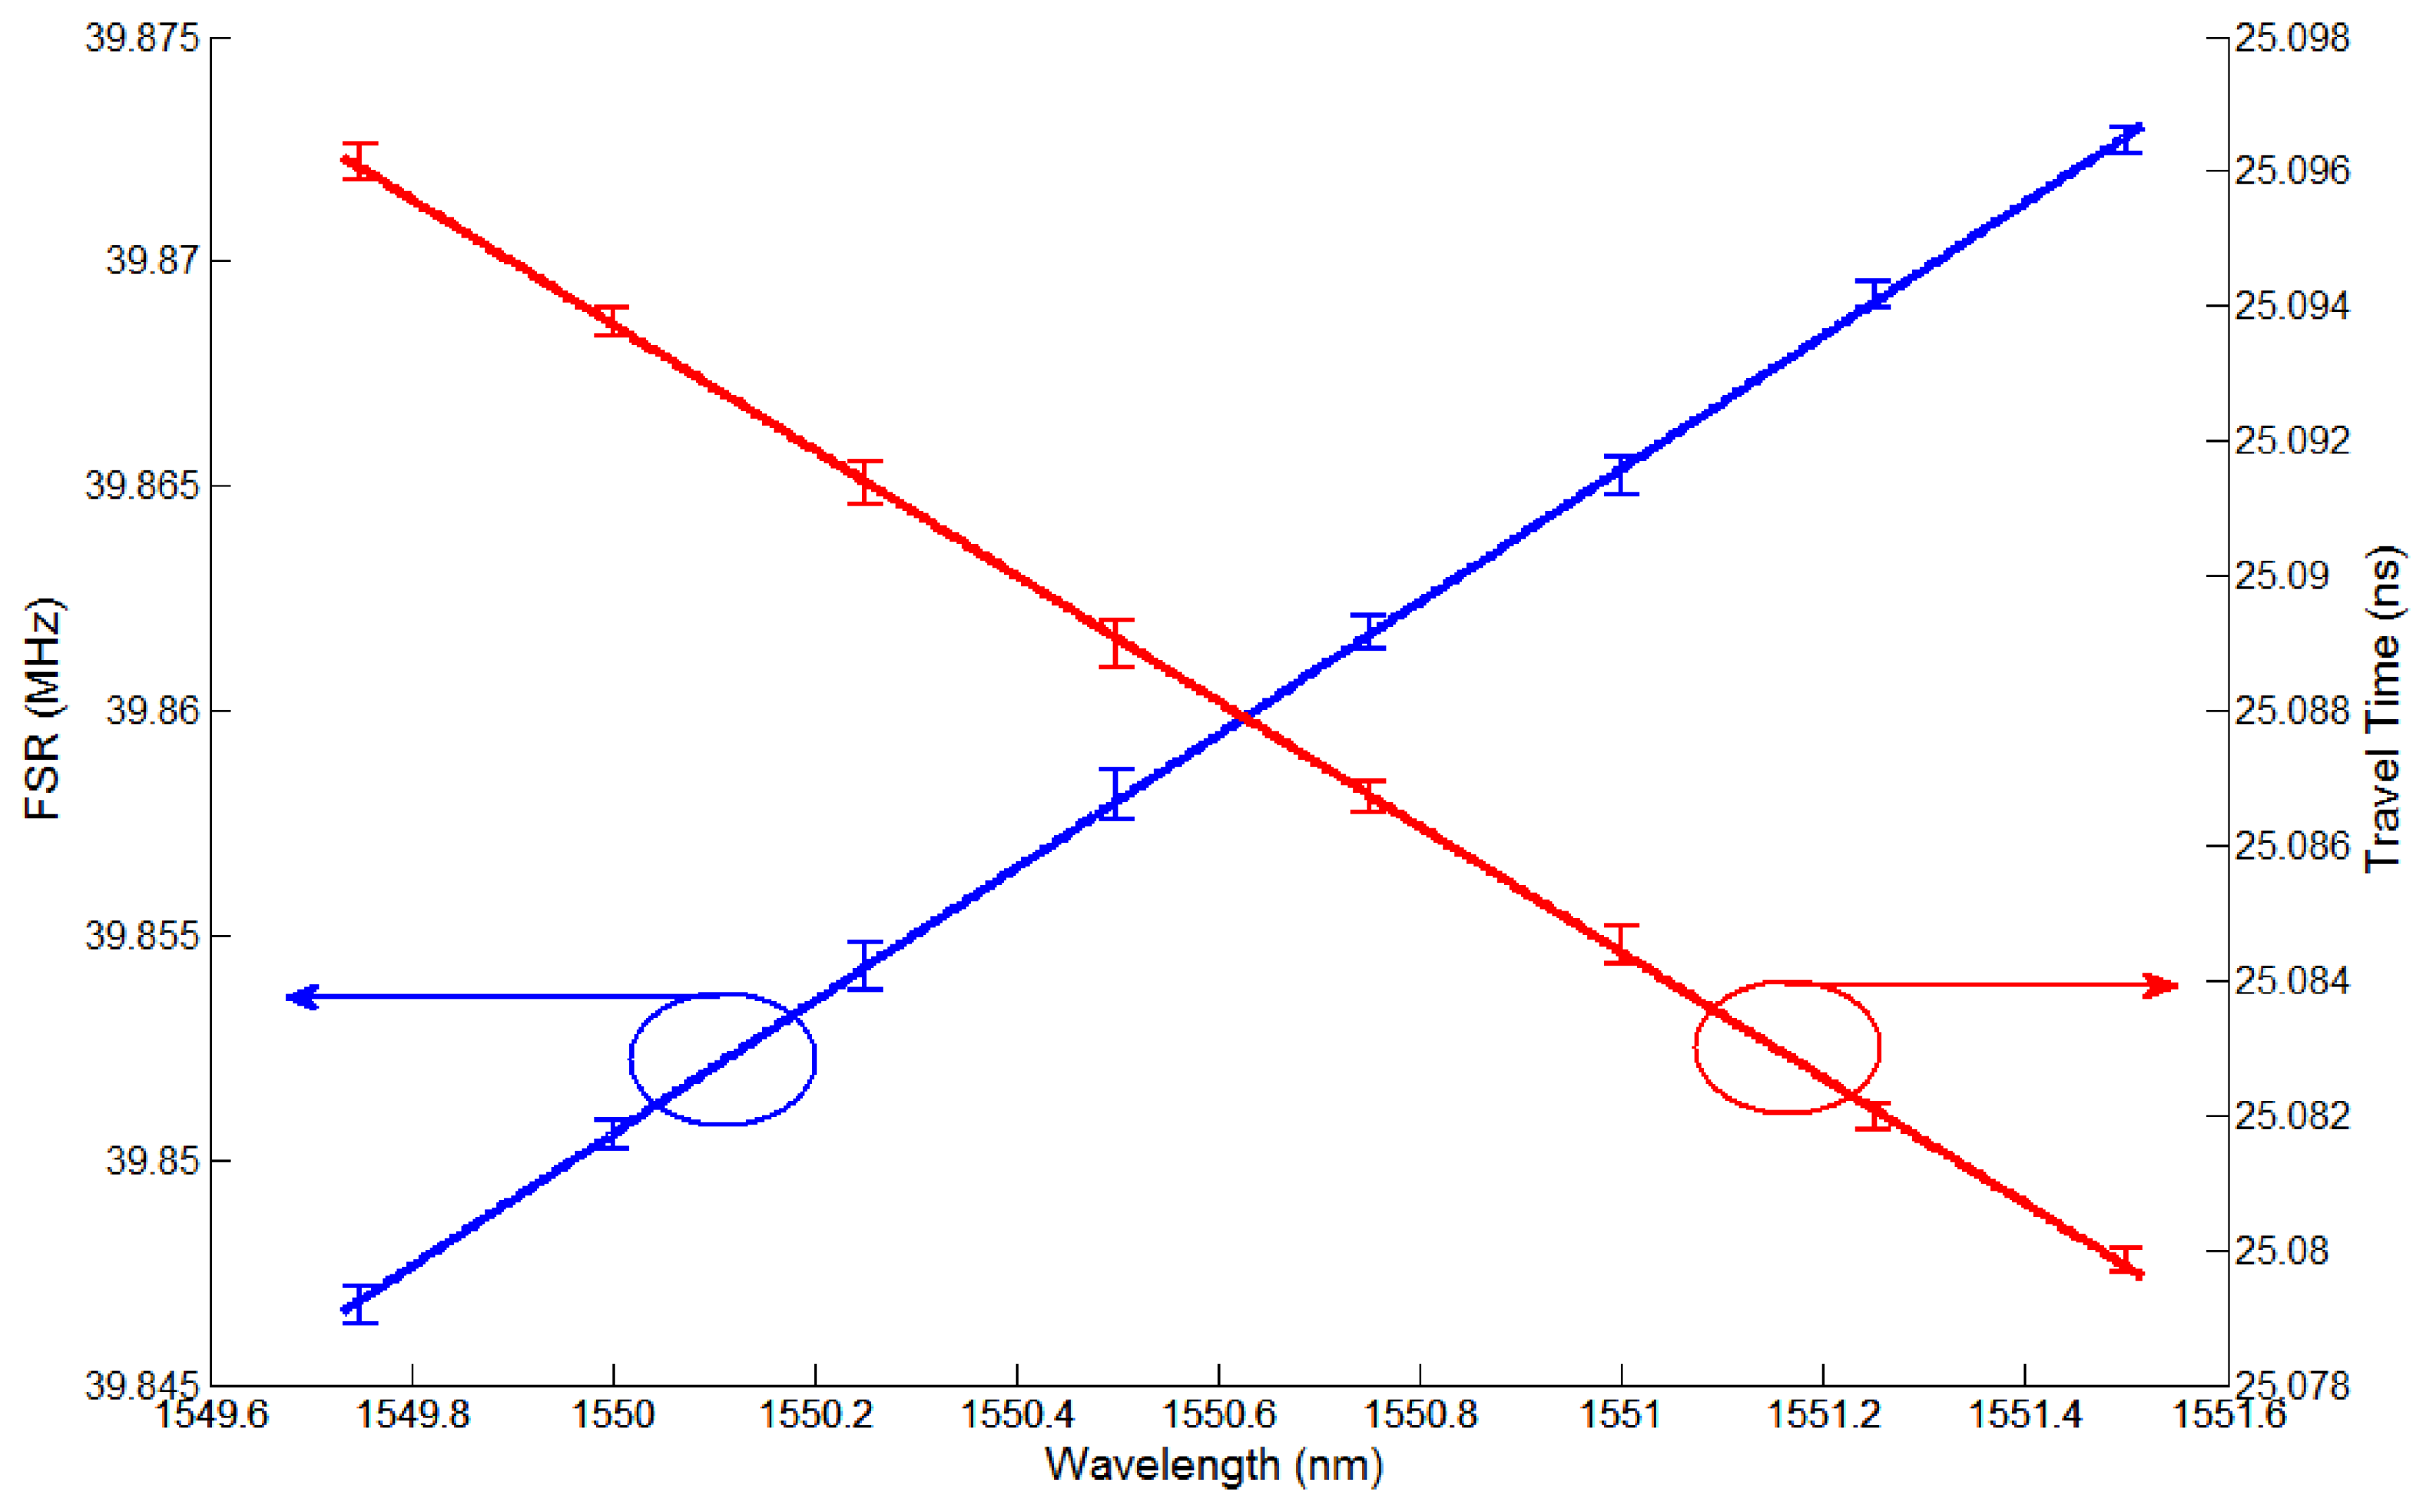
An additional experiment was conducted to investigate the issue of wavelength variation resolution. For convenience, we used a tunable laser source instead of the wavelength variation of the FBG sensor head. Figure 4 shows the experimental results obtained for the transfer function H(f) for eight wavelengths (ranging from 1,549.75 nm to 1,551.50 nm in 0.25 nm steps) in the frequency range of 370 MHz to 470 MHz when a tunable laser source was used. To read a more accurate value, we chose three frequency ranges in a 1 MHz span, thus 378.2 MHz to 379.2 MHz, 418 MHz to 419 MHz, and 458 MHz to 459 MHz as shown in Figure 4(a–c). Since the NA has 1601 sampling points, the measurement resolution of a 1 MHz span will be 0.625 kHz. Furthermore Figure 4(a–c) show the values with a mean of 100 measured values and a smoothing effect of 20%. From these values, we can determine the FSRs for the eight wavelengths shown in Figure 4, which are shown in Figure 5. Also, Figure 5 shows travel times corresponding to the FSRs for the eight wavelengths, which are 25.09606 ns and 25.07976 ns at the first wavelength of 1,549.75 nm and last wavelength of 1,551.50 nm, respectively. We measured each value five times for each of the different wavelengths and plotted two straight lines using the linear polynomial type fitting with least squares method. In all cases, relative errors were within 3%. We note that the relationship between the time delay and the wavelength variation is linear with a gradient of 9.31 ps/nm.
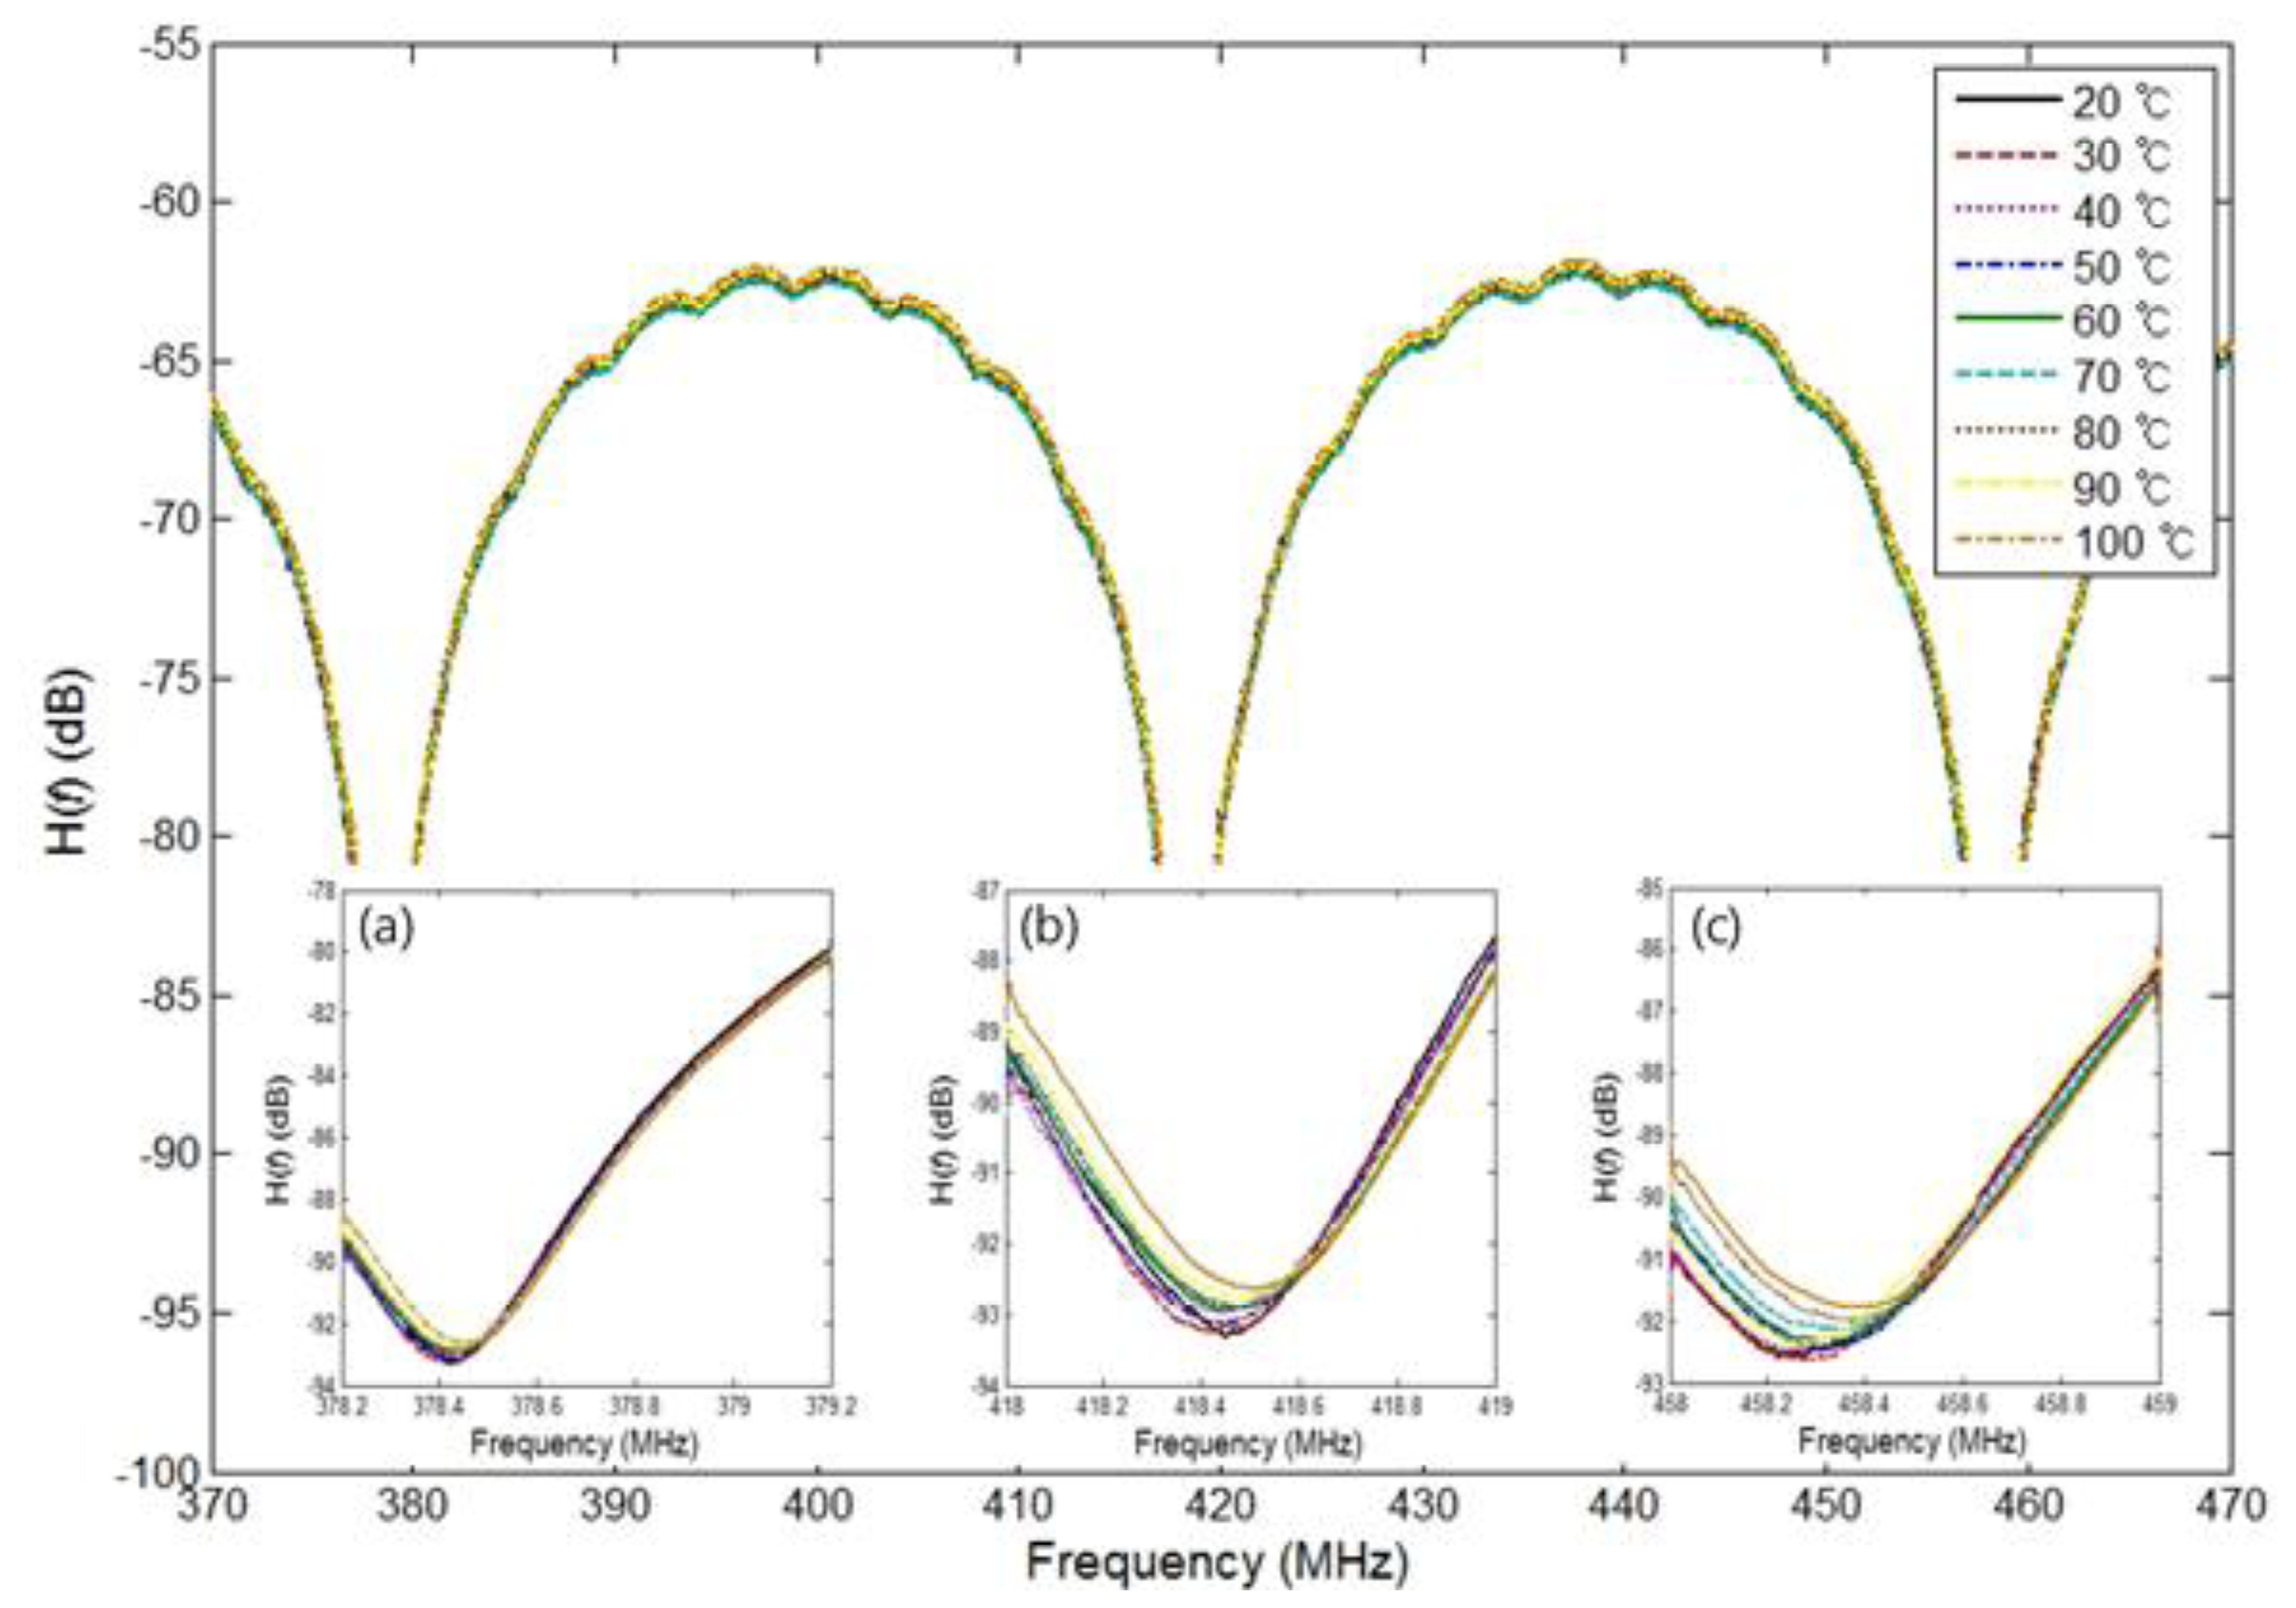
To apply the proposed structure with an actual measurement, we measured the temperature with an FBG sensor head with a central wavelength of 1,549.96 nm, an FWHM of 0.47 nm, and a reflectance of 77.664%. An FBG sensor head is put in a temperature chamber to help control the temperature. Figure 6 shows the experimental results of the transfer function H(f) as a function of the temperature at 20 °C to 100 °C in 10 °C steps in the frequency range of 370 MHz to 470 MHz. Also, we chose three frequency ranges in a 1 MHz span, 378.2 MHz to 379.2 MHz, 418 MHz to 419 MHz, and 458 MHz to 459 MHz, as shown in Figures 6(a–c), which show the values with a mean of 100 measured values and a smoothing effect of 20%.
From these values, the FSRs are determined for nine temperatures, which are shown in Figure 7. Figure 7 also shows travel times corresponding to the FSRs for nine temperatures, which are 25.09490 ns and 25.08744 ns at the first temperature of 20 °C and the last temperature of 100 °C, respectively. We confirmed that the relationship between the time delay and the temperature variation is linear with a gradient of 0.93 ps/10 °C. The relative errors in Figure 7 are larger than those in Figure 5 due to the inaccuracy of the temperature chamber. The system performance can be further improved by using a shorter optical fiber length between MZ-EOM and CFBG, a longer grating length of the CFBG, an increased number of NA sampling points, and an optical source with larger output power.
4. Conclusions
We have proposed and experimentally demonstrated the RF interrogation of an FBG sensor using bidirectional modulation of an MZ-EOM. The transfer functions for wavelength variation and temperature variation of the proposed system were obtained experimentally. The calculated travel time from the transfer function results in a time delay for the sensing wavelengths over the optimal measuring range. In this study, a good linear relationship between the time delay and wavelength variation with a gradient of 9.31 ps/nm was achieved. An actual measurement for temperature variation with the proposed structure shows that the time delay and the temperature variation have a good linear relationship with a gradient of 0.93 ps/10 °C. Therefore, the proposed FBG sensor RF interrogation system shows potential for use in FBG temperature or strain sensing and other multiplexed sensor applications.
Acknowledgments
This work was supported by a National Research Foundation of Korea (NRF) grant funded by the Korean government (MSIP) (2012-0009151), the Basic Science Research Program through the NRF funded by the MEST (2011-0010473), and the research funds of Chonbuk National University in 2010.
Conflict of Interest
The authors declare no conflict of interest.
References
- Kersey, A.D.; Davis, M.A.; Patrick, H.J.; LeBlanc, M.; Koo, K.P.; Askins, C.G.; Putnam, M.A.; Friebele, E.J. Fiber grating sensors. IEEE J. Lightw. Tech. 1997, 15, 1442–1463. [Google Scholar]
- Yin, S.S.; Ruffin, P.B.; Yu, F.T.S. Fiber Optic Sensors, 2nd ed; CRC Press: Boca Raton, FL, USA, 2008. [Google Scholar]
- Fu, H.Y.; Zhang, W.; Mou, C.B.; Shu, X.W.; Zhang, L.; He, S.L.; Bennion, I. High-frequency fiber bragg grating sensing interrogation system using sagnac-loop-based microwave photonic filtering. IEEE Photon. Tech. Lett. 2009, 21, 519–521. [Google Scholar]
- Fu, H.Y.; Liu, H.L.; Dong, X.; Tam, H.Y.; Wai, P.K.A.; Lu, C. High-speed fibre Bragg grating sensor interrogation using dispersion-compensation fibre. Electron. Lett. 2008, 44, 618–619. [Google Scholar]
- Jeon, K.S.; Kim, H.J.; Kang, D.S.; Pan, J.K. Optical fiber chromatic dispersion measurement using bidirectional modulation of an optical intensity modulator. IEEE Photon. Tech. Lett. 2002, 14, 1145–1147. [Google Scholar]
- Kashyap, R. Fiber Bragg Gratings; Academic Press: San Diego, CA, USA, 1999. [Google Scholar]
- Capmany, J.; Ortega, B.; Pastor, D. A tutorial on microwave photonic filters. IEEE J. Lightw. Tech. 2006, 24, 201–229. [Google Scholar]


© 2013 by the authors; licensee MDPI, Basel, Switzerland. This article is an open access article distributed under the terms and conditions of the Creative Commons Attribution license (http://creativecommons.org/licenses/by/3.0/).
Share and Cite
Choi, S.-J.; Mao, W.; Pan, J.-K. Novel RF Interrogation of a Fiber Bragg Grating Sensor Using Bidirectional Modulation of a Mach-Zehnder Electro-Optical Modulator. Sensors 2013, 13, 8403-8411. https://doi.org/10.3390/s130708403
Choi S-J, Mao W, Pan J-K. Novel RF Interrogation of a Fiber Bragg Grating Sensor Using Bidirectional Modulation of a Mach-Zehnder Electro-Optical Modulator. Sensors. 2013; 13(7):8403-8411. https://doi.org/10.3390/s130708403
Chicago/Turabian StyleChoi, Sang-Jin, Wankai Mao, and Jae-Kyung Pan. 2013. "Novel RF Interrogation of a Fiber Bragg Grating Sensor Using Bidirectional Modulation of a Mach-Zehnder Electro-Optical Modulator" Sensors 13, no. 7: 8403-8411. https://doi.org/10.3390/s130708403
APA StyleChoi, S.-J., Mao, W., & Pan, J.-K. (2013). Novel RF Interrogation of a Fiber Bragg Grating Sensor Using Bidirectional Modulation of a Mach-Zehnder Electro-Optical Modulator. Sensors, 13(7), 8403-8411. https://doi.org/10.3390/s130708403