Micro-Raman Spectroscopy and Univariate Analysis for Monitoring Disease Follow-Up


Abstract
: Micro-Raman spectroscopy is a very promising tool for medical applications, thanks to its sensitivity to subtle changes in the chemical and structural characteristics of biological specimens. To fully exploit these promises, building a method of data analysis properly suited for the case under study is crucial. Here, a linear or univariate approach using a R2 determination coefficient is proposed for discriminating Raman spectra even with small differences. The validity of the proposed approach has been tested using Raman spectra of high purity glucose solutions collected in the 600 to 1,600 cm−1 region and also from solutions with two known solutes at different concentrations. After this validation step, the proposed analysis has been applied to Raman spectra from oral human tissues affected by Pemphigus Vulgaris (PV), a rare life-threatening autoimmune disease, for monitoring disease follow-up. Raman spectra have been obtained in the wavenumber regions from 1,050 to 1,700 cm−1 and 2,700 to 3,200 cm−1 from tissues of patients at different stages of pathology (active PV, under therapy and PV in remission stage) as confirmed by histopathological and immunofluorescence analysis. Differences in the spectra depending on tissue illness stage have been detected at 1,150–1,250 cm−1 (amide III) and 1,420–1,450 cm−1 (CH3 deformation) regions and around 1,650 cm−1 (amide I) and 2,930 cm−1 (CH3 symmetric stretch). The analysis of tissue Raman spectra by the proposed univariate method has allowed us to effectively differentiate tissues at different stages of pathology.1. Introduction
In the last years micro-Raman spectroscopy [1] has shown to be a very promising tool for specific molecular fingerprinting in medical applications. Its success has been strongly boosted by the development of specific data analysis methods enabling the extraction of the wealth of information embedded in Raman spectra of complex samples, such as human tissues, fluids and humours. When large numbers of patients and data are available multivariate methods have been employed for analysing blood and other human aqueous matrices [2–4] and pathological human tissues [5,6]. Principal Component Analysis (PCA) methods have been able to classify oral tissues into different categories depending on the stage of the specific disease (normal, inflammatory, premalignant and malignant) [7]. When a few samples have to be examined, different approaches for comparing Raman spectra have been developed and applied in order to evaluate the occurrence of changes in signal intensity or in spectrum peak configuration with respect to a reference signal [8–13]. In general, the information has been obtained from the direct comparison of selected band areas [8–10] or of single peak intensities [11,12], relevant to the sample state or configuration. When the spectrum modifications are relatively weak, it can be difficult to quantitatively evaluate the effect of possible changes in state or configuration on small spectral regions, because of the presence of noise, background or spurious signals. A global analysis of the spectrum can provide some advantages in the evaluation of spectral changes, especially when the spectra to be compared have a close configuration. Several correlation methods have been typically employed in these cases [14,15] in order to enhance similarities or correlation in the data sets.
In this paper, a univariate approach is proposed for analyzing Raman spectra when only a few samples are available, as in the case of a rare pathology or in the initial stages of a pilot study. The validation and assessment steps have been performed using controlled samples, consisting of high purity glucose aqueous solutions and aqueous mixtures in which different glucose concentrations are present, together with other substances. After the assessment, the proposed approach has been applied to differentiate oral tissues from patients affected by Pemphigus Vulgaris (PV) at different illness stages in order to monitor disease progression and therapy efficacy. PV is a rare life-threatening autoimmune disease that causes blistering of the skin and oral cavity, being characterized by the disruption of keratinocytes’ adhesion [16,17]. The follow-up monitoring of PV is usually accomplished by means of histological features and immunofluorescence analysis. However, alternative techniques for disease follow-up should be developed to better understand the disease progression and to avoid multiple biopsies.
The proposed approach for spectrum analysis can be considered as an extension of the many methods reported in the literature for quantitatively comparing Raman signals [8–13] and it could be particularly useful for comparing Raman responses from different and independent samples of similar materials, such as tissue biopsies. In spite of their differences due to individual characteristics and history, previous work [5–7] has shown that a basic common profile may be expected for Raman responses from tissues of subjects in the same state of pathology. The method here proposed permits one to find out the similarities in the spectra and to discriminate the spectra exhibiting possible anomalies, thus providing a powerful tool for the analysis of spectra with small differences.
2. Experimental Section
2.1. Sample Preparation and Data Acquisition
Glucose aqueous solutions and aqueous mixed solutions of glucose and artificial sweeteners were used as control samples. High purity glucose powder (>99%) was purchased from Riedel de Haën AG (Buchs, Switzerland) and used without any further treatment. The main components of the commercial sweetener here used were sorbitol, mannitol, fructose and saccharin sodium as reported on the product’s label. A proper amount of glucose powder was dissolved in distilled water to obtain glucose concentrations, [Glu], in the 25 mM–1,050 mM range. Glucose and commercial sweetener were also dissolved in distilled water for preparing six samples with different relative concentrations as indicated in Table 1.
Biopsies of oral tissues from patients with histological and immunofluorescence confirmed PV were used as complex samples. Patients (two subjects) with detectable titres of anti-Inter Cellular Substance Immunoglobuline G (ICS IgG) and at least two oral/skin lesions were considered as “active PV”, whereas those taking immunosuppressive agents at the time of biopsy collection were referred to as “PV in therapy” (two subjects). Patients having no more clinical evidence of blisters and ICS titres <1:40 at the end of the therapy were considered as “PV in remission” (recovered—two patients). Informed consents were obtained from all participants prior to biopsy. Two oral biopsies were obtained from each patient: one was used for direct immunofluorescence tests, and the other for Raman investigations. Samples were put in ice-cold saline immediately after removal and used immediately. When storage was necessary, samples were frozen at liquid nitrogen and stored at −80 °C. They were taken out and passively thawed immediately before recording the spectra. Such a procedure had been shown to not provoke changes in the Raman spectra of tissues [18].
Samples were examined using a micro-Raman spectrometer equipped with a confocal inverted microscope (Horiba-Jobin Yvon, Jongjumeau, France) with a grating of 1,800 grooves/mm, a liquid nitrogen cooled CCD detector (1,024 × 256 chip size) and a 17 mW He-Ne laser operating at 633 nm. The laser light was focused on the sample surface by means of a 50× optical objective (Olympus MPLAN 50×/0.75). The laser excitation spot has dimension of about 20 μm and the actual analyzed area is estimated in about 15 μm2 for the microscope configuration adopted with a laser power at sample level equal to few mW. The micro-Raman spectra were detected in the 600–1,600, 1,000–1,700 and 2,700–3,200 cm−1 wavenumber shift regions. The spectra were obtained using accumulation times of 600 seconds. For each samples measurements were performed three times on different sites obtaining a total of one hundred files.
Spectra were preliminarily analyzed using the application routines provided by the software package (“SpectraMaxTM Software” User Guide, Jobin-Yvon Inc., Edison, NJ, USA) controlling the whole data acquisition system. The spectra typically show a smeared background signal, with intensity of order of about 80% of the whole average intensity. A baseline correction program from the data acquisition software is used. The procedure consists in fixing some points of the spectra (in our case four points) and to subtract to the experimental data the cubic curve obtained by the fit of this fixed points. Typically the background level is weakly dependent on the wavenumber position, with respect to the Raman component of the signal, and this operation, in spite of its intrinsic arbitrariness weakly influences the information and repeatability of the process. No further treatment has been done before the comparison of the data by means of linear regression.
For signal interpretation the complex spectra were also analyzed in terms of convoluted Lorentzian shaped vibration modes [19,20]. Peaks constituting the spectrum were manually selected in order to define the starting conditions for a best-fit procedure. The best-fit procedure was then performed to determine convolution peaks with optimised intensity, position and width. Its performance was evaluated by means of the χ2 parameter defined, as usual, by the following formula:
2.2. Univariate Data Analysis
For each wavenumber point, Raman intensity of the spectrum (yi variable) is compared with the corresponding value of a reference spectrum (xi variable), referring to a sample in pristine condition or to a solution with known concentration. In order to overcome constraints related to the possible different scale of the experimental data, the data set is directly correlated with a linear scaling of the reference signal. This means to do a linear regression or univariate analysis of the data. The basic assumption is that the spectrum Y (containing the n data yi) is a linear function of the reference spectrum X (containing the n data xi). All variations with respect to the reference signal are considered as a perturbation term εi:
If no structural change occurs in the substance generating the Raman spectra, the term ɛi depends only on the experimental conditions and we can assume that it has random values that follow a Gaussian distribution, with mean 0 and variance σx, which does not depend on the index i [19]. This assumption implies that the yi are also normally distributed, with σy = σx. Regression analysis allows to determine, by means of a least square fit of data yi with respect to xi, the parameters m and p and to identify the linear dependence. A parameter useful to check how well a regression equation fits the data is the sample coefficient of determination, R2 [14, 21]. It is defined as:
R2 ranges from 0 for uncorrelated data, to 1 for perfect linear dependence. When the error ɛ is purely random, the value of R2 is equivalent to the square of the covariance ryŷ, calculated for the vector Y and the prediction vector Ŷ having components ŷi = mxi + p, which is defined as [14,19]:
R2 is thus an index of the correlation between the considered set of data and the linear dependence on the reference signal, as we have postulated. The linear regression was evaluated on a number of points ranging between 500 and 700. Due to the high number of points considered, the values reported for R2 in the next paragraph imply a high level of significance.
3. Results and Discussion
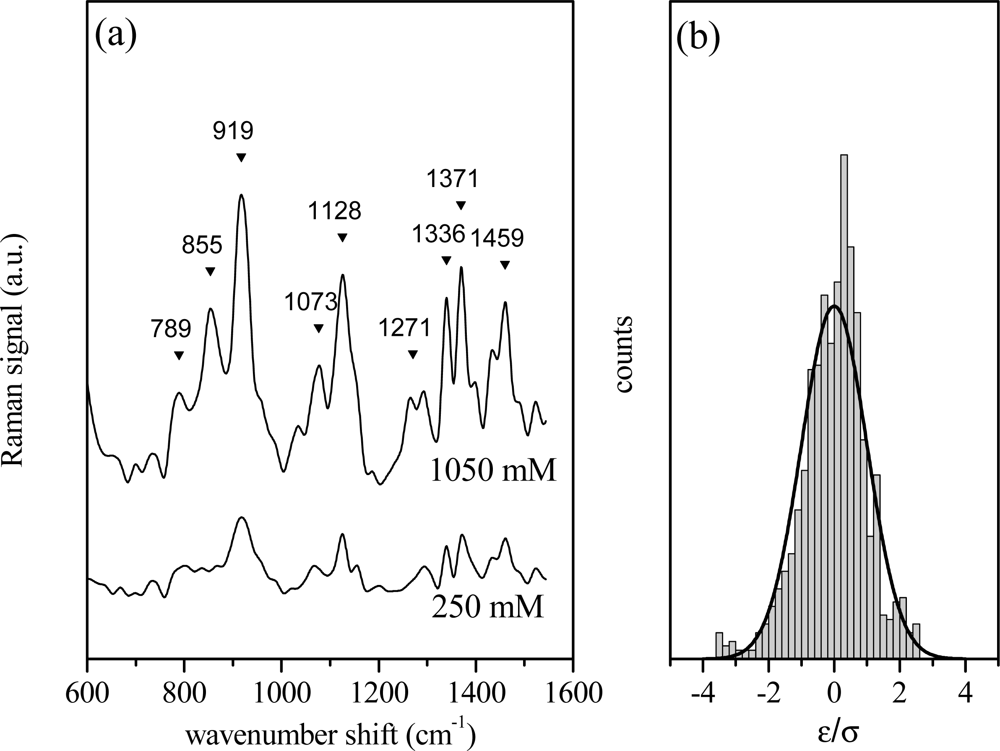
The above described univariate or linear regression approach has been firstly applied to aqueous glucose solutions to simulate an experimental situation in which Raman spectra were obtained from different samples with no structural differences. In Figure 1a the spectra of two glucose solutions at nominal concentrations cx = 1,050 mM (reference data, X) and cy = 250 mM (Y data) are shown. The spectra have been analyzed in terms of Lorentzian shaped vibration modes as reported in previous section and in refs. [19,20]. The displayed interval represents the fingerprint region and is the most significant for the investigated samples. The presence of the characteristic bands of the α anomer at 789, 855, 919, 1,336 and 1,371 cm−1 and those of β anomer at 1,073, and 1,128 cm−1 indicates that glucose in solution is a mixture of the two anomers with s predominance of the β configuration, as indicated by their relative intensities [22,23]. The peaks at 1,401 and 1,430 cm−1 can also be attributed to glucose, as reported in Reference [24]. The contributions at 968, 1,036 and 1,524 cm−1 can be related to some impurities present even in the high purity glucose powder (>99%) employed in the present experiments. The histogram of the residual values (ɛi = yi − mxi − p) normalized to the value of standard deviation σy is shown in Figure 1b. As is evident, the distribution follows a Gaussian dependence, according to the assumption of our hypothesis. In this case, R2 has a quite high value (R2 = 0.910), close to 1, indicating a good correlation between the two Raman spectra, as expected. In fact, by scrutinizing Figure 1(a), it comes clear that the two spectra differ in intensities and noise characteristics, due to the different glucose content, but the main features are preserved. The differences between the spectra slightly affect the R2 value calculated with respect to the spectrum of the solution at the highest glucose concentration (1,050 mM), which has been selected as reference data. R2 high value indicates that the spectra are very similar.
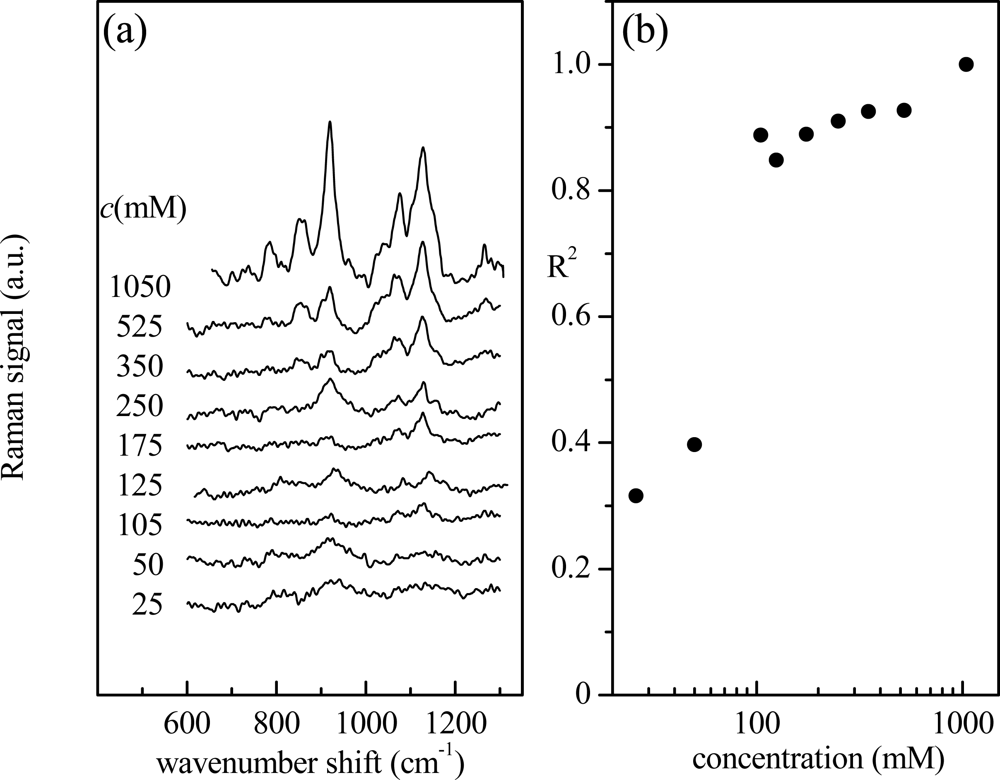
This approach can be extended to evaluate, in a simple way, the spectrum similarity for all the investigated aqueous glucose solutions (with glucose concentration ranging from 25 to 1,050 mM). The corresponding spectra, acquired under the same experimental conditions, are shown in Figure 2(a). These spectra are obviously characterized by the spectral features already described for Figure 1(a). As expected, they have similar main characteristics even though intensity and noise contributions are different. The value of R2, obtained by comparison to the reference spectrum, as a function of glucose nominal concentration is shown in Figure 2(b). For concentrations lower than 125 mM, the Raman signal from glucose becomes comparable to that generated by noise and the correlation with the reference signal decreases abruptly.
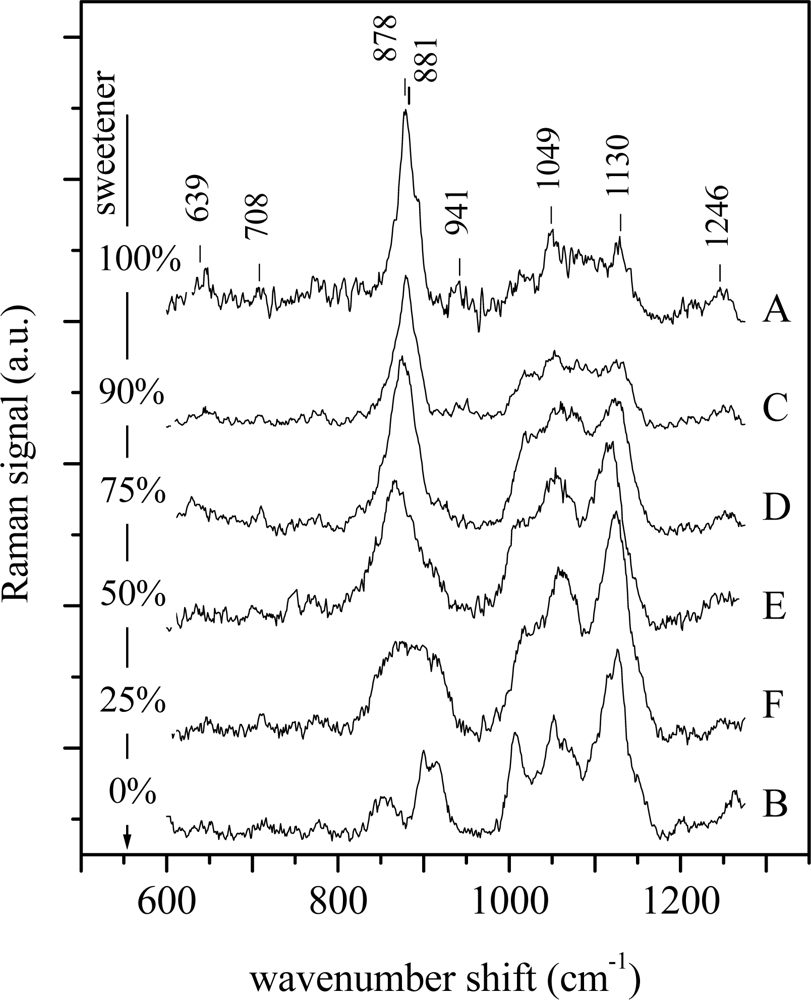
To further test this univariate approach, it has been applied to the spectra from the second set of control samples. These solutions, composed of glucose and artificial sweetener in distilled water, were prepared to simulate samples with different chemical compositions. The experimental spectra are shown in Figure 3. Also in this case the spectra of samples have been analyzed as previously reported. In particular for sample A (pure sweetener) the peaks at 639 cm−1, 708 cm−1 and 881 cm−1 are assigned to fructose, the peaks at 878 cm−1, 941 cm−1 and 1,049 cm−1 can be ascribed to mannitol and sorbitol, while the other two peaks at 1,130 cm−1 and 1,246 cm−1 are due to the contribution of mannitol [25–27].
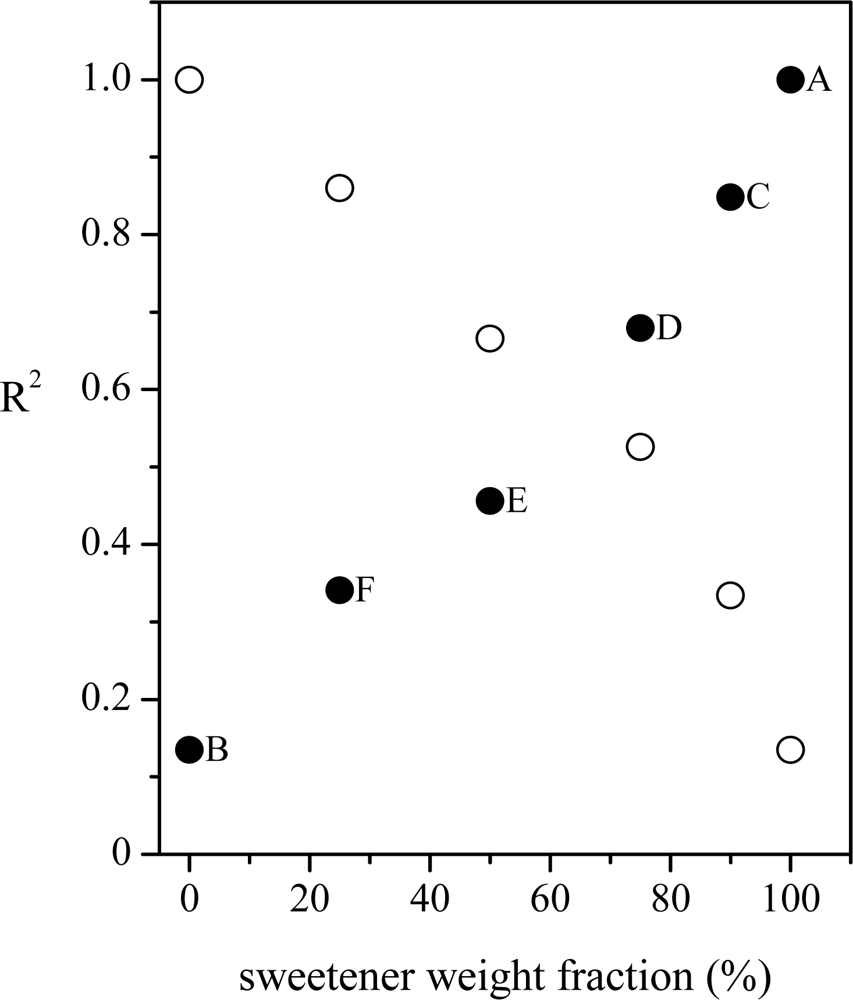
By inspecting the figure, it comes clear that the spectra of C, D, E and F samples are a superposition of the spectra of pure sweetener (sample A) and pure glucose (sample B), as expected. Also in this case the linear regression approach has been applied by considering, in turn, both spectra of samples A and B as reference, the results being shown in Figure 4. In both the cases the approach seems to work well. In fact, when the pure glucose solution is used as reference, the R2 coefficient reaches its highest value (close to 1, meaning high similarity) when the reference spectrum is compared to that of pure glucose solution and has decreasing value when the glucose content decreases. The lowest similarity (lowest R2 value, close to 0) is obtained when the spectrum of the pure sweetener solution is analyzed. Specular results have been obtained when the spectrum of the pure sweetener is used as reference. In that case, the highest correlation (and, thus, the highest similarity) is observed when the spectrum of the pure sweetener is considered, while R2 assumes a value close to 0 when the spectrum of pure glucose is compared with the reference. It’s worth noting that the R2 values cover all the available range (0–1) and that there is a clear dependence on the sample chemical compositions, thus suggesting the ability of the method to discriminate between spectra, even when the differences are small.
These encouraging results with samples of increasing degree of complexity have boosted us to apply the proposed approach to very complex Raman spectra as those from oral tissues from patients affected by PV at different illness stages that are characterized by different chemical and structural properties [16,17] in order to monitor the disease evolution and the therapy efficacy.
Representative Raman spectra (1,050–1,700 cm−1 spectral region) of oral biopsies from PV affected patients, from patients under therapy and from patients in a remission stage of illness (recovered) are shown in Figure 5(a,b,c), respectively. Main structures around 1,150 cm−1 (C-C stretch and COH deformation), 1,225 cm−1 (amide III), 1,340 cm−1, 1,430–1,450 cm−1 (CH3 deformation), 1,560 cm−1 and 1,636 cm−1 (amide I) are observed in all the spectra (see references [28] and [29] for attributions), their shape and intensity may be dependent on tissue illness stage. For instance, in Figure 5(a) very poor structures in the initial 1,250–1,400 cm−1 region are found in the spectrum of PV active tissues. This finding is related to the decreasing content of phospholipids (whose Raman features are known to fall in this region) in diseased tissues compared to normal ones [7]. On the other hand, the region around 1,500–1,650 cm−1 (Figure 5(a)—PV active) is rich in structural features, due to major contributions from proteins [7,29]. These findings are similar to previous literature reports about Raman spectroscopy on normal and cancerous tissues. Pathologies generally do not cause the appearance and the disappearance of peaks and bands in tissue Raman spectra, rather they cause the modification of specific Raman feature structures [7,18,29]. In particular, the outlined changes confirm that the spectrum of normal oral tissue is closer to the lipid spectrum, while the spectra of malignant samples are rich in features assignable to proteins [7,18,30].
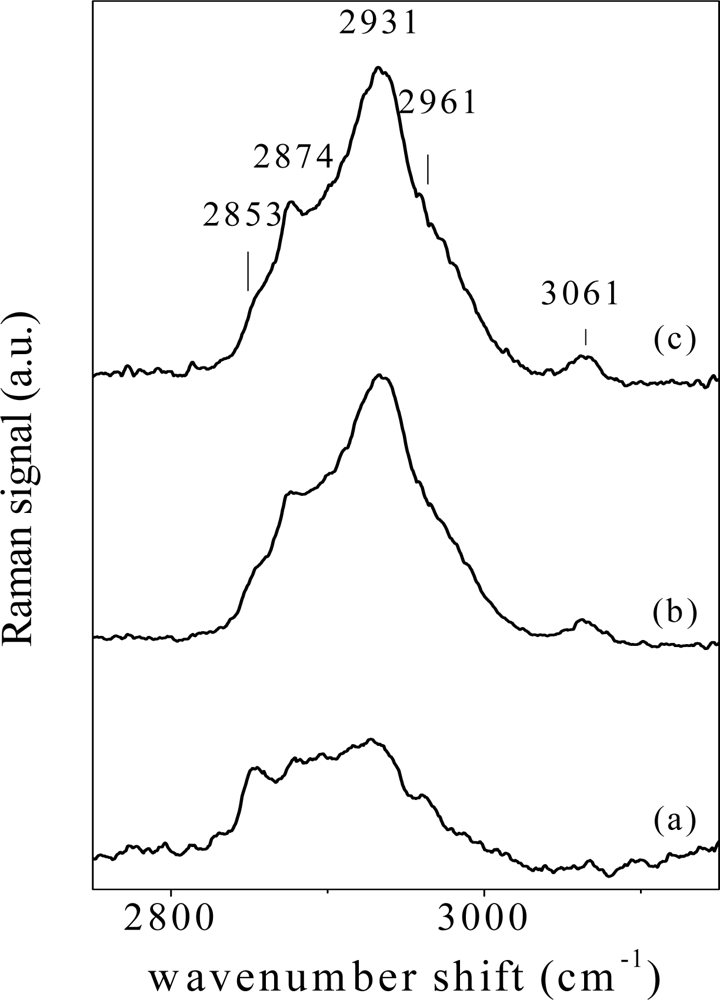
In Figure 6, representative spectra (2,700–3,200 cm−1 wavenumber region) of tissues from oral biopsies from affected PV patients, from patients under therapy and from patients in remission stage of illness (recovered) are shown in Figure 6(a,b,c) respectively. Samples from two different subjects have been considered for each physiological state. Changes of main components at 2,853 cm−1 (CH2 symmetric stretch), 2,874 cm−1 (CH stretch), 2,931 cm−1 (CH3 symmetric stretch), 2,961 cm−1 (CH3 asymmetric stretch) and 3,061 cm−1 (CH olefinic stretch) can be easily observed, depending on tissue illness stage. These structures are generally attributed to lipid contents and can be sensitive to tissue biochemical and structural changes [29].
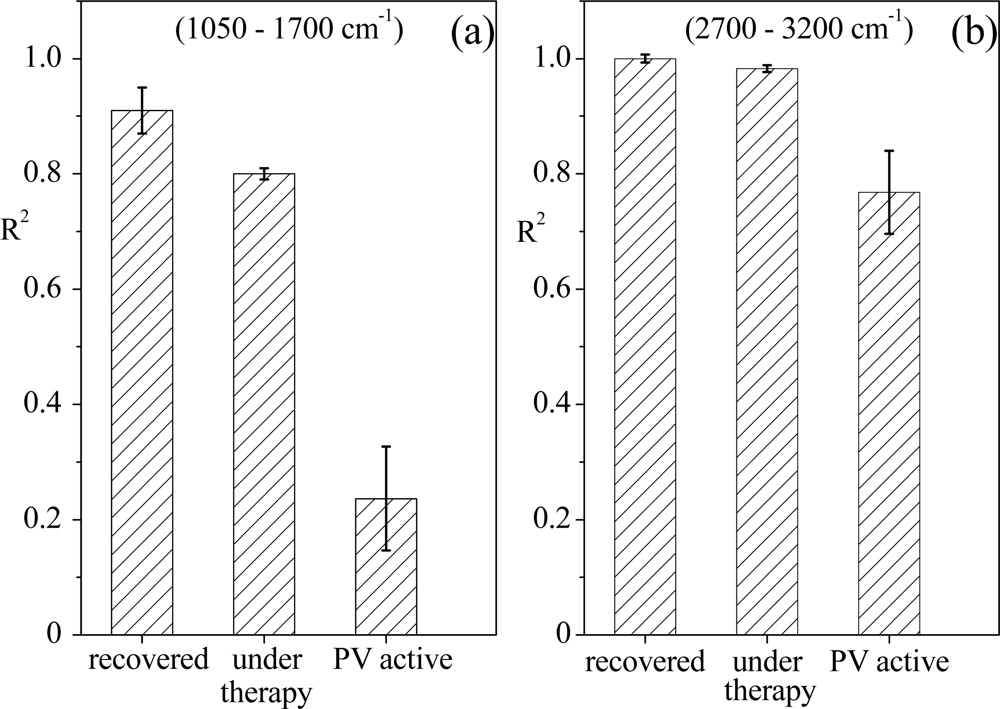
The univariate approach has been applied to the oral tissue spectra, considering the two different wavenumber ranges. By taking one spectrum from tissues of recovered patients as reference, the R2 determination coefficient values have been obtained and are reported in Figure 7 for the two examined spectral ranges (similar results were obtained for whatever spectrum of recovered patients we selected).
For both the spectral regions, the R2 parameter has the same behaviour, even though for the 1,050–1,700 cm−1 region the trend is more evident. In particular, when spectra acquired from tissues at the same illness stage are compared, the R2 coefficient is larger than 0.9, confirming that in spite of their differences due to individual characteristics and history, the Raman responses of tissues of subjects in the same state of pathology show a basic common profile, as reported in [5–7]. Since the spectra of samples corresponding to different illness stages are different from that of the reference, the R2 coefficient values decrease and in particular become very low for the spectra of tissue of PV active patients. Hence, it is evident that this univariate analysis may provide quantitative information on differences among tissues from patients at different stages of illness in the two wavenumber ranges under investigation, in agreement with our previous results on serum samples [31].
Moreover, the present results confirm the possibility of also using high wavenumber ranges for tissue characterization of oral tissues and for “in vivo” applications [32–35]. In fact, the use of Raman spectroscopy in the fingerprint spectral region (800–1,800 cm−1) in combination with fiber optics is not easy due to the strong background signal generated in the optical fiber. The necessary suppression of this background signal leads to complicated fiber optic probe designs. As a consequence, probes are relatively large and inflexible, expensive, and it is difficult to achieve reproducible performance with them. In contrast, the high wavenumber spectral region from 2,500 to 3,800 cm−1 is virtually free of signal contributions from the fused-silica-based optical fibers. This provides a major advantage in that fiber optic probes for in-vivo applications can have very simple designs.
4. Conclusions
The proposed univariate method, based on the calculation of the R2 determination coefficient, has been proven to be able to quantitatively discriminate complex Raman spectra obtained from human oral tissues depending on their illness stage in order to monitor disease evolution and therapy, and also when a small number of spectra is available as for a rare pathology like PV. This ability has been demonstrated for low and high wavenumber spectral regions. It is worthwhile to mention that the use of high wavenumber spectral region could reinforce the potential of Raman spectroscopy for “in vivo” applications. This approach can be the starting point for a systematic “in vivo” investigation over a wide number of clinical cases to statistically confirm and to fully assess the reliability of the proposed technique for disease follow-up monitoring.
References
- Hanlon, EB; Manoharan, R; Koo, TW; Shafer, KE; Motz, JT; Fitzmaurices, M; Kramer, JR; Itzkan, I; Dasari, RR; Feld, MS. Prospect for in vivo Raman spectroscopy. Phys. Med. Biol 2000, 45, R1–R49. [Google Scholar]
- Nijssen, A; Koljenovic, S; Bakker Schut, TC; Caspers, PJ; Puppels, GJ. Towards oncological application of Raman spectroscopy. J. Biophoton 2009, 2, 29–36. [Google Scholar]
- Berger, AJ; Koo, TW; Itzkan, I; Horowitz, G; Feld, MS. Multicomponent blood analysis by near-infrared Raman spectroscopy. Appl. Opt 1999, 38, 2916–2926. [Google Scholar]
- Lambert, JL; Pelletier, CC; Borchert, M. Glucose determination in human aqueous humor with Raman spectroscopy. J. Biom. Opt 2005, 10, 031110. [Google Scholar]
- Manoharan, R; Wang, Y; Feld, MS. Histochemical analysis of biological tissues using Raman spectroscopy. Spectrochim. Acta A 1996, 52, 215–249. [Google Scholar]
- Lau, DP; Huang, Z; Lui, H; Man, CS; Berean, K; Morrison, MD; Zeng, H. Raman spectroscopy for optical diagnosis in normal and cancerous tissue of the nasopharynx-preliminary findings. Laser Surg. Med 2003, 32, 210–214. [Google Scholar]
- Malini, R; Venkatakrishna, K; Kurien, J; Pai, KM; Rao, L; Kartha, VB; Murali Krishna, C. Discrimination of normal, inflammatory, premalignant and malignant oral tissue: A Raman spectroscopy studies. Biopolymers 2006, 81, 179–193. [Google Scholar]
- Niemelä, P; Päällysaho, M; Harjunen, P; Koivisto, M; Lehto, VP; Suhonen, J; Järvinen, K. Quantitative analysis of amorphous content of lactose using CCD-Raman spectroscopy. J. Pharmaceut. Biomed. Anal 2005, 37, 907–911. [Google Scholar]
- Skoulika, SG; Georgiou, CA; Polissiou, MG. FT-Raman spectroscopy—Analytical tool for routine analysis of diazinon pesticide formulations. Talanta 2000, 51, 599–604. [Google Scholar]
- Rohleder, D; Kiefer, W; Petrich, W. Quantitative analysis of serum and serum ultrafiltrate by means of Raman spectroscopy. Analyst 2004, 129, 906–911. [Google Scholar]
- Kontoyannis, CG; Bouropoulos, NC; Koutsoukos, PG. Use of Raman spectroscopy for the quantitative analysis of calcium oxalate hydrates: application for the analysis of urinary stones. Appl. Spectrosc 1997, 51, 64–67. [Google Scholar]
- Taylor, LS; Zografi, G. The quantitative Analysis of crystallinity using FT-Raman spectroscopy. Pharmac. Res 1998, 15, 755–761. [Google Scholar]
- Chan, JW; Taylor, DS; Thomson, DL. The effect of cell-fixation in the discrimination of normal and leukaemia cells with laser tweezers Raman spectroscopy. Biopolymers 2009, 91, 132–139. [Google Scholar]
- Asuero, AG; Sayago, A; González, AG. The correlation coefficient: An overview. Crit. Rev. Anal. Chem 2006, 36, 41–59. [Google Scholar]
- Blanco, M; Cruz, J; Bautista, M. Development of an univariate calibration model for pharmaceutical analysis based on NIR spectra. Anal. Bioanal. Chem 2008, 392, 1367–1372. [Google Scholar]
- Lanza, A; Cirillo, N; Femiano, F; Gombos, F. How does acantholysis occur in pemphigus vulgaris: A critical review. J. Cutan. Pathol 2006, 33, 401–409. [Google Scholar]
- Ishii, K; Harada, R; Matsuo, I; Shirikata, Y; Hashimoto, K; Amagai, M. In vitro keratinocyte dissociation assay for evaluation of the pathogenicity of antidesmoglein 3 IgG autoantibodies in pemphigus vulgaris. J. Invest. Dermatol 2005, 124, 939–946. [Google Scholar]
- Venkatakrishna, K; Kurien, J; Pai, KM; Valiathan, M; Kumar, NN; Krishna, CM; Ullas, G; Kartha, VB. Optical pathology of oral tissue: A Raman spectroscopic diagnostic method. Curr. Sci 2001, 80, 665–668. [Google Scholar]
- Camerlingo, C; Zenone, F; Delfino, I; Diano, N; Mita, DG; Lepore, M. Investigation on clarified fruit juice by using visibile light micro-Raman spectroscopy. Sensors 2007, 7, 2049–2061. [Google Scholar]
- Delfino, I; Camerlingo, C; Portaccio, M; Della Ventura, B; Mita, L; Lepore, M. Visible Micro-Raman Spectroscopy for determining glucose content in beverage industry. Food Chem 2011, 127, 735–742. [Google Scholar]
- Taylor, JR. An Introduction to Error Analysis, The Studies of Uncertainties in Physical Measurements; Universities Science Books: Sausalito, CA, USA, 1982. [Google Scholar]
- Arboleda, RH; Loppnow, GR. Raman spectroscopy as a discovery tool in carbohydrate chemistry. Anal. Chem 2000, 72, 2093–2098. [Google Scholar]
- Cerchiaro, G; Sant’Ana, AC; Arruda Temperini, ML; da Costa Ferriera, AM. Investigations of different carbohydrate anomers in copper(II) complexes with D-glucose, D-fructose, and D-galactose by Raman and EPR spectroscopy. Carbohydr. Res 2005, 340, 2352–2359. [Google Scholar]
- Soderholm, S; Roos, YH; Meinander, N; Hotokka, M. Raman spectra of fructose and glucose in the amorphous and crystalline states. J. Raman Spectros 1999, 30, 1009–1018. [Google Scholar]
- Campbell Roberts, SN; Williams, AC; Grimsey, IM; Booth, SW. Quantitative analysis of mannitol polymorphs FT-Raman spectroscopy. J. Pharmaceut. Biomed. Anal 2002, 28, 1135–1147. [Google Scholar]
- Auera, ME; Griessera, UJ; Sawatzk, J. Qualitative and quantitative study of polymorphic forms in drug formulations by near infrared FT-Raman spectroscopy. J Mol Struct 2003, 661–662, 307–317. [Google Scholar]
- Engelsen, SB. Food Technology KVL. Database on Raman Spectra of Carbohydrates. Available online: http://www.models.kvl.dk/specarb (accessed on 17 August 2011).
- Chrit, L; Hadjur, C; Morel, S; Sockalingum, G; Lebourdon, G; Leroy, F; Manfait, M. In vivo chemical investigation of human skin using a confocal Raman fiber optic microprobe. J. Biomed. Opt 2005, 10, 044007. [Google Scholar]
- Alfano, RR; Liu, CH; Sha, WL; Zhu, HR; Akins, DL; Cleary, J; Prudente, R; Cellmer, E. Human breast tissues studied by IR Fourier transform Raman spectroscopy. Lasers Life Sci 1991, 4, 23–28. [Google Scholar]
- Camerlingo, C; Zenone, F; Perna, G; Capozzi, V; Cirillo, N; Gaeta, GM; Lepore, M. Wavelet data analysis of micro-Raman spectra for follow-up monitoring in oral pathologies. Proc SPIE 2008, 6843, 6843K-1–6843K-8. [Google Scholar]
- Camerlingo, C; Zenone, F; Perna, G; Capozzi, V; Cirillo, N; Gaeta, GM; Lepore, M. An investigation on micro-Raman spectra and wavelet data analysis for phemphigus vulgaris follow-up monitoring. Sensors 2008, 8, 3656–3664. [Google Scholar]
- Wolthuis, R; van Aken, M; Fountas, K; Robinson, JS, Jr; Bruining, HA; Puppels, GJ. Determination of water concentration in brain tissue by Raman spectroscopy. Anal. Chem 2001, 73, 3915–3920. [Google Scholar]
- Caspers, PJ; Lucassen, GW; Carter, EA; Bruining, HA; Puppels, GJ. In vivo confocal Raman microspectroscopy of skin: Non-invasive determination of molecular concentration profiles. J. Invest. Dermatol 2001, 116, 434–442. [Google Scholar]
- Koljenovic, S; Bakker Schut, TC; Wolthuis, R; de Jong, B; Santos, L; Caspers, PJ; Kros, JM; Puppels, GJ. Tissue characterization using high wavenumber Raman spectroscopy. J. Biomed. Opt 2005, 10, 031116. [Google Scholar]
- Nijssen, A; Maquelin, K; Santos, LF; Caspers, PJ; Bakker Schut, TC; den Hollander, JC; Neumann, MHA; Puppels, GJ. Discriminating basal cell carcinoma from perilesional skin using high wave-number Raman spectroscopy. J. Biomed. Opt 2007, 12, 034004. [Google Scholar]


| Sample | Sweetener weight fraction (%) | Glucose weight fraction (%) |
|---|---|---|
| A | 100 | 0 |
| B | 0 | 100 |
| C | 90 | 10 |
| D | 75 | 25 |
| E | 50 | 50 |
| F | 25 | 75 |
© 2011 by the authors; licensee MDPI, Basel, Switzerland. This article is an open access article distributed under the terms and conditions of the Creative Commons Attribution license (http://creativecommons.org/licenses/by/3.0/).
Share and Cite
Camerlingo, C.; Delfino, I.; Perna, G.; Capozzi, V.; Lepore, M. Micro-Raman Spectroscopy and Univariate Analysis for Monitoring Disease Follow-Up. Sensors 2011, 11, 8309-8322. https://doi.org/10.3390/s110908309
Camerlingo C, Delfino I, Perna G, Capozzi V, Lepore M. Micro-Raman Spectroscopy and Univariate Analysis for Monitoring Disease Follow-Up. Sensors. 2011; 11(9):8309-8322. https://doi.org/10.3390/s110908309
Chicago/Turabian StyleCamerlingo, Carlo, Ines Delfino, Giuseppe Perna, Vito Capozzi, and Maria Lepore. 2011. "Micro-Raman Spectroscopy and Univariate Analysis for Monitoring Disease Follow-Up" Sensors 11, no. 9: 8309-8322. https://doi.org/10.3390/s110908309
APA StyleCamerlingo, C., Delfino, I., Perna, G., Capozzi, V., & Lepore, M. (2011). Micro-Raman Spectroscopy and Univariate Analysis for Monitoring Disease Follow-Up. Sensors, 11(9), 8309-8322. https://doi.org/10.3390/s110908309