Optoelectronic Capillary Sensors in Microfluidic and Point-of-Care Instrumentation


Abstract
:
1. Introduction
2. Laboratory Microfluidic Systems
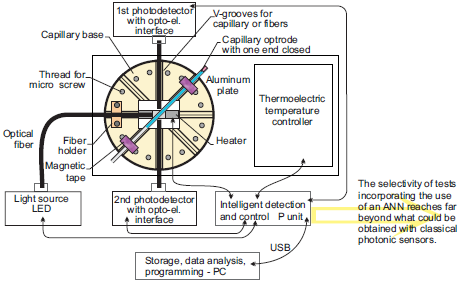
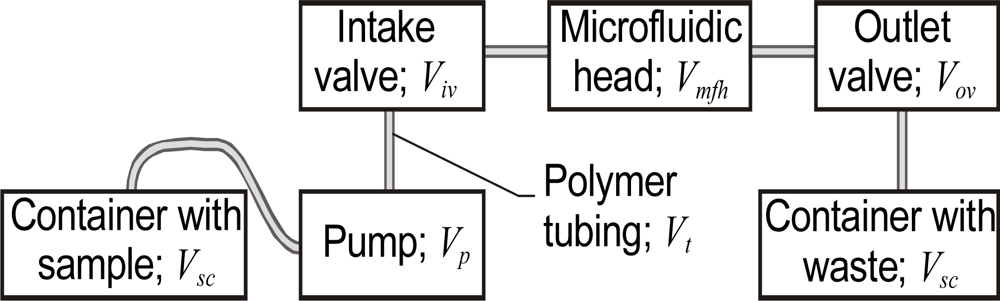
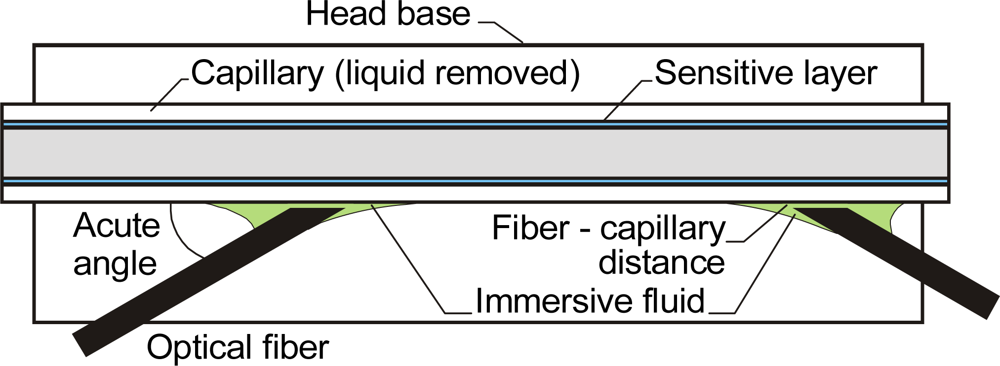
2.1. Precise control of Fluid Volumes and Movement in the Sensing Heads
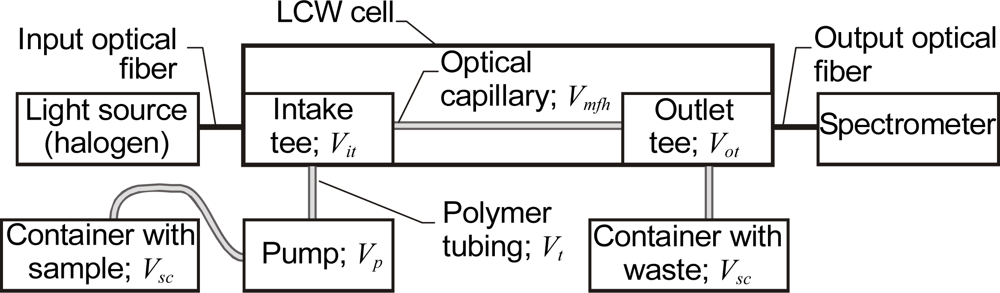
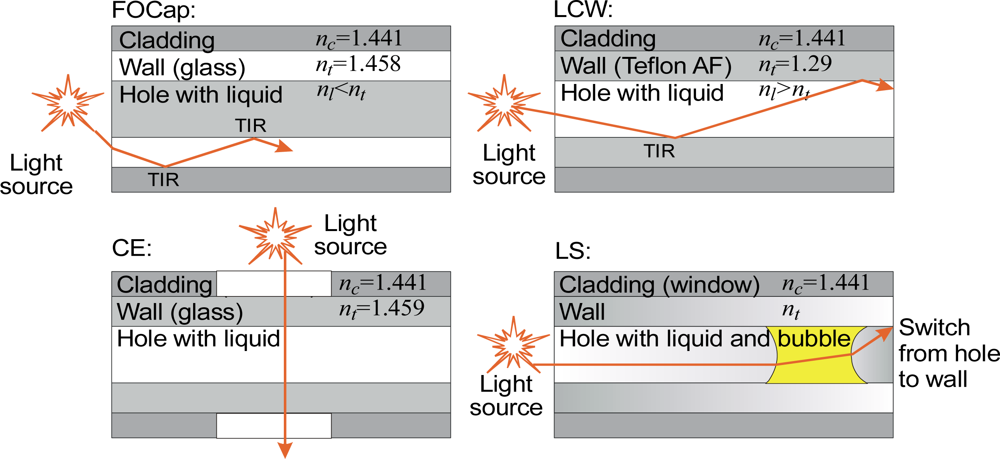
2.2. Microfluidic Systems with LCW Cells
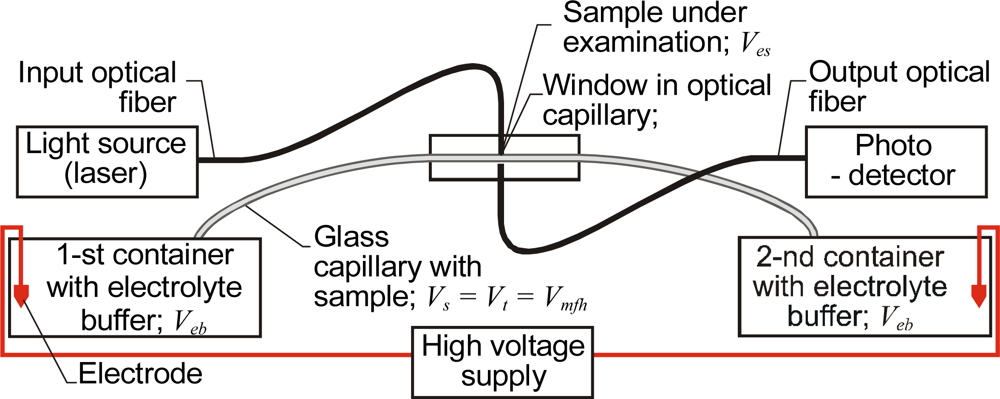
2.3. CE Systems
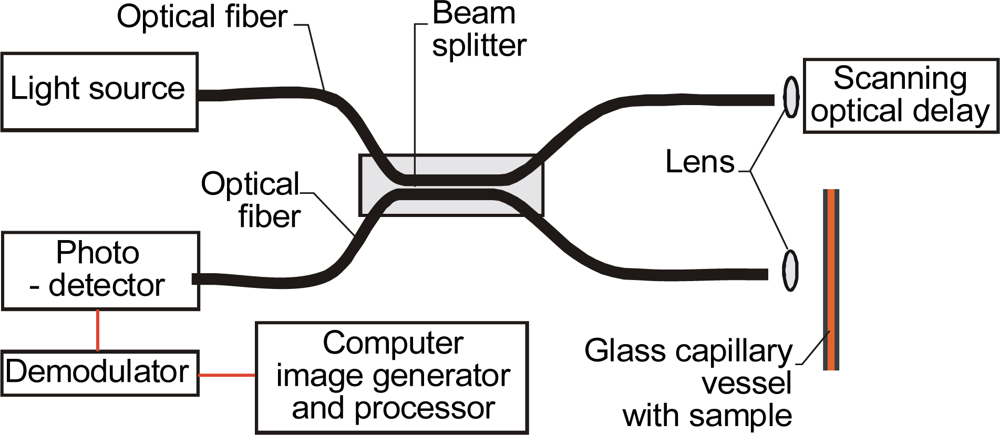
2.4. OCT Systems
3. Microfluidic Sensors
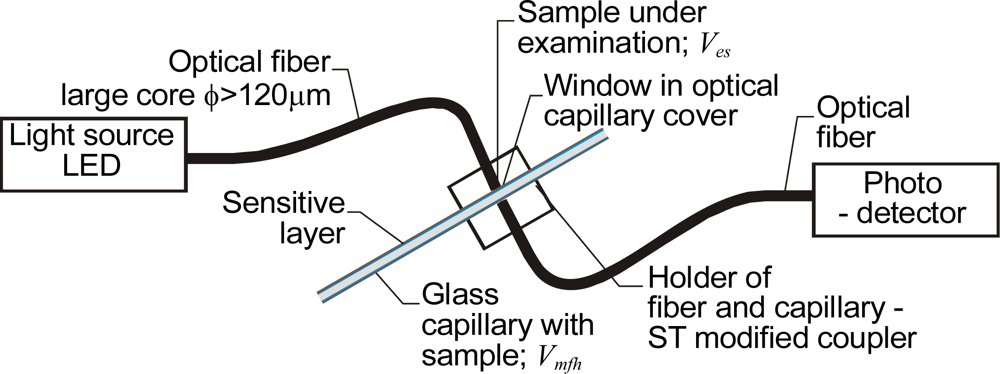
3.1. Capillary Absorbance Sensors with Sensitive Layers
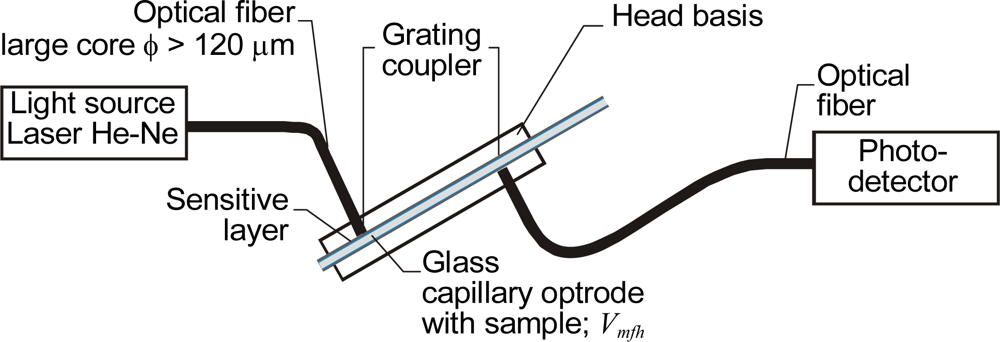
3.2. Optical Evanescent Field Sensors with Capillary Optrodes
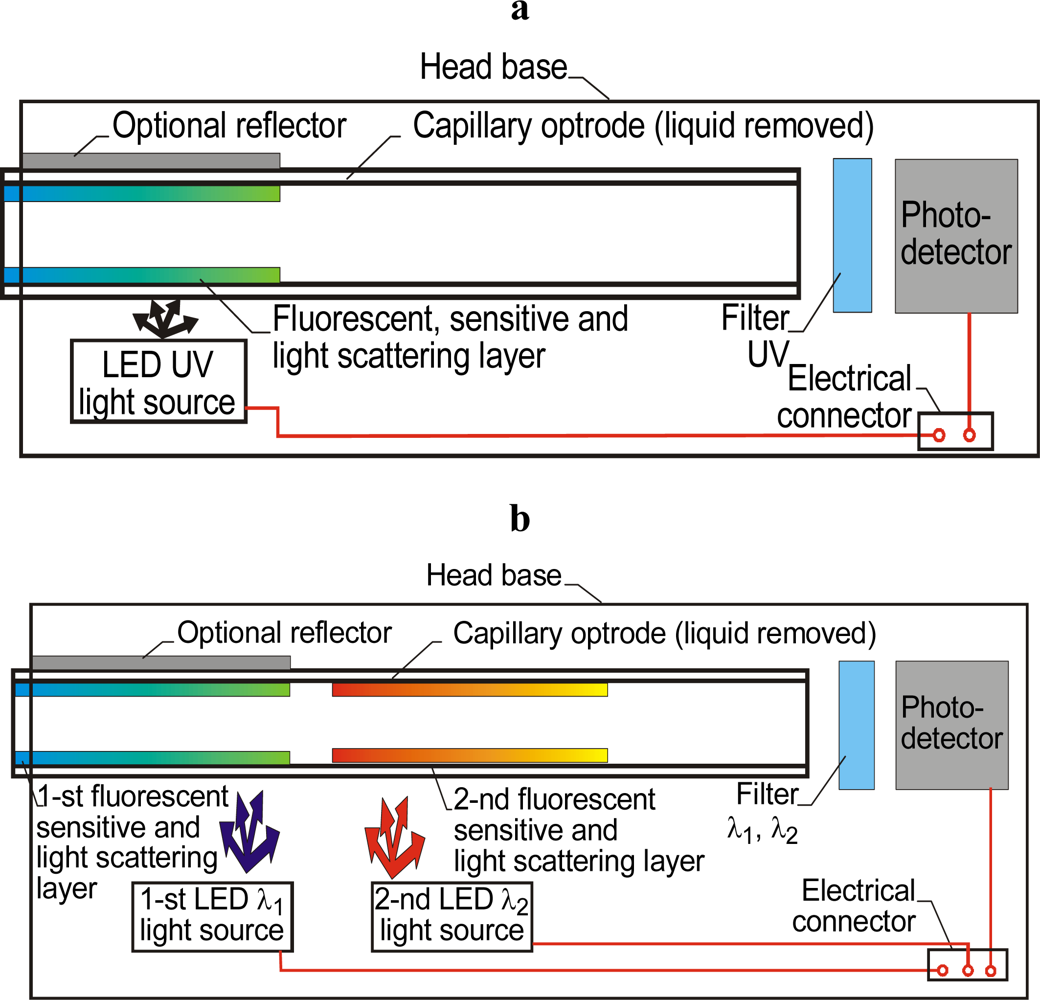
3.3. Optical Capillary Sensors with Fluorescent, Sensitive and Light-Scattering Layers
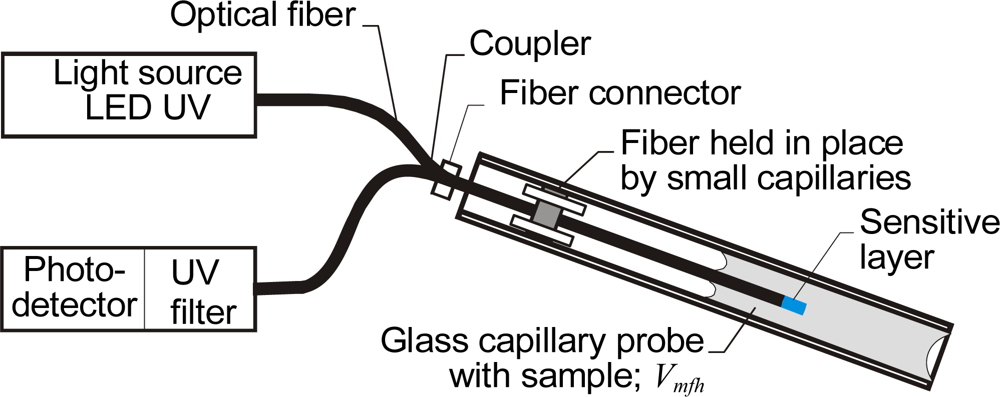
3.4. Optical Fiber Sensors Using Capillary Probes
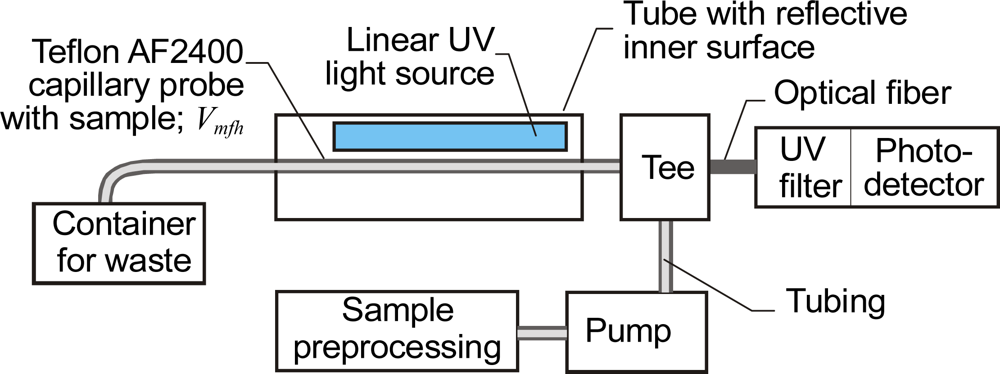
3.5. Sensors with Chemically Preprocessed Samples
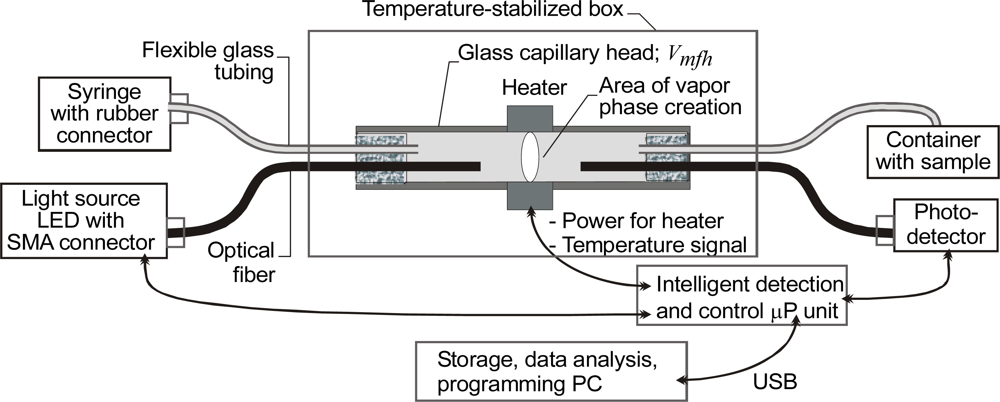
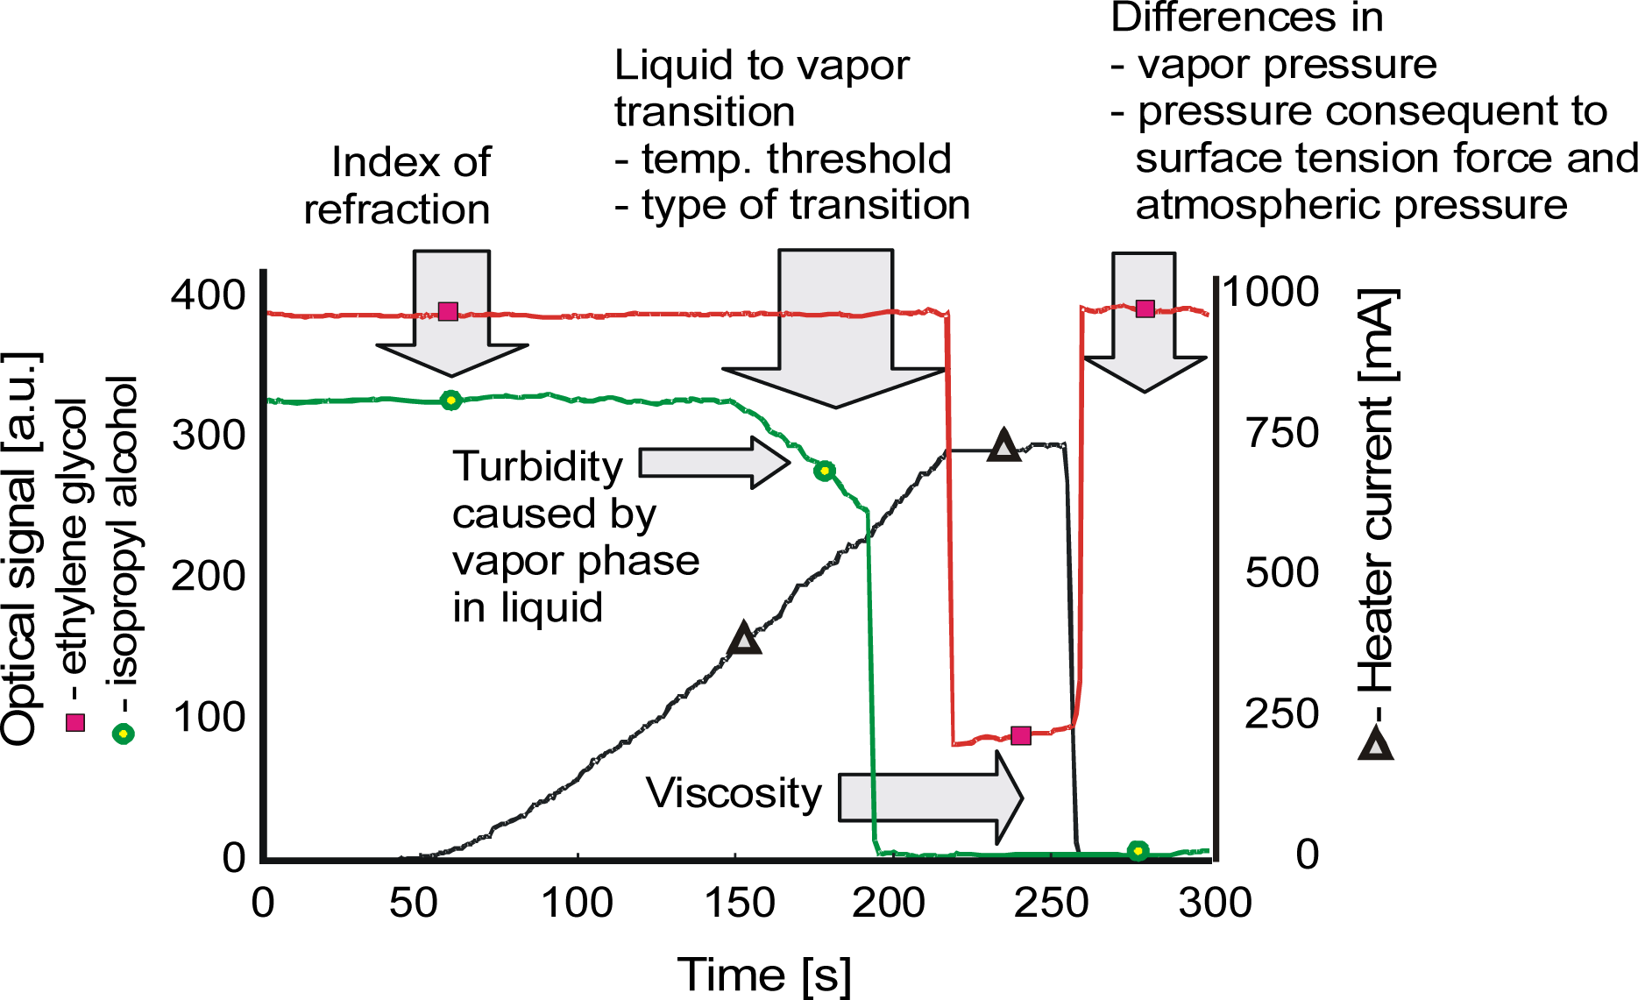
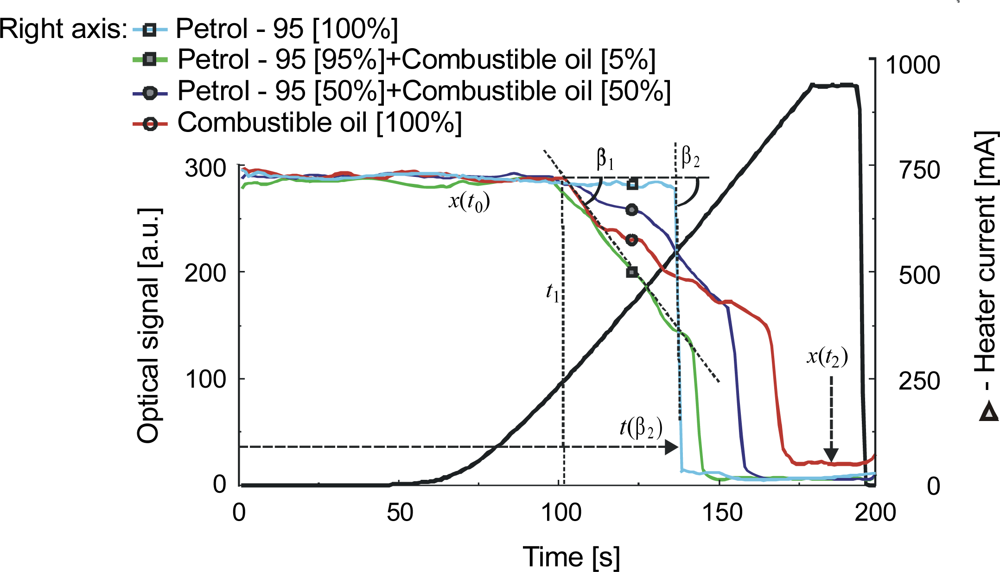
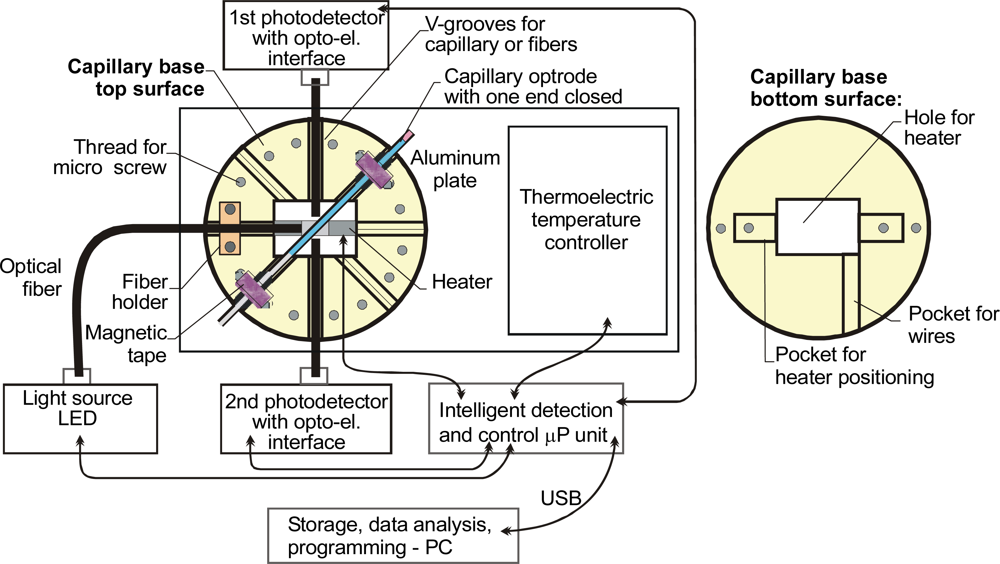
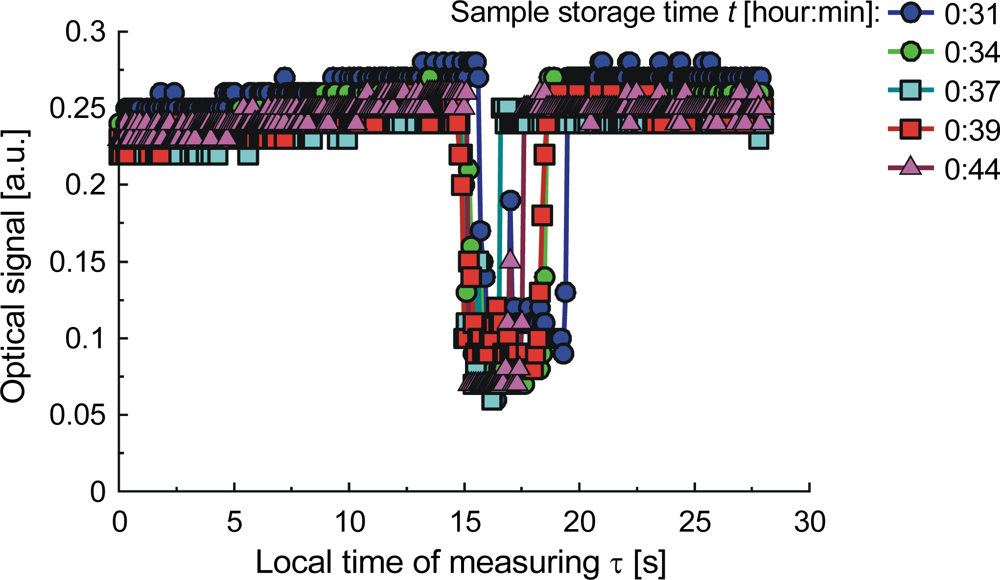
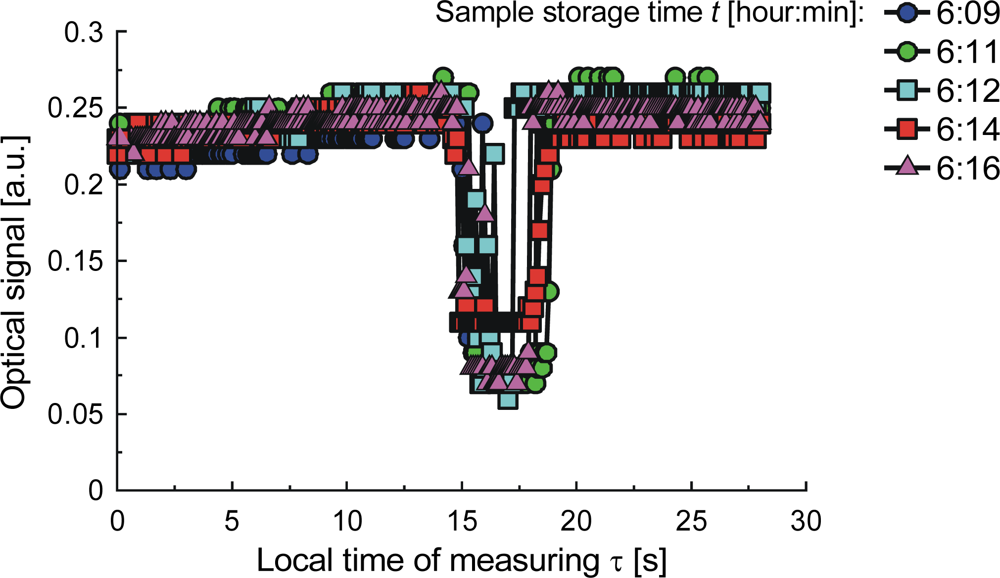
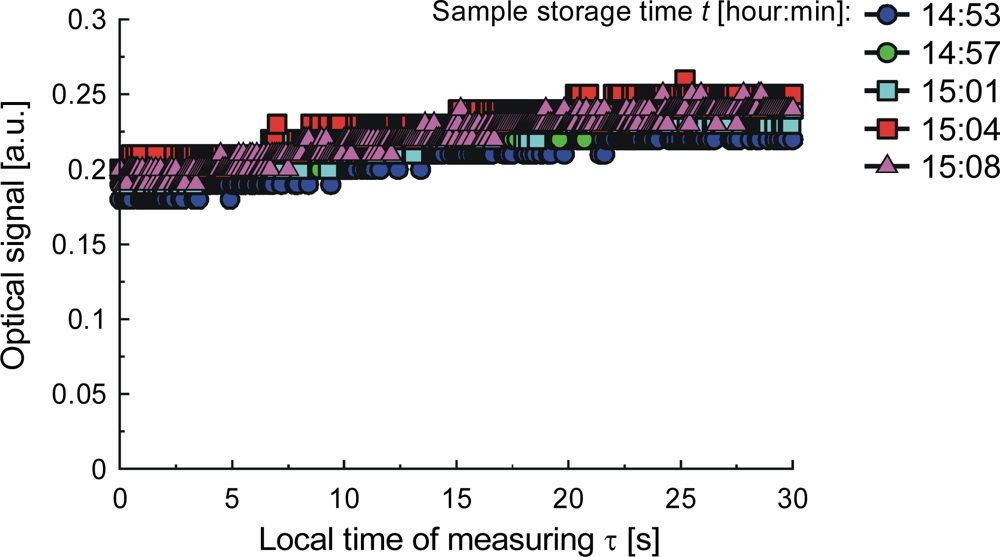
3.6. Capillary Sensors of Transparent Liquids with Light Switching by Local Sample Heating
4. Capillary Sensors for Point-of-Care Applications
5. Conclusions
Acknowledgments
References
- Wolfbeis, O.S. Fiber-Optic Chemical Sensors and Biosensors. Anal. Chem 2008, 80, 4269–4283. [Google Scholar]
- Wolfbeis, O.S. Fiber-Optic Chemical Sensors and Biosensors. Anal. Chem 2006, 78, 3859–3874. [Google Scholar]
- Wolfbeis, O.S. Fiber-Optic Chemical Sensors and Biosensors. Anal. Chem 2004, 76, 3269–3284. [Google Scholar]
- Wolfbeis, O.S. Fiber-Optic Chemical Sensors and Biosensors. Anal. Chem 2000, 72, 81–90. [Google Scholar]
- Baldini, F.; Chester, A.N.; Homola, J.; Martellucci, S. Optical Chemical Sensors (NATO Science Series II: Mathematics, Physics and Chemistry v. 224); Springer Science + Business Media: Berlin, Germany, 2006. [Google Scholar]
- Righini, G.C.; Tajani, A.; Cutolo, A. An Introduction to Optoelectronic Sensors; World Scientific Publishers: Singapore, 2009. [Google Scholar]
- Weigl, B.H.; Wolfbeis, O.S. Capillary Optical Sensors. Anal. Chem 1994, 66, 3323–3327. [Google Scholar]
- Wolfbeis, O.S. Capillary Waveguide Sensors. Trac. Trend Anal Chem 1996, 15, 225–232. [Google Scholar]
- Baldini, F.; Giannetti, A. Optical Chemical and Biochemical Sensors: New Trends. Proc. SPIE 2005, 5826, 485–499. [Google Scholar]
- Integrated Project CLINICIP IST-FP6-506965. Publishable Final Activity Report. Available online: http://www.clinicip.org/fileadmin/clinicip/CLINICIP-Final-Report.pdf/ (accessed on 29 March 2010).
- Dress, P.; Franke, H. A Cylindrical Liquid-Core Waveguide. Appl. Phys. B: Lasers Opt 1996, 63, 12–19. [Google Scholar]
- Dallas, T.; Dasgupta, P.K. Light at the End of the Tunnel: Recent Analytical Applications of Liquid-core Waveguides. Trends Anal. Chem 2004, 23, 385–392. [Google Scholar]
- Altkorn, R.; Koev, I.; Van Duyne, R.P.; Litorja, M. Low-loss Liquid-core Optical Fiber for Low-refractive-index Liquids: fabrication. Appl. Opt 1997, 36, 8992–8998. [Google Scholar]
- Campopiano, S.; Bernini, R.; Zeni, L.; Sarro, P.M. Microfluidic Sensor Based on Integrated Optical Hollow Waveguides. Optics Letters 2004, 29, 1896–1896. [Google Scholar]
- Bravo, J.; Matias, I.R.; Del Villar, I.; Corres, J.M.; Arregui, F.J. Nanofilms on Hollow Core Fiber-based Structures: An Optical Study. J. Lightwave Technol 2006, 24, 2100–2107. [Google Scholar]
- Baldini, F.; Giannetti, A.; Mencaglia, A.A. Optical sensor for interstitial pH measurements. J. Biomed. Opt 2007, 12, 024024. [Google Scholar] [CrossRef]
- Del Bianco, A.; Baldini, F.; Bacci, M.; Wolfbeis, O.S.; Klimant, I. Oxygen Detection via Optical Fibers Using Bis(Histidinato) Cobalt(II) as Indicator. Mol. Cryst. Liq. Cryst 1993, 229, 241–245. [Google Scholar]
- Dasgupta, P.K.; Genfa, Z.; Poruthoor, S.K.; Caldwell, S.; Dong, S.; Liu, S.Y. High-Sensitivity Gas Sensors Based on Gas-Permeable Liquid Core Waveguides and Long-Path Absorbance Detection. Anal. Chem 1998, 70, 4661–4669. [Google Scholar]
- Bizzarri, A.; Koehler, H.; Cajlakovic, M.; Pasic, A.; Schaupp, L.; Klimant, I.; Ribitsch, V. Continuous Oxygen Monitoring in Subcutaneous Adipose Tissue Using Microdialysis. Anal. Chim. Acta 2006, 573–574, 48–56. [Google Scholar]
- Cox, F.M.; Argyros, A.; Large, M.C.J. Liquid-filled Hollow core Microstructured Polymer Optical Fiber. Optics Express 2006, 14, 4135–4140. [Google Scholar]
- Caron, S.; Pare, C.; Proulx., A.; Grenier, P.; Matejec, V. Velocity Measurements Comparison of Water and Pentane Travelling in Capillary Optical Fibers Coated Respectively With Xerogel and a Poly(Dimethylsiloxane) Absorbing Layer. Proc. SPIE 2009, 7386, 73861E. [Google Scholar]
- Miluski, P.; Dorosz, D. Measurement of Refractive Index Using Capillary Waveguide. Proc. SPIE 2006, 6347, 634742. [Google Scholar]
- Zamora, V.; Díez, A.; Andrés, M.V.; Gimeno, B. Refractometric Sensor Based on Whispering-Gallery Modes of Thin Capillarie. Opt. Exp 2007, 15, 12011–12016. [Google Scholar]
- Zhu, H.; White, I.M.; Suter, J.D.; Dale, P.S.; Fan, X. Analysis of Biomolecule Detection With Optofluidic Ring Resonator Sensors. Opt. Exp 2007, 15, 9139–9146. [Google Scholar]
- Abgrall, P.; Gue, A.M. Lab-on-Chip Technologies: Making a Microfluidic Network and Coupling It into a Complete Microsystem–A Review. J. Micromech. Microeng 2007, 17, R15–R49. [Google Scholar]
- Luan, L.; Evans, R.D.; Jokerst, N.M.; Fair, R.B. Integrated Optical Sensor in a Digital Microfluidic Platform. IEEE Sensor. J 2008, 8, 628–635. [Google Scholar]
- Woias, P. Micropumps-Past Progress and Future Prospects. Sens. Actuator. B 2005, 105, 28–38. [Google Scholar]
- Bartels Mikrotechnik. Available online: http://www.bartels-mikrotechnik.de/index.php/Micropumps.html/ (accessed on 29 March 2010).
- Bartels Mikrotechnik. Available online: http://www.bartels-mikrotechnik.de/index.php/Microvalves./html/ (accessed on 29 March 2010).
- Polymer Capillary Tubing (microtubing). Available online: http://www.paradigmoptics.com/capillary/capillary.html/ (accessed on 30 March 2010).
- Liquid Waveguide Capillary Cell. Available online: http://www.wpiinc.com/pdf/lwcc-im-040208.pdf/ (accessed on 30 March 2010).
- Yang, M.K.; French, R.H.; Tokarsky, E.W. Optical Properties of Teflon® AF Amorphous Fluoropolymers. J. Micro/Nanolith. MEMS MOEMS 2008, 7, 033010. [Google Scholar]
- Waterbury, R.D.; Yao, W.; Byrne, R.H. Long Pathlength Absorbance Spectroscopy: Trace Analysis of Fe(II) Using a 4.5 M Liquid Core Waveguide. Anal. Chem. Acta 1997, 357, 99–102. [Google Scholar]
- Kozodoy, R.L.; Micheels, R.H.; Harrington, J.A. Small-Bore Hollow Waveguide Infrared Absorption Cells for Gas Sensing. Appl. Spectrosc 1996, 50, 415–41. [Google Scholar]
- De Melas, F.; Pustogov, V.V.; Croitoru, N.; Mizaikoff, B. Development and Optimization of a Mid-Infrared Hollow Waveguide Gas Sensor Combined with a Supported Capillary Membrane Sampler. Appl. Spectrosc 2003, 57, 600–606. [Google Scholar]
- De Melas, F.; Pustogov, V.V.; Wolcott, D.K.; Olson, D.C.; Inberg, A.; Croitoru, N.; Mizaikoff, B. Combination of a Mid-infrared Hollow Waveguide Gas Sensor With a Supported Capillary membrane sampler for the detection of organic compounds in water. Intern. J. Environ. Anal. Chem 2003, 83, 573–583. [Google Scholar]
- Charlton, C.; de Melas, F.; Inberg, A.; Croitoru, N.; Mizaikoff, B. Hollow-waveguide Gas Sensing With Room-temperature Quantum Cascade Lasers. IEE Proc.-Optoelectron 2003, 150, 306–309. [Google Scholar]
- Wu, S.; Deev, A.; Haught, M.; Tang, Y. Hollow Waveguide Quantum Cascade Laser Spectrometer as an Online Microliter Sensor for Gas Chromatography. J. Chromat. A 2008, 1188, 327–330. [Google Scholar]
- Yang, J.; Her, J.W.; Chen, S.H. Development of an Infrared Hollow Waveguide as a Sensing Device for Detection of Organic Compounds in Aqueous Solutions. Anal. Chem 1999, 71, 3740–3746. [Google Scholar]
- Yang, J.; Lee, C.J. Development of the Infrared Hollow Waveguide Sampler for the Detection of Chlorophenols in Aqueous Solutions. J. AOAC Int 2002, 85, 163–172. [Google Scholar]
- Yang, J.; Chen, P.Y. Development of an Infrared Hollow Waveguide Sampler for the Detection of Organic Compounds in Aqueous Solutions with Limited Sample Volumes. Anal. Sci 2002, 18, 555–560. [Google Scholar]
- Ligler, F.S.; Breimer, M.; Golden, J.P.; Nivens, D.A.; Dodson, J.P.; Green, T.M.; Haders, D.P.; Sadik, O.A. Integrating Waveguide Biosensor. Anal. Chem 2002, 74, 713–719. [Google Scholar]
- Branzalov, P.P.; Ivanov, L.M.; Pavlov, L.I. Fiberoptic Displacement Sensor with a Short Hollow Metal Optical Waveguide. Rev. Sci. Instr 1999, 70, 2166–2168. [Google Scholar]
- Shi, C.; Lu, C.; Gu, C.; Tian, L.; Newhouse, R.; Chen, S.; Zhang, J.Z. Inner Wall Coated Hollow Core Waveguide Sensor Based on Double Substrate Surface Enhanced Raman Scattering. App. Phys. Lett 2008, 93, 153101-1–153101-3. [Google Scholar]
- Zhang, J.; Hoogmartens, J.; Van Schepdael, A. Advances in Capillary Electrophoretically Mediated Microanalysis: An Update. Electrophoresis 2008, 29, 56–65. [Google Scholar]
- Dabek-Zlotorzynska, E.; Celo, V.; Yassine, M.M. Recent Advances in CE and CEC of Pollutants. Electrophoresis 2008, 29, 310–323. [Google Scholar]
- Herrero, M.; Garcia-Caňas, V.; Simo, C.; Cifuentes, A. Recent Advances in the Application of Capillary Electromigration Methods for Food Analysis and Foodonomics. Electrophoresis 2010, 31, 205–228. [Google Scholar]
- El Rassi, Z. Electrophoretic and Electrochromatographic Separation of Proteins in Capillaries: An Update Covering 2007–2009. Electrophoresis 2010, 31, 174–191. [Google Scholar]
- Breadmore, M.C.; Thabano, J.R.E.; Dawod, M.; Kazarian, A.A.; Quirino, J.P.; Guijt, R.M. Recent Advances in Enhancing the Sensitivity of Electrophoresis and Electrochromatography in Capillaries and Microchips (2006–2008). Electrophoresis 2009, 30, 230–248. [Google Scholar]
- Escarpa, A.; González, M.C.; Gil, M.A.L.; Crevillén, A.G.; Hervás, M.; García, M. Microchips for CE: Breakthroughs in Real-World Food Analysis. Electrophoresis 2009, 29, 4852–4861. [Google Scholar]
- Macka, M.; Yang, W.C.; Zakaria, P.; Shitangkoon, A.; Hilder, E.F.; Andersson, P.; Nesterenko, P.; Haddad, P.R. Poly (terafluoroethylene) Separation Capillaries for Capillary Electrophoresis. Properties and Applications. J. Chromatogr. A 2004, 1039, 193–199. [Google Scholar]
- Osbourn, D.M.; Weiss, D.J.; Lunte, C.E. On-Line Preconcentration Methods for Capillary Electrophoresis. Electrophoresis 2000, 21, 2768–2779. [Google Scholar]
- Melanson, J.E.; Lucy, C.A. Violet (405 nm) Diode Laser for Laser Induced Fluorescence Detection in Capillary Electrophoresis. Analyst 2000, 125, 1049–1052. [Google Scholar]
- Gomez, J.E.; Sandoval, J.E. The Effect of Conditioning of Fused-Silica Capillaries on Their Electrophoretic Performance. Electrophoresis 2008, 29, 381–392. [Google Scholar]
- Fujimoto, J.G. Optical Coherence Tomography for Ultrahigh Resolution in Vivo Imaging. Nat. Biotechnol 2003, 21, 1361–1366. [Google Scholar]
- Huang, D.; Swanson, E.A.; Lin, C.P.; Schuman, J.S.; Stinson, W.G.; Chang, W.; Hee, M.R.; Flotte, T.; Gregory, K.; Puliafito, C.A.; Fujimoto, J.G. Optical Coherence Tomography. Science 1991, 254, 1178–81. [Google Scholar]
- Zysk, A.M.; Nguyen, F.T.; Oldenburg, A.L.; Marks, D.L.; Boppart, S.A. Optical Coherence Tomography: A Review of Clinical Development from Bench to Bedside. J. Biomed. Opt 2007, 12, 051403. [Google Scholar]
- Fercher, A.F.; Hitzenberger, C.K.; Drexler, W.; Kamp, G.; Sattmann, H. In Vivo Optical Coherence Tomography. Am. J. Ophthalmol 1993, 116, 113–114. [Google Scholar]
- Popescu, D.P.; Sowa, M.G. In Vitro Assessment of Optical Properties of Blood by Applying the Extended Huygens-Fresnel Principle to Time-Domain Optical Coherence Tomography Signal at 1300nm. Int. J. Biomed. Imaging 2008, 591618, 6. [Google Scholar]
- Texas Instruments. Available online: http://focus.ti.com/docs/prod/folders/print/opt101.html (accessed on 29 March 2010).
- Texas Instruments. Available online: http://focus.ti.com/docs/prod/folders/print/uaf42.html/ (accessed on 29 March 2010).
- Mignani, A.G.; Mencaglia, A.A.; Ciaccheri, L. Fiber-Optic System for Colorimetry and Scattered Colorimetry. Proc. SPIE 2005, 5952, 59520D. [Google Scholar]
- Mastichiadis, C.; Niotis, A.E.; Petrou, P.S.; Kakabakos, S.E.; Misiakos, K. Capillary-Based Immunoassays, Immunosensors and DNA Sensors–Steps Towards Integration and Multi-Analysis. Trend Anal. Chem 2008, 27, 771–784. [Google Scholar]
- Weigl, B.H.; Lehmann, H.; Lippitsch, M.E. Optical Sensors Based on Inhomogeneous Waveguiding in the Walls of Capillaries (‘Capillary Waveguide Optrodes’). Sens. Actuator. B 1996, 32, 175–179. [Google Scholar]
- Paprocki, E.D.; Keller, B.K.; Palmer, C.P.; Laws, W.R.; DeGrandpre, M.D. Characterization of Long Pathlength Capillary Waveguides for Evanescent Fluorescent Sensing Applications. Sens. Actuator. B 2008, 135, 145–151. [Google Scholar]
- Lippitsch, M.E.; Draxler, S.; Kieslinger, D.; Lehmann, H.; Weigl, B.H. Capillary Waveguide Optrodes-A Novel Approach to Optical Sensing in Medical Diagnostics. Appl. Opt 1996, 35, 3426–3431. [Google Scholar]
- Kieslinger, D.; Draxler, S.; Trznadel, K.; Lippitsch, M.E. Lifetime-based Capillary Waveguide Sensor Instrumentation. Sens. Actuator. B 1997, 38–39. [Google Scholar]
- Draxler, S. Lifetime Based Sensors/Sensing, Topics in Fluorescence. Spectroscopy 2005, 10, 241–274. [Google Scholar]
- Mastichiadis, C.; Kakabakos, S.E.; Christofidis, I.; Koupparis, M.A.; Willetts, C.; Misiako, K. Simultaneous Determination of Pesticides Using a Four-Band Disposable Optical Capillary Immunosensor. Anal Chem 2002, 74, 6064–6072. [Google Scholar]
- Čajlaković, M.; Bizzarri, A.; Ribitsch, V. Luminescence Lifetime-Based Carbon Dioxide Optical Sensor for Clinical Applications. Anal. Chim. Acta 2006, 573–574, 57–64. [Google Scholar]
- Baldini, F.; Giannetti, A.; Mencaglia, A.A. Optical Sensor for Interstitial pH Measurements. J. Biomedical. Optics 2007, 12, 024024. [Google Scholar]
- Pasic, A.; Koehler, H.; Schaupp, L.; Pieber, T.R.; Klimant, I. Fiber-optic Flow-through Sensor for Online Monitoring of Glucose. Anal. Bioanal. Chem 2006, 386, 1293–1302. [Google Scholar]
- Pasic, A.; Koehler, H.; Klimant, I.; Schaupp, L. Miniaturized Fiber-optic Hybrid Sensor for Continuous Glucose Monitoring in Subcutaneous Tissue. Sens. Actuator. B 2007, 122, 60–68. [Google Scholar]
- Corres, J.M.; Matias, I.R.; Hernaez, M.; Bravo, J.; Arregui, F.J. Optical Fiber Humidity Sensors Using Nanostructured Coatings of SiO2 Nanoparticles. IEEE Sensors J 2008, 8, 281–286. [Google Scholar]
- Cusano, A.; Giordano, M.; Cutolo, A.; Pisco, M.; Consales, M. Integrated Development of Chemoptical Fiber Nanosensors. Curr. Anal. Chem 2008, 4, 296–315. [Google Scholar]
- Buosciolo, A.; Consales, M.; Pisco, M.; Cusano, A.; Giordano, M. Fiber-Optic Near-Field Chemical Sensors Based on Wavelength Scale Tin Dioxide Particle Layers. J. Lightwave Techno 2008, 26, 3468–3475. [Google Scholar]
- Borecki, M. Intelligent Fiber Optic Sensor for Estimating the Concentration of a Mixture-Design and Working Principle. Sensors 2007, 7, 384–399. [Google Scholar]
- Consales, M.; Crescitelli, A.; Penza, M.; Aversa, P.; Delli Veneri, P.; Giordano, M.; Cusano, A. SWCNT Nano-Composite Optical Sensors for VOC and Gas Trace Detection. Sens. Actuator. B 2009, 13, 351–361. [Google Scholar]
- Guillemain, H.; Rajarajan, M.; Sun, T.; Grattan, K.T.V.; Lin, Y.C.; Chen, C.T. A Disposable Optical Fiber-Based Capillary Probe for Sensing Lead Ions. IEEE Sensors J 2008, 8, 1656–1662. [Google Scholar]
- Borecki, M.; Korwin-Pawlowski, M.L.; Bebłowska, M. A Method of Examination of Liquids by Neural Network Analysis of Reflectometric and Transmission Time Domain Data from Optical Capillaries and Fibers. IEEE Sensors J 2008, 8, 1208–1213. [Google Scholar]
- Sohn, Y.S.; Goodey, A.; Anslyn, E.V.; McDevitt, J.T.; Shear, J.B.; Neikirk, D.P. A Microbead Array Chemical Sensor Using Capillary-Based Sample Introduction: Toward the Development of an “Electronic Tongue”. Biosens. Bioelectron 2005, 21, 303–312. [Google Scholar]
- Zhao, J.; Fyles, T.M.; James, T.D. Chiral Binol-Bisboronic Acid as Fluorescence Sensor for Sugar Acids. Angew. Chem. Int. Ed. Engl 2004, 43, 3461–3464. [Google Scholar]
- Zhao, J.; Davidson, M.G.; Mahon, M.F.; Kociok-Köhn, G.; James, T.D. An Enantioselective Fluorescent Sensor for Sugar Acids. J. Am. Chem. Soc 2004, 126, 16179–16186. [Google Scholar]
- Li, J.; Dasgupta, P.K.; Genfa, Z. Transversely Illuminated Liquid Core Waveguide Based Fluorescence Detection Fluorometric Flow Injection Determination of Aqueous Ammonium/Ammonia. Talanta 1999, 50, 617–623. [Google Scholar]
- Valentino, J.P.; Troian, S.M.; Wagner, S. Microfluidic Detection and Analysis by Integration of Thermocapillary Actuation with a Thin-Film Optical Waveguide. Appl. Phys. Lett 2005, 86, 184101. [Google Scholar]
- Pogodina, O.A.; Pustogov, V.V.; de Melas, F.; Haberhauer-Troyer, C.; Rosenberg, E.; Puxbaum, H.; Inberg, A.; Croitoru, N.; Mizaikoff, B. Combination of Sorption Tube Sampling and Thermal Desorption with Hollow Waveguide FT-IR Spectroscopy for Atmospheric Trace Gas Analysis: Determination of Atmospheric Ethene at Lower ppb Level. Anal. Chem 2004, 76, 464–468. [Google Scholar]
- Borecki, M.; Korwin-Pawlowski, M.L.; Wrzosek, P.; Szmidt, J. Capillaries as the Components of Photonic Sensor Micro-Systems. Meas. Sci. Technol 2008, 19, 065202. [Google Scholar]
- Pure Component Properties. Available online: http://www.cheric.org/research/kdb/hcprop/cmpsrch.php/ (accessed on 30 March 2010).
- Warrant, J.H.; Adewumi, M.A. Polynomial Objective Functions for Flash Calculations. Ind. Eng. Chem. Res 1993, 32, 1528–1530. [Google Scholar]
- Weigl, B.; Domingo, G.; LaBarre, P.; Gerlach, J. Towards non- and Minimally Instrumented, Microfluidics-Based Diagnostic Devices. Lab Chip 2008, 8, 1999–2014. [Google Scholar]
- Romaniuk, R.; Dorosz, J. Technology of Soft-Glass Optical Fiber Capillaries. Proc. SPIE 2006, 6347, 634710. [Google Scholar]
- Borecki, M.; Szmidt, M.; Korwin-Pawlowski, M.L.; Beblowska, M.; Niemiec, T.; Wrzosek, P. A Method of Testing the Quality of Milk Using Optical Capillaries. Photon. Let. Pol 2009, 1, 37–39. [Google Scholar]
- Dress, P.; Belz, M.; Klein, K.F.; Grattan, K.T.V.; Franke, H. Water-Core-Waveguide for Pollution Measurements in the Deep Ultra-Violet. Applied Optics 1998, 37, 4991–4997. [Google Scholar]
- Karlsson, A.O.; Ipsen, R.; Ardo, Y. Relationship Between Physical Properties of Casein Micelles and Rheology of Skim Milk Concentrate. J. Dairy Sci 2005, 80, 3784–3797. [Google Scholar]
- McMahon, D.J.; Brown, R.J. Composition, Structure and Integrity of Casein Micelles: A Review. J. Dairy Sci 1984, 67, 499–512. [Google Scholar]


| Parameter | Liquid | ||
|---|---|---|---|
| DIW | IPA (77.5%) + DIW (22.5%) | EG | |
| Index of refraction | 1.333 | 1.376 | 1.432 |
| Boiling point [°C] | 100 | 82.3 | 197.3 |
| Vapor pressure of liquid at 20 °C [Pa] | 2.4·103 | 4.4·103 | 8 |
| Vapor pressure of liquid at 100 °C [Pa] | 1.0·105 | 2.0·105 | 1.4·103 |
| Vapor pressure of liquid at 200 °C [Pa] | 1.8·106 | 2.3·106 | 1.1·105 |
| Viscosity [Pa·s] | 0.89·103 | 2.07·103 | 16·103 |
| Surface tension [N/m] | 0.0731 | 0.0228 | 0.0477 |
© 2010 by the authors; licensee Molecular Diversity Preservation International, Basel, Switzerland. This article is an open-access article distributed under the terms and conditions of the Creative Commons Attribution license ( http://creativecommons.org/licenses/by/3.0/).
Share and Cite
Borecki, M.; Korwin-Pawlowski, M.L.; Beblowska, M.; Szmidt, J.; Jakubowski, A. Optoelectronic Capillary Sensors in Microfluidic and Point-of-Care Instrumentation. Sensors 2010, 10, 3771-3797. https://doi.org/10.3390/s100403771
Borecki M, Korwin-Pawlowski ML, Beblowska M, Szmidt J, Jakubowski A. Optoelectronic Capillary Sensors in Microfluidic and Point-of-Care Instrumentation. Sensors. 2010; 10(4):3771-3797. https://doi.org/10.3390/s100403771
Chicago/Turabian StyleBorecki, Michał, Michael L. Korwin-Pawlowski, Maria Beblowska, Jan Szmidt, and Andrzej Jakubowski. 2010. "Optoelectronic Capillary Sensors in Microfluidic and Point-of-Care Instrumentation" Sensors 10, no. 4: 3771-3797. https://doi.org/10.3390/s100403771
APA StyleBorecki, M., Korwin-Pawlowski, M. L., Beblowska, M., Szmidt, J., & Jakubowski, A. (2010). Optoelectronic Capillary Sensors in Microfluidic and Point-of-Care Instrumentation. Sensors, 10(4), 3771-3797. https://doi.org/10.3390/s100403771