Levelling Profiles and a GPS Network to Monitor the Active Folding and Faulting Deformation in the Campo de Dalias (Betic Cordillera, Southeastern Spain)


Abstract
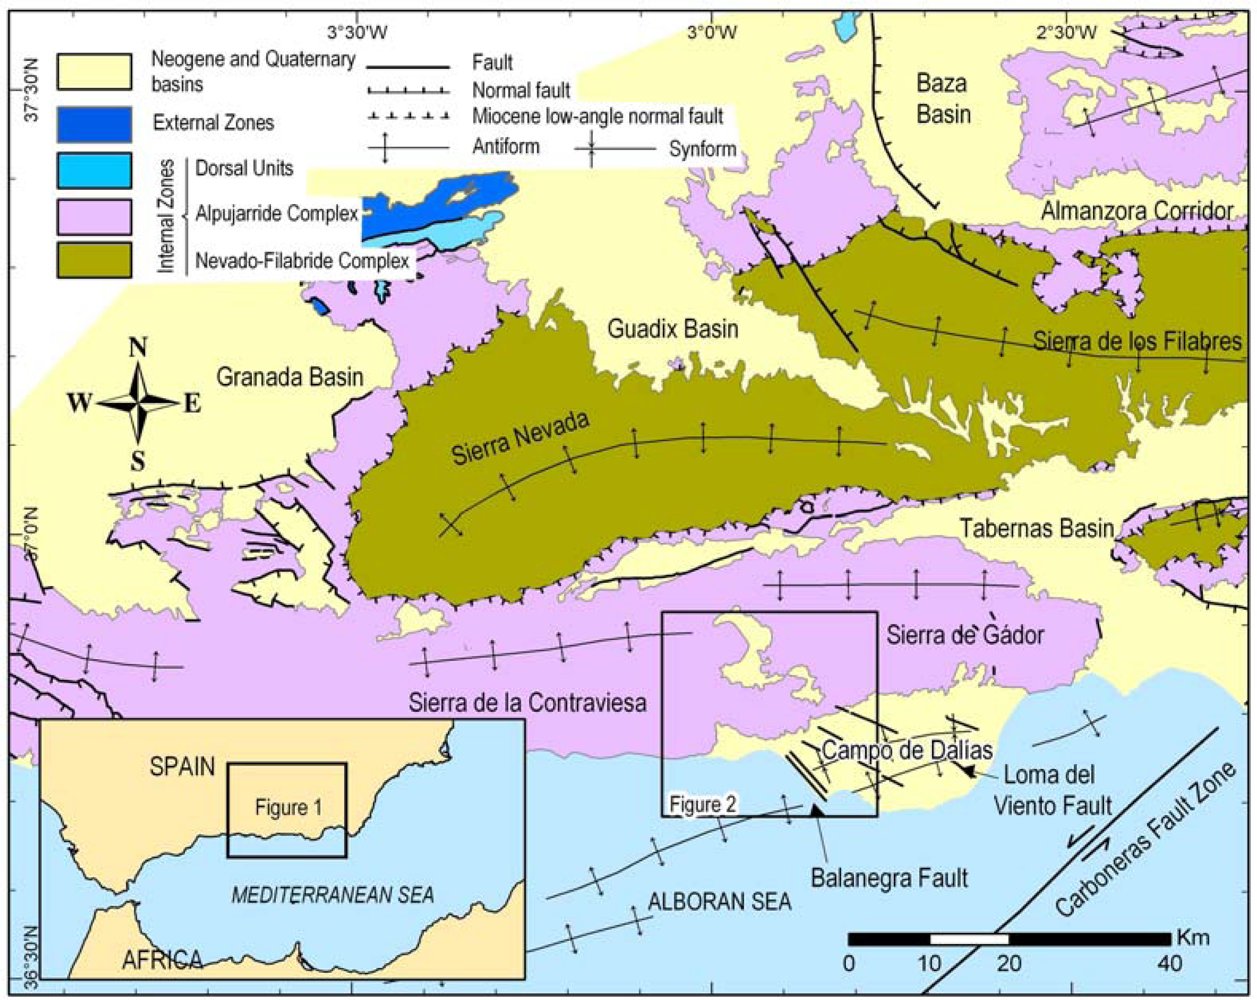
:1. Introduction
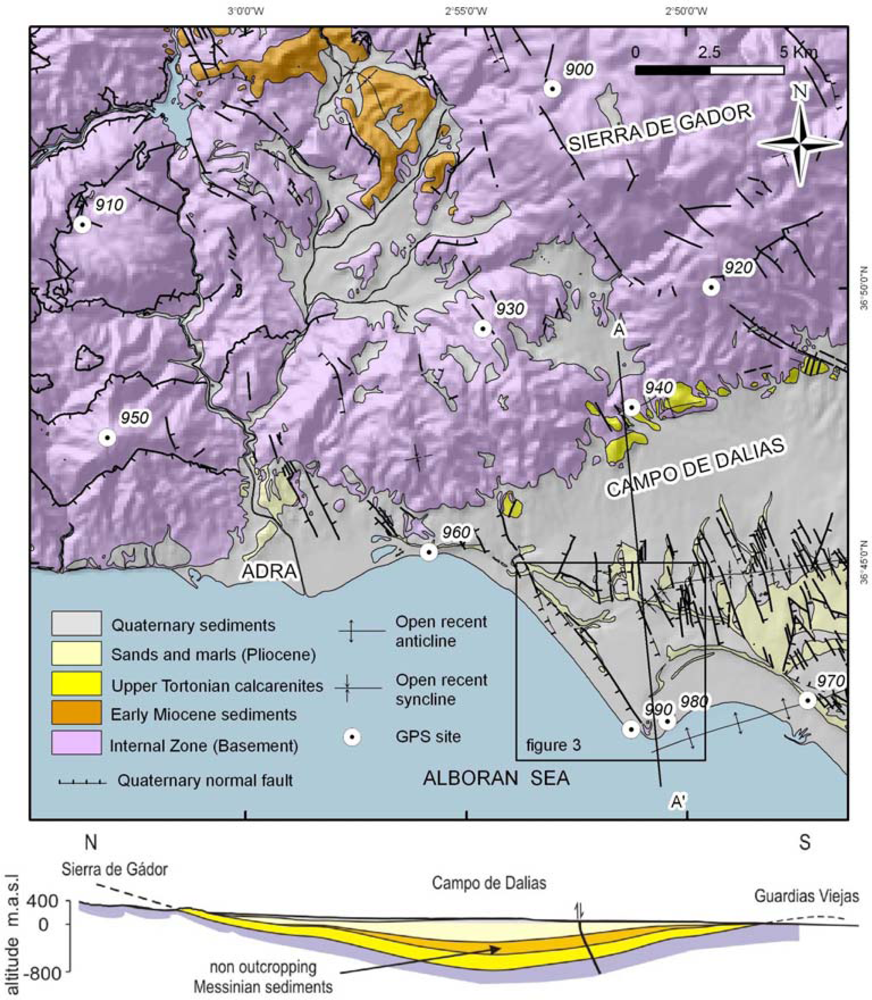
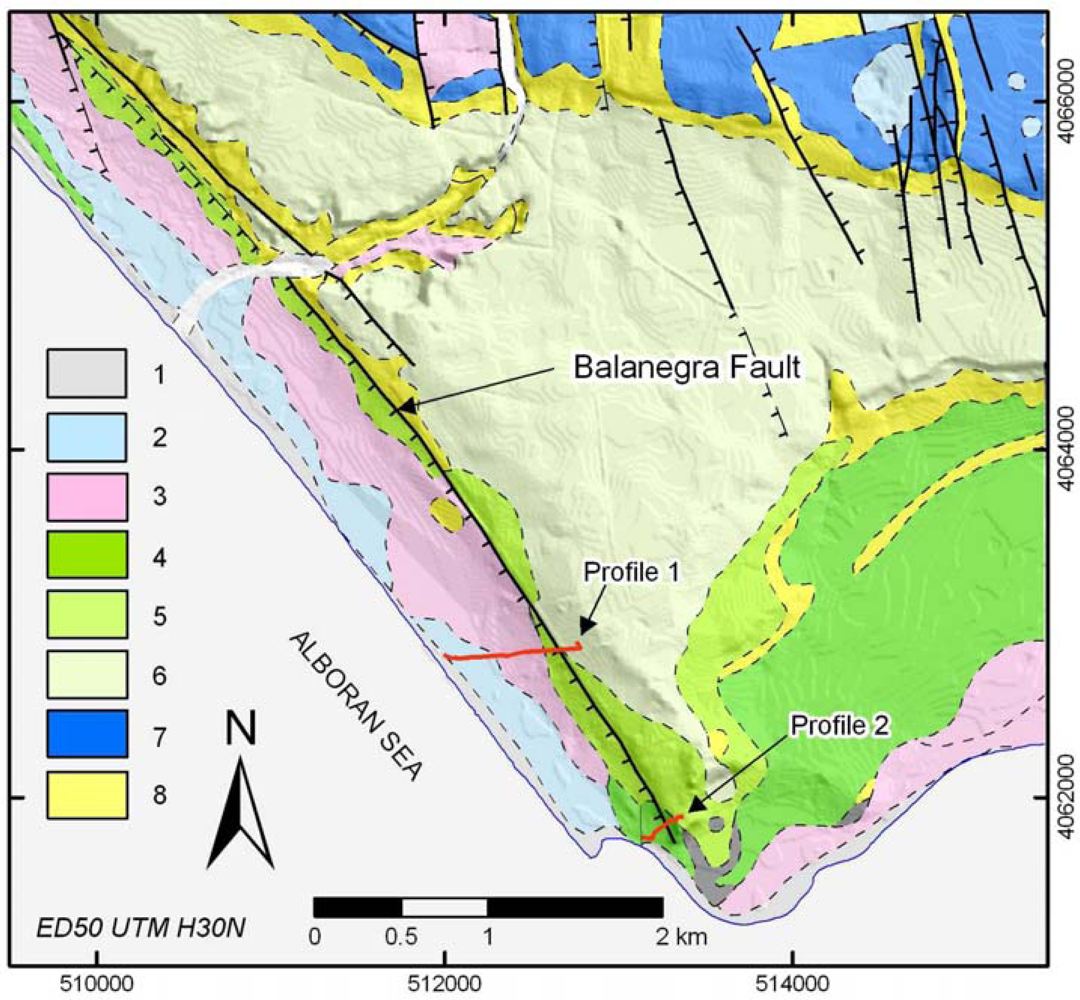
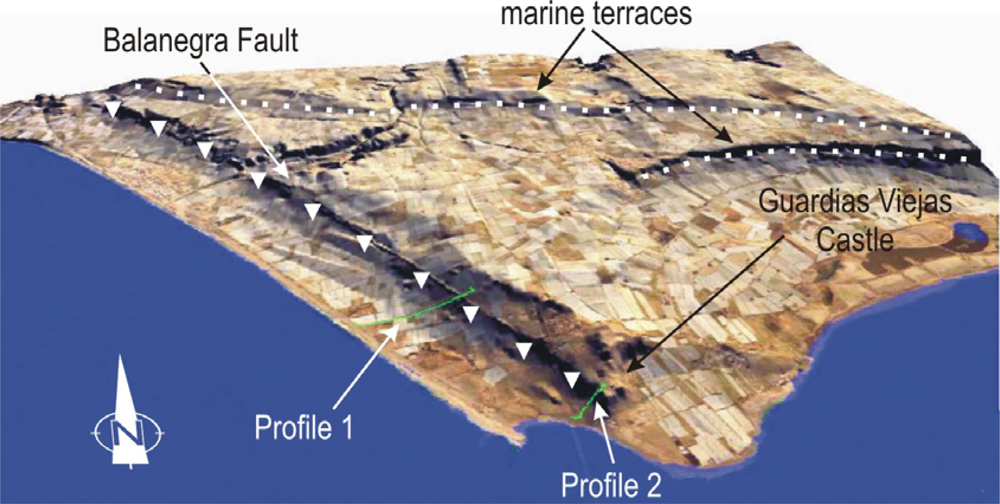
2. Recent Folds and Faults
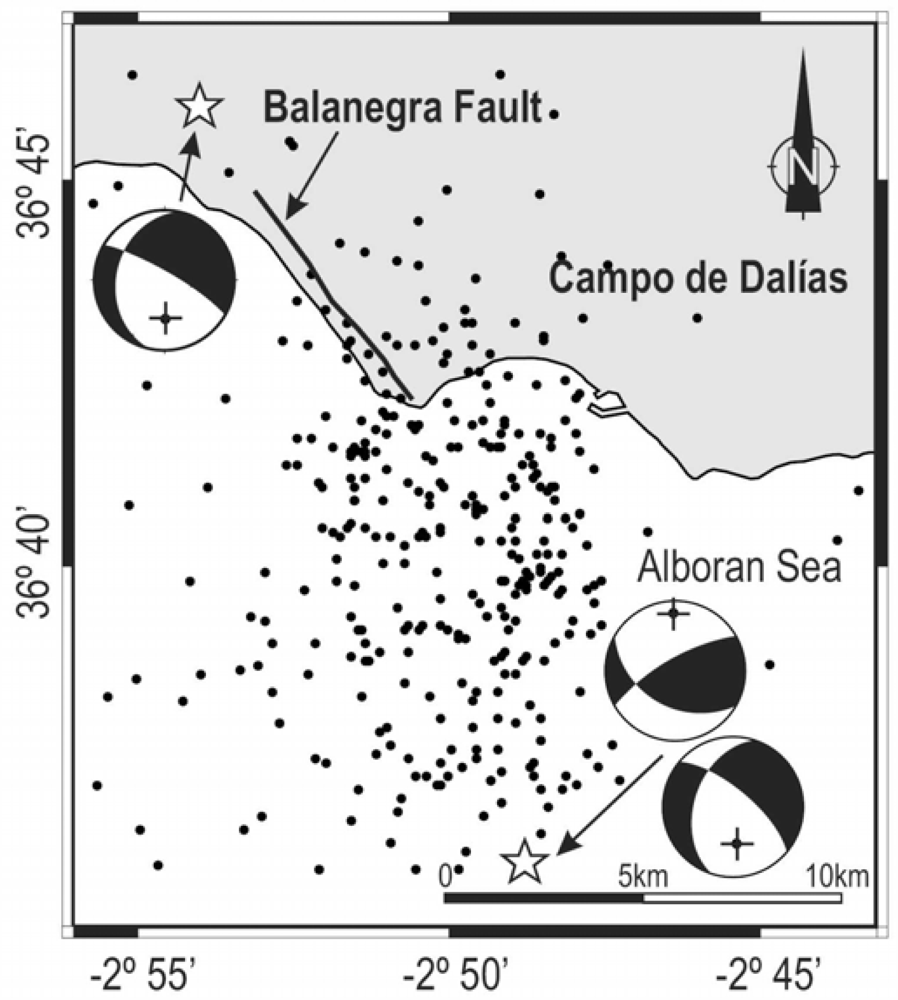
3. Seismicity
4. Uplift and Slip Rates
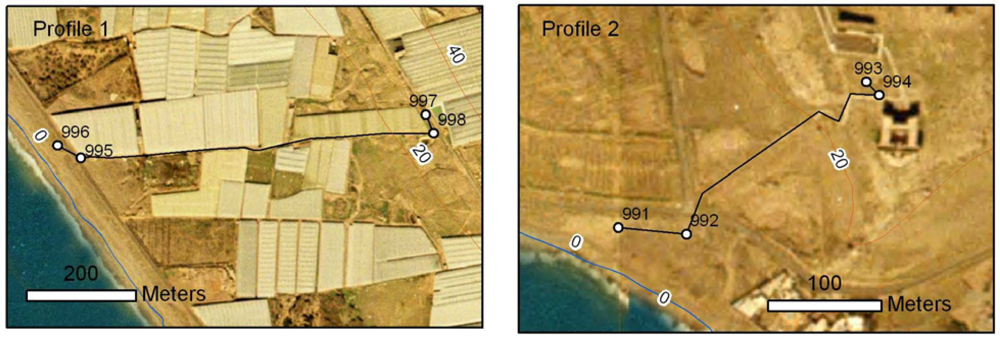
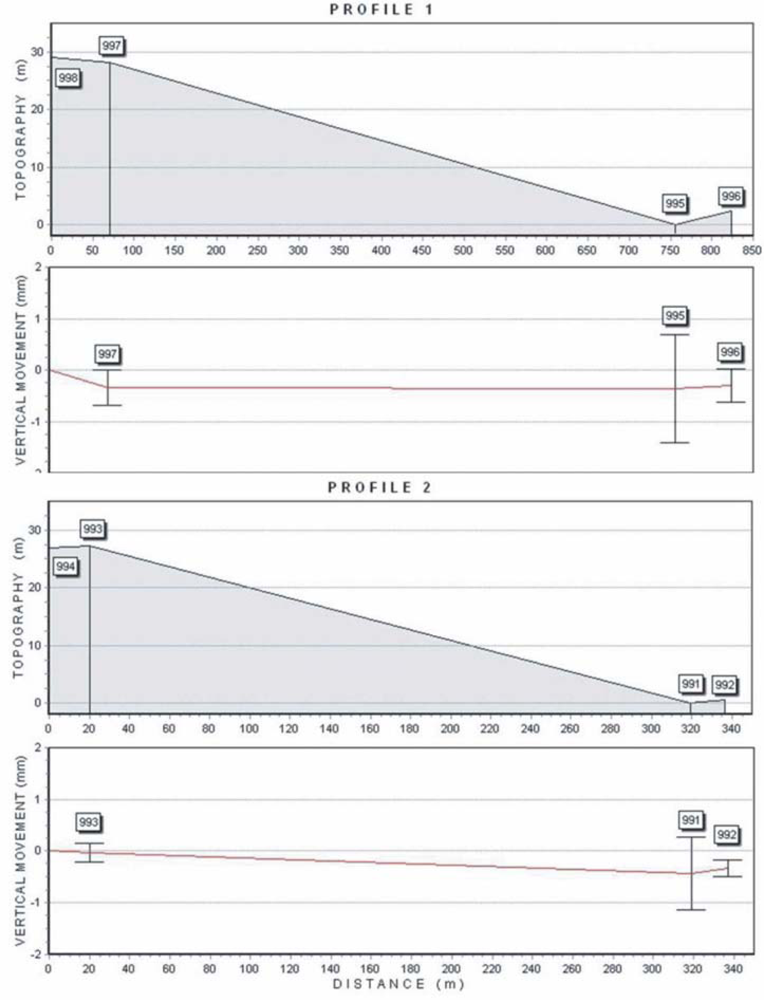
5. High Precision Levelling
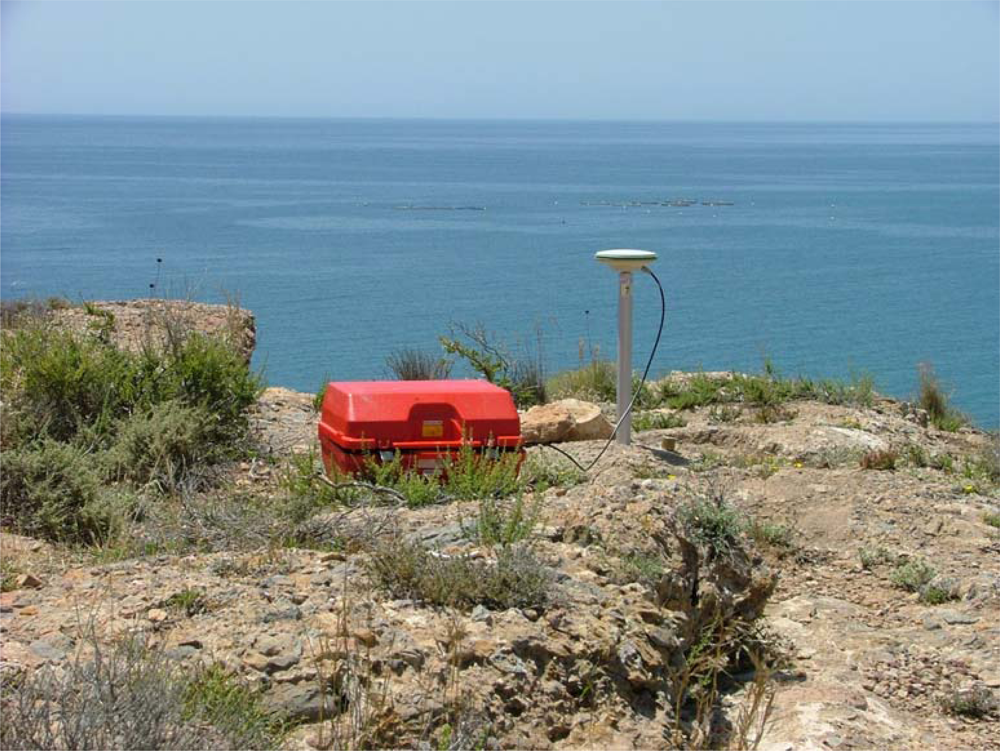
6. GPS Network
7. Discussion and Conclusions
Acknowledgments
References
- Aktüg, B.; Kılıçoglu, A. Recent crustal deformation of Izmir, Western Anatolia and surrounding regions as deduced from repeated GPS measurements and strain field. J. Geodyn 2006, 41, 471–484. [Google Scholar]
- Mäkinen, J.; Koivula, H.; Poutanen, M.; Saaranen, V. Vertical velocities in Finland from permanent GPS networks and from repeated precise levelling. J. Geodyn 2003, 38, 443–456. [Google Scholar]
- Bitelli, G.; Flavio Bonsignoreb, F.; Marco Unguendolia, M. Levelling and GPS networks to monitor ground subsidence in the Southern Po Valley. J. Geodyn 2000, 30, 355–369. [Google Scholar]
- Gil, A.J.; Rodríguez-Caderot, G.; Lacy, C.; Ruiz, A.; Sanz, C.; Alfaro, P. Establishment of a non-permanent GPS network to monitor the deformation in Granada Basin (Betic Cordillera, Southern Spain). Stud. Geophys. Geod 2002, 46, 395–410. [Google Scholar]
- Ruiz, A.M.; Ferhat, G.; Alfaro, P.; Sanz de Galdeano, C.; Lacy, M.C.; Rodríguez-Caderot, G.; Gil, A.J. Geodetic measurement of crustal deformation on NW-SE faults of the Betic Cordillera, Southern Spain, 1999–2001. J. Geodyn 2003, 35, 259–272. [Google Scholar]
- Argus, D.F.; Gordon, R.G.; De Mets, C.; Stein, S. Closure of the African-Eurasian-North American plate motion circuit and tectonics of the Gloria Fault. J. Geophys. Res 1989, 94, 5585–5602. [Google Scholar]
- DeMets, C.; Gordon, R.G.; Aarhus, D.F.; Stein, S. Effect of recent revisions to the geomagnetic reversal time scale on estimates of current plate motions. Geophys. Res. Lett 1994, 21, 2191–2194. [Google Scholar]
- Galindo-Zaldívar, J.; Gil, A.J.; Borque, M.J.; González-Lodeiro, F.; Jabaloy, A.; Marín-Lechado, C.; Ruano, P.; Sanz de Galdeano, C. Active faulting in the internal zones of the central Betic Cordilleras (SE, Spain). J. Geodyn 2003, 36, 239–250. [Google Scholar]
- Marín-Lechado, C.; Galindo-Zaldívar, J.; Rodríguez-Fernández, L.R.; Pedrera, A. Mountain front development by folding and crustal thickening in the Internal Zone of the Betic Cordillera-Alboran Sea boundary. Pure Appl. Geophys 2007, 166, 1–21. [Google Scholar]
- Reicherter, K.; Hubscher, C. Evidence for a seafloor rupture of the Carboneras Fault Zone (southern Spain): Relation to the 1522 Almería earthquake. J. Seismolog 2007, 11, 15–26. [Google Scholar]
- Marín-Lechado, C.; Galindo-Zaldívar, J.; Rodríguez-Fernández, L.R.; Serrano, I.; Pedrera, A. Active faults, seismicity and stresses in an internal boundary of a tectonic arc (Campo de Dalías and Níjar, southeastern Betic Cordilleras, Spain). Tectonophysics 2005, 396, 81–96. [Google Scholar]
- Fernandez-Ibañez, F.; Pérez-Peña, J.V.; Azañón, J.M.; González-Lodeiro, F. Caracterización morfo-estructural del borde occidental de Sierra de Gádor (Cordillera Bética). Geogaceta 2006, 40, 71–74. [Google Scholar]
- Sánchez, M. Datos referentes a la sismicidad de la porción oriental de la Península Ibérica. Mem. R. Acad. Cien. Artes Barcelona 1917, 8, 179–188. [Google Scholar]
- López-Marinas, J.M. Estudio del terremoto de 22 Septiembre 1522 en Almería. Pub. Hidroeléctr. Esp 1977, 16, 51–60. [Google Scholar]
- Martínez-Díaz, J.J.; Hernández-Enrile, J.L. Neotectonics and morphotectonics of the southern Almería (Betic Cordillera-Spain). Kinematics implications. Int. J. Earth Sci 2004, 93, 189–206. [Google Scholar]
- Martínez-Díaz, J.J. Análisis sismotectónico de la serie sísmica de Adra: mecanismos de terremotos compuestos como respuesta a la interacción entre fallas activas en el sureste de la Cordillera Bética. Rev. Soc. Geol. Esp 2000, 13, 31–43. [Google Scholar]
- Rueda, J.; Mezcua, J.; Sánchez-Ramos, M. La serie sísmica de Adra (Almería) de 1993–1994 y sus principales consecuencias sismotectónicas. Avanc. Geofís. Geodes 1996, 1, 91–98. [Google Scholar]
- Stich, A.G.; Morales, J. The relative locations of multiplets in the vicinity of the Western Almería (southern Spain) earthquake series of 1993–1994. Geophys. J. Int 2001, 146, 801–812. [Google Scholar]
- Braga, J.C.; Martín, J.M.; Quesada, C. Patterns and average rates of late Neogene-Recent uplift of the Betic Cordillera, SE Spain. Geomorphology 2003, 50, 3–26. [Google Scholar]
- Sanz de Galdeano, C; Alfaro, P. Tectonic significance of the present relief of the Betic Cordillera. Geomorphology 2004, 63, 175–190. [Google Scholar]
- García, A.F.; Zhu, Z.; Ku, T.L.; Sanz de Galdeano, C.; Chadwick, O.A.; Chacón-Montero, J. Tectonically driven landscape development within the eastern Alpujarran Corridor, Betic Cordillera, SE Spain (Almeria). Geomorphology 2003, 50, 83–110. [Google Scholar]
- Zazo, C.; Dabrio, C.J.; Bajardí, T.; Hillarie-Marcel, C.; Ghaleb, B.; González-Delgado, J.A.; Soler, V. Pleistocene raised marine terraces of the Spanish Mediterranean and Atlantic coast: records of coastal uplift, sea-level highstands and climate changes. Mar. Geol 2003, 194, 103–133. [Google Scholar]
- Hillaire-Marcel, C.; Carro, O.; Causse, C.; Goy, J.L.; Zazo, C. Th/U dating of Strombus bubonius bearing marine terraces in southeastern Spain. Geology 1986, 14, 613–616. [Google Scholar]
- Ihde, J. Improved precision levelling for deriving significant vertical movements of the earth’s crust. J. Geodyn 1987, 8, 313–320. [Google Scholar]
- Beutler, G.; Bock, H.; Brockmann, E.; Dach, R.; Fridez, P.; Gurtner, W.; Habrich, H.; Hugentobler, U.; Ineichen, D.; Jaeggi, A.; Meindl, M.; Mervart, L.; Rothacher, M.; Schaer, S.; Schmid, R.; Springer, T.; Steigenberger, P.; Svehla, D.; Thaller, D.; Urschl, C.; Weber, R. BERNESE GPS Software Version 5.0; University of Bern: Bern, Switzerland, 2006. [Google Scholar]
- Dow, J.M.; Neilan, R.E.; Gendt, G. The International GPS Service (IGS): celebrating the 10th anniversary and looking to the next decade. Adv. Space Res 2005, 36, 320–326. [Google Scholar]
- Niell, A. Global mapping functions for the atmosphere delay at radio wavelengths. J. Geophys. Res 1996, 101, 3227–3246. [Google Scholar]
- Crespi, M. Software Package for the adjustment and the analysis of GPS control network. In Reports on Survey and Geodesy in Memoria Proff. Gubellini and G. Folloni; Edizione Nautilus: Bologna, Italy, 1996; pp. 237–264. [Google Scholar]
- Wells, D.L.; Coppersmith, K.J. New empirical relationships among magnitude, rupture length, rupture width, and surface displacement. Bull. Seismol. Soc. Am 1994, 84, 974–1002. [Google Scholar]
- Obermeier, S.F. Using liquefaction-induced features for paleoseismic analysis. In Paleoseismology; McCalpin, J.P., Ed.; Academic Press: San Diego, CA, USA, 1996; pp. 331–396. [Google Scholar]


| Date | Intensity | Location |
|---|---|---|
| 22/09/1522 | IX | South Adra |
| 21/01/1804 | VIII | Adra |
| 25/08/1804 | IX | Southwest Adra |
| 16/06/1910 | VII | Adra |
| 16/06/1910 | VIII | Adra |
| Location | Uplift rate (cm/year) | Time interval | Reference |
|---|---|---|---|
| Highest peak in Sierra de Gador | 0.028 cm/yr | Late Tortonian—present (8 M.a) | [19] |
| Western part of Sierra de Gádor (rates of stream incision) | 0.03–0.07 cm/yr | Pleistocene—present. Last 245,000 y | [21] |
| Marine terraces (Loma del Viento area) | 0.0046 cm/yr | Late Pleistocene—present Last 130,000 y | [22] |
| Marine terraces (Guardias Viejas area) | 0.009–0.012 cm/yr | Late Pleistocene—present Last 130,000 y | [23] |
| Ses | Eq | Unk | Red | RMS X | RMS Y | RMS Z | Smaj | Smim | CI | ||||
|---|---|---|---|---|---|---|---|---|---|---|---|---|---|
| 5 | 105 | 24 | 81 | 1 | 1.14 | 105.91 | 113.51 | 2 | 1 | 2 | 3 | 2 | 6 |
| Site | latitude [° ′ ″] | σ [m] | longitude [° ′ ″] | σ [m] | h [m] | σ [m] |
|---|---|---|---|---|---|---|
| 900 | 36 53 38.681421 | 0.001 | −2 53 01.653521 | 0.001 | 1969.047 | 0.002 |
| 910 | 36 51 10.696921 | 0.001 | −3 03 41.729952 | 0.001 | 919.580 | 0.003 |
| 920 | 36 50 01.555610 | 0.001 | −2 49 25.894343 | 0.001 | 1109.671 | 0.003 |
| 930 | 36 49 16.842709 | fixed | −2 54 36.596110 | fixed | 693.749 | fixed |
| 950 | 36 47 18.606936 | 0.001 | −3 03 05.784845 | 0.001 | 935.216 | 0.002 |
| 960 | 36 45 12.459127 | 0.001 | −2 55 50.264128 | 0.001 | 104.474 | 0.002 |
| 970 | 36 42 29.602625 | 0.001 | −2 47 16.080250 | 0.001 | 133.799 | 0.002 |
| 980 | 36 42 07.044694 | 0.001 | −2 50 26.764425 | 0.001 | 67.811 | 0.002 |
| 990 | 36 41 58.323988 | 0.001 | −2 51 15.561034 | 0.001 | 53.565 | 0.002 |
© 2010 by the authors; licensee Molecular Diversity Preservation International, Basel, Switzerland. This article is an open-access article distributed under the terms and conditions of the Creative Commons Attribution license ( http://creativecommons.org/licenses/by/3.0/).
Share and Cite
Marín-Lechado, C.; Galindo-Zaldívar, J.; Gil, A.J.; Borque, M.J.; De Lacy, M.C.; Pedrera, A.; López-Garrido, A.C.; Alfaro, P.; García-Tortosa, F.; Ramos, M.I.; et al. Levelling Profiles and a GPS Network to Monitor the Active Folding and Faulting Deformation in the Campo de Dalias (Betic Cordillera, Southeastern Spain). Sensors 2010, 10, 3504-3518. https://doi.org/10.3390/s100403504
Marín-Lechado C, Galindo-Zaldívar J, Gil AJ, Borque MJ, De Lacy MC, Pedrera A, López-Garrido AC, Alfaro P, García-Tortosa F, Ramos MI, et al. Levelling Profiles and a GPS Network to Monitor the Active Folding and Faulting Deformation in the Campo de Dalias (Betic Cordillera, Southeastern Spain). Sensors. 2010; 10(4):3504-3518. https://doi.org/10.3390/s100403504
Chicago/Turabian StyleMarín-Lechado, Carlos, Jesús Galindo-Zaldívar, Antonio José Gil, María Jesús Borque, María Clara De Lacy, Antonio Pedrera, Angel Carlos López-Garrido, Pedro Alfaro, Francisco García-Tortosa, Maria Isabel Ramos, and et al. 2010. "Levelling Profiles and a GPS Network to Monitor the Active Folding and Faulting Deformation in the Campo de Dalias (Betic Cordillera, Southeastern Spain)" Sensors 10, no. 4: 3504-3518. https://doi.org/10.3390/s100403504
APA StyleMarín-Lechado, C., Galindo-Zaldívar, J., Gil, A. J., Borque, M. J., De Lacy, M. C., Pedrera, A., López-Garrido, A. C., Alfaro, P., García-Tortosa, F., Ramos, M. I., Rodríguez-Caderot, G., Rodríguez-Fernández, J., Ruiz-Constán, A., & De Galdeano-Equiza, C. S. (2010). Levelling Profiles and a GPS Network to Monitor the Active Folding and Faulting Deformation in the Campo de Dalias (Betic Cordillera, Southeastern Spain). Sensors, 10(4), 3504-3518. https://doi.org/10.3390/s100403504