1. Introduction
It was more than 40 years when I have introduced a new field into the literature named ion-selective electrodes. Till that time it was only a sensor the glass electrode which was able to measure the ion activities. Now I want to stress my problems with the interpretation of the glass electrodes.
At the beginning of the 1900s, the phenomenon observed by Haber and Clemensiewith(
1) was a great surprise among electrochemical phenomena, namely that the glass electrode produced an electrochemical signal in response to the acidity of solutions (the definition of the pH was given later). It was also a surprise that this potential signal could only be measured by electrometers of high input resistance (impedance), in contrast to the method worked out earlier by the Nernst school.
For electrodes of the first kind, the transfer of electrons was the potential-determining reaction, but this interpretation did not seem to be applicable for glass electrodes. A few years after the discovery of this phenomenon, a new experiment was made by Donnan
(2). He separated a solution of an alkali halide from a solution of a protein by a membrane, and found that there was an equilibrium, if the protein, which did not diffuse through the membrane, and the halide, which diffused through the membrane, established an electrochemical equilibrium, as a consequence of which an electrical potential could be measured across the membrane. Such an explanation of this experiment was plausible and clear. But it was not clear why this explanation could be applied to the phenomena of the glass electrode and why it was assumed that the glass electrode worked on the principle that ions diffused into and through the glass electrode membrane, i.e. why the transport mechanism was introduced for the interpretation of the operation of the glass electrode.
When other ion-selective electrodes were also developed besides glass electrodes, this transport mechanism was applied for them, too. In
Fig. 1 and
Fig. 2 we illustrate the application of this theory for the interpretation of the working mechanism of electrodes. In
Fig. 2 the trajectories are given, but they have never been measured through the membrane profile.
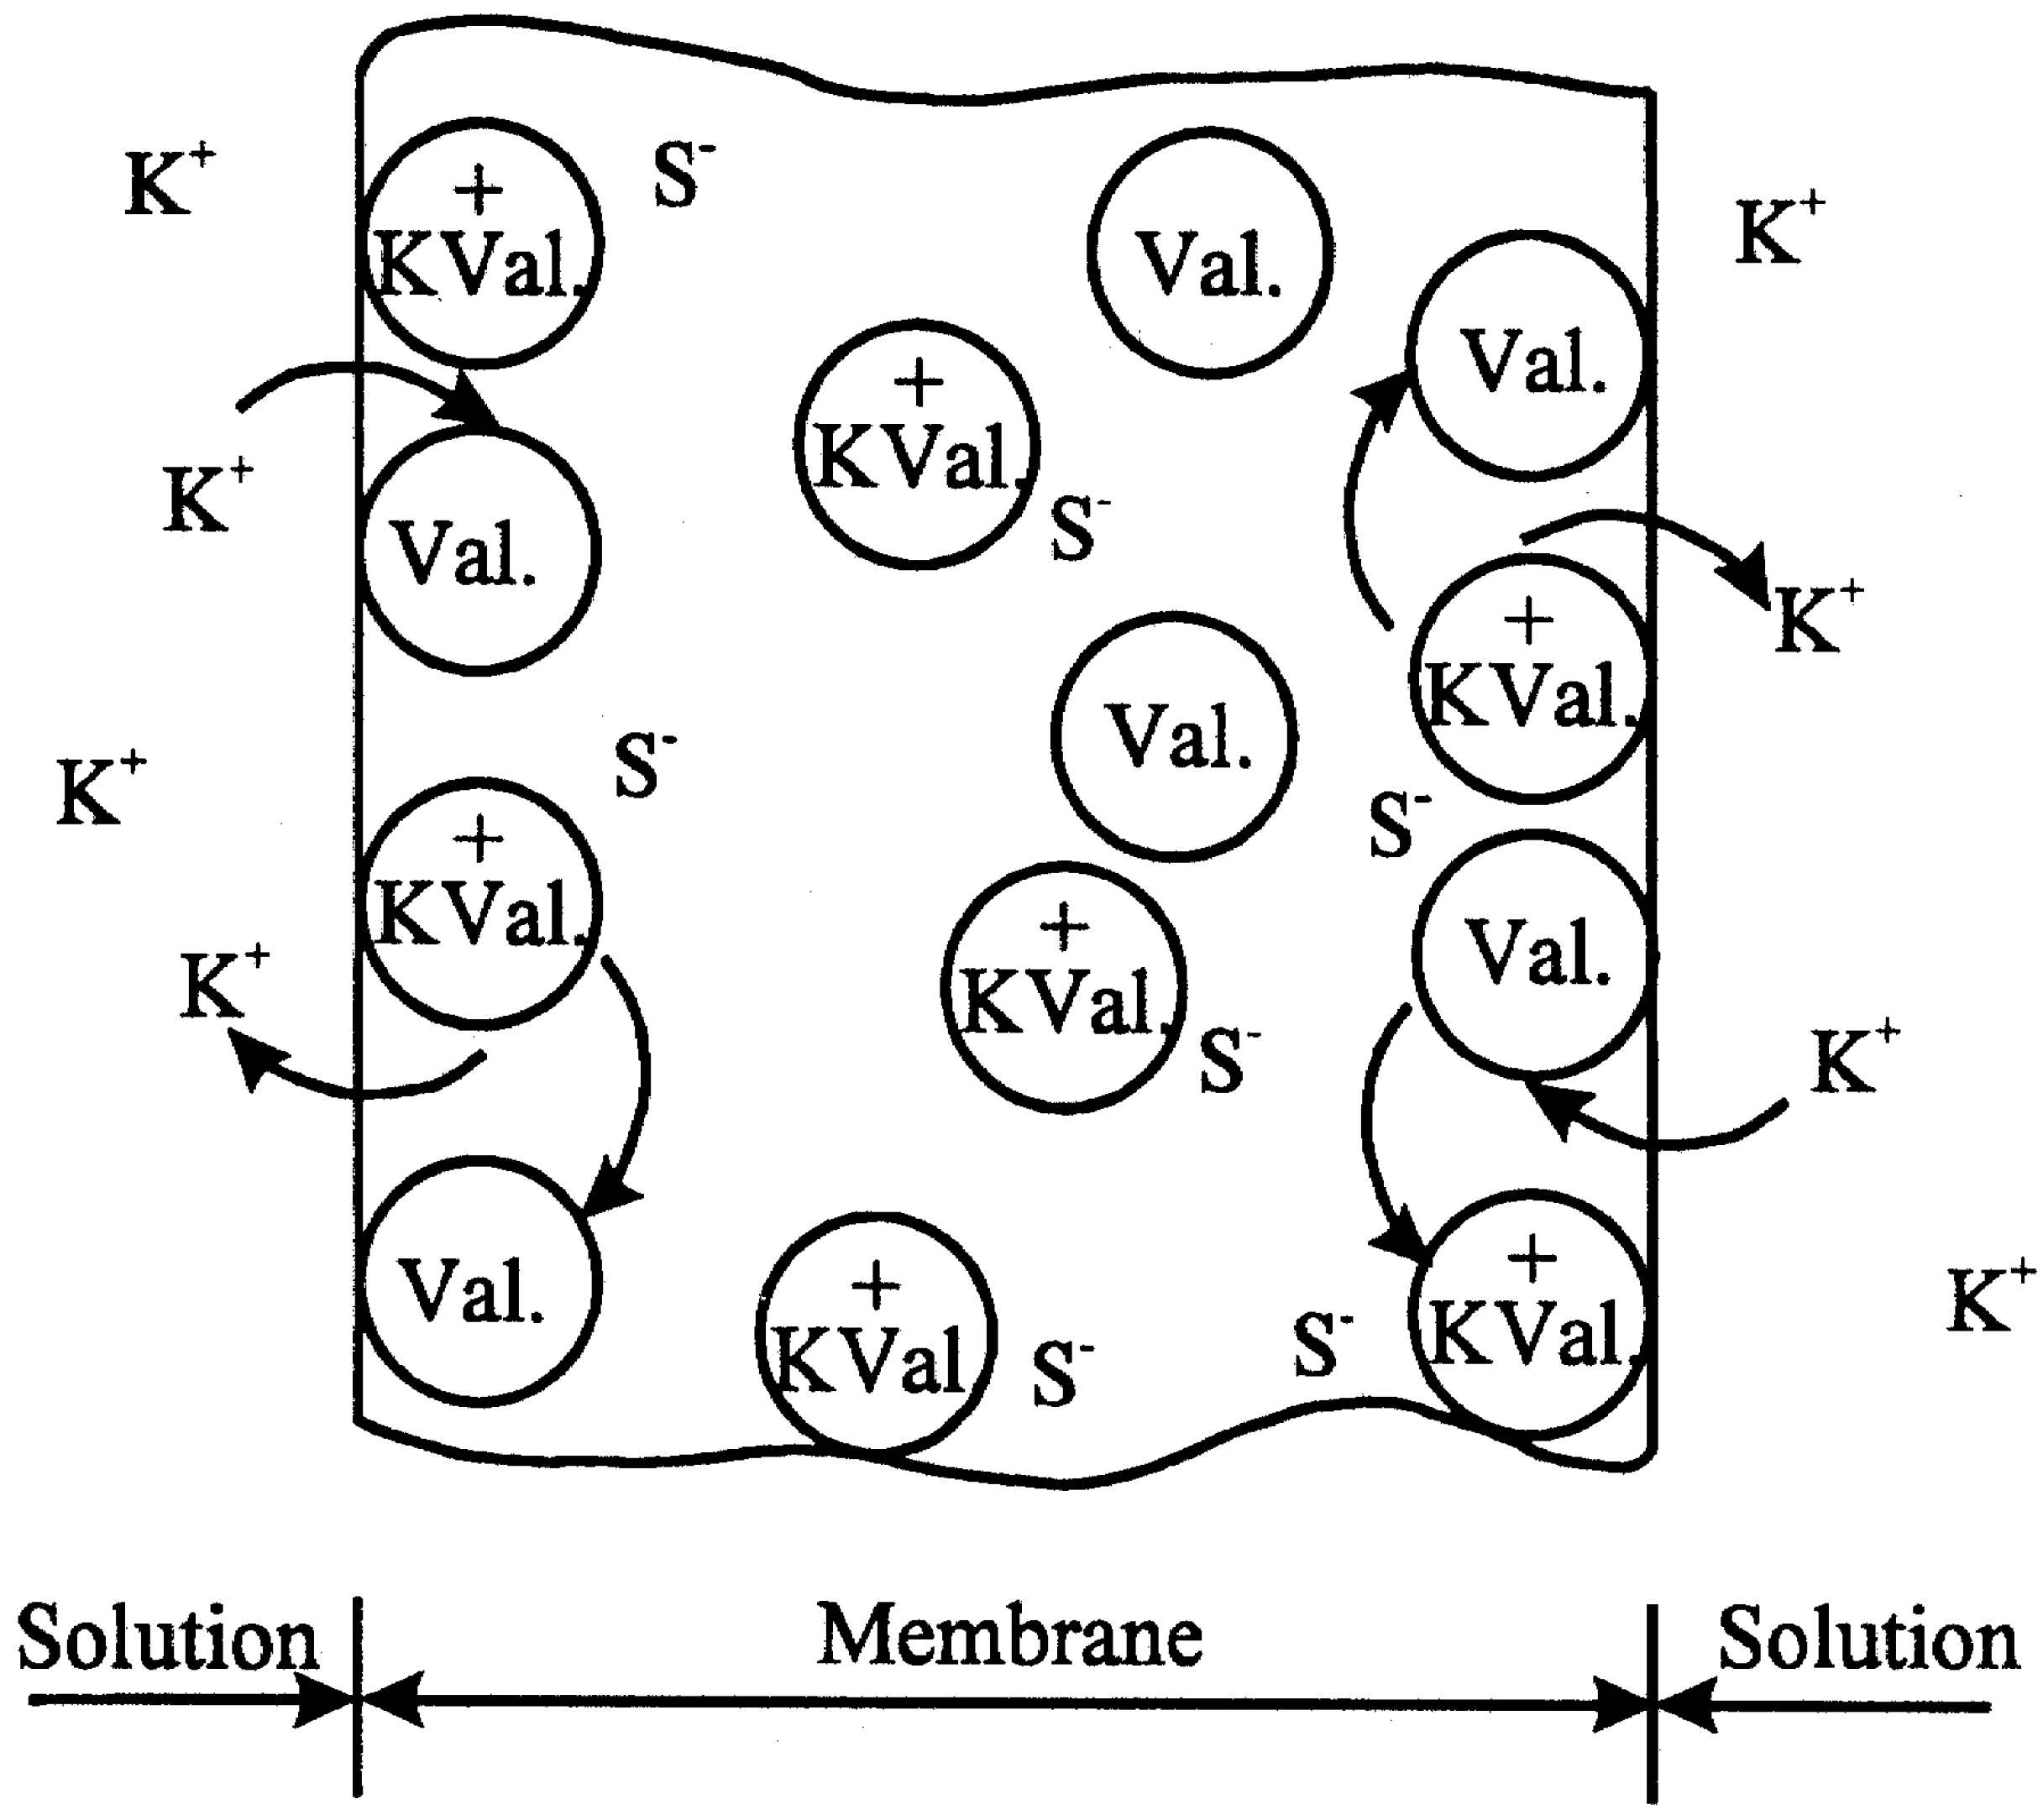
Figure 1.
Negatively-sited membrane (mobile or fixed sites S-) containing dissolved neutral carrier, valinomycin, exposed to bathing solutions of counter ion K+.
Figure 1.
Negatively-sited membrane (mobile or fixed sites S-) containing dissolved neutral carrier, valinomycin, exposed to bathing solutions of counter ion K+.
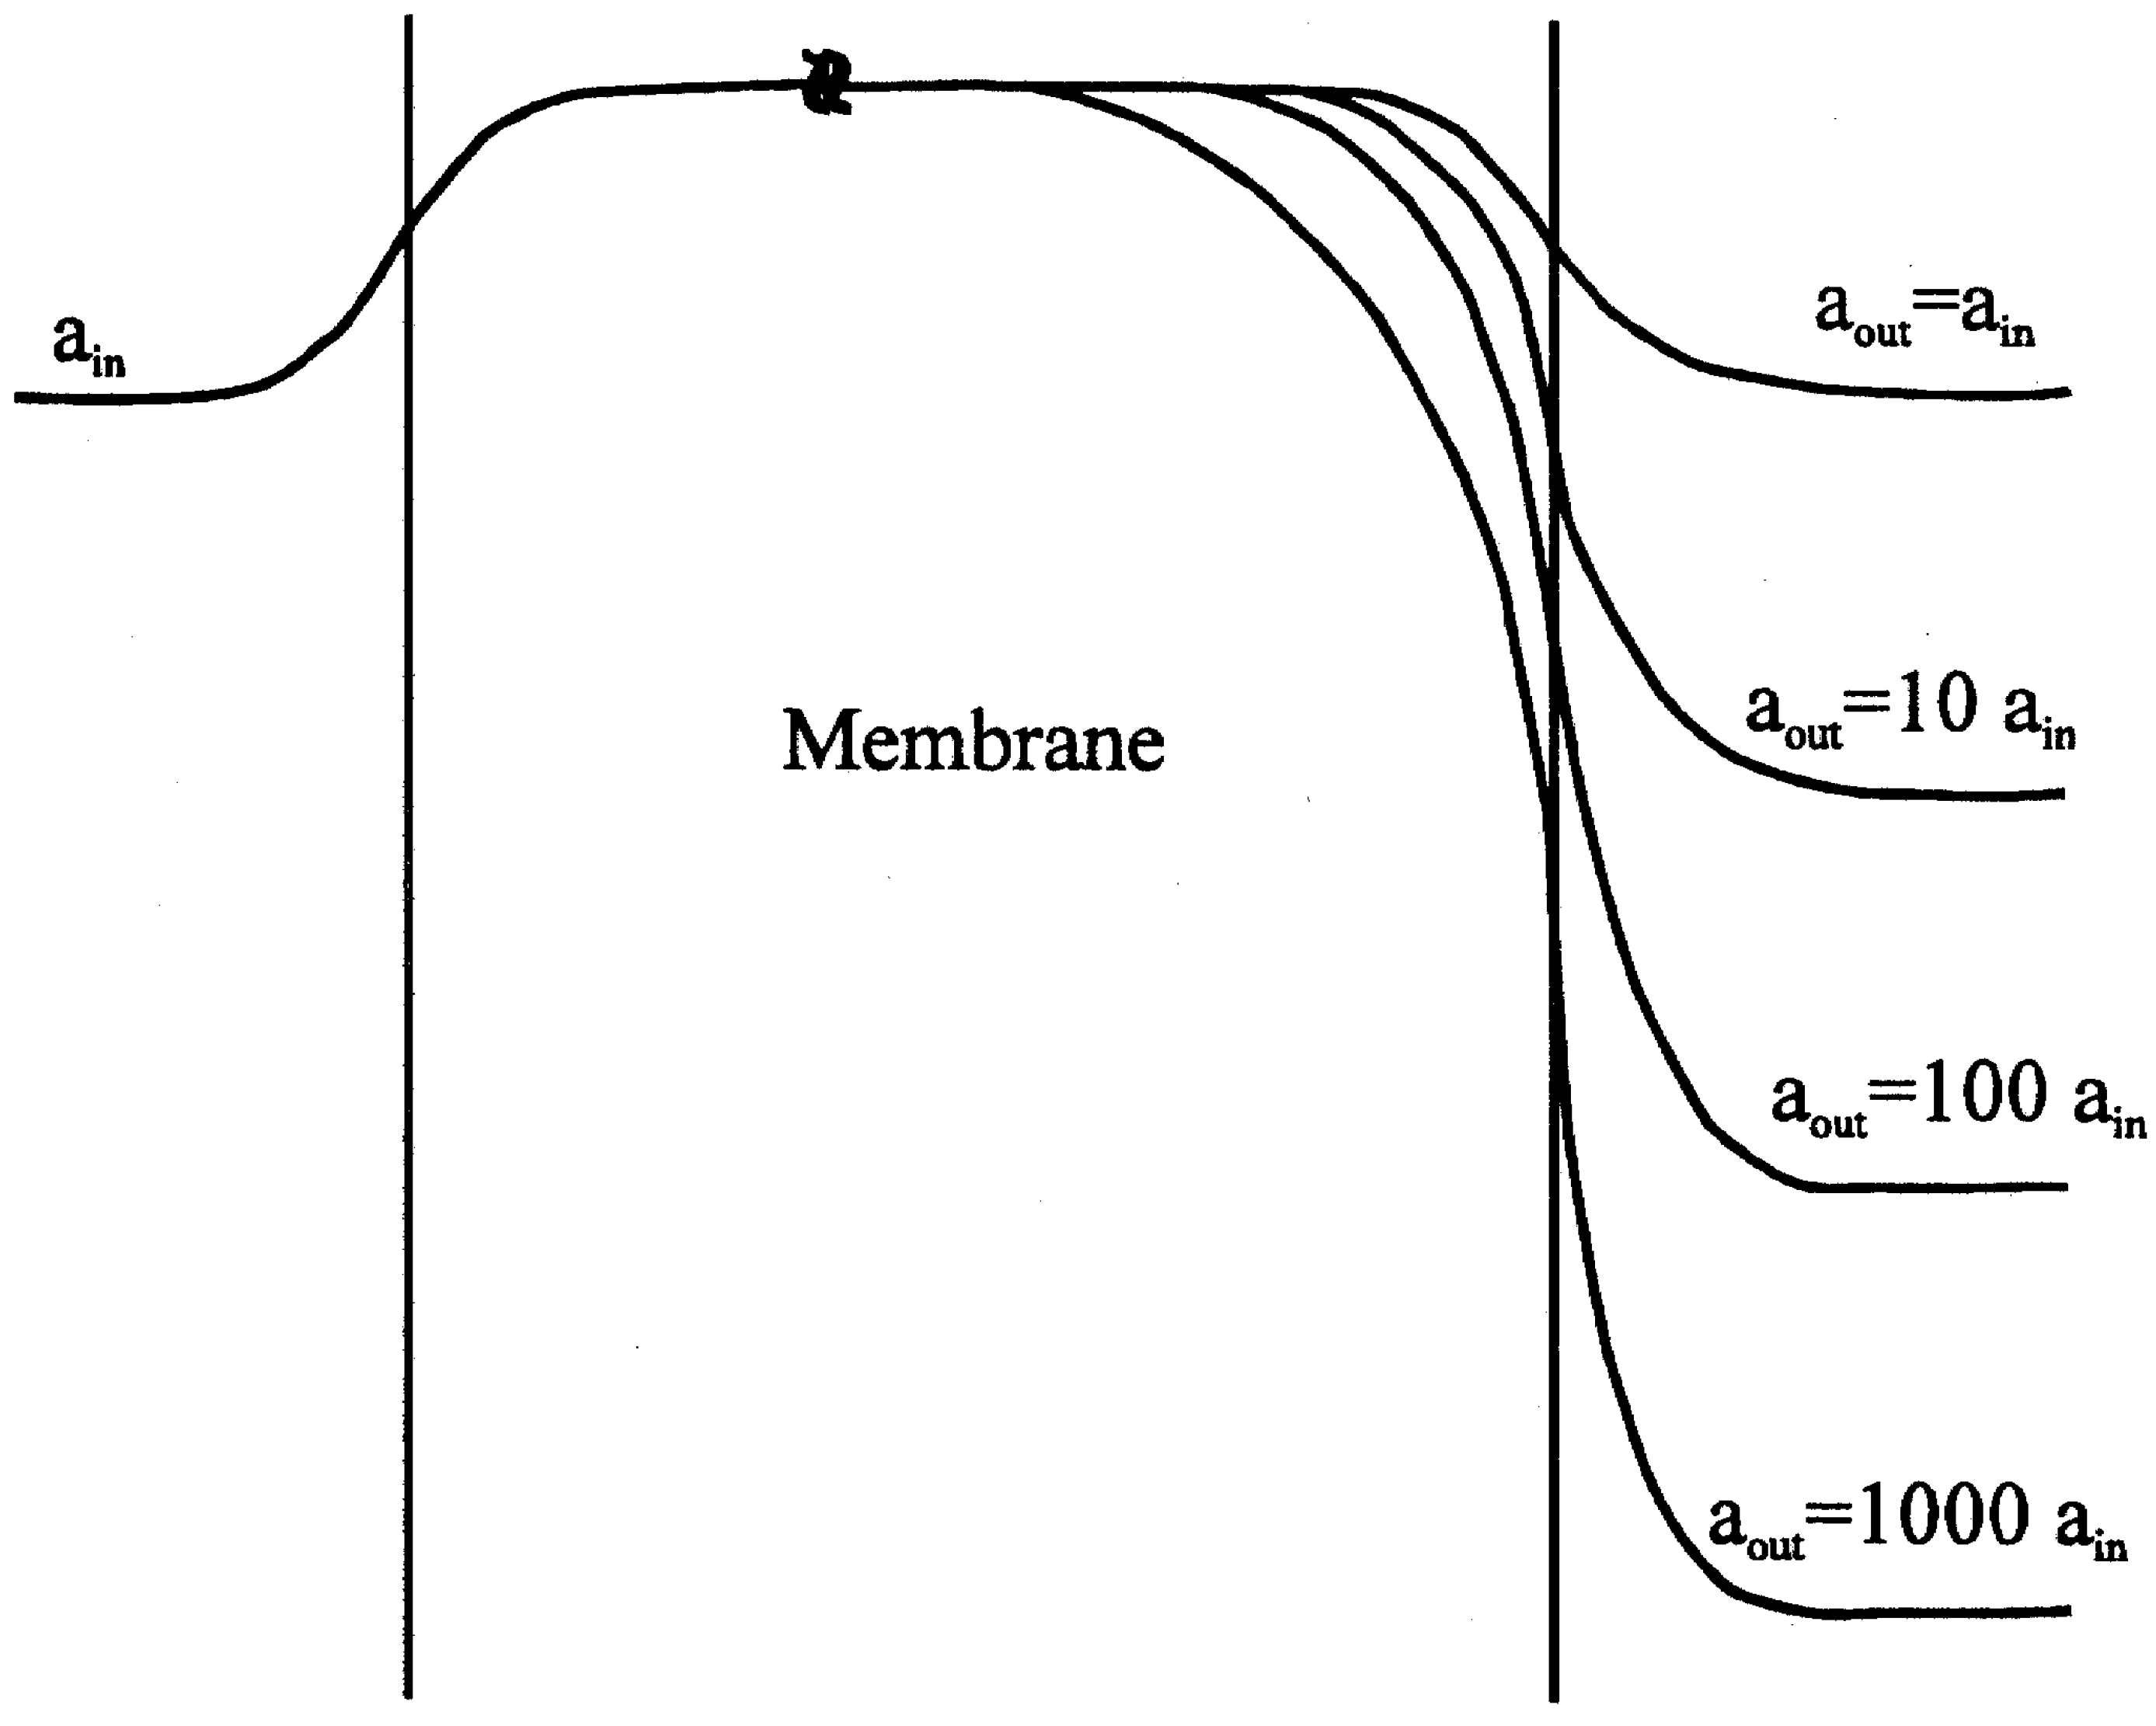
Figure 2.
Potential profile for a membrane containing exchangeable cations, with lower cation concentration in the membrane than in either bathing solution. The membrane is bathed on one side at constant activity ain and at a variety of activities on the sample or 'outer' side (theoretical investigation) aout and ain curve labels correspond to +1 ions for negative ions (-1 charge); the lower three labels correspond to 0.1 ain, 0.01 ain, and 0.001 ain.
A further question of interpretation was raised by Guggenheim
(3), who deduced the electrochemical potential from the chemical potential by applying the new term of the Galvani potential, which changes proportionally to the electrochemical potential. Hereby the only real measurable term in the equation was the chemical potential. He assumed that on both sides of the membrane (inside and on the solution side) the electrochemical potentials have to be defined, and in the case of equilibrium we can obtain a measurable electrical potential.
2. Experimental Investigations
Using the Donnan potential concept, various types of investigations were conducted on glass electrodes, e.g. studies on the transfer of Na
+, Li
+, etc., but even so, it was difficult to understand the behaviour of glass electrodes. Just therefore, to clear up the phenomena, we decided to investigate the physical and chemical characteristics of membrane electrodes containing different compounds. The aim of one of these fundamental experiments was to examine whether the transport of ions can really be measured. For this purpose we prepared “sandwich electrodes”
(4) as follows: we put silicon-rubber based silver iodide electrode membranes on both sides of a metal plate
(5). The sandwich electrode thus prepared was immersed in an electrolyte solution, and the potential of the electrode was measured
versus a reference. We changed the metal, and applied platinum, silver or aluminium (the surface of the latter was covered by an oxide layer), and in each case, the measured potential values were equal, i.e. the quality and thickness of the metal plate did not influence the potential values. We applied the three different metals because, as a first approximation, it was claimed by some researchers that the silver plate covered by the silver iodide membrane could take part in the silver transport. It became clear that this could not be the case with the other metals.
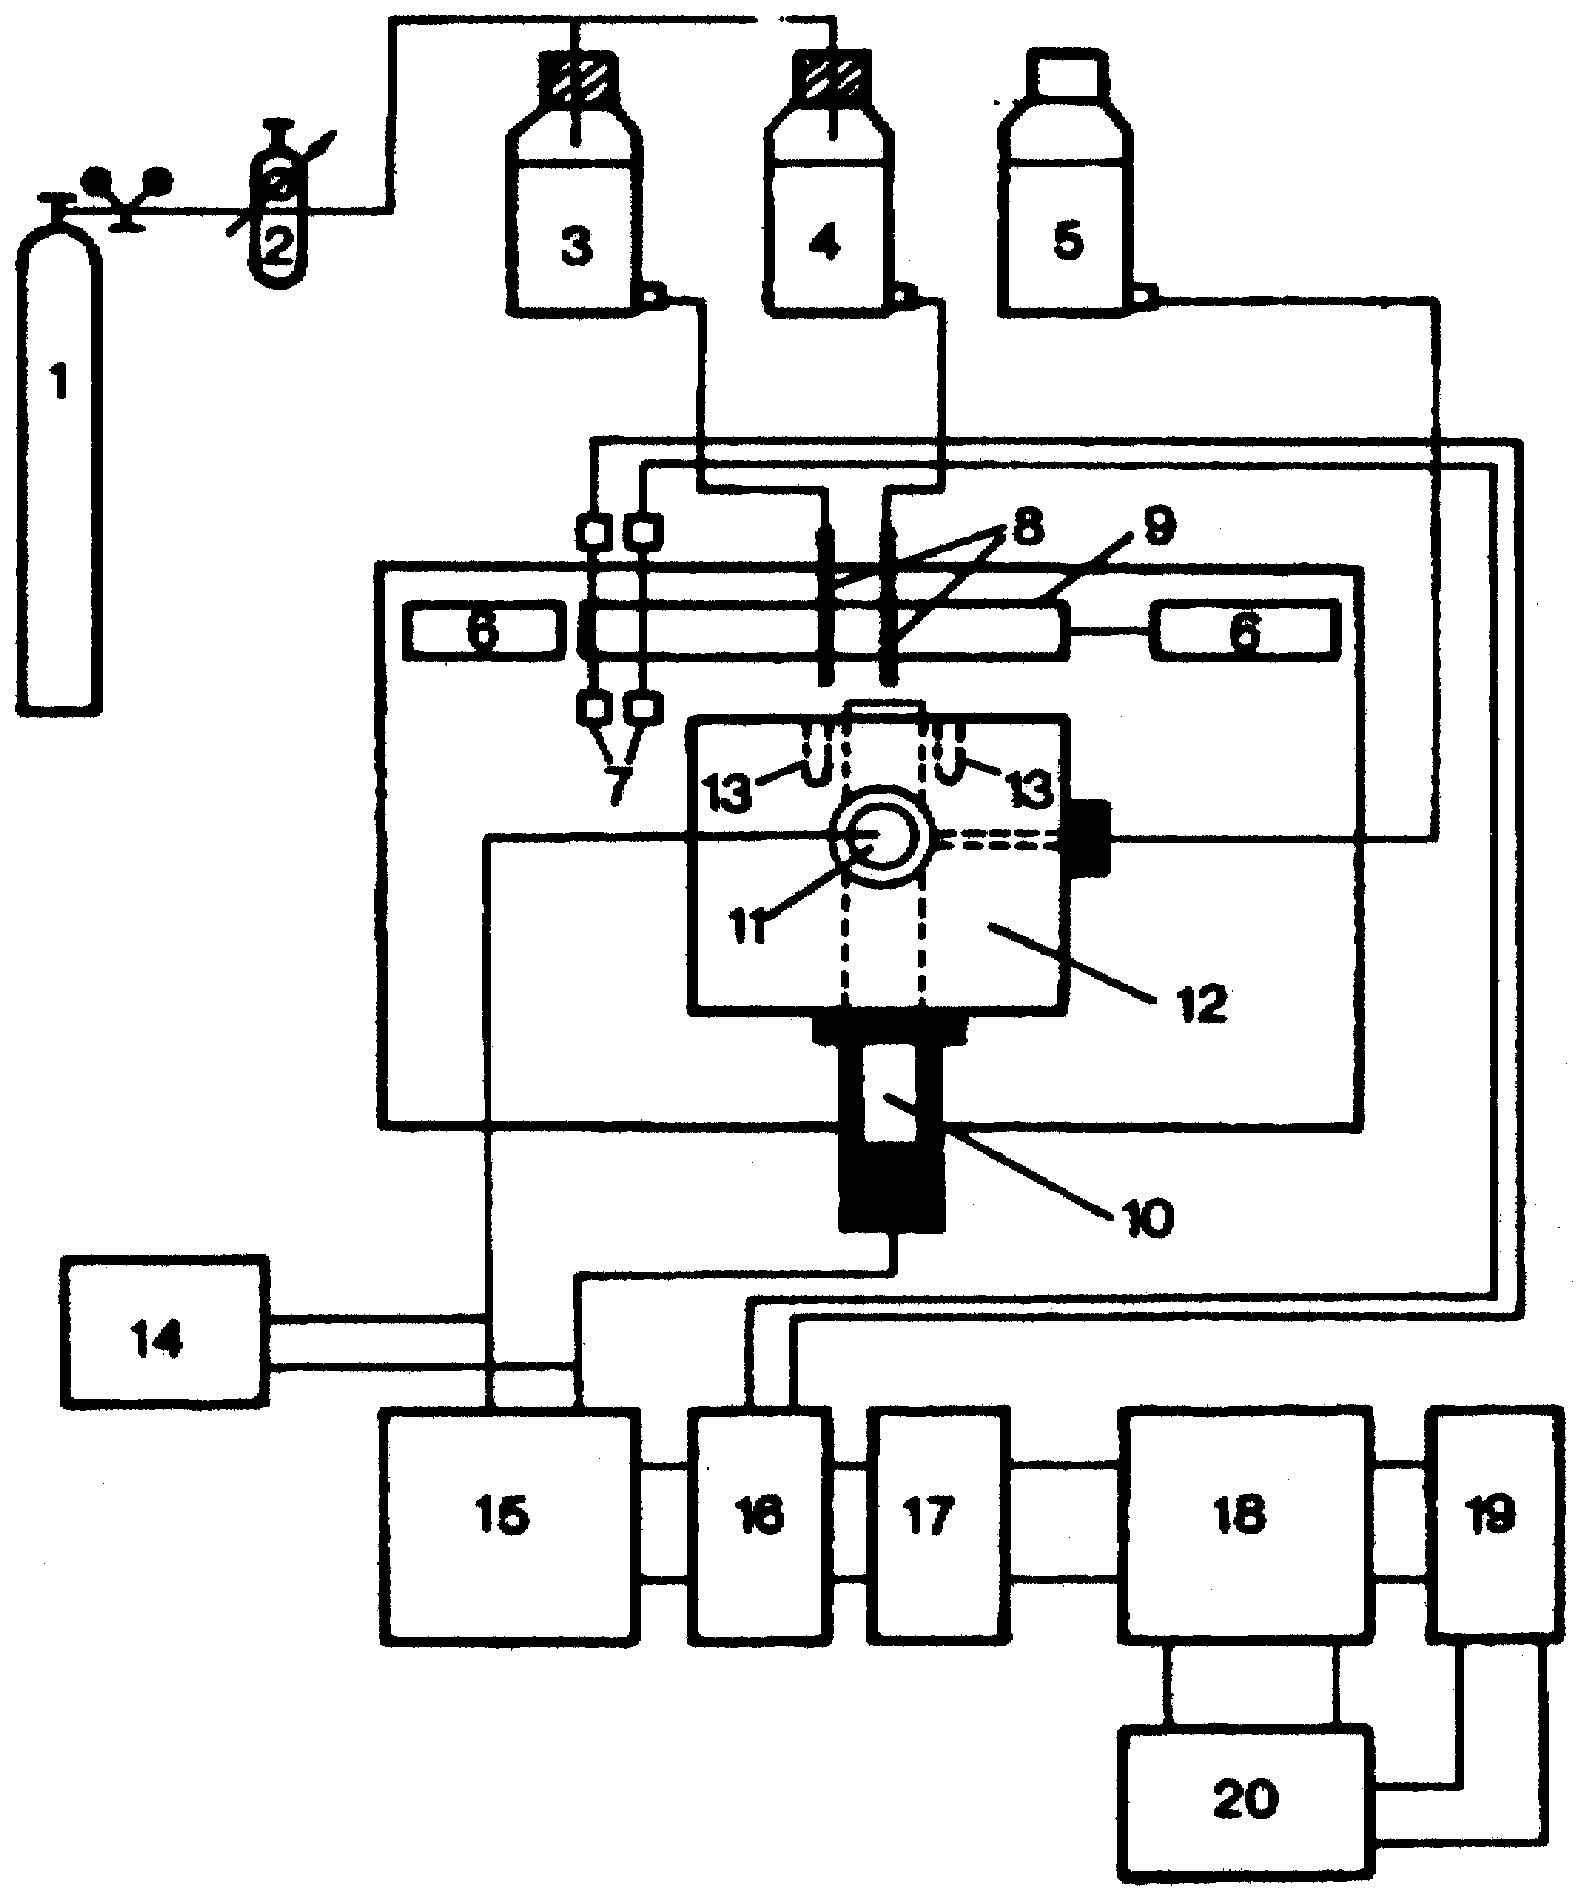
In the 1960s we developed an instrument for measuring the response times of ion-selective electrodes
(6). With this instrument real electrode response times could be measured (in contrast to systems where the response time was measured in an electrochemical cell assembly in which internal eddy currents influenced the measured response times). The solution was jetted onto the surface of the electrode at a high velocity. For the iodide electrode the concentrations of the solution used were 10
-2 and 10
-3 mol/l. The change of solution at the electrode surface took a very short time, less than 1 ms. We measured the response time of a silver plate electrode, of silver halide electrodes, and later on the response times of potassium ion-selective electrodes which contained a potassium-measuring component
(7) built into a polymer membrane. To our surprise, we obtained in each case practically the same response time of 20 ms. This response time indicated that after changing the concentration of the electrolyte, the components of the new solution need so much time to get onto the surface of the electrode through the stagnant layer of solution (
Fig. 3a,
Fig. 3b,
Fig. 3c).
Figure 3a.
Measuring set-up for response time studies. 1 Nitrogen tank; 2 high precision reduction valve; 3, 4 sample solutions of different concentrations; 5 salt bridge electrolyte; 6 pneumatic pistons; 7 optical detectors; 8 jets; 9 mobile clamping arrangement for the jets; 10 ISE; 11 reference electrode; 12 electrochemical cell; 13 drainage holes for sample solutions; 14 pH-meter; 15 high impedance amplifier (Keithley 604); 16 experimental control interface; 17 HP 82941A BCD interface; 18 HP-85 desk-top computer; 19 HP 7470A digital plotter; 20 HP- 226 microcomputer.
Figure 3b.
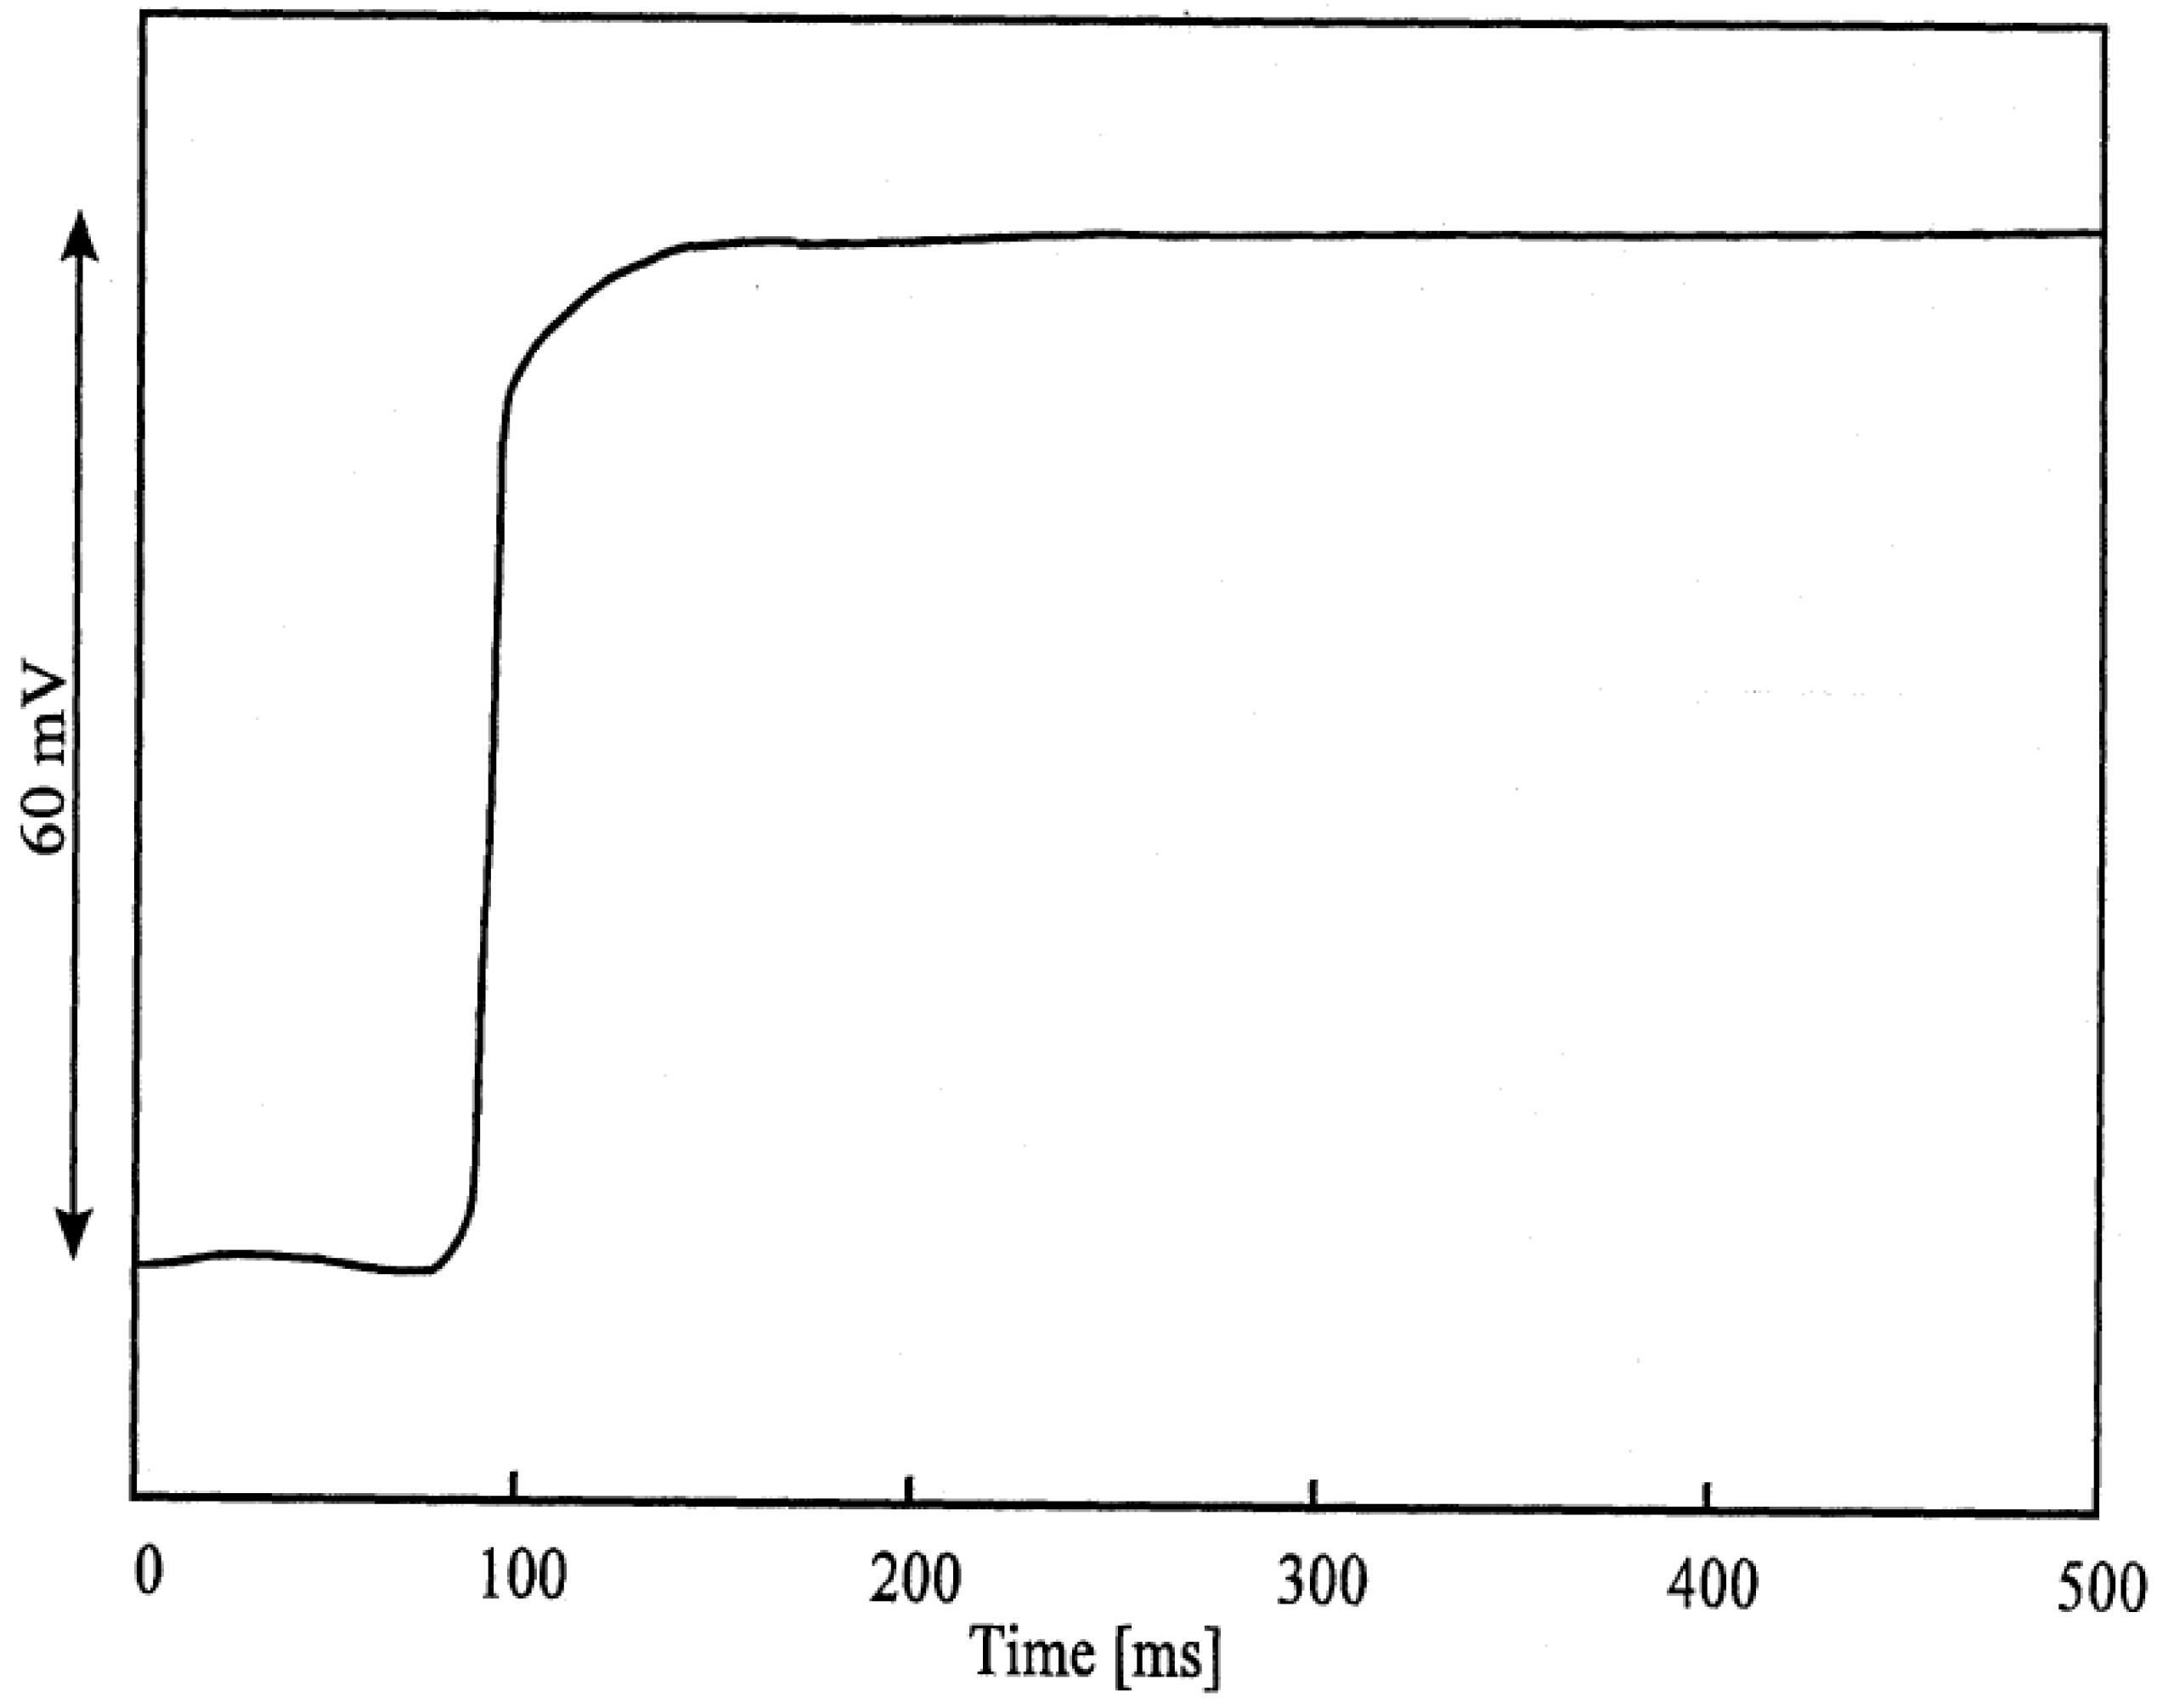
Response-time curve of an AgI electrode: change of activity from 10-3 to 10-2 Mol/l I'.
Figure 3b.
Response-time curve of an AgI electrode: change of activity from 10-3 to 10-2 Mol/l I'.
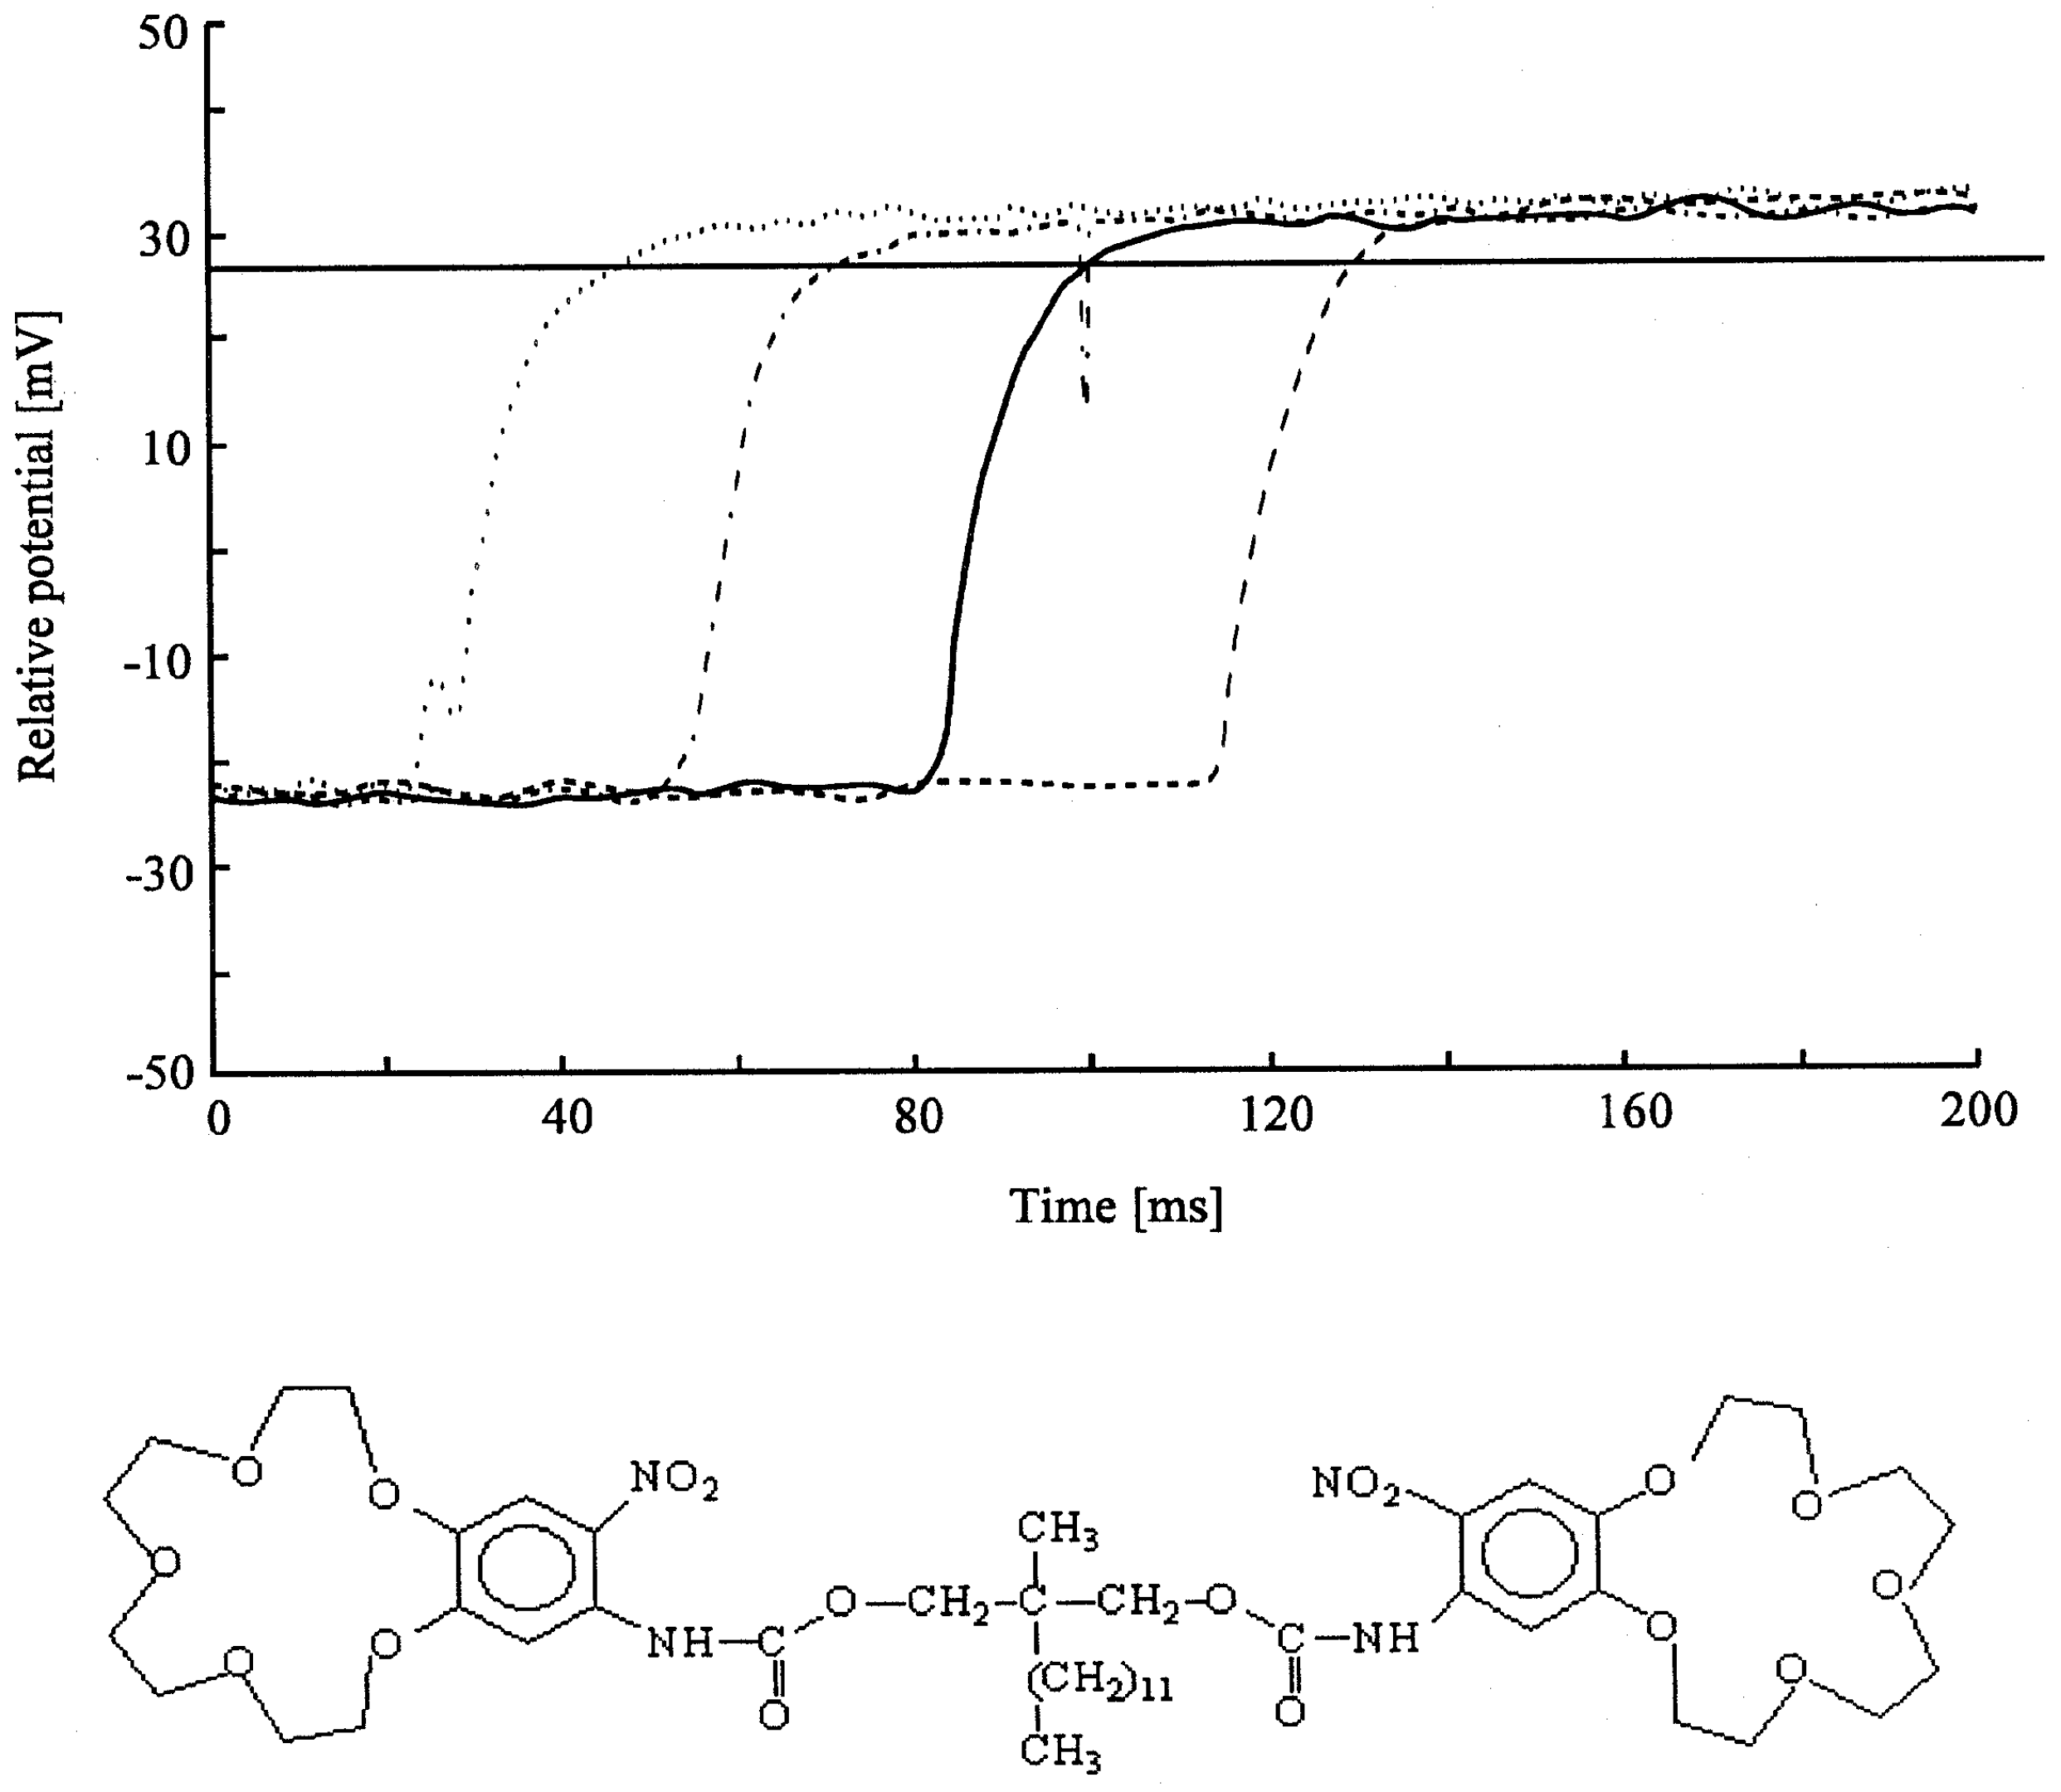
Figure 3c.
Effect of conditioning 10-3 mol/l KCl solutions on the response time curves of BME-44/DOS based potassium selective electrodes. Activity step: 10-2 mol/l KCl⇒10-3 mol/l KCl. Ionic strength: 0,1 mol/l (NaCl); flow rate: 115 ml/min. (1) no conditioning; (2) 67-h cond.; (3) 10-d cond.; (4) 13-d cond.
This finding proves that the diffusion of ions into the membrane should be excluded, since diffusion of ions in the membrane is much slower than in the solution, and the establishment of the potential would take a much longer time than the value measured.
The next question was whether the electrode potential could be influenced by changing the electrode surface
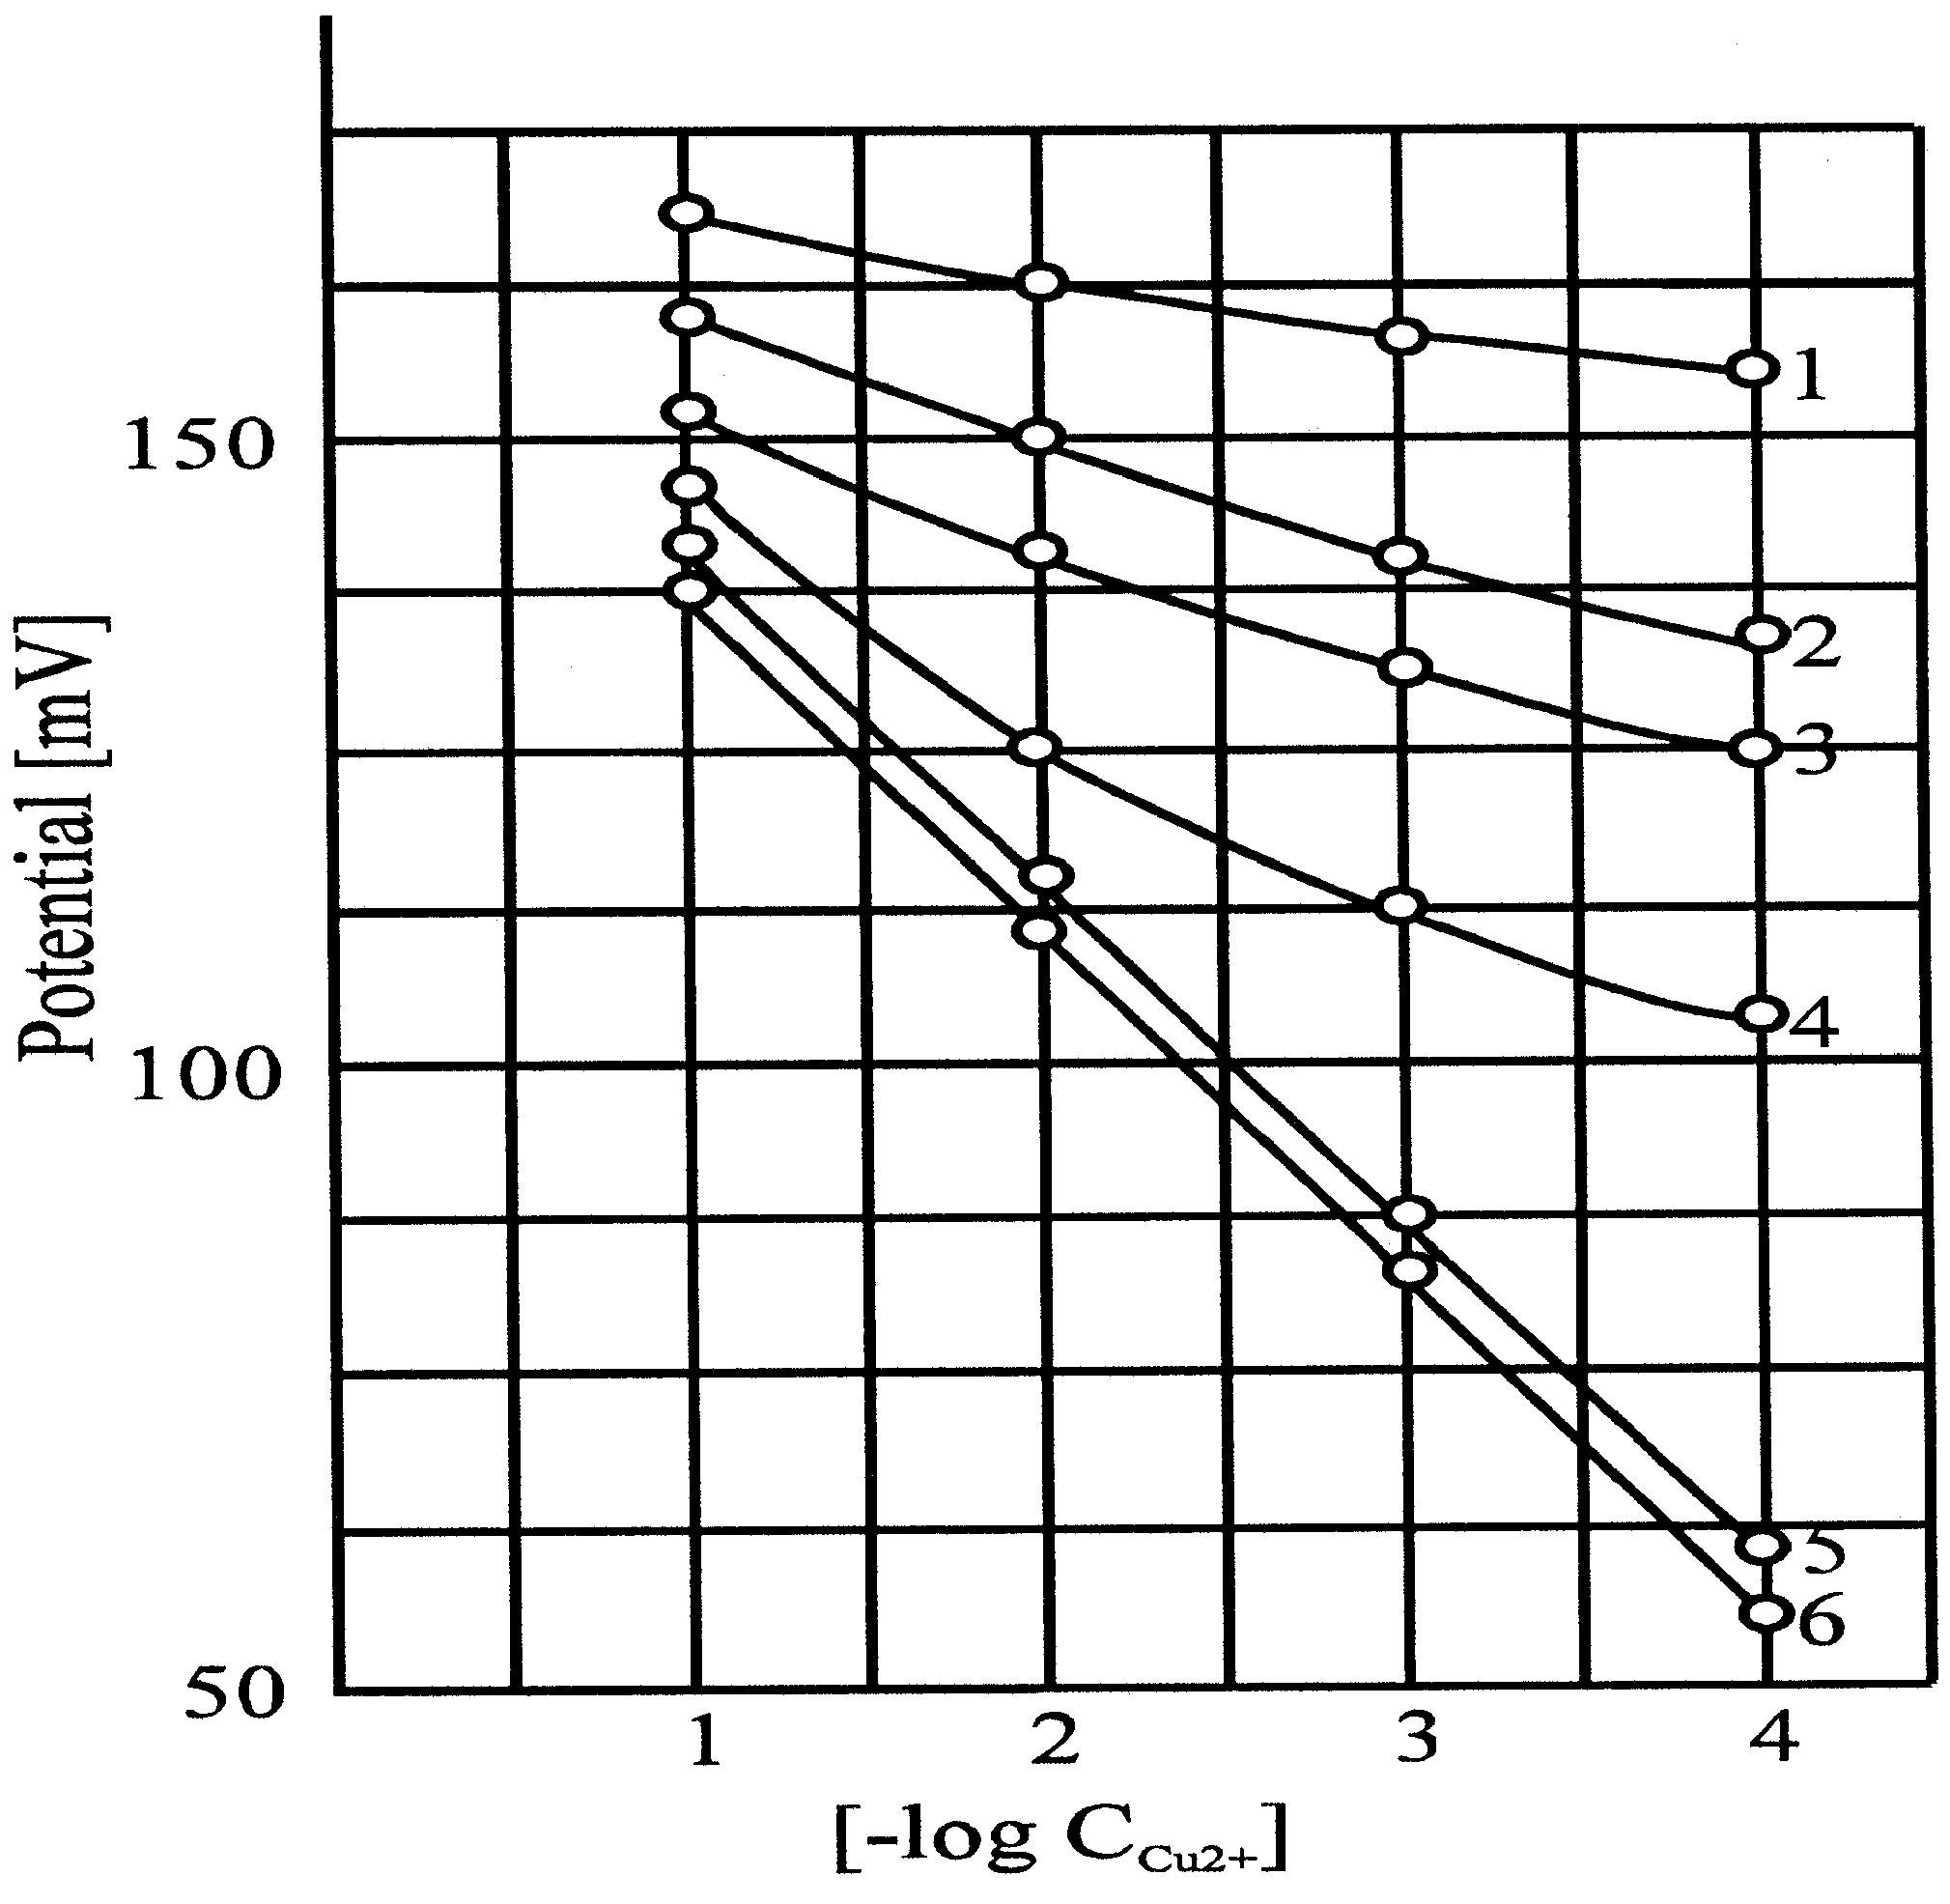
(8). The copper sulfide precipitate based copper ion-selective electrode was an excellent example in this respect. When we immersed the electrode with a Nernstian response into the solution of an oxidant, the electrode gradually failed to produce a Nernstian response as a function of the time of oxidation (
Fig. 4a,
Fig. 4b,
Fig. 4c).
Figure 4a.
Copper(II) response of a pressed pellet electrode after soaking in cerium(IV) solutions and regenerating in ascorbic acid solutions for different times. (1) soaking for 30 min in Ce(IV); (2) soaking for 10 min in Ce(IV); (3) regenerating in ascorbic acid for 1min; (4) regenerating in ascorbic acid for 30 min; (5) regenerating in ascorbic acid for 80min; (6) untreated electrode.
Figure 4b.
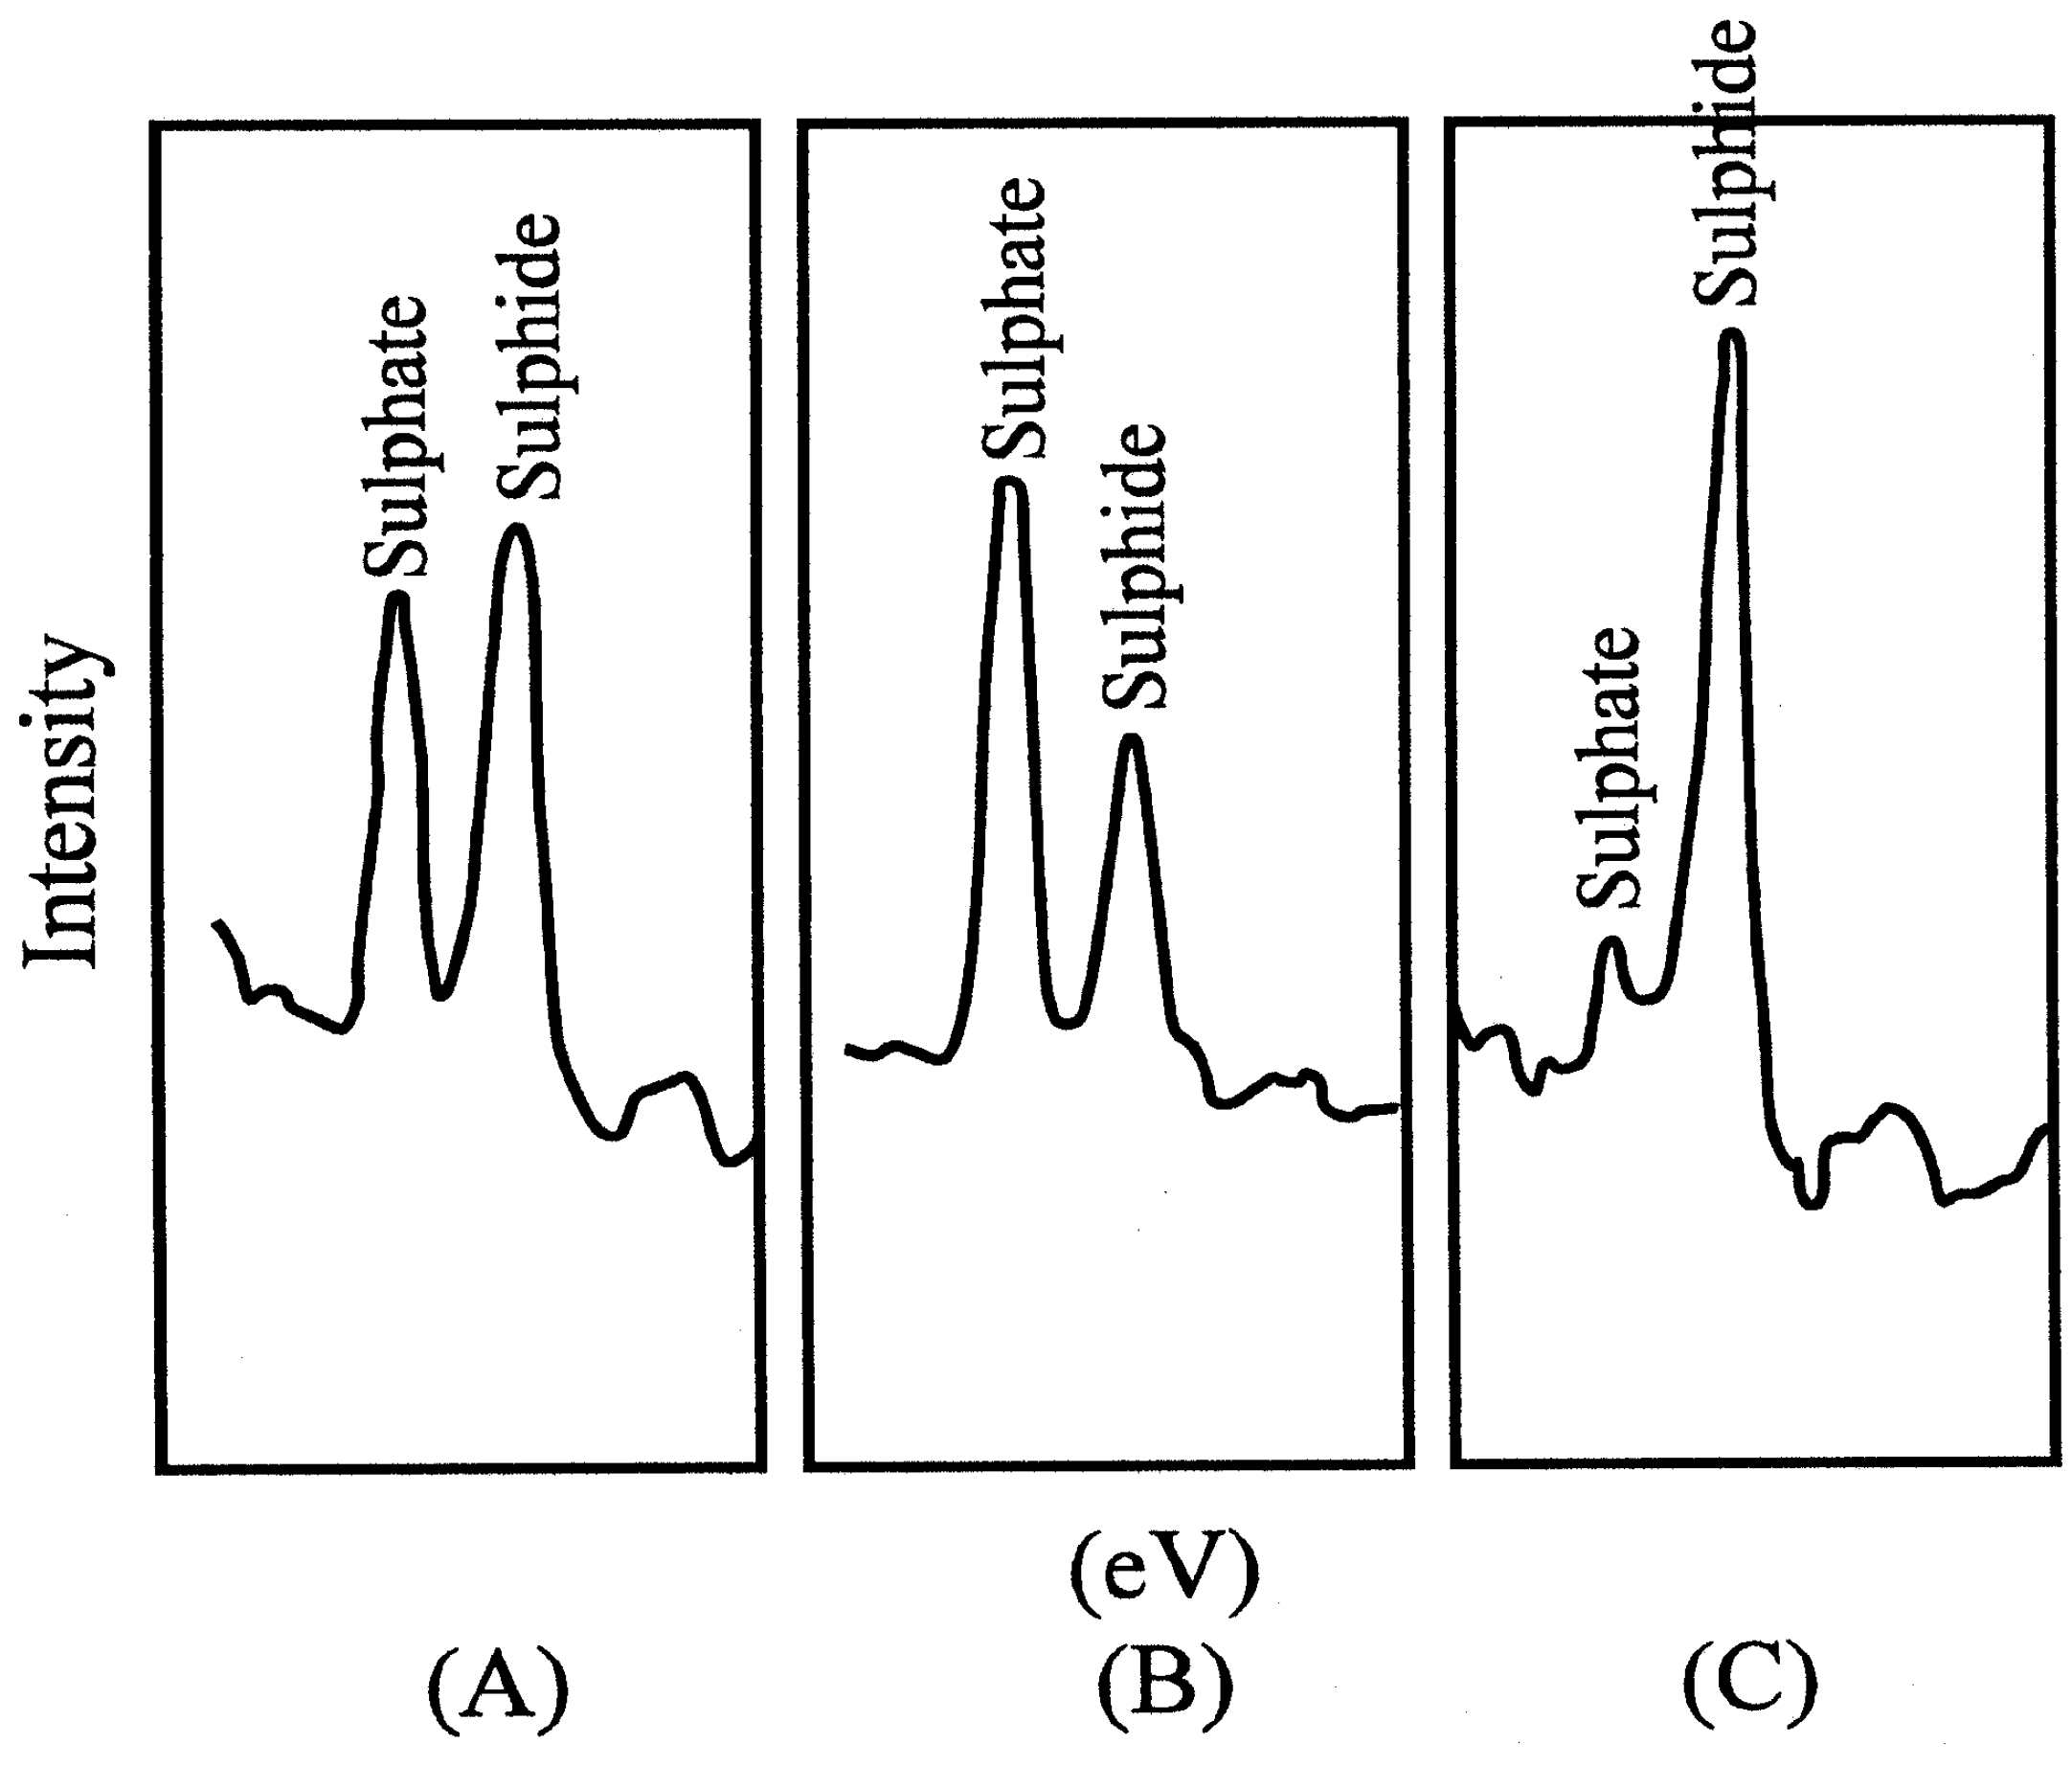
Photoelectron spectra. Mg Kα x-ray, 6 keV, 40 mA, 240 W, 1,3*10-4 Pa. (A) Untreated CuS electrode; (B) electrodes treated in KMnO4; (C) after treatment with KMnO4 and then ascorbic acid.
Figure 4b.
Photoelectron spectra. Mg Kα x-ray, 6 keV, 40 mA, 240 W, 1,3*10-4 Pa. (A) Untreated CuS electrode; (B) electrodes treated in KMnO4; (C) after treatment with KMnO4 and then ascorbic acid.
Figure 4c.
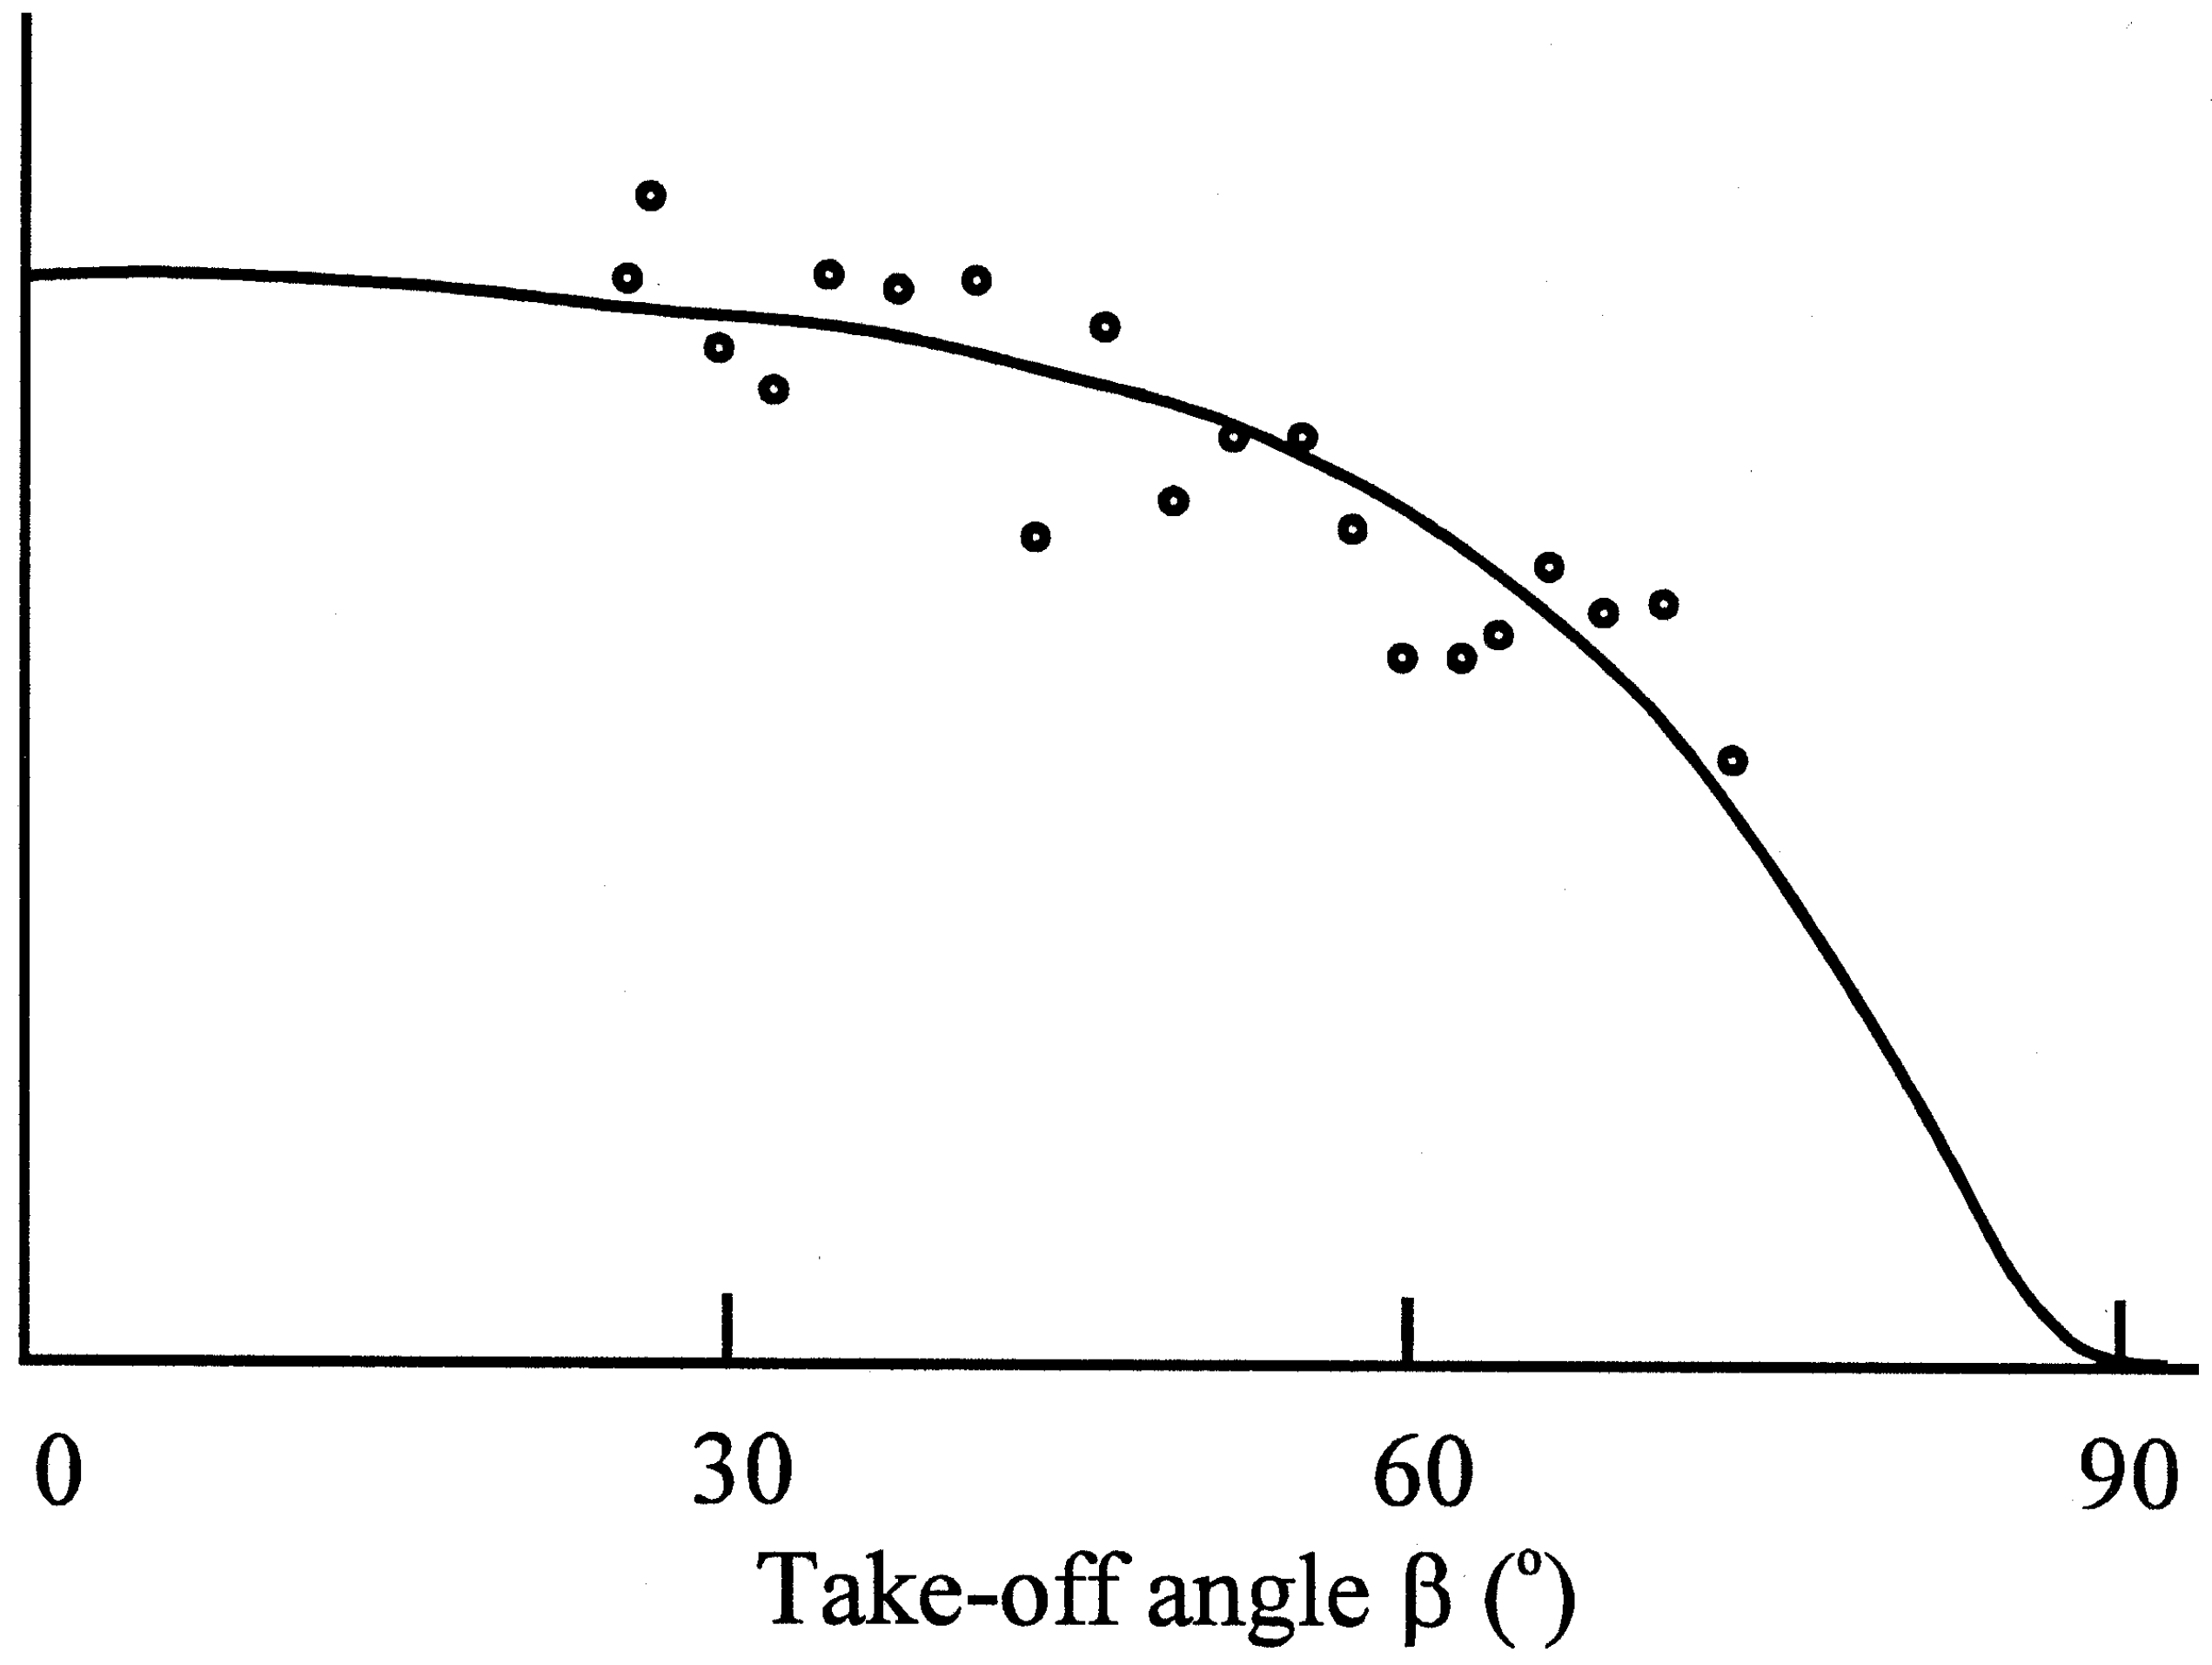
Determination of the thickness of the sulphate layer by application of the variable take-off angle technique.
Figure 4c.
Determination of the thickness of the sulphate layer by application of the variable take-off angle technique.
Photoelectron spectroscopy revealed that a blocking layer containing sulfate was formed on the electrode surface
(9). The thickness of the layer was measured as 0,8 nm. For this purpose the determination of the take-off angle was used, which indicated molecular dimensions. The Nernstian response of the electrode was restored by treatment with a reducing agent, e.g. ascorbic acid.
A further interesting experiment seemed to be to measure the depth of penetration of the primary ion into the electrode membrane. We made our experiments with two types of electrode: one was a solvent-polymetric membrane responding to potassium ions, and the other was a glass electrode.
The experiment was carried out by ATR-IR technique on polymer membrane electrodes containing a selective comlexant of potassium
(10). The electrode was soaked for a long period of time in a solution containing either KSCN or KCI. In the presence of the lyophobic SCN
- ions, K
+ ions entered the membrane and during the relatively long time of soaking reached to a depth exceeding that of the penetration depth of the IR rays. In the presence of the lyophilic Cl
-, K
+ ions only enter the outermost surface layers, down to a depth of only 5-10 nm. Thermal diffusion may also have influenced the determination of the penetration depth (
Fig. 5a).
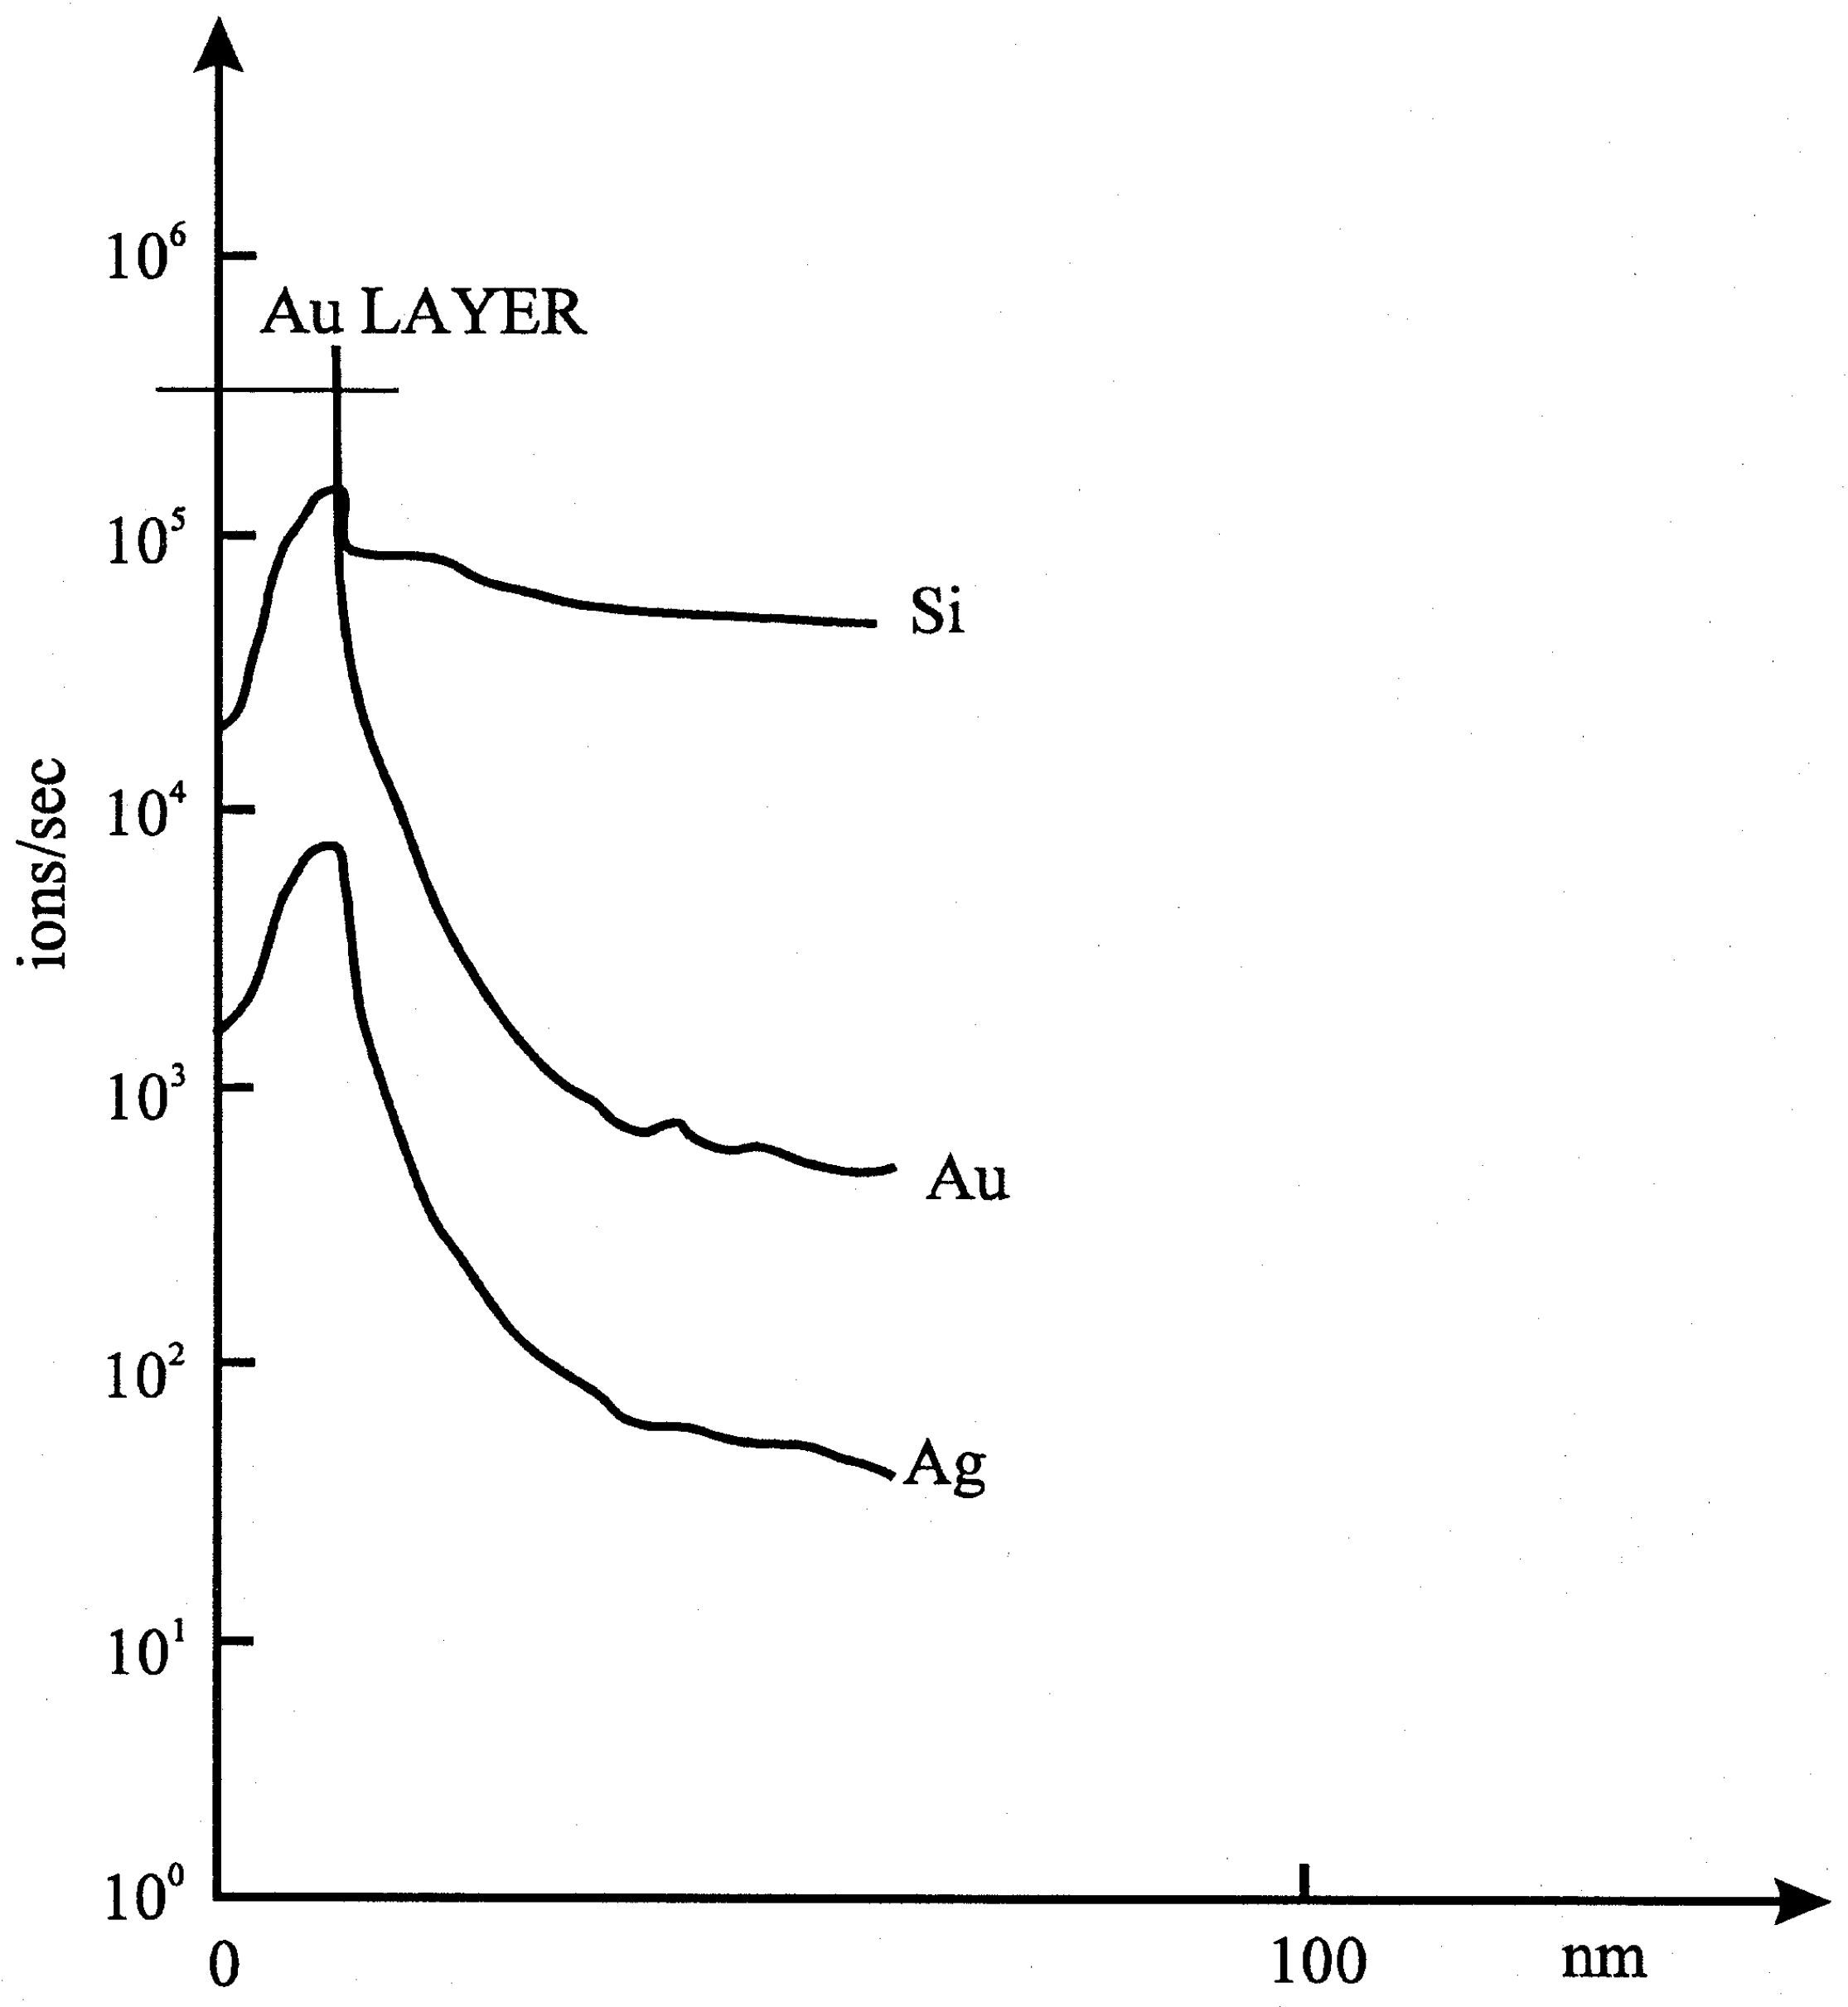
For a better indication of the phenomena, in the experiments with glass electrodes, instead of protons, Ag
+ ions were used, to which glass electrodes also respond
(11). An electrode was immersed in a 10
-3 mol/l solution of Ag
+ for 20-30s, until the potential was stabilized. The electrode was then dried, and covered by a gold layer. The removal of the surface layers was studied by means of SIMS technique. It was found that the depth distribution of silver and gold was the same. (
Fig. 5b).
The comparison of the two phenomena verified that the surface of the electrodes is not uniformly plain. All the above findings speak against the phenomenon of ion transfer through the electrode, and we have to reject the assumption that an ion transfer mechanism can be applied for ion-selective electrodes on the basis of the Donnan phenomenon.
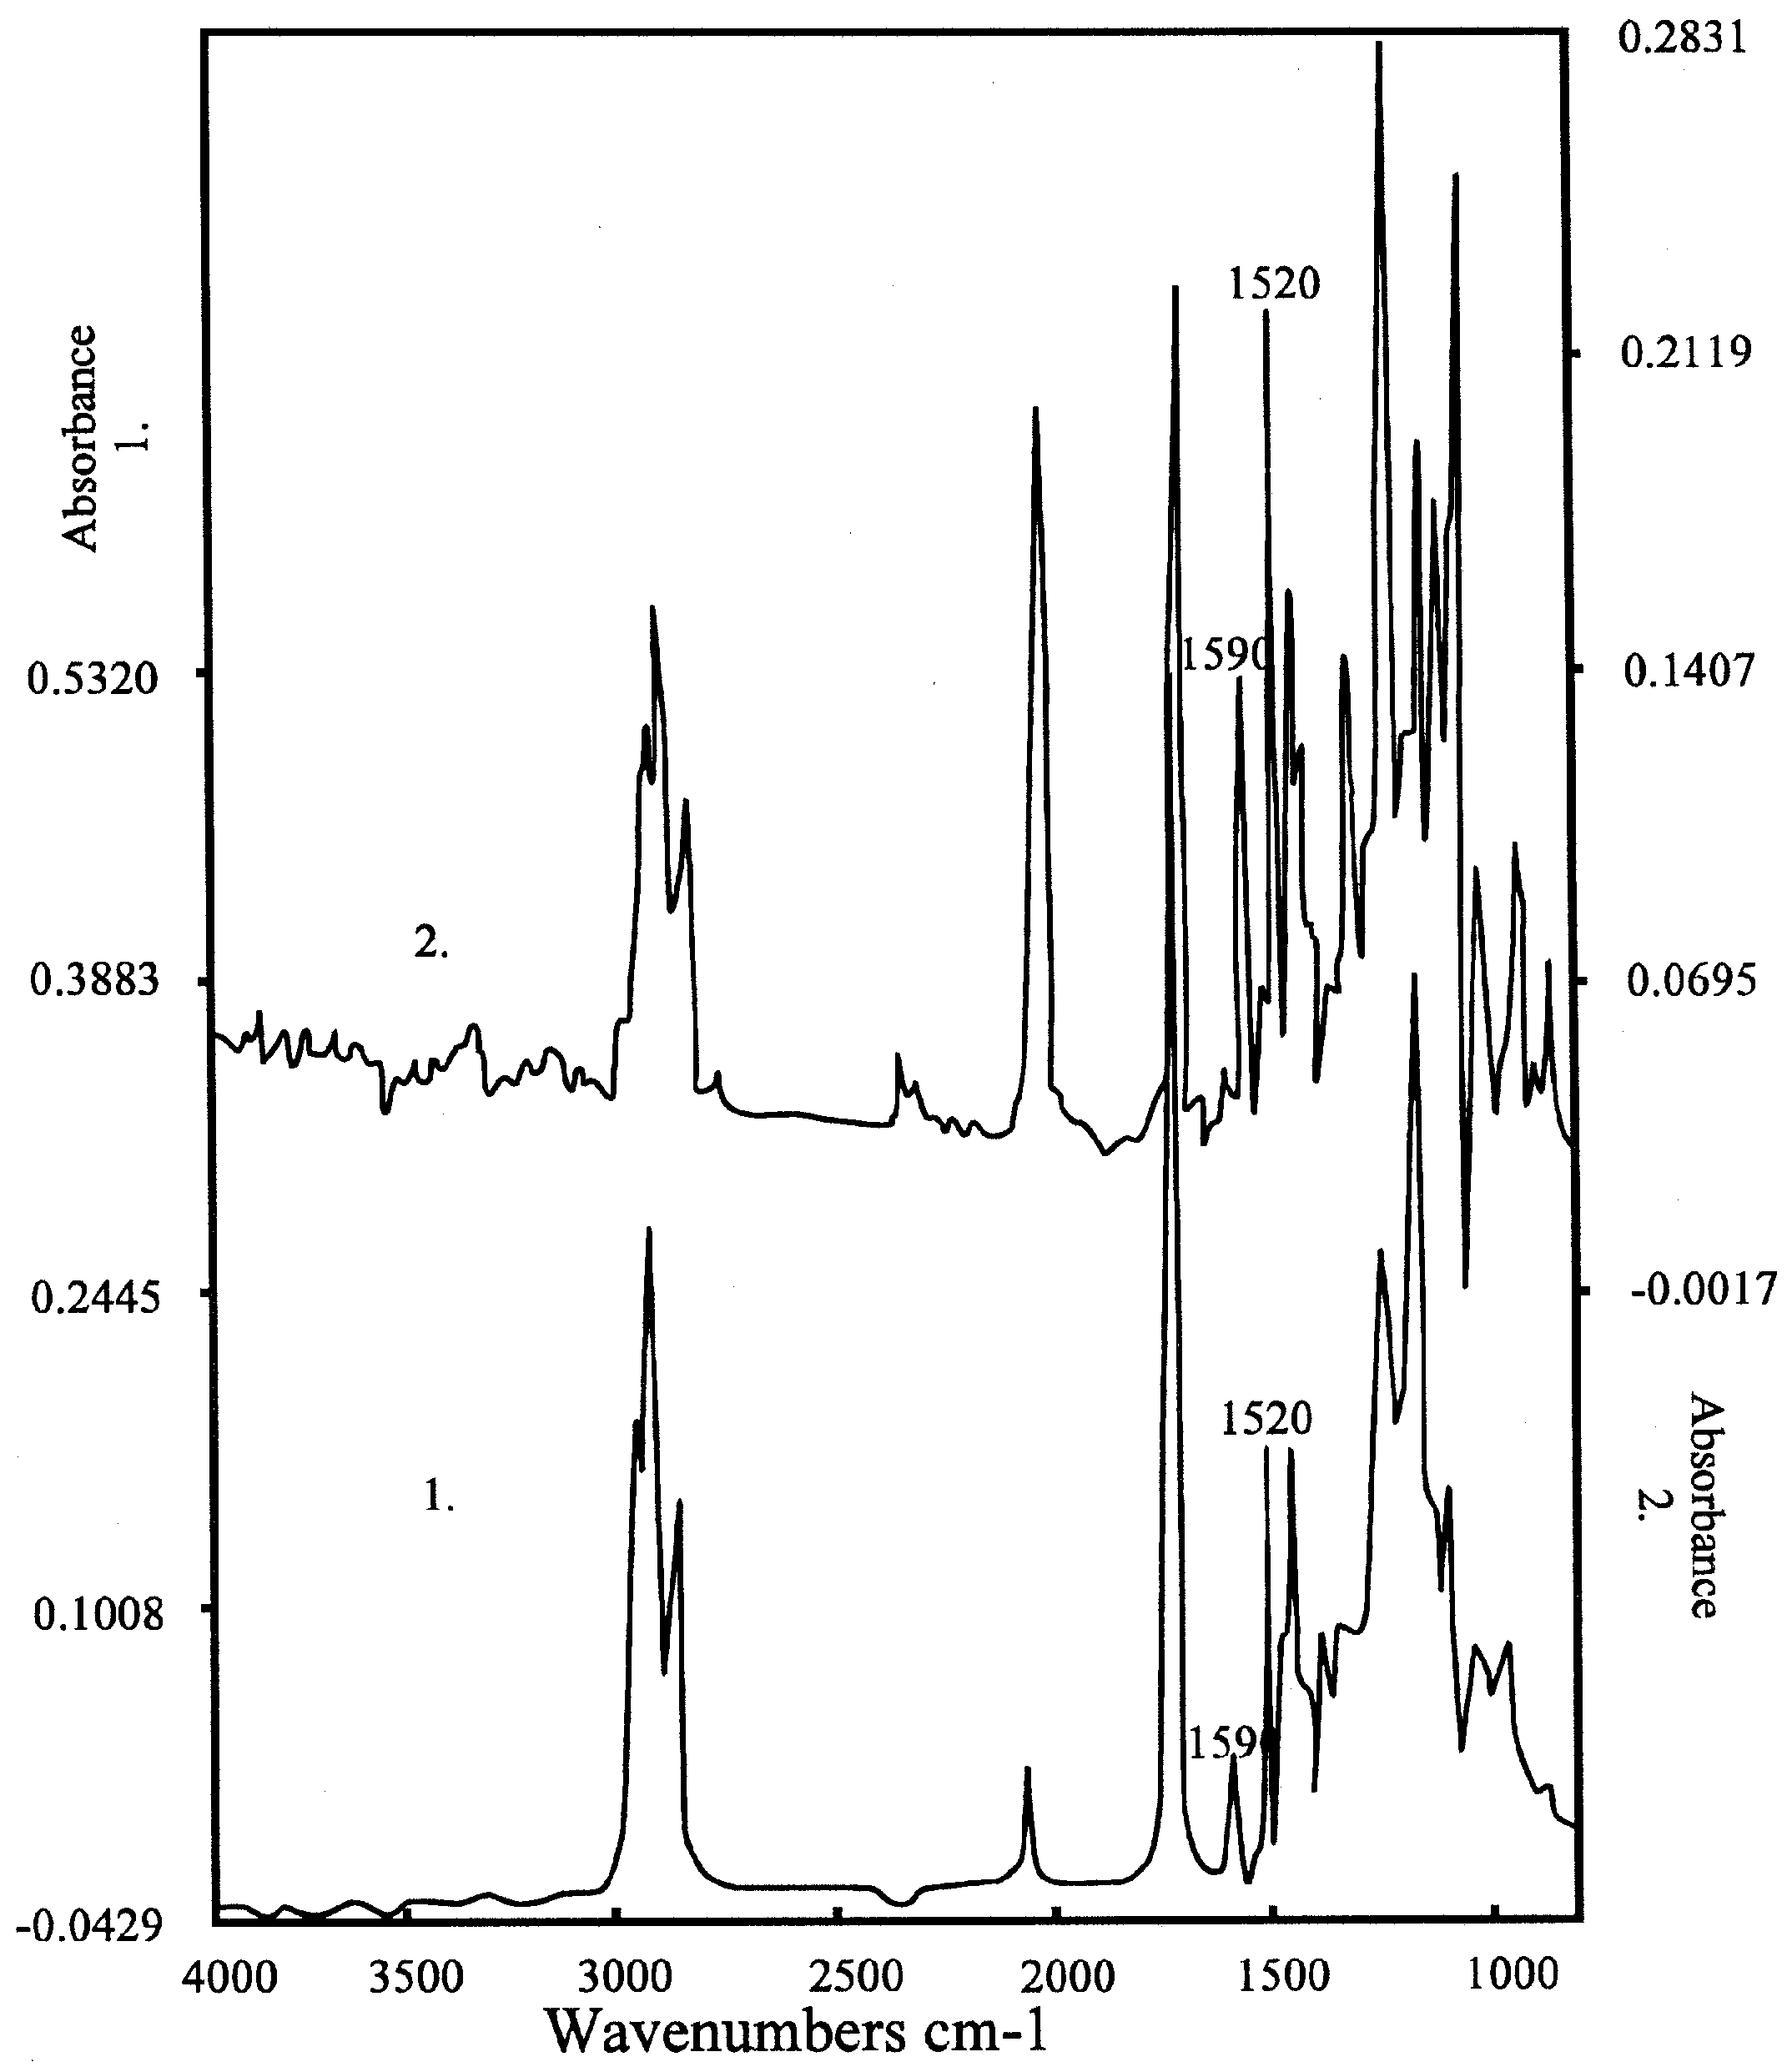
Figure 5a.
Spectrum of the K-salt of the bis-crownether, in the case of 1. KCl; 2. KSCN. Peaks of the complex are at 1590 and 1520 cm-1, the peak of SCN- at 2300 cm-1. Composition: 60 % DOS (dioctylsebacate) in PVC with 3% bis crown ether.
Figure 5a.
Spectrum of the K-salt of the bis-crownether, in the case of 1. KCl; 2. KSCN. Peaks of the complex are at 1590 and 1520 cm-1, the peak of SCN- at 2300 cm-1. Composition: 60 % DOS (dioctylsebacate) in PVC with 3% bis crown ether.
Figure 5b.
Results of experiments with a glass electrode.
Figure 5b.
Results of experiments with a glass electrode.
A further question that can be raised is whether there may occur any transport of ions through electrode membranes. Yes, there may, but only if we apply an external voltage greater that the potential of the membrane electrode. The electrode then operates as a resistance, through which the current flows. In case of transfer, there can also be a selective partner (ionophor) conducting the current through the electrode, as the experiment of Professor Simon excellently proved. If we do not produce a coulometric system, i.e., we do not apply an external voltage, the transfer cannot be established. In an ideal case we cannot measure any current across the electrodes, if the resistance of the electrode can be considered negligible compared to the input impedance of the measuring system. When we apply an electrometer for measuring the potential of electrodes, we achieve a situation where negligible polarization current flows in the system. Practically, the impendance of the measuring system should be about 10000-fold that of the impedance of the electrode.
The comparison of the two phenomena verified that the surface of the electrodes is not uniformly plain. All the above findings speak against the phenomenon of ion transfer through the electrode, and we have to reject the assumption that an ion transfer mechanism can be applied for ion-selective electrodes on the basis of the Donnan phenomenon
(12).
3. Super Nernstian Potential Response
Typical examples of unscientific misinterpretation are papers defining super-Nernstian potentials for ion-selective electrodes. A number of papers have been published with this strange claims which contradicts the rules of thermodynamics. The phenomenon misinterpreted here can be traced back to the phenomena appearing at the surface of electrodes. We approached the interpretation of this phenomenon as follows:
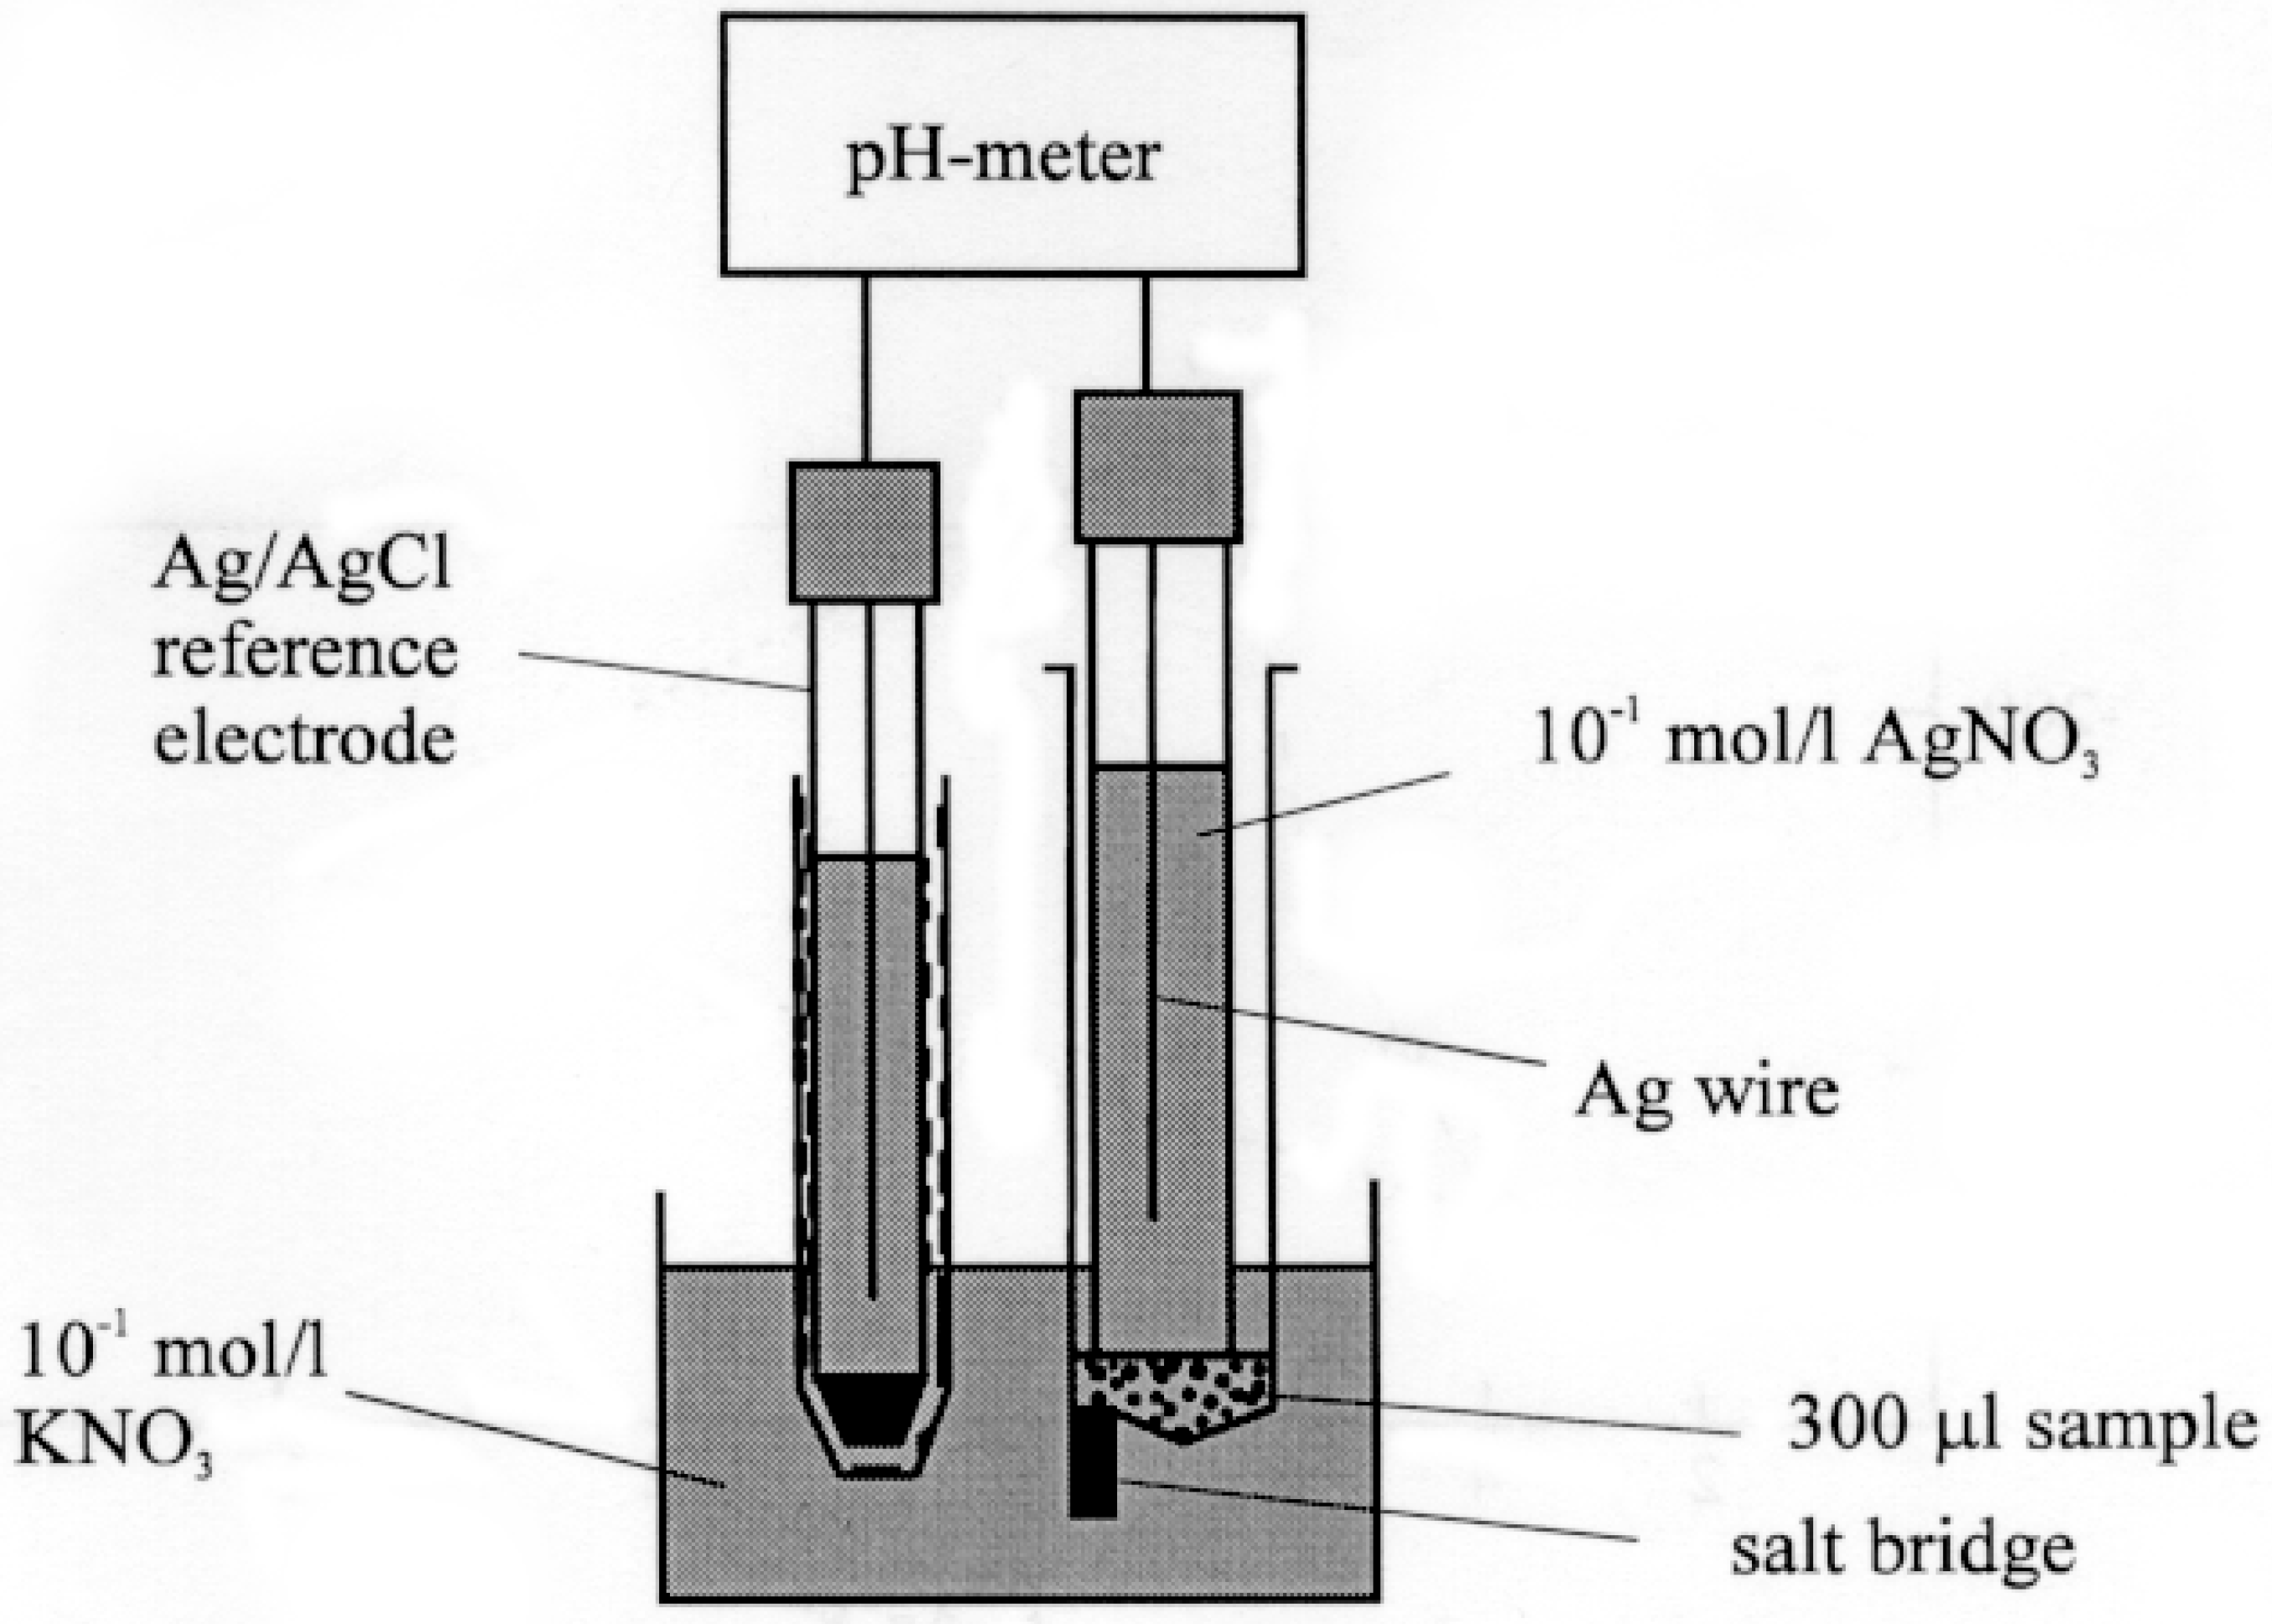
We applied a microcell (
Fig. 6a)
(13,14), in which the electrode surface to volume of solution ratio was great, and the equilibrium was set up at the electrode in a few minutes.
Figure 6a.
Arrangement for the measurement of the electrode potential.
Figure 6a.
Arrangement for the measurement of the electrode potential.
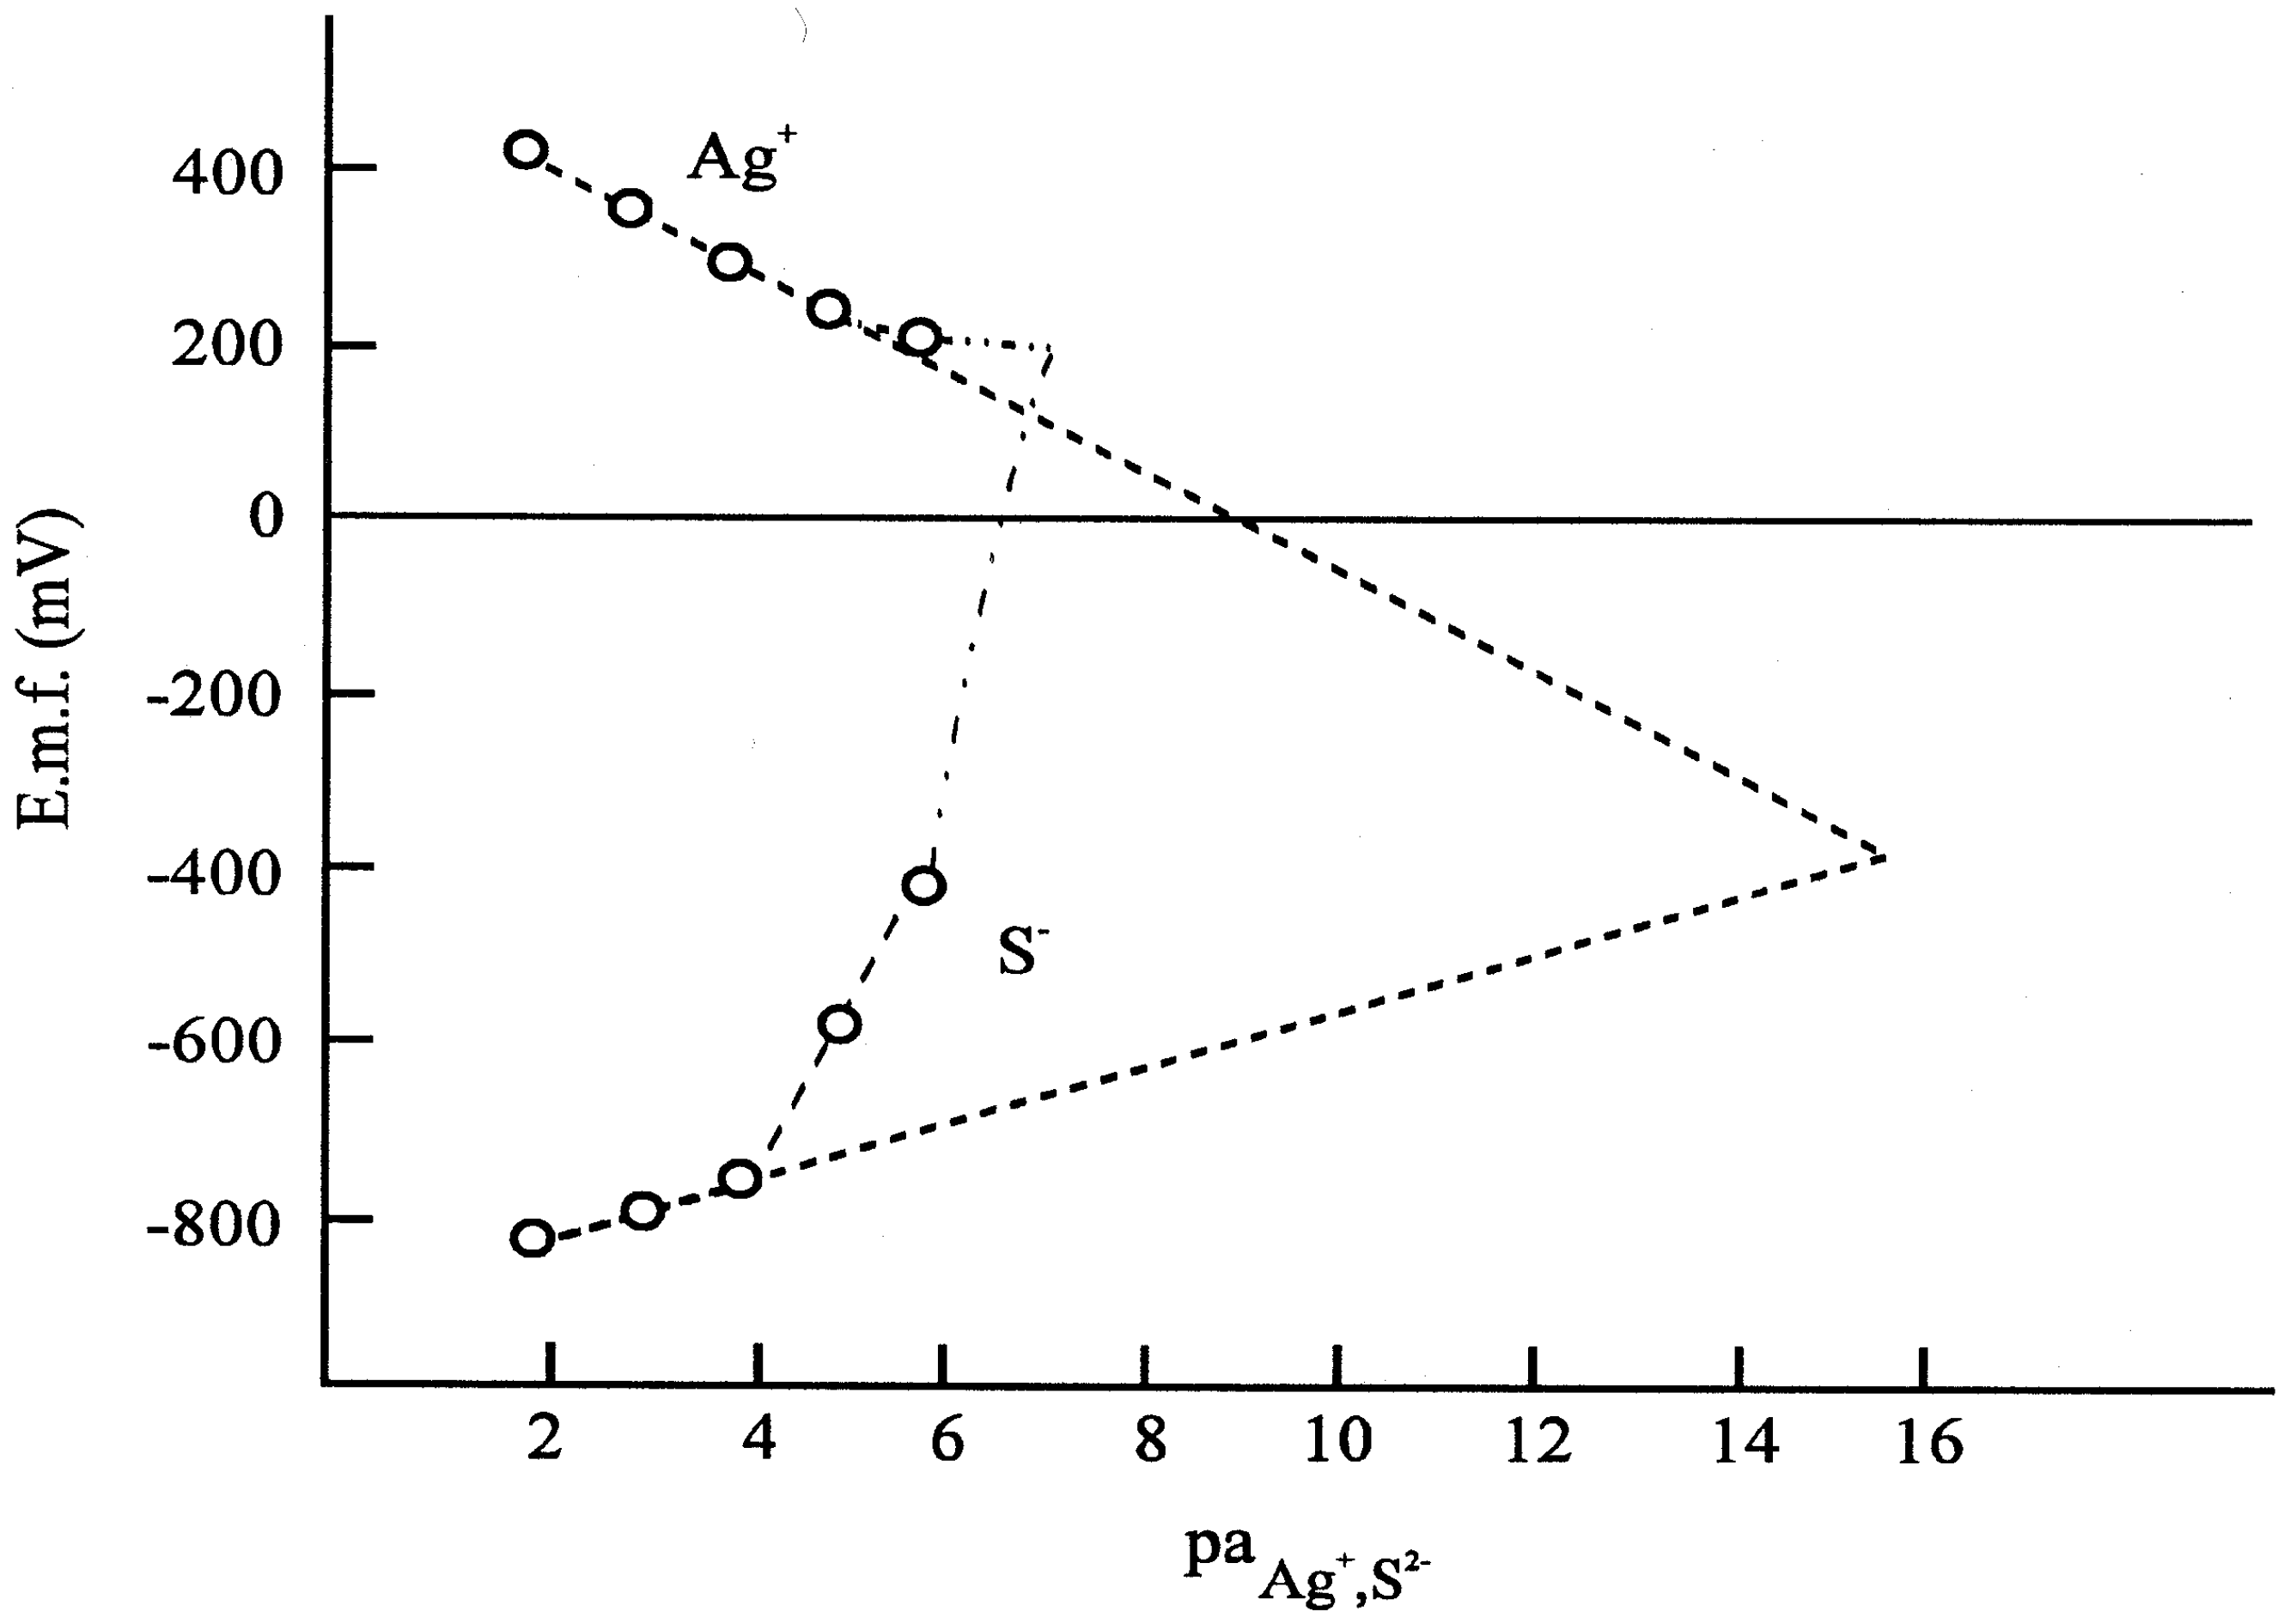
We used various sorts of electrodes in these experiments. As such (super-Nernstian) phenomenon was published in the literature for silver halides and silver sulfide, we made our experiments with silver iodide and silver sulfide-based electrodes (
Fig. 6b,
Fig. 6c).
Figure 6b.
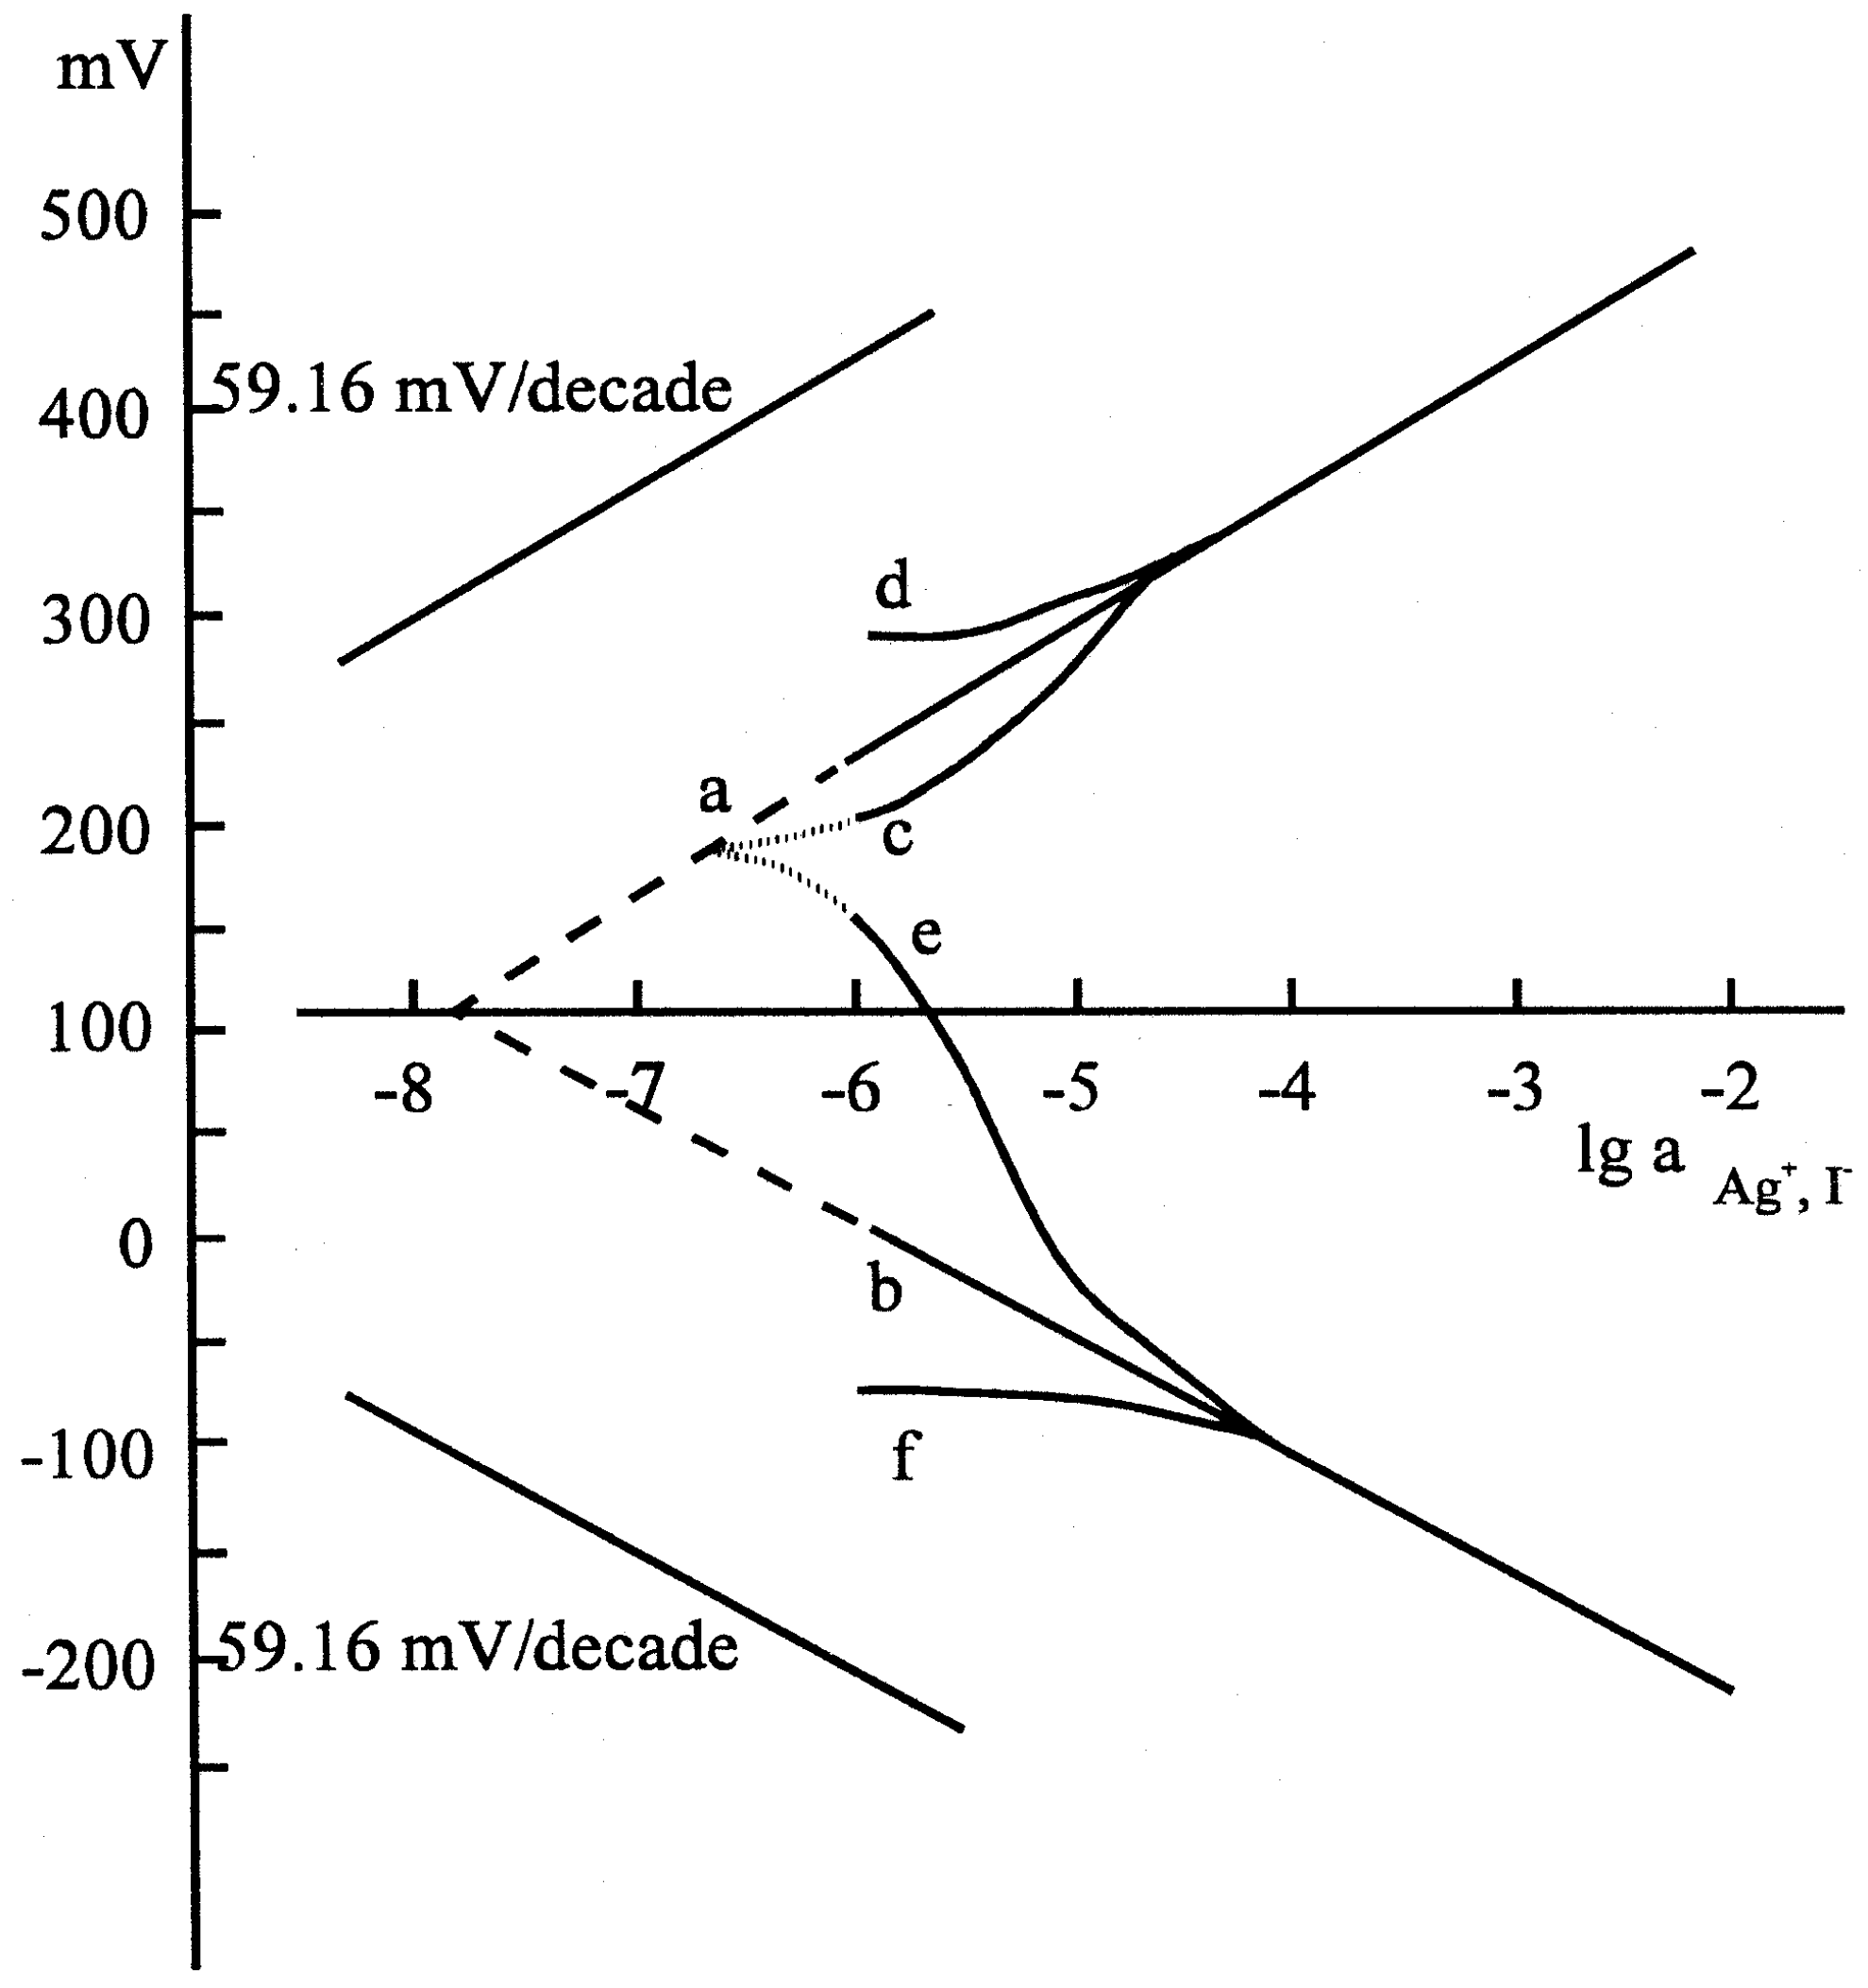
Calibration curves taken with the silver iodide ion selective electrode: (a) silver calibration curve in 50 mL solution volume; (b) iodide calibration curve in 50mL solution volume; (c) silver calibration curve taken in 300 μL solution volume, the elctrode conditioned in distilled water (d) silver calibration curve taken in 300 μL solution volume, the elctrode conditioned in 10-1 mol/L silver nitrate solution;(e) iodide calibration curve taken in 300 μL solution volume, the electrode conditioned in distilled water; (f) iodide calibration curve taken in 300 μL solution volume, the elctrode conditioned in 10-1 mol/L potassium iodide solution. Composition: 5% AgI in polysilicone rubber.
Figure 6b.
Calibration curves taken with the silver iodide ion selective electrode: (a) silver calibration curve in 50 mL solution volume; (b) iodide calibration curve in 50mL solution volume; (c) silver calibration curve taken in 300 μL solution volume, the elctrode conditioned in distilled water (d) silver calibration curve taken in 300 μL solution volume, the elctrode conditioned in 10-1 mol/L silver nitrate solution;(e) iodide calibration curve taken in 300 μL solution volume, the electrode conditioned in distilled water; (f) iodide calibration curve taken in 300 μL solution volume, the elctrode conditioned in 10-1 mol/L potassium iodide solution. Composition: 5% AgI in polysilicone rubber.
Figure 6c.
Calibration curves for silver and sulphide ions measured.
Figure 6c.
Calibration curves for silver and sulphide ions measured.
The results represented by the figures verified that the pretreatment of the electrodes, i.e. whether the electrode had been soaked in the solution of one or the other ion of the components of the membrane material, was reflected by the potential of the electrode, i.e. a sort of memory effect was measured. After the equilibrium was set up, i.e. a stable electrode potential was measured, we analyzed the solution in the microcell by means of an independent method and found that the potential data corresponded to the actual concentrations measured, assuming a Nernstian response.
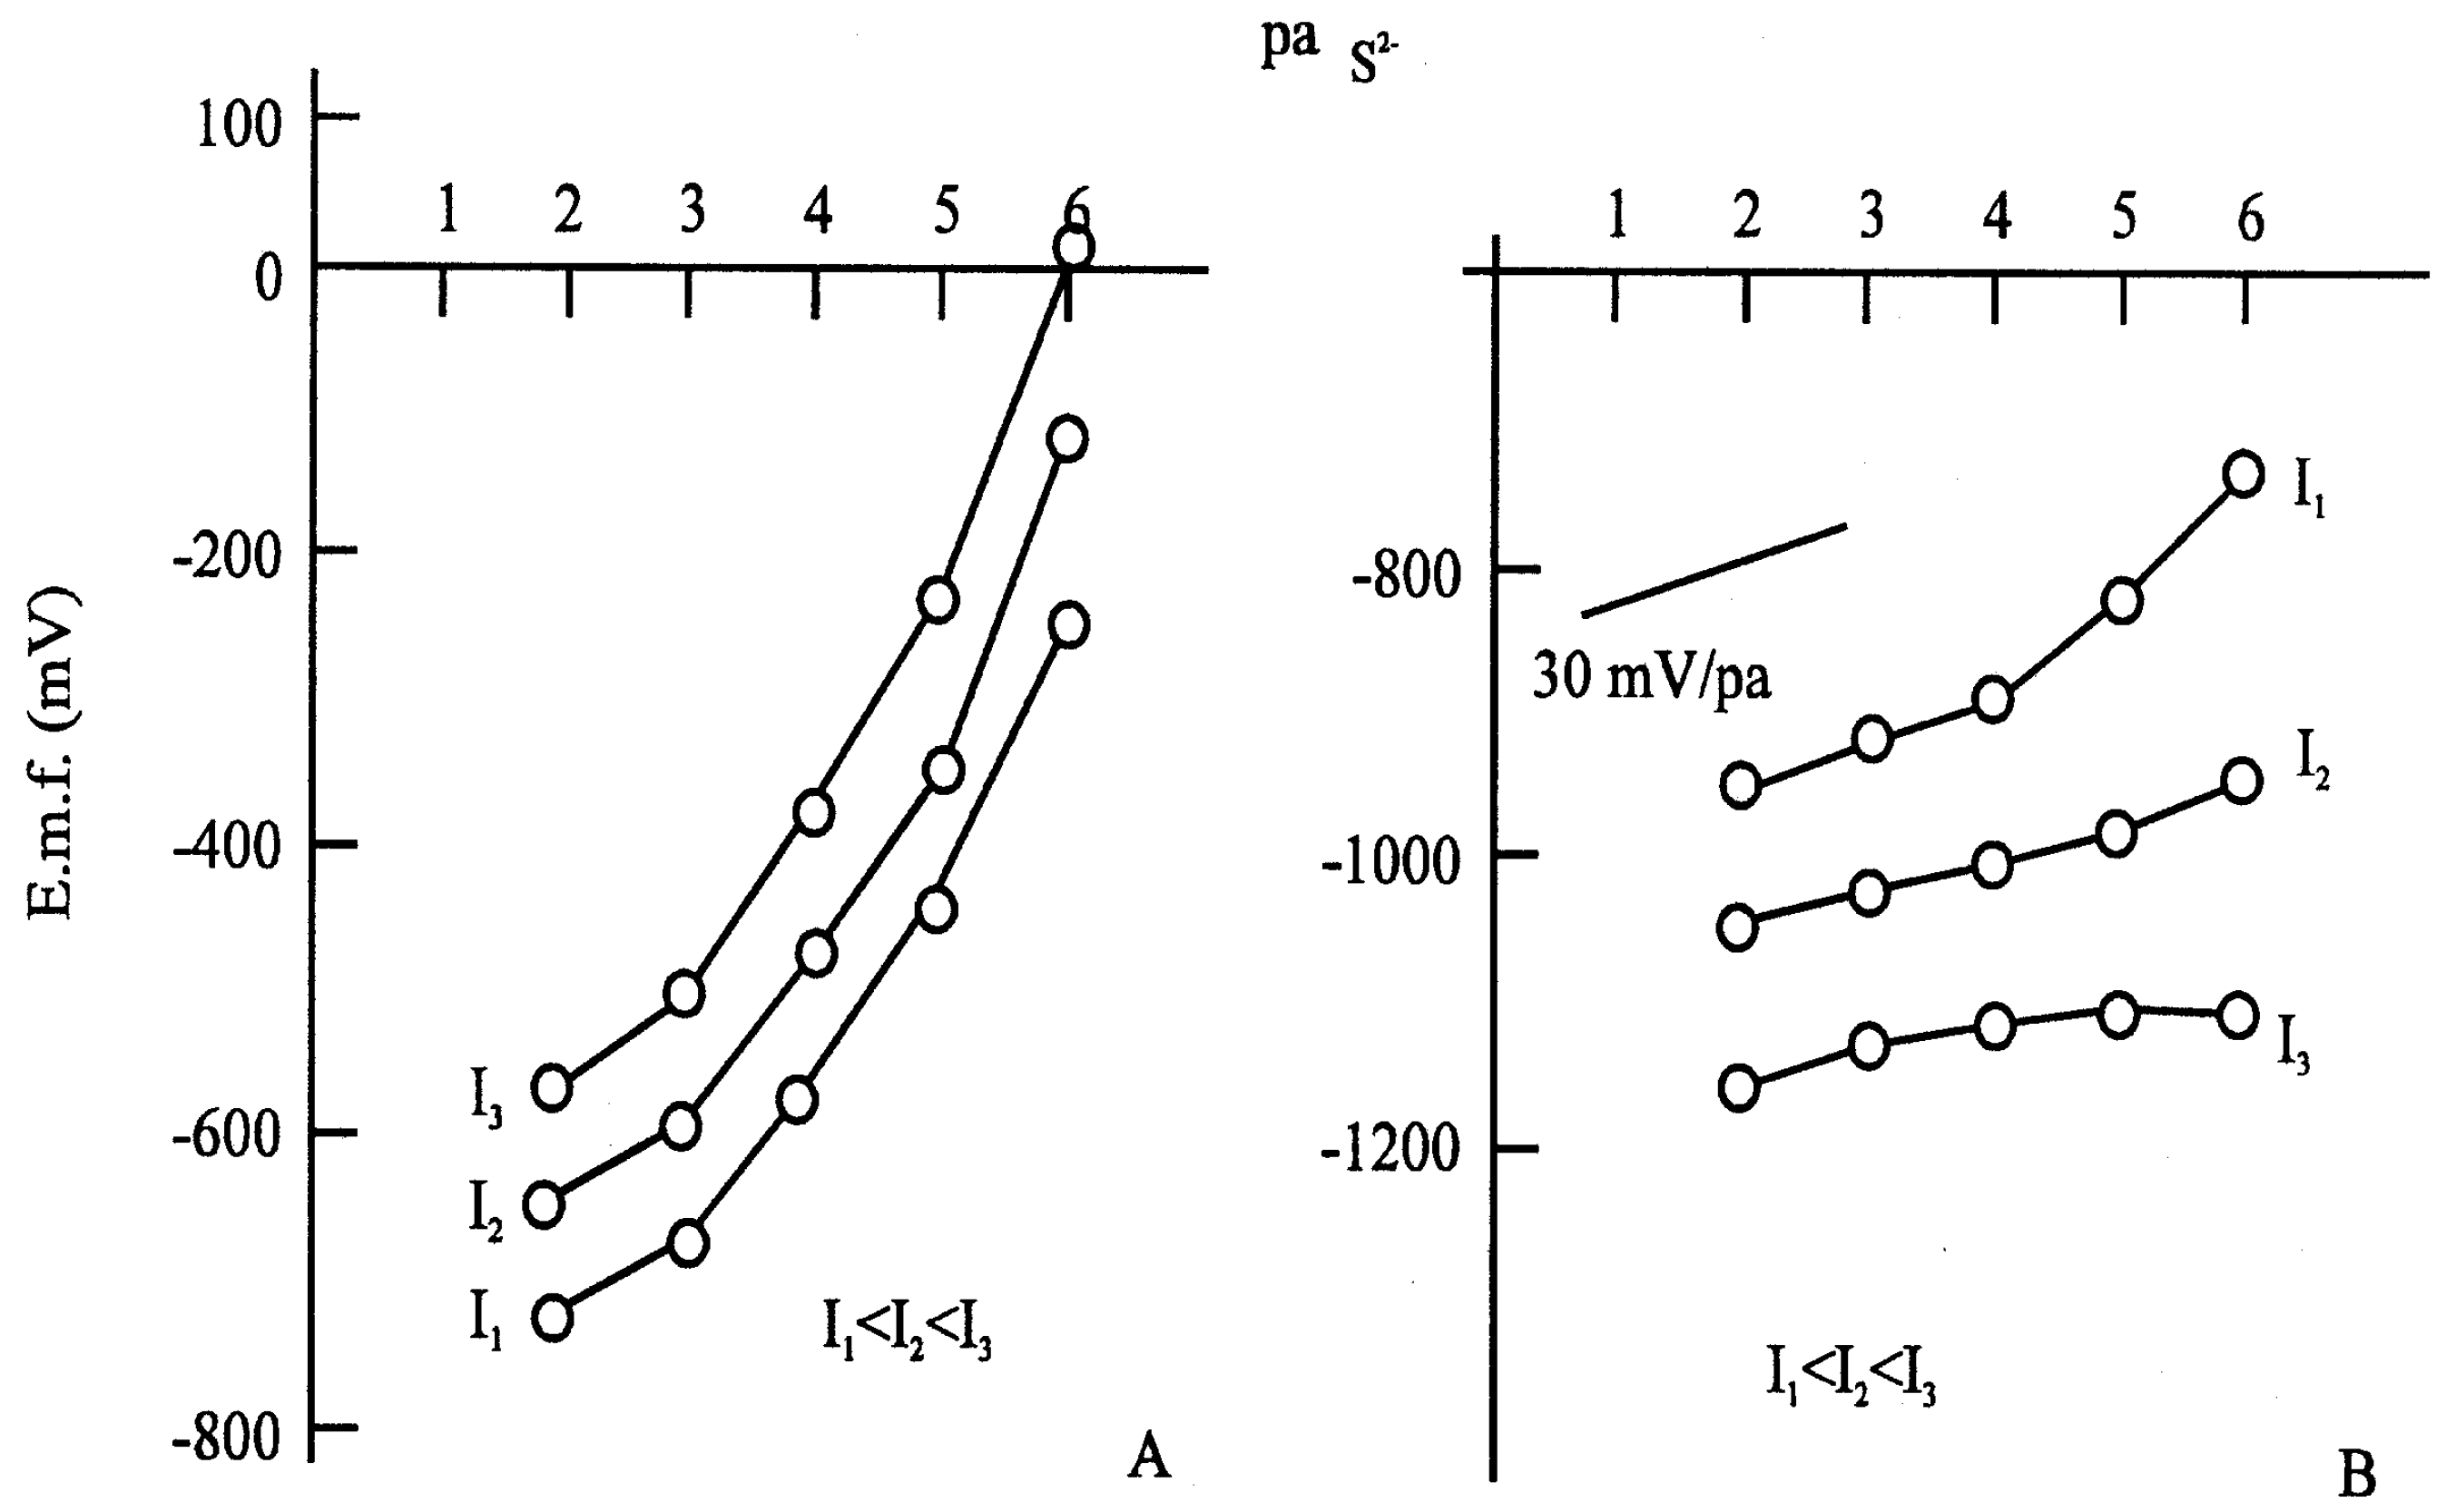
If this is true, i.e. the measurable potential depends only on the ionic composition of solution at the surface of the electrode after equilibrium, then we can influence the concentration at the surface by means of a coulometric method, by applying an external current. It can be seen in the figure that the limit of electrode response is shifted to lower concentrations (
Fig. 7).
Figure 7.
Calibration curves for sulphide: (A) with anodic current; (B) with cathodic current; Applied current: I1=5,9 μA; I2=11,8 μA; I3= 17,7 μA. Composition: Ag2S dispersed in polysilicone rubber.
Figure 7.
Calibration curves for sulphide: (A) with anodic current; (B) with cathodic current; Applied current: I1=5,9 μA; I2=11,8 μA; I3= 17,7 μA. Composition: Ag2S dispersed in polysilicone rubber.
Accordingly, the super Nernstian relation is a false interpretation of the measured data. Of course, a sub-Nernstian relation can also be obtained. In the latter case, further parallel reactions can produce this effect.
