Greater Genetic Diversity in Spatially Restricted Coral Reef Fishes Suggests Secondary Contact among Differentiated Lineages

Abstract
: The maintenance of genetic diversity is a central goal of conservation. It is the raw material for evolutionary change and if lost, can accelerate extinction of species. According to theory, total genetic diversity should be less in species with restricted ranges and in populations on the margins of distributional ranges, making such species or populations more vulnerable to environmental perturbations. Using mtDNA and nuclear Inter Simple Sequence Repeat (ISSR) data we investigated how the genetic diversity and structure of three con-generic species pairs of coral reef fishes (Pomacentridae) was related to species' range size and position of populations within these ranges. Estimates of genetic structure did not differ significantly among species, but mtDNA and nucDNA genetic diversities were up to 10 times greater in spatially restricted species compared to their widespread congeners. In two of the three species pairs, the distribution of genetic variation indicated secondary contact among differentiated lineages in the spatially restricted species. In contrast, the widespread species displayed a typical signature of population expansion suggesting recent genetic bottlenecks, possibly associated with the (re) colonization of the Great Barrier Reef. These results indicate that historical processes, involving hybridization and founder effects, possibly associated with Pleistocene sea level fluctuations, have differentially influenced the widespread and spatially restricted coral reef damselfish species studied here.1. Introduction
The maintenance of genetic diversity has long been recognized as a central goal of conservation biology [1]. High genetic diversity is desirable because it is the raw material for natural selection, and therefore, potentially underpins fitness and/or adaptive capacity (reviewed in [2]). Genetic diversity is most often measured using molecular markers that are assumed to be neutral and therefore not shaped by natural selection [3]. However, neutral molecular variation has been linked to several desirable traits including fitness, adaptive capacity (measured as heritability) and population density in wild populations [2]. A loss of genetic diversity is of conservation concern because it can lead to inbreeding [4], a process that can increase extinction risk for populations and species [5]. As environmental perturbations associated with climate change, ocean acidification and pollution continue to impact on biodiversity world-wide, there is an increasing need to understand the distribution and abundance of genetic variation of species in space and time (i.e., population genetic structure [6]).
The population genetic structure of species is determined by the interplay of genetic drift, gene flow, natural selection and mutation. Genetic diversity (H) is related to the effective population size, which at mutation—drift equilibrium can be expressed as:
The interplay between demographic processes and geographical ranges has long interested biologists [9-12]. No species is found everywhere and the geographical extent of species distributions varies by more than 12 orders of magnitude [13]. In general, a positive relationship exists between the area of a species' range and average population density [13] (but see [14]). Restricted geographical ranges may arise from physical barriers to dispersal, or because of discontinuities in suitable physical and biological environments [12,15]. Species borders, however, commonly occur in the apparent absence of such barriers suggesting that demographic attributes and/or meta-population dynamics may vary spatially between central and peripheral populations [16,17]. Generally, biological and environmental conditions are assumed to be optimal in the centre of a species' distribution and to decline towards its periphery (reviewed in [13,18]). Population density should therefore be highest in the centre of the species range and decline towards range edges, a model referred to as the abundant centre model [19,20]. Under this model, marginal populations should become smaller and more fragmented and may be subjected to meta-population dynamics [19,20].
If restricted range species and marginal populations behave according to macro-ecological theory and they are at migration—drift equilibrium, they should display lower genetic diversities compared to more geographically widespread and centrally located populations [21]. This prediction is supported in plants [22]. Nevo et al. [23] also reported lower genetic diversity in endemic vertebrate species, but did not detect any differences among restricted or widespread species. Likewise, if local population abundances follow predictions from the abundant centre model and migration rates are proportional to local population density, marginal populations will experience lower levels of migration, and hence, should display stronger genetic structure among populations [17,21]. Greater genetic structure has been reported towards species margins in some species [24,25], but not in others [26]. The empirical evidence for variation in genetic diversities across a species' range is also equivocal. Greater genetic diversities have been reported in peripheral populations of some species (e.g., [27-34] but not in others [35-39] suggesting substantial variation possibly associated with taxonomic and biogeographical factors [6]. Therefore, understanding the mechanisms responsible for geographical ranges and their population genetic consequences remains an area of considerable scientific interest [6].
Coral reef fishes provide an excellent model for testing predictions from macro-ecological theory using genetic data. They are speciose, amenable to population level sampling and genetic analyses, and the latitudinal extent of their ranges is relatively well known. Their diversity enables the design of comparative studies that aim to control for biological and environmental factors, which may affect patterns of genetic variation [40]. These factors include dietary specialization [41], ecological specificity [23,42,43], and life-history traits [44,45]. Here we examine the population genetic characteristics of coral reef fishes on the Great Barrier Reef (GBR) by means of a comparative design. Using a mtDNA sequence marker (Control region) and nuclear genetic fingerprints (ISSR), we examine the population genetic structure of three species with relatively small ranges (< 25° latitude) compared to three con-generic species with relatively larger geographical ranges (> 40° latitude), but examined at the same two reef locations (Table 1). We test predictions from range-abundance theory that species with restricted ranges will display lower genetic diversity and greater genetic structure compared to widespread species. Because of their restricted ranges the sampling locations of three species were close to the species margin compared to the widespread species. Our sampling design therefore also allowed a test of the predictions from the abundant centre model of species border evolution that genetic diversity should be reduced in peripheral compared to central populations.
2. Experimental Section
2.1. Study Species and Locations
Six species (Table 1), representing three pomacentrid genera, and two species per genus, were collected from two of three reef locations separated by 800–1200 km. The northern sampling location was Lizard Island (14°40S; 145°28E) for four species (Amphiprion and Pomacentrus spp.) and Orpheus Island (18°38S; 146°28E) was the northern sampling location for the Chromis spp. One Tree Island (23°30S; 152°05E) was the southern sampling location for all species. The sampling locations are part of the Great Barrier Reef, a continuous reef complex without apparent latitudinal habitat discontinuities or vicariant barriers. Information about geographical ranges for all species was obtained from guidebooks [46,47], Fishbase [48] and Ocean Biogeographic Information System [49]. In each congeneric species pair, one had a restricted geographical distribution (16–24 degrees of latitude); the other species was comparatively widespread (45–49 degrees of latitude) (Table 1). The southern sampling location was within 1.5° of the known distributional limit (< 5% of total range) in all three widespread species and is referred to as a southern marginal population. The northern locations sampled for the spatially restricted species were within 2.5–6.5 degrees from their range margin (16–27% of total range) and is referred to as northern semi-marginal populations (Table 1). Species pairs were also carefully selected to control, as much as possible, for biological and ecological attributes that might otherwise confound the population genetic structure of these species. As such they had similar diets (all planktivorous, but Pomacentrus wardi is also herbivorous: [47]), all species are benthic spawners with relatively short generation times of 1–4 years [48], and are similar in body size [47,50]. All species also had relatively short mean pelagic larval durations whose ranges overlapped within each congeneric pair (mean (range) in days: Amphiprion melanopus, 11 (8–14); Amphiprion akindynos, 11 (9–13); Pomacentrus moluccensis, 15 (14–21); Pomacentrus wardi, 26.1 (19–28); Chromis atripectoralis, 21.2 (18–22), Chromis nitida, 16 (10–24)) [51-53]. Further, mean pelagic duration was equal in one pair (i.e., Amphiprion), less in one widespread species (i.e., P. moluccensis), and greater in another (i.e., C. atripectoralis). To our knowledge, no data is available with which to compare other traits, such as mean population density and reproductive success, for all these species at these sampling locations. Because of the apparently conserved nature of species within these genera, we have assumed that the comparative nature of our design will render such differences unimportant. Samples were collected from fishes collected at similar backreef and lagoonal habitats at all locations using hand-held spears, fence nets, clove oil and hand-held dip-nets. Fishes were transported live, or on ice, to the nearest shore where a sample (fin clip) was preserved in 100% EtOH for genetic analysis.
2.2. Molecular Techniques
DNA was extracted using a modified Proteinase K and Phenol-Chloroform extraction [54], 335 to 398 base pairs of the mitochondrial hyper-variable control region I were amplified, sequenced in the forward and reverse directions and aligned in 39 to 46 individuals from all species following methods outlined in [55]. Sequences have been accessioned in GenBank (DQ250449 – DQ250526, DQ212240 – DQ212281, DQ212323 – DQ212410). Genetic fingerprints were also generated using Inter Simple Sequence Repeats (ISSR) following the methods outlined in Bay et al. [55]. This technique was used because microsatellite primers were not available for our study species at the time of analysis (2005). Briefly, the ISSR technique allows highly reproducible fingerprints to be rapidly obtained across distantly related taxa. Semi-arbitrary fragment profiles corresponding to a DNA sequences delimited by microsatellites with similar repeat motifs are amplified using specific but universal primers [56,57]. Here we used five fluorolabelled primers (809: (AG)8YC, 834: (AG)YT; 841: (ATG)6; 880: (GGAGA)3. Presence and absence of bands between 50 and 850 base pairs in length were scored using MegaBACE Fragment Profiler 1.2 (Amersham Biosciences), then converted into binary data matrices and concatenated. All analyses were conducted at the Genetic Analysis Facility at James Cook University.
2.3. Statistical Procedures
The best fitting substitution model and associated rate heterogeneity were estimated separately for the sequence data of each species using PAUP* 4.0b10 [58] and Modeltest 3.5 [59] and these, where possible, were implemented in all subsequent analyses (Electronic Supplementary Information [ESI] Table 1). Genetic diversity estimates for haplotype and nucleotide diversity [60,61] and their error were calculated using Arlequin 2.000 [62]. Estimates of genetic structure were calculated as pairwise ΦST values following the methods implemented in Arlequin and significance levels were corrected for multiple comparisons following the Dunn-Sidak method [63]. Transition-transversion ratios indicated that saturation could be present in some species (ESI Table 1), and therefore, all analyses were repeated using transversions only. The distribution of genetic variation within species was compared among species using haplotype networks and the frequency distribution of pairwise differences among individuals pooled from the two sampling locations. The effect of pooling was explored by analyzing sampling locations separately and was not found to affect the results. Mismatch analyses were implemented in Arlequin and DnaSP [64] using 1000 bootstrap replicates. We computed the distribution of pairwise nucleotide differences to that expected under population models of constant and sudden expansion under the assumption of panmixia. The best fitting model was determined using log-likelihood ratio tests. The sums of square deviations (SSD) from the observed mismatch distributions were calculated for each of the models and log-likelihoods calculated [65]. The statistical significance of log-likelihood ratios was adjusted using the Dunn-Sidak FDR method as above and when significant, the expansion model was accepted.
Due to the large number of fragments amplified by the five ISSR primers, only bands with a minimum proportion of 0.25 among samples within any particular species were analyzed. This resulted in the analysis of 132-232 fragments per species (mean ± SE = 162 ± 17). Mendelian segregation of fragments with a single dominant (amplified) and recessive (absent) allele at each banding position was assumed. Because dominant data do not allow within-individual heterozygosity to be estimated, Hardy-Weinberg equilibrium was assumed in the analysis of these data. Given the large population sizes and the potential for considerable pelagic larval dispersal, this assumption was deemed reasonable in this case. Analogues of codominant genetic diversity measures including within-population diversity He (here Hj), total heterozygosity Ht and mean heterozygosity across populations Hs (here Hw) were calculated following the methods of Lynch and Milligan [66] using AFLP-Surv 1 [67]. Genetic structure (ΦPT) was estimated using Genalex 5 [68] and significance levels were corrected for multiple comparisons [63]. Statistically significant differences between genetic divergence and diversity estimates between spatially restricted and widespread species were evaluated using Mann-Whitney U tests. Estimates of genetic diversity between sampling locations within species were considered different if their 95% confidence intervals did not overlap.
3. Results
3.1. Patterns of Genetic Structure among Spatially Restricted and Widespread Species
Estimates of genetic differentiation based on mtDNA were generally low (Φst: −0.005−0.01) and statistically insignificant in all species following FDR correction when based on transitions and transversions, or on transversions alone (Table 2; p = 0.04−0.93). In contrast, estimates of genetic differentiation were greater when based on nuclear ISSR data (Φrt: 0.018−0.188) and indicated significant genetic structuring between northern and southern GBR locations in all species except P. moluccensis (Table 2; p = 0.02−0.001). Patterns of gene flow were marginally lower in the spatially restricted species compared to widespread species when based on transversions of the mtDNA data (U3, 3 = −1.964, P = 0.05) but not when including transitions (Z3, 3 = −0.655, P = 0.513) or when based on ISSR data (Z3, 3 = −0.655, P = 0.513).
3.2. Patterns of Genetic Diversity of Spatially Restricted and Widespread Species
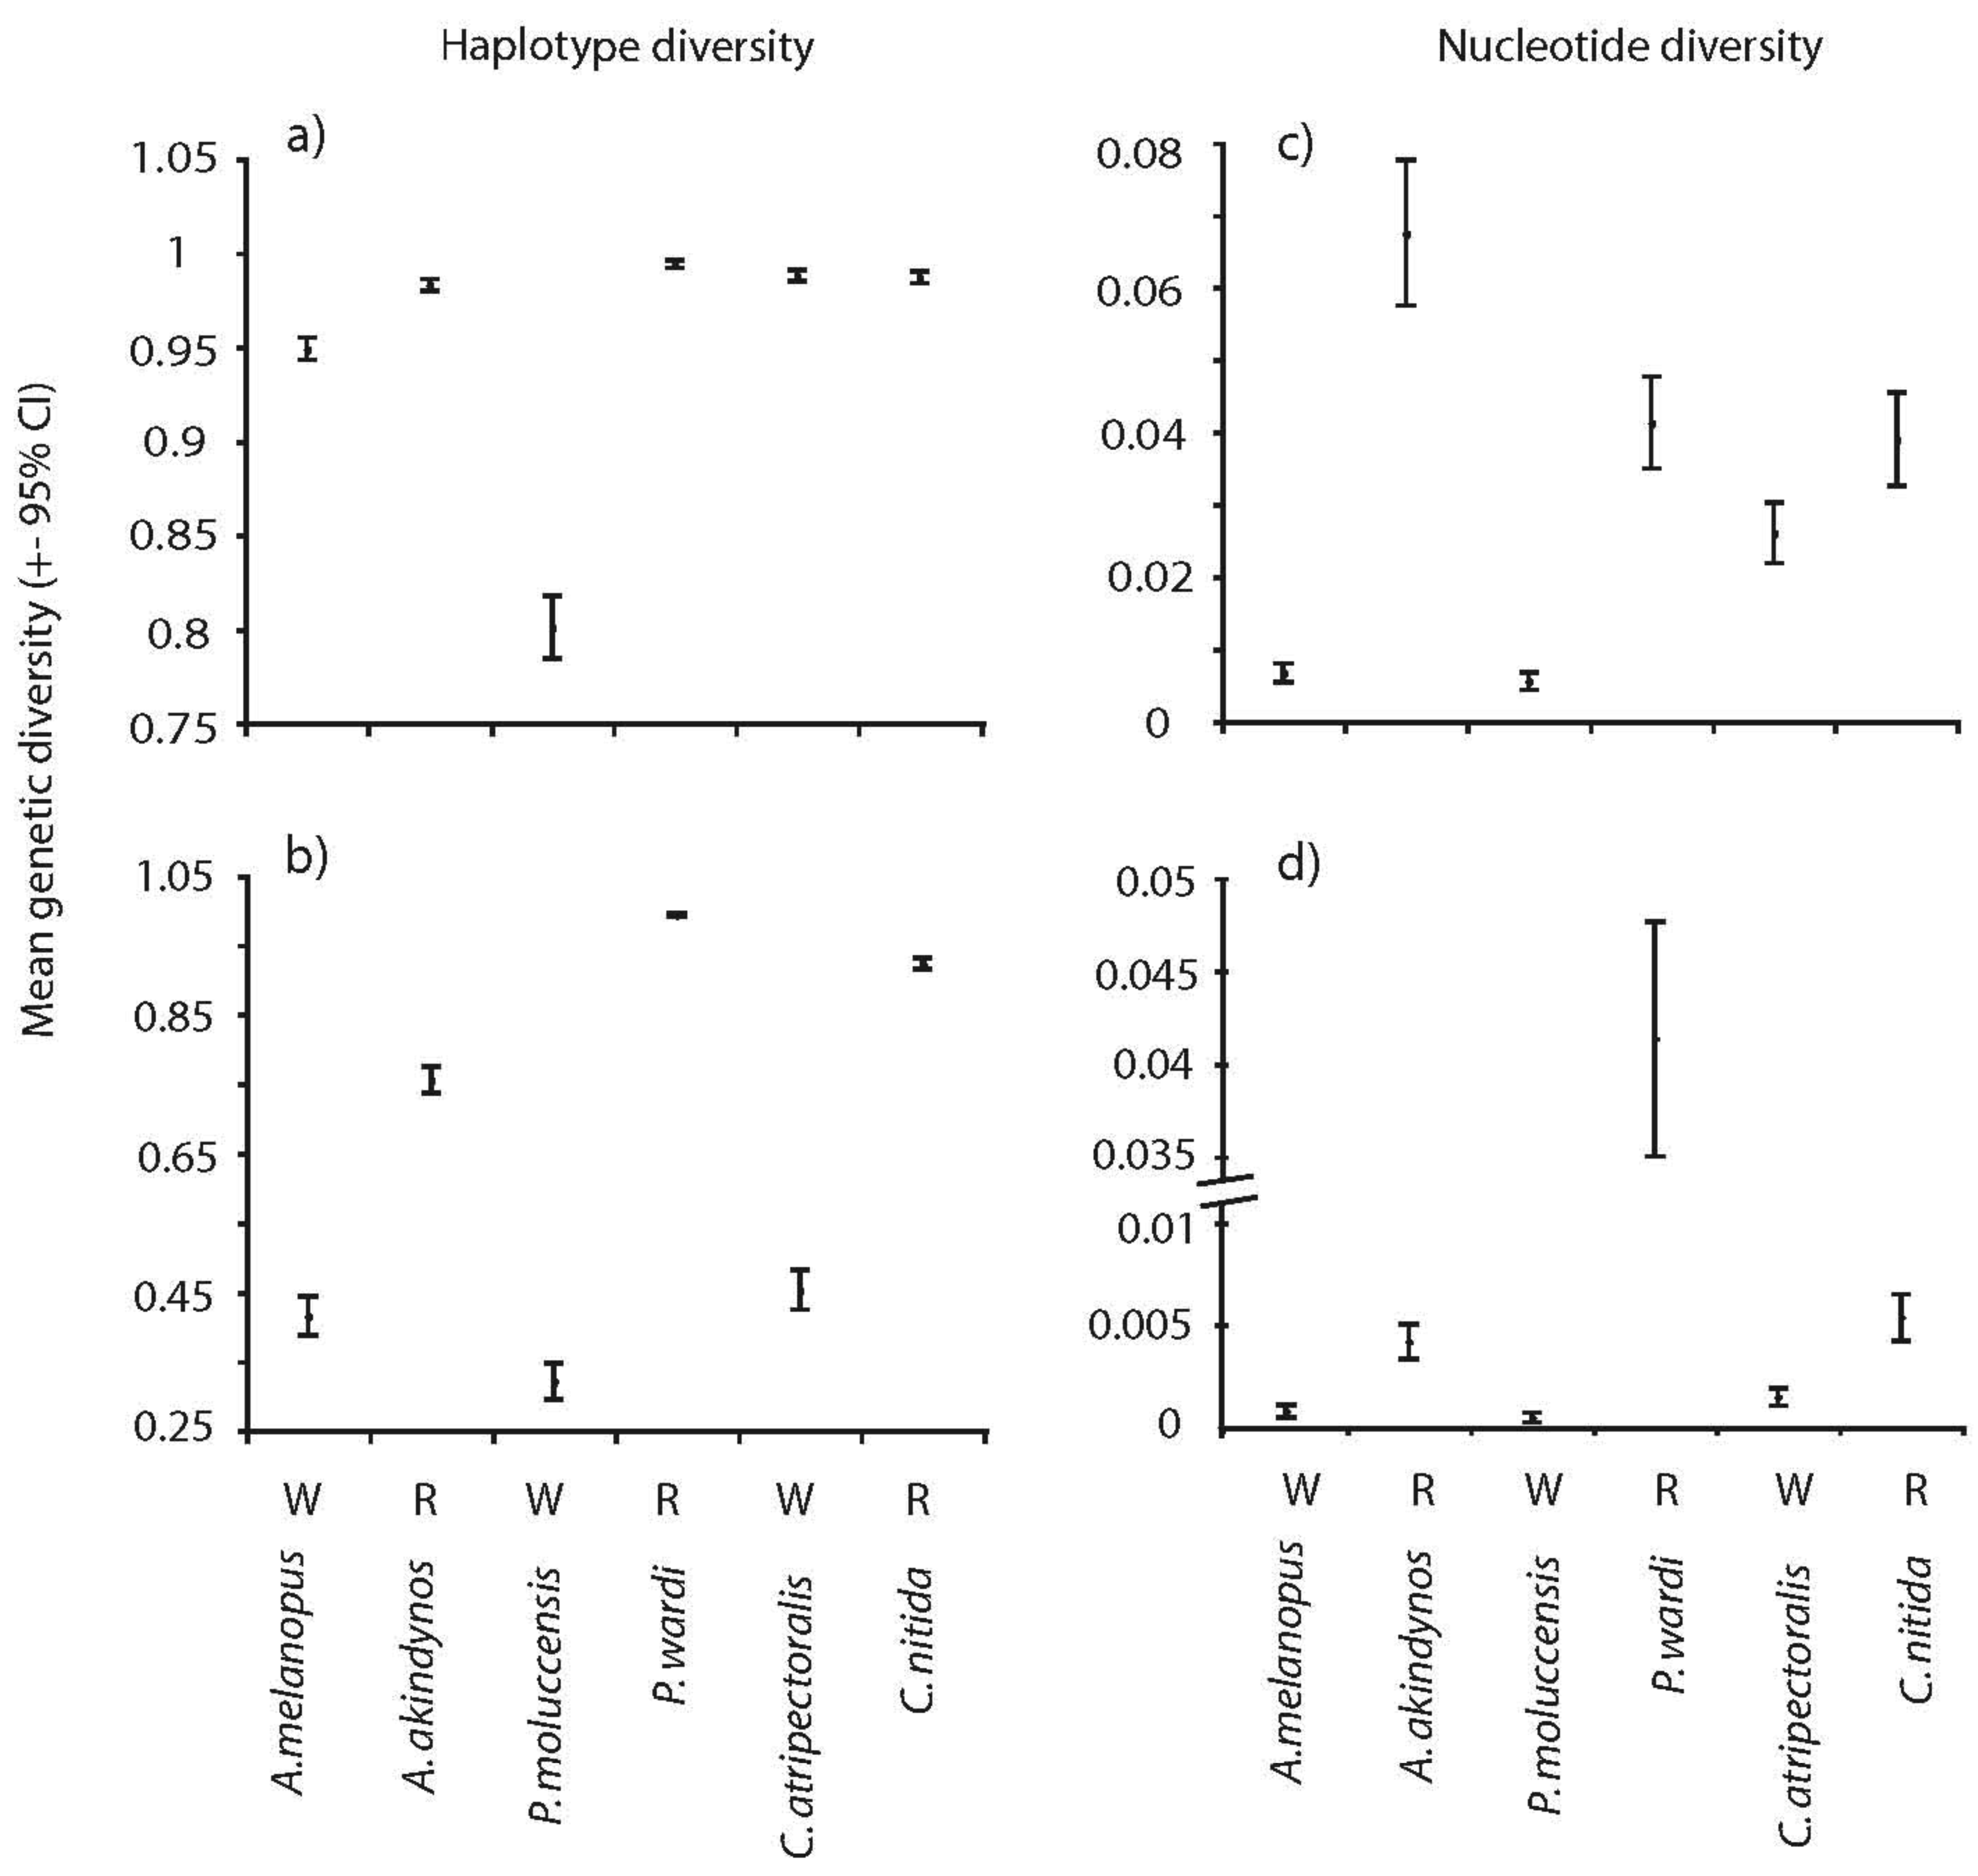
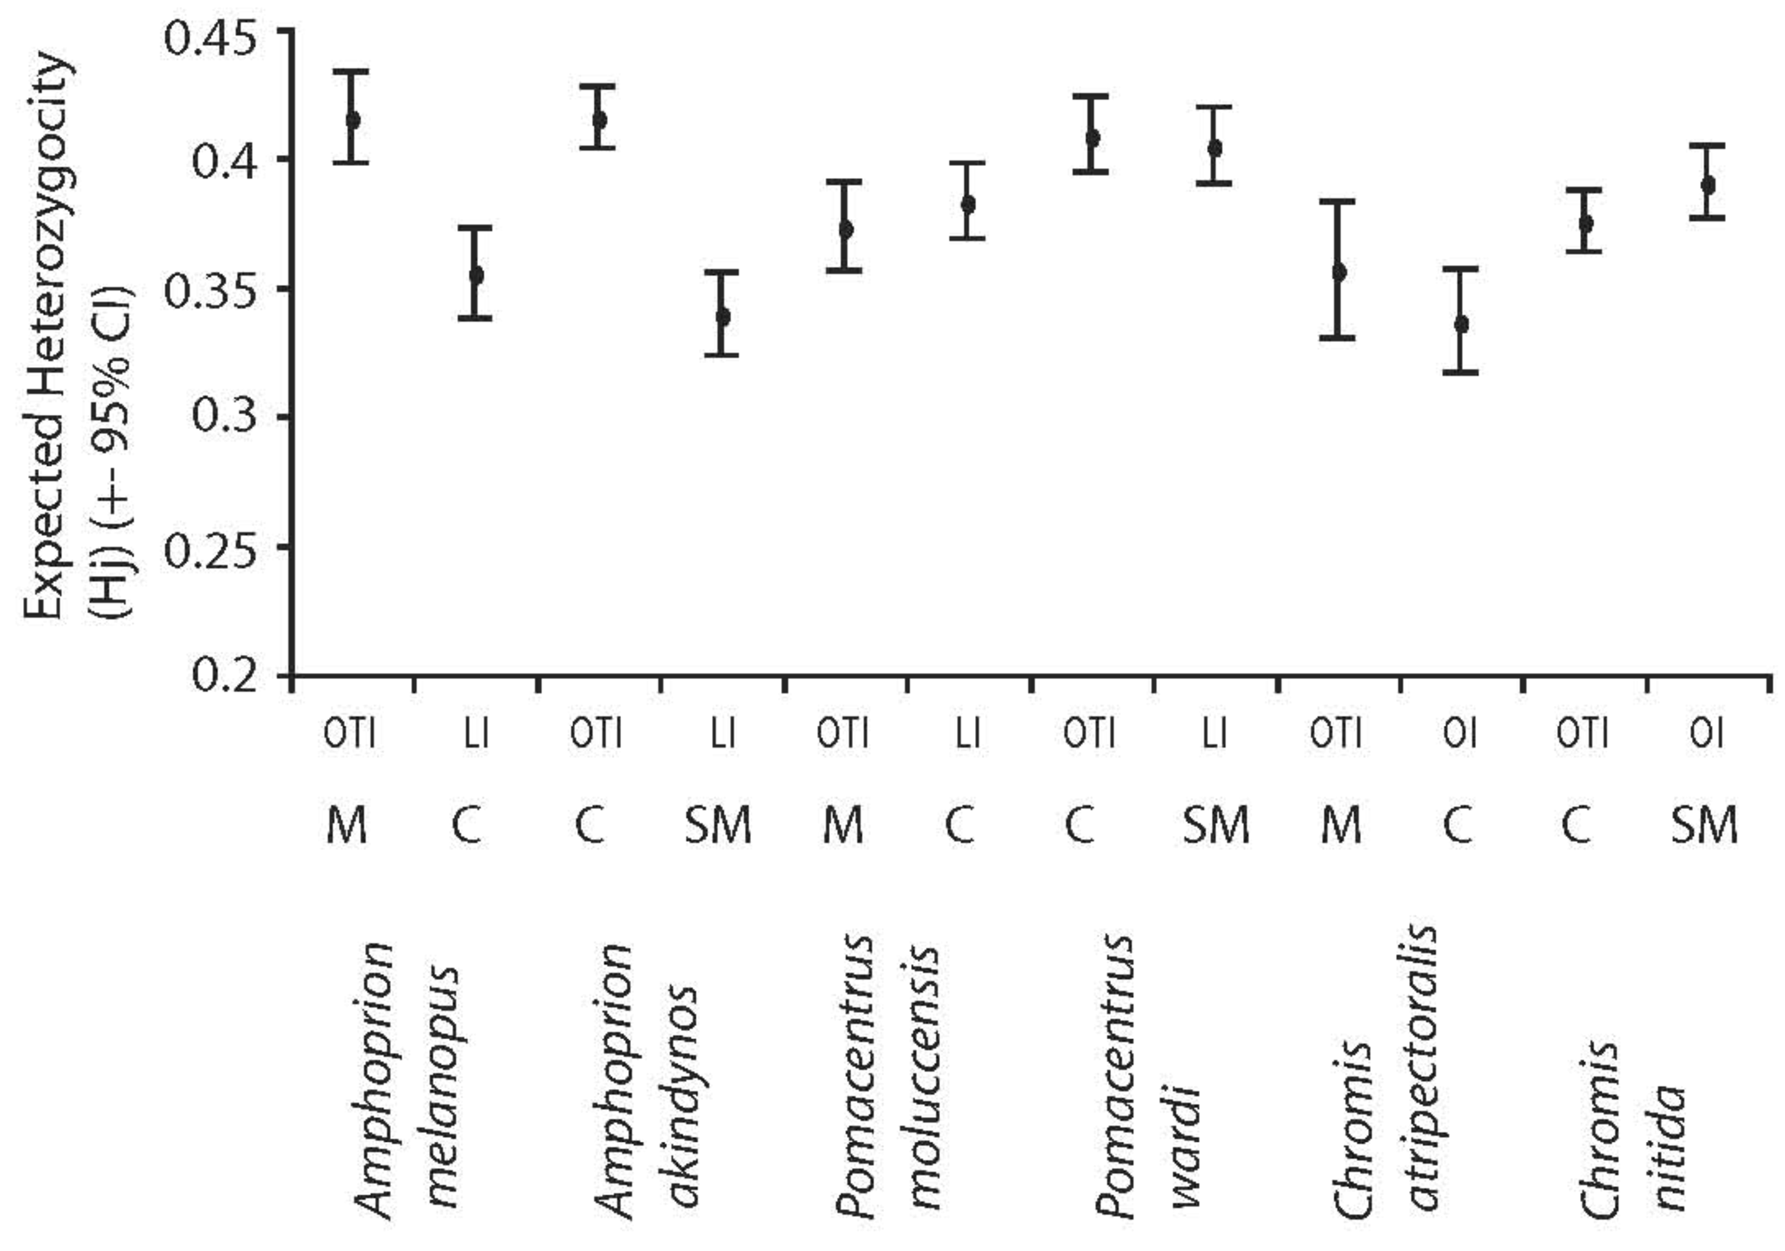
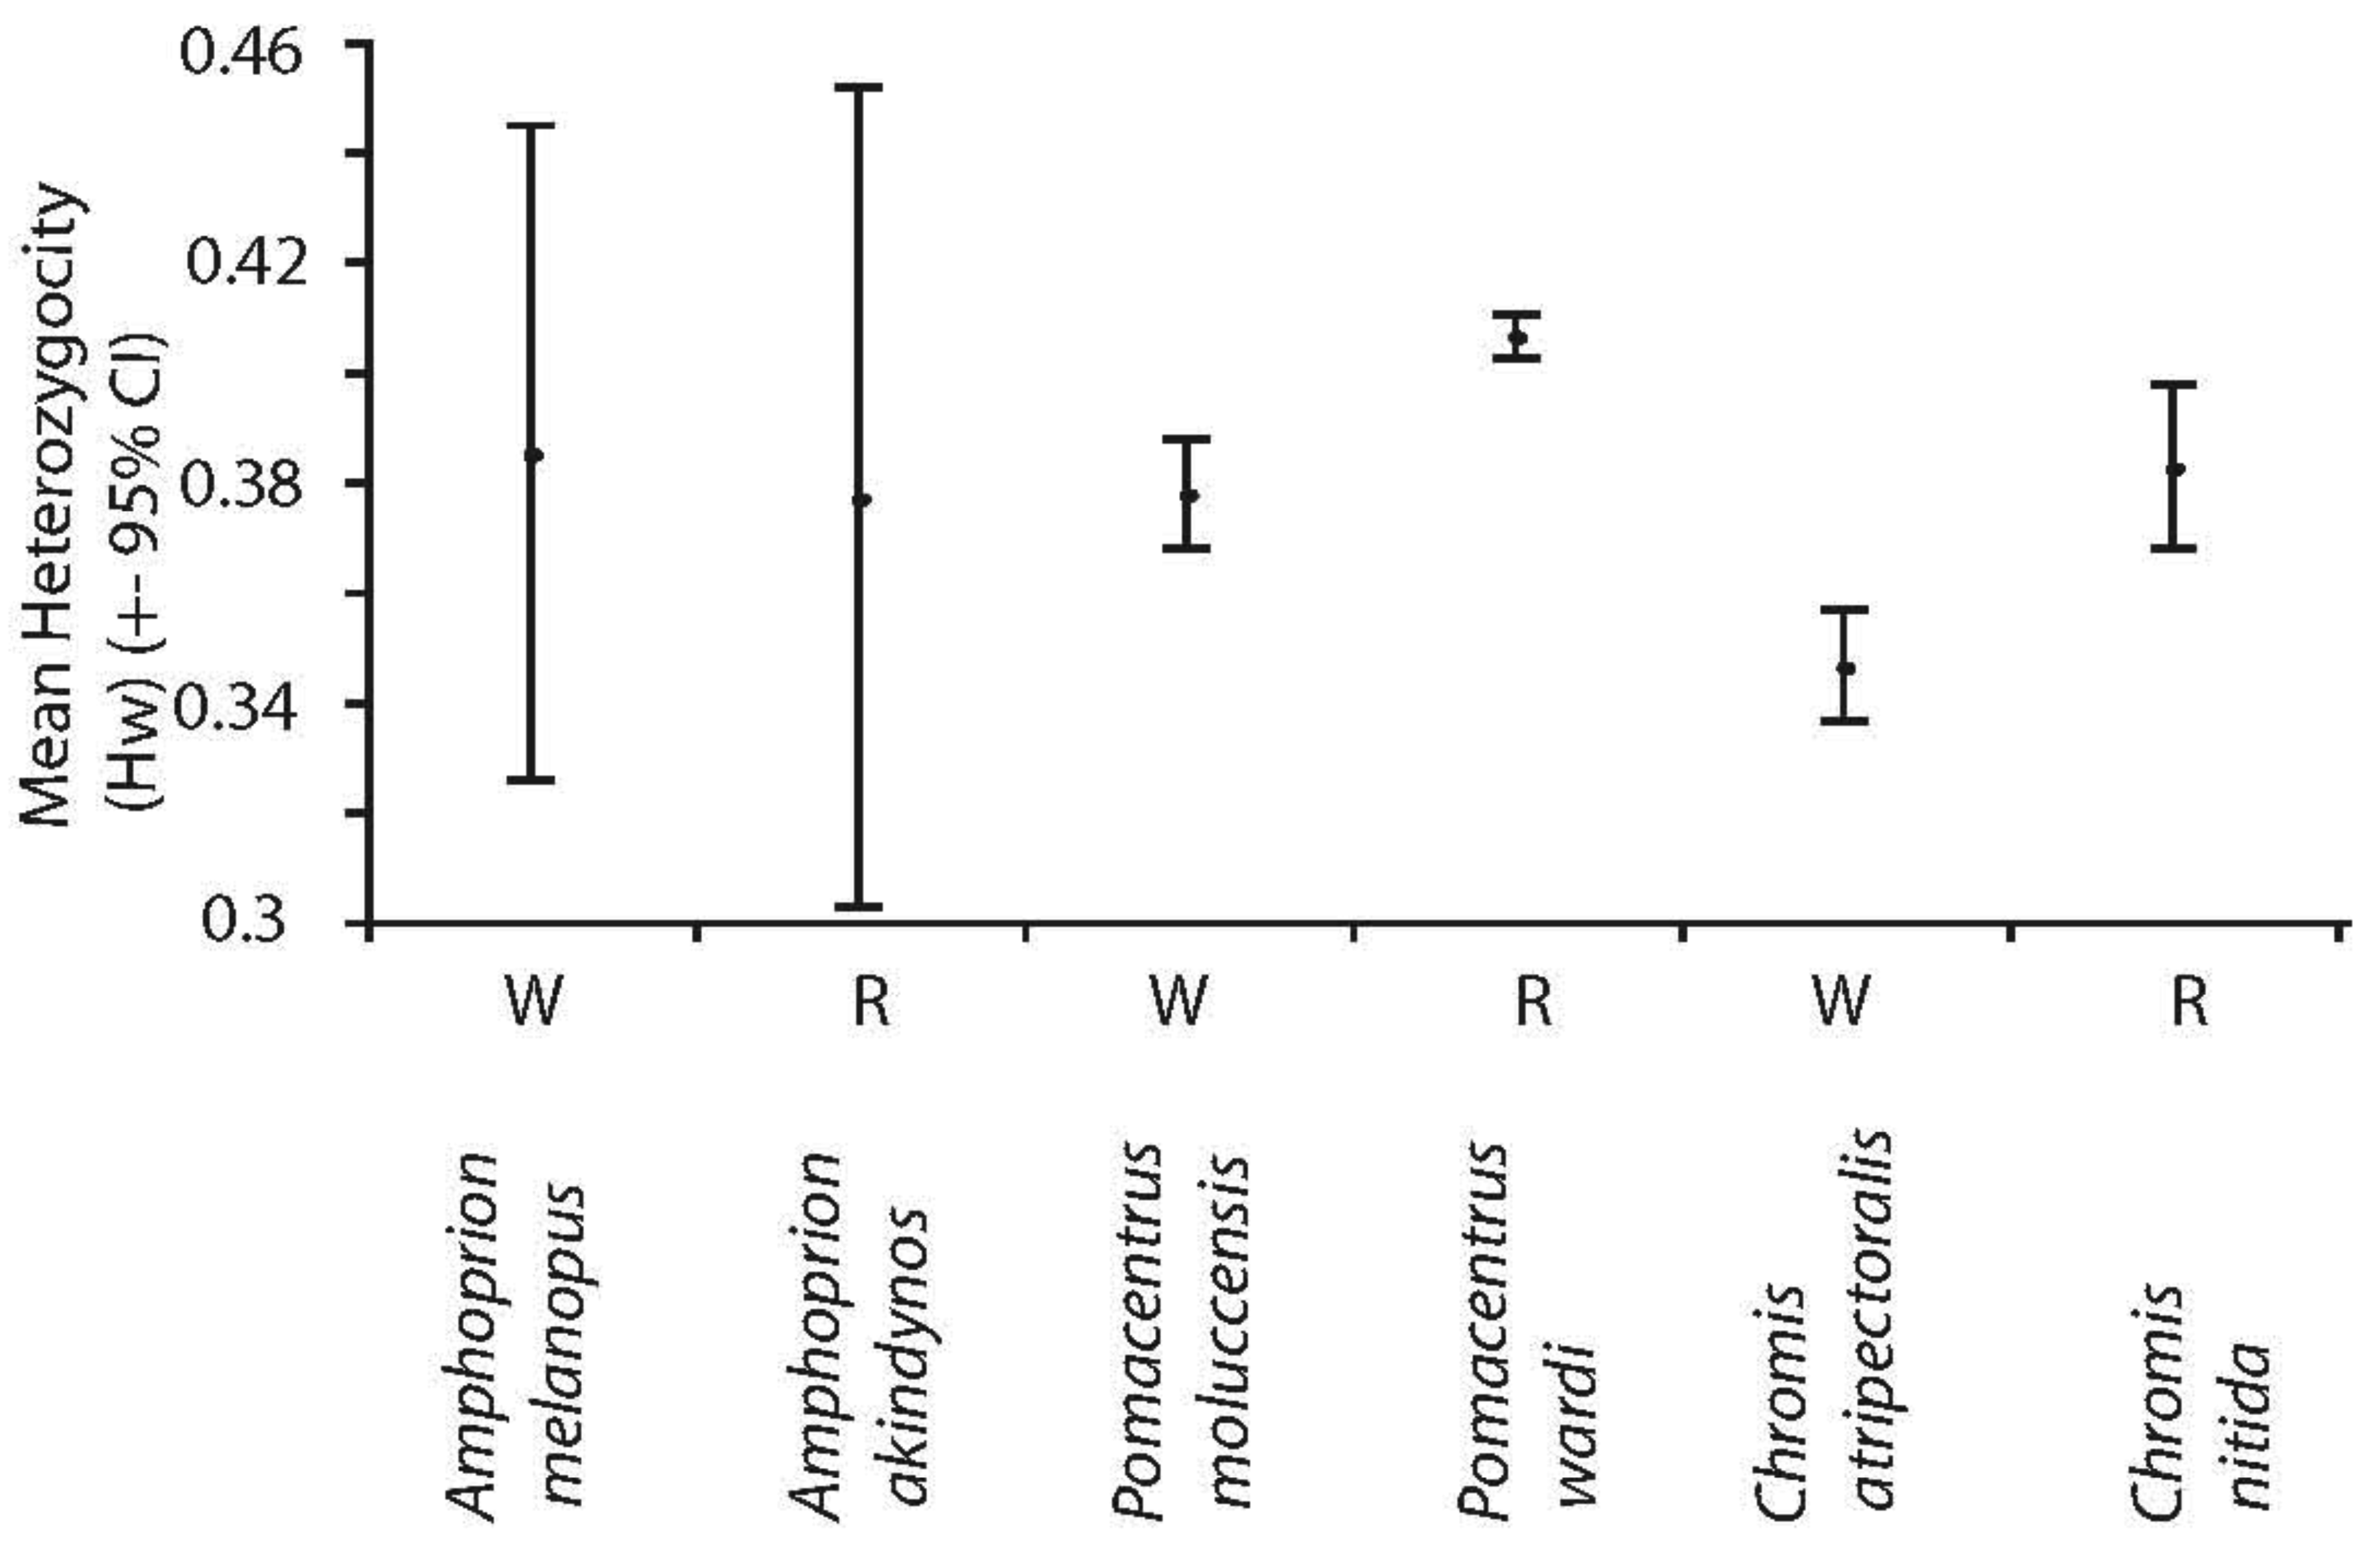
Significant differences were observed in overall genetic diversity (haplotype h, nucleotide, π and mean heterozygosity, Hw) among species (Figures 1 and 2). Haplotype and nucleotide diversities were significantly greater in the spatially restricted species compared to their widespread congeners when based on transitions and transversions (Figure 1a and c) and this pattern was particularly evident when based on transversions only (Figure 1b and d). Likewise, levels of heterozygosity (Hw) were significantly greater in the spatially restricted species compared to the widespread congeners in two genera (Figure 2). Intraspecific variation in Hj of two species was large (A. akindynos and A. melanopus Figure 2). Nucleotide diversities were greater in spatially restricted compared to widespread species (both ts-tv and tv: U3, 3 = 1.964, p = 0.05 tv: U3, 3 = 1.964, p = 0.05), as was haplotype diversity when based on transversions only (U3, 3 = 1.964 p = 0.05). Haplotype diversity (ts-tv) and expected heterozygosities were not different between species groups (U3, 3 = 1.091, p = 0.28; U3, 3 = 0.655, p = 0.51).
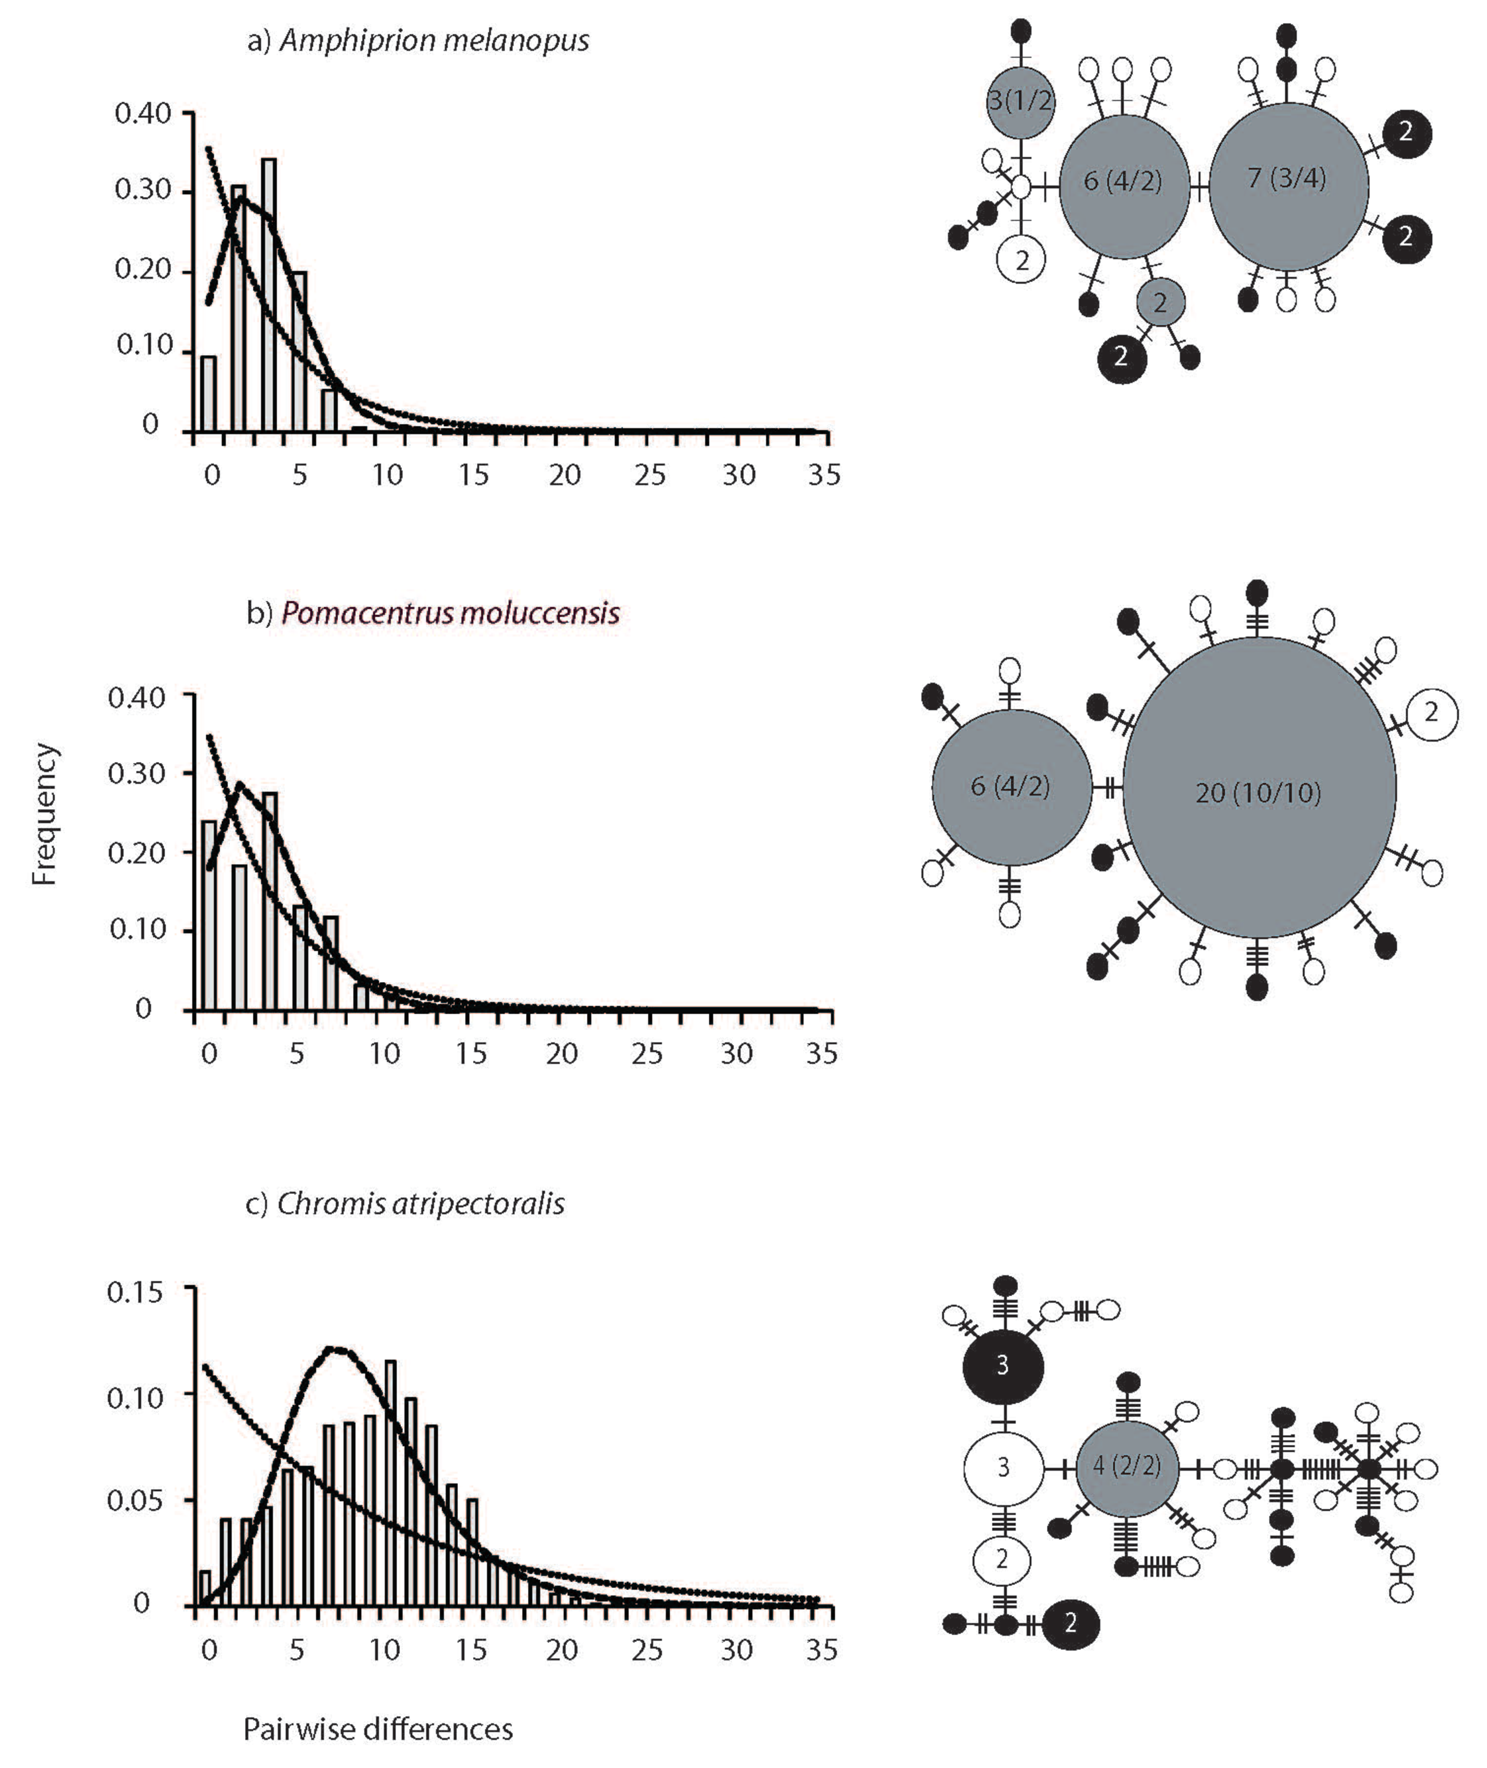
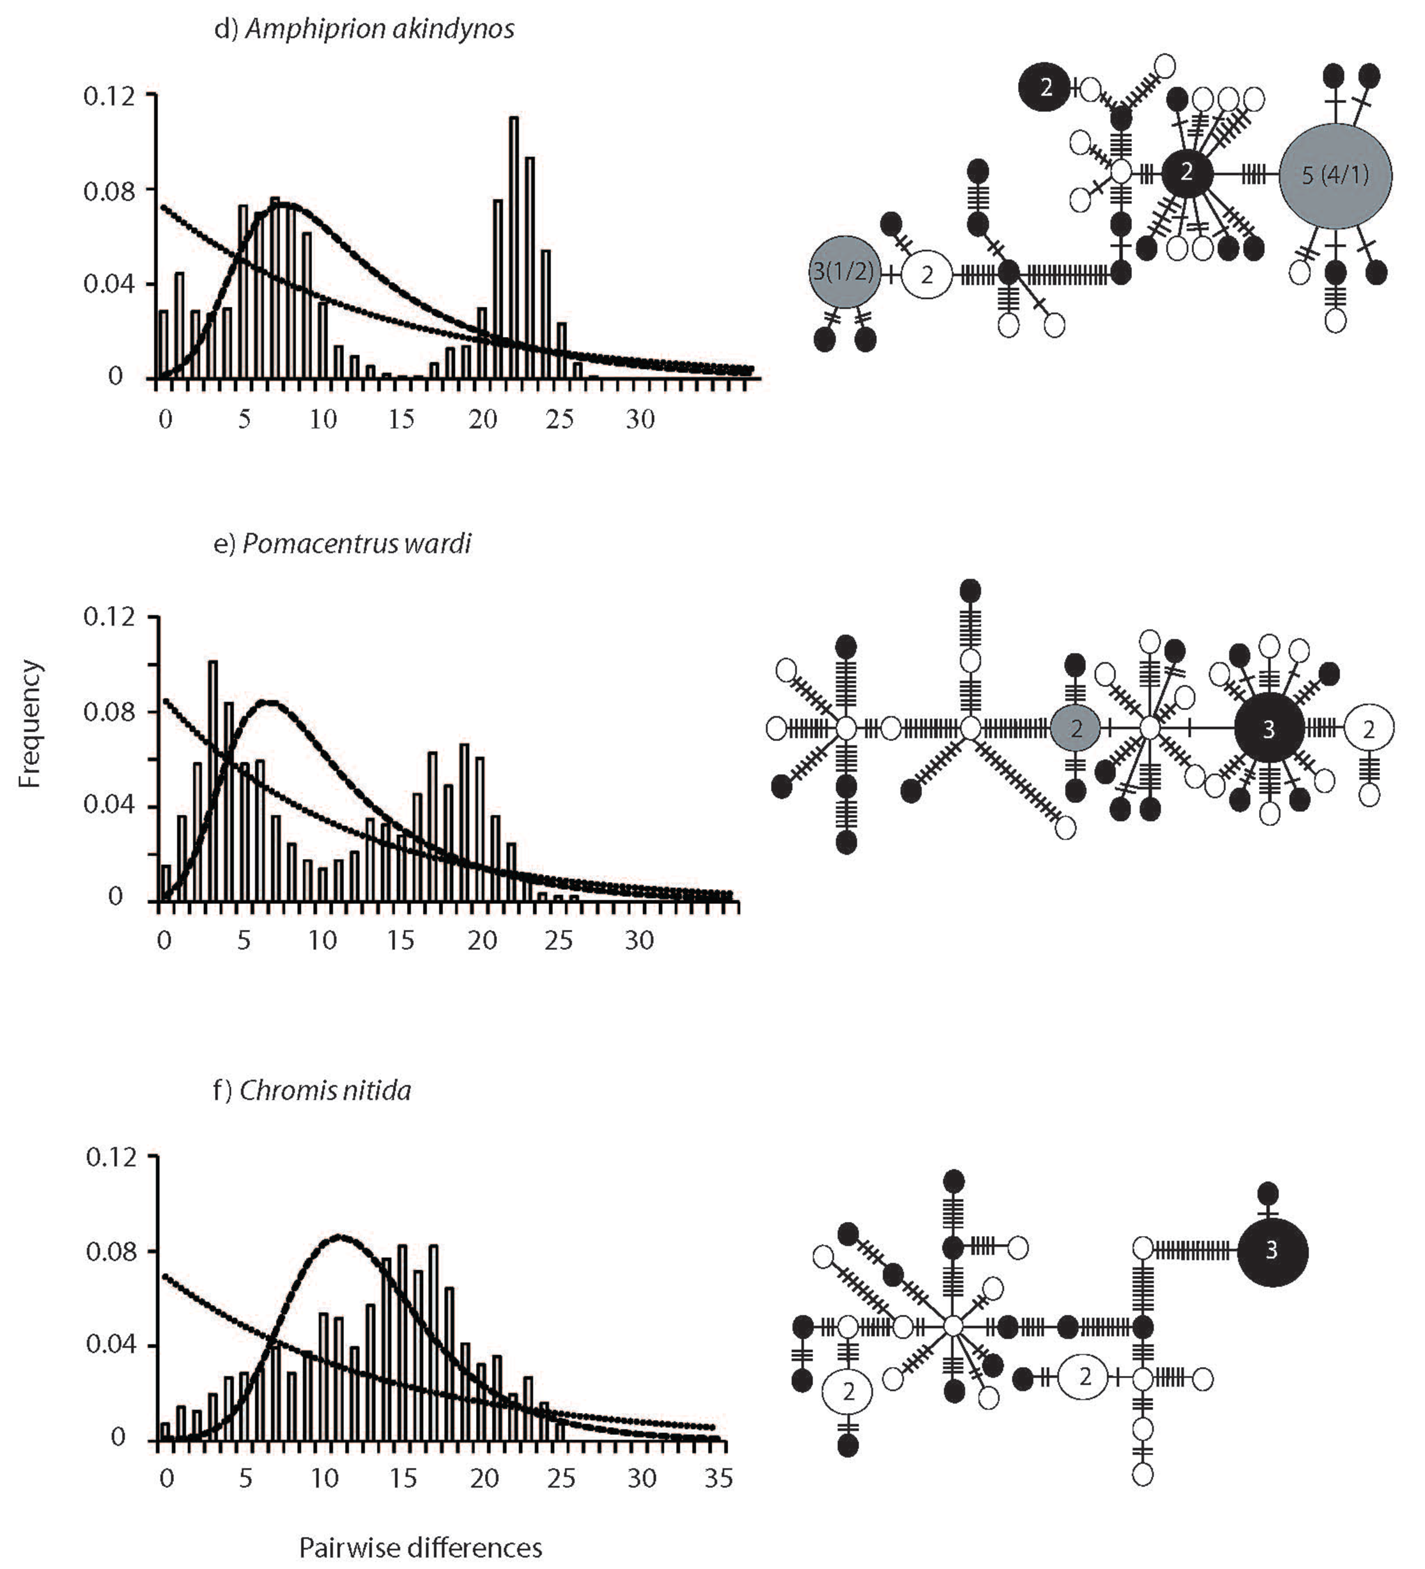
The haplotype networks and mismatch distributions revealed large and consistent differences between spatially restricted and widespread species (Figure 3). Mismatch distributions of spatially restricted species were characterized by larger means (13.7 ± 0.09 S.E.M.) and were bimodal in two of the three species (A. akindynos and P. wardi Figure 3 a–c). The mismatch distribution in C. nitida was broadly unimodal / multimodal, with a large mean and variance (13.57 ± 6.96 S.E.M.). In contrast, mismatch distributions of the geographically widespread species were unimodal with small means (4.6 ± 2.19 S.E.M.) (although a slightly higher mean of 8.99 was obtained for C. atripectoralis). The haplotype networks reflected the distribution of pairwise differences, as well as the lack of geographical structure (Figure 3 a–f). The haplotype networks of widespread central species were star-like and characterized by one, or a few, central haplotypes of greater frequency with distal haplotypes being separated by one or a few mutations (Figure 3 a–c). In contrast, networks of the spatially restricted species were complex; central haplotypes were less frequent and distal haplotypes were separated by many mutations (Figure 3 d–f). In all species, haplotypes did not show any geographical differentiation and many were shared by multiple individuals from both sampling locations (Figure 3). Demographic history analyses confirmed the difference in the distribution of genetic variation between widespread and spatially restricted species. The sudden expansion model was accepted in all three widespread species (Figure 3). In contrast, a constant population model was accepted in two of the three spatially restricted species (A. akindynos and P. wardi; Table 3).
3.3. Patterns of Genetic Diversity between Central and Peripheral Populations
Mitochondrial (haplotype and nucleotide) and nuclear genetic diversities (Hw) differed among species but were fairly consistent between sampled locations (Figures 4 and 5). Haplotype diversities were generally high but lower overall in P. moluccensis and significantly lower in the northern semi-marginal location in A. akindynos when transitions and transversions were considered (Figure 4a). Haplotype diversities were lower when considering only transversions and were similar among sampled locations of all species except two. In A. melanopus and P. wardi, haplotype diversities were greater in the northern location that was semi-marginal in P. wardi (Figure 4b). Nucleotide diversities were generally high and did not vary between locations in any of the species except A. akindynos where nucleotide diversities were greater in the northern semi-marginal location (Figure 4c). When based on transversions, nucleotide diversities did not differ between sampled locations of any of the species, but were generally greater in the spatially restricted species compared to their widespread congeners (Figure 4d). Expected heterozygosities (Hj) were significantly lower in the northern location of A. akindynos and A. melanopus but similar between locations of the other four species (Figure 5).
4. Discussion
4.1. Gene Flow and Genetic Diversities in Widespread and Restricted Species
We detected significant and consistent differences in the genetic diversity (h, π and Hw) of widespread and spatially restricted species. Genetic diversities were consistently greater (up to 10 times) in the spatially restricted species compared to widespread species despite very similar levels of genetic structure in all species. Levels of genetic diversity in the spatially restricted species were greater than most other values reported for reef fishes to date, whereas genetic diversity detected in the remaining species were similar to other widespread species [34,39,69-71] but see [72]. If Ne is related to N as predicted by theory and supported by substantial empirical data (reviewed by [22]), then our data suggest that a positive relationship between geographical ranges size and local abundance does not apply to the coral reef fishes we studied. It is also possible that population genetic processes, not directly related to the current size of local populations, has affected the distribution and abundance of genetic variation observed here. Such processes include hybridization and founder effects associated with patterns of colonization and speciation. These hypotheses are considered in turn below.
4.2. High Genetic Diversity can Arise from Secondary Contact among Differentiated Lineages
High haplotype and nucleotide diversities may arise when divergent populations hybridize, or if species have accumulated genetic variation over long timescales [70]. We observed strong bimodal mismatch distributions in two of the three restricted range species (i.e., A. akindynos and P. wardi) and a broad unimodal/multimodal mismatch distribution in C. nitida. While a constant population model was accepted in these species, bimodal distributions consistent with secondary contact among differentiated lineages [7,73] were observed. In contrast, all widespread species displayed narrow unimodal mismatch distributions consistent with population expansion. Genetic evidence for secondary contact among differentiated lineages and/or hybridization between species has previously been implicated in the ecology and evolution of coral reef fishes (e.g., [74-77]). Further analyses that include additional sampling locations and species will be needed to elucidate the role of secondary contact/hybridization in the evolution of species with restricted geographical ranges more generally.
4.3. Spatially Restricted and Widespread Species may have Colonized the GBR from Different Refugia
The divergent patterns in genetic diversity of the spatially restricted and widespread species observed here could have arisen if the GBR was colonized by different species from different refugia. It is likely that the spatially restricted species colonized the GBR from eastern off-shore refugia where they may have persisted and/or diverged during the last glacial maximum [78]. The population genetic structure detected here, where two or more genetically differentiated lineages coexist with little spatial differentiation, supports the hypothesis that these lineages came into contact before or when the current GBR was formed approximately 6000–9000 years ago [79,80]. This east-to-west pattern of isolation and colonization has also been invoked to explain the presence of divergent lineages of Acanthochromis polyacanthus on the GBR [75,81,82].
Based on current geographical distributions, it is possible that the widespread species could have colonized the GBR from northern sources. Genetic diversities commonly decline with increasing distance from Pleistocene refugia [15,83]. Consequently, the relatively low genetic diversity in widespread species, and their distinctive historical demographic expansion signal may have arisen if contemporary GBR populations were colonized by a single, possibly geographically distant, refuge. This explanation bears superficial resemblance to the centrifugal speciation hypothesis initially proposed by Brown [84] and advocated by Briggs [83]. In this model, widespread species disperse out of the centre of diversity and populations at the periphery of the ranges become isolated and diverge in allopatry during repeated cycles of range expansion and contraction thereby giving rise to new species [83,84]. These younger species that arise on the periphery are not able to colonize the centre of diversity potentially due to interactions with already established species thereby resulting in spatially restricted ranges [85]. Such unidirectional dispersal filters have been proposed for the east and west of the Indo-pacific centre of coral reef diversity [85], but have not previously been implicated in explaining the distributions of spatially restricted species to the south of the centre of reef fish diversity. However, some of the central tenets of the centrifugal speciation hypothesis, including the prediction that peripheral species are plesiomorphic and extinction prone relics [84,85] are not supported by our data. The phylogenetic relationships of the majority of species examined here (except P. wardi) were proposed using a 1989 bp mtDNA molecular phylogeny [86]. Branch length to nearest ancestor was the same for the Ampriprion species pair but longer in the spatially restricted C. nitida compared to widespread C. atripectoralis. The more genetically diverse, spatially restricted species therefore do not appear to be older than their widespread counter-parts. The high genetic diversity and strong levels of gene flow detected between locations also suggests that the spatially restricted species are not extinction prone [87]. However, predictions regarding the direction of dispersal and the presence of barriers erected by the centrifugal speciation hypothesis could explain the pattern of genetic diversity and current species distributions observed here.
4.4. Gene Flow may Maintain High Genetic Diversities on the Edge of Species Ranges
The population genetic effects of species' borders based on demographic processes are well established in theory; however, empirical support remains equivocal [6]. In general, we found no evidence to support the predictions from the abundant centre species' borders model of greater genetic structure towards the species margin. All species displayed high levels of gene flow, although the ISSRs indicated that some genetic isolation was present. This result is consistent with other studies of reef fishes across similar spatial scales [41,55,88,89]. Consequently, all species, regardless of position in, and the geographical extent of the species range, were characterized by relatively low levels of genetic structure consistent with moderate gene flow or insufficient time of isolation between sampling locations.
Genetic diversities varied among species and locations, but no consistent pattern was detected. A. akindynos had lower haplotype diversity and expected heterozygosity in the northern semi-marginal population, but nucleotide diversity was higher at this location. Similarly, A. melanopus, a widespread species, had lower haplotype diversity and lower expected heterozygosity in the northern population, centrally located in its range. Therefore, the lower genetic diversities in the Amphiprion spp. appear to be associated with the northern location rather than the position of this location within the species ranges. It is possible that a genetic signature of declining populations at the species margin was not detected because the sampling locations were not close enough to the border [17], or that we sampled too few populations to adequately describe the population genetic structure of our species. In contrast to the majority of studies on species border effects to date, we quantified the sampling distance from the reported border (1.5 degrees of latitude, 3%) [6]. We only sampled two populations per species; however, sampling effort did not affect the power to detect population genetic species border effects across 115 animal and plant taxa [6]. It is probably more likely that genetic diversity was maintained in peripheral populations by high levels of gene flow from central locations [20]. Weak genetic structure of the species studied here all indicated relatively high levels of gene flow between sampling locations that could maintain genetic diversity in marginal populations. In addition, our results suggest that the population genetic structure of some coral reef fishes on the GBR are influenced to a greater extent by historical factors, possibly associated with Pleistocene sea level variation and subsequent colonization of the GBR, rather than demographic variation among populations.


| Species | Latitudinal range (extent in degrees) | Sampling locations | Dist. to N Edge | Dist. to S Edge | ||
|---|---|---|---|---|---|---|
| LI (mt/nucDNA) | OI (mt/nucDNA) | OTI (mt/nucDNA) | ||||
| Amphiprion melanopus | 20°N–25°S (45 degrees) | 20/24 | 22/22 | 34.5 degrees/0.77 | 1.5 degrees/0.03 | |
| Amphiprion akindynos | 8°S–32°S (24 degrees) | 20/23 | 24/24 | 6.5 degrees/0.27 | 8.5 degrees/0.35 | |
| Pomacentrus moluccensis | 24°N–25°S (49 degrees) | 25/24 | 21/24 | 38.5 degrees/0.79 | 1.5 degrees/0.03 | |
| Pomacentrus wardi | 8°S–32°S(24 degrees) | 22/20 | 20/23 | 6.5 degrees/0.27 | 8.5 degrees/0.35 | |
| Chromis atripectoralis | 20°N–25°S (45 degrees) | 22/24 | 20/20 | 38.5 degrees/0.86 | 1.5 degrees/0.03 | |
| Chromis nitida | 16°S–32°S (16 degrees) | 17/17 | 17/23 | 2.5 degrees/0.16 | 8.5 degrees/0.53 | |
| Species | ΦST (ts-tv) | p | ΦST (tv) | p | ΦPT | p |
|---|---|---|---|---|---|---|
| Amphiprion melanopus | −0.005 | 0.47 | −0.002 | 0.38 | 0.188 | 0.001* |
| Amphiprion akindynos | −0.024 | 0.65 | −0.019 | 0.51 | 0.119 | 0.001* |
| Pomacentrus moluccensis | 0.006 | 0.25 | 0.005 | 0.04 | 0.018 | 0.022 |
| Pomacentrus wardi | −0.020 | 0.75 | −0.025 | 0.93 | 0.034 | 0.002* |
| Chromis atripectoralis | −0.016 | 0.70 | 0.013 | 0.17 | 0.159 | 0.001* |
| Chromis nitida | 0.013 | 0.26 | −0.037 | 0.89 | 0.114 | 0.001* |
| Species | Mismatch mean | SSD (Obs/Con) | SSD (Obs/Exp) | Log-likelihood ratio | p |
|---|---|---|---|---|---|
| Amphiprion melanopus | 2.41 | 0.125 | 0.013 | 14.44 | 0.0007 |
| Amphiprion akindynos | 13.85 | 0.033 | 0.035 | 0.621 | 0.733 ns |
| Pomacentrus moluccensis | 2.42 | 0.033 | 0.017 | 11.102 | 0.0039 |
| Pomacentrus wardi | 13.80 | 0.02 | 0.0278 | 5.58 | 0.061 ns |
| Chromis nitida | 13.57 | 0.029 | 0.012 | 13.92 | 0.0009 |
| Chromis atripectoralis | 8.99 | 0.026 | 0.0009 | 14.36 | 0.0008 |
Acknowledgments
This work was part of LKB's PhD research that was co-supervised by RH Crozier (1943–2009). This work was conducted with funding provided by James Cook University, the Australian Museum and the Australian Coral Reef Society to LKB, RHC and MJC. K Buechler provided C. nitida samples. A Calladine from the Genetic Analysis Facility at James Cook University sequenced and genotyped all samples. C Crozier and M Waycott provided laboratory advice and R Lawton ran the mismatch analyses in DNAsp. Three anonymous reviewers provided helpful comments on an earlier version of this manuscript. The staff at Lizard, Orpheus and One Tree Island Research stations and numerous volunteers all made the field collections possible. This work was conducted under GBRMPA permit and conformed to James Cook University Ethics guidelines.
Appendix
| Species | No base pairs | Ts-Tv ratio | Model selected | –ln Likelihood score | Among-site rate variation | ||
|---|---|---|---|---|---|---|---|
| Invariable sites | γ | Model implemented | |||||
| Amphiprion melanopus | 335 | 6.3 | HKY | 576.73 | 0 | 0 | TN(93) |
| Amphiprion akindynos | 354 | 9.8 | HKY | 956.9848 | 0 | 0.1410 | TN(93) + G |
| Pomacentrus moluccensis | 349 | 5.9 | HKY | 652.70 | 0 | 0 | TN(93) |
| Pomacentrus wardi | 359 | 8.1 | HKY | 1211.3286 | 0 | 0.3002 | TN(93) + G |
| Chromis atripectoralis | 349 | 7.7 | HKY | 924.56 | 0 | 0 | TN(93) |
| Chromis nitida | 347 | 6.2 | HKY | 1058.0591 | 0.6167 | 0.7053 | TN(93) + G |
References and Notes
- McNeely, J.A.; Miller, K.R.; Reid, W.V.; Mittermeier, R.A.; Werner, T.B. Conserving the World's Biological Diversity; World Conservation Union, World Resources Institute, Conservation International World Wildlife Fund–US, and the World Bank: Washington, DC, USA, 1990; pp. 1–93. [Google Scholar]
- Reed, D.H.; Frankham, R. Correlation between fitness and genetic diversity. Conservat. Biol. 2003, 17, 230–237. [Google Scholar]
- Hedrick, P.W. Genetics of Populations; Jones and Bartlett Publishers: Sudbury, MA, USA, 2005; Volume 3, pp. 1–737. [Google Scholar]
- Frankham, R. Inbreeding and extinction: Island populations. Conservat. Biol. 1998, 12, 665–675. [Google Scholar]
- Reed, D.H.; Briscoe, D.A.; Frankham, R. Inbreeding and extinction: The effect of environmental stress and lineage. Conservat. Genet. 2002, 3, 301–307. [Google Scholar]
- Eckert, C.G.; Samis, K.E.; Lougheed, S.C. Genetic variation across species' geographical ranges: The central-marginal hypothesis and beyond. Mol. Ecol. 2008, 17, 1170–1188. [Google Scholar]
- Rogers, A.R.; Harpending, H. Population growth makes waves in the distribution of pairwise genetic differences. Mol. Biol. Evol. 1992, 9, 552–569. [Google Scholar]
- Hartl, D.L.; Clark, A.G. Principles of Population Genetics; Sinauer Associates, Inc.: Sunderland, MA, USA, 1989; pp. 1–565. [Google Scholar]
- Darwin, C. On the Origin of Species by Means of Natural Selection; John Murray: London, UK, 1859; pp. 1–516. [Google Scholar]
- Mayr, E. Animal Species and Evolution; Belknap Press: Cambridge, MA, USA, 1963; pp. 1–797. [Google Scholar]
- Holt, R.D.; Keitt, T.H. Species' borders: A unifying theme in ecology. Oikos 2005, 108, 3–6. [Google Scholar]
- Holt, R.D.; Keitt, T.H.; Lewis, M.A.; Maurer, B.A.; Taper, M.L. Theoretical models of species' borders: Single species approaches. Oikos 2005, 108, 18–27. [Google Scholar]
- Brown, J.H.; Stevens, G.C.; Kaufman, D.M. The geographic range: Size, shape, boundaries and internal structure. Annu. Rev. Ecol. Systemat. 1996, 27, 597–563. [Google Scholar]
- Symonds, M.R.E.; Johnson, C.N. Range size-abundance relationships in Australian passerines. Glob. Ecol. Biogeogr. 2006, 15, 143–152. [Google Scholar]
- Gaston, K.J. The Structure and Dynamics of Geographical Ranges; Oxford University Press: Oxford, UK, 2003; pp. 1–266. [Google Scholar]
- Holt, R.D.; Keitt, T.H. Alternative causes for range limits: A metapopulation perspective. Ecol. Lett. 2000, 3, 41–47. [Google Scholar]
- Lennon, J.J.; Turner, J.R.G.; Connell, D. A metapopulation model of species boundaries. Oikos 1997, 78, 486–502. [Google Scholar]
- Hoffmann, A.A.; Parsons, P.P. Evolutionary Genetics and Environmental Stress; Oxford University Press: Oxford, UK, 1991; pp. 1–276. [Google Scholar]
- Brown, J.H. On the relationship between abundance and distribution of species. Am. Nat. 1984, 124, 255–279. [Google Scholar]
- Vucetich, J.A.; Waite, T.A. Spatial patterns of demography and genetic processes across the species' range: Null hypotheses for landscape conservation genetics. Conservat. Genet. 2003, 4, 639–645. [Google Scholar]
- Holt, R.D. Population dynamics and evolutionary processes: The manifold roles of habitat selection. Evol. Ecol. 1987, 1, 331–347. [Google Scholar]
- Frankham, R. Relationship of genetic variation to population size in wildlife. Conservat. Biol. 1996, 10, 1500–1508. [Google Scholar]
- Nevo, E. Genetic variation in natural populations: patterns and theory. Theor. Popul. Biol. 1978, 13, 121–177. [Google Scholar]
- Ayre, D.J.; Hughes, T.P. Climate change, genotypic diversity and gene flow in reef-building corals. Ecol. Lett. 2004, 7, 273–278. [Google Scholar]
- Gapare, W.A.; Aitken, S.N. Strong spatial genetic structure in peripheral but not core populations of sitka spruce [Picea sitchensis (Bong.) Carr.]. Mol. Ecol. 2005, 14, 2659–2667. [Google Scholar]
- Grant, M.C.; Antonovics, J. Biology of ecologically marginal populations of Anthoxanthum odoratum. I. Phenetics and dynamics. Evolution 1978, 32, 822–838. [Google Scholar]
- Durka, W. Genetic diversity in peripheral and subcentral populations of Corrigiola litoralis L. (Illecebraceae). Heredity 1999, 83, 476–484. [Google Scholar]
- Bowen, B.W.; Clark, A.M.; Abreu-Grobois, F.A.; Chaves, A.; Reichart, H.A.; Ferl, R.J. Global phylogeography of the ridley sea turtles (Lepidochelys spp.) as inferred from mitochondrial DNA sequences. Genetica 1997, 101, 179–189. [Google Scholar]
- Palumbi, S.R.; Grabowsky, G.; Duda, T.F.; Geyer, L.; Tachino, N. Speciation and population genetic structure in tropical Pacific sea urchins. Evolution 1997, 51, 1506–1517. [Google Scholar]
- Lecomte, F.; Grant, W.S.; Dodson, J.J.; Rodriguez-Sanchez, R.; Bowen, B.W. Living with uncertainty: Genetic imprints of climate shifts in East Pacific anchovy (Engraulis mordax) and sardine (Sardinops sagax). Mol. Ecol. 2004, 13, 2169–2182. [Google Scholar]
- Hoffman, E.A.; Blouin, M.S. Historical data refute recent range contraction as cause of low genetic diversity in isolated frog populations. Mol. Ecol. 2004, 13, 271–276. [Google Scholar]
- McCauley, R.A.; Ballard, H.E. Inferring nativity and biogeographic affinities of central and marginal populations of Froelichia floridana (Amaranthaceae) from Inter-Simple Sequence Repeat (ISSR) markers. J. Torrey Botanic. Soc. 2002, 129, 311–325. [Google Scholar]
- Pedersen, A.A.; Loeschcke, V. Conservation genetics of peripheral populations of the mygalomorph spider Atypus affinis (Atypidae) in northern Europe. Mol. Ecol. 2001, 10, 1133–1142. [Google Scholar]
- Winters, K.L.; van Herwerden, L.; Choat, J.H.; Robertson, D.R. Phylogeography of the Indo-Pacific parrotfish Scarus psittacus: isolation generates distinctive peripheral populations in two oceans. Mar. Biol. 2010, 157, 1679–1691. [Google Scholar]
- Betancourt, J.L.; Schluser, W.S.; Mitton, J.B.; Anderson, R.S. Fossil and genetic history of a pinyon pine (Pinus edilus) isolate. Ecology 1991, 72, 1685–1697. [Google Scholar]
- Tigerstedt, P.M.A. Studies on isozyme variation in marginal and central populations of Picea abies. Hereditas 1973, 75, 47–60. [Google Scholar]
- Gapare, W.J.; Aitken, S.N.; Ritland, C.E. Genetic diversity of core and peripheral Sitka spruce (Picea sitchensis (Bong.) Carr) populations: Implications for conservation of widespread species. Biol. Conserv. 2005, 123, 113–123. [Google Scholar]
- Garner, T.W.J.; Pearman, P.B.; Angelone, S. Genetic diversity across a vertebrate species' range: A test of the central-peripheral hypothesis. Mol. Ecol. 2004, 13, 1047–1053. [Google Scholar]
- Planes, S.; Fauvelot, C. Isolation by distance and vicariance drive genetic structure of a coral reef fish in the Pacific Ocean. Evolution 2002, 56, 378–399. [Google Scholar]
- Harvey, P.H.; Pagel, M.D. The Comparative Method in Evolutionary Biology; Oxford University Press: Oxford , UK, 1991; pp. 1–239. [Google Scholar]
- Lawton, R.; Messmer, V.; Pratchett, M.; Bay, L.K. High gene flow across large geographic scales reduces extinction risk for a highly specialized coral feeding butterflyfish. Mol. Ecol. 2011, 20, 3584–3598. [Google Scholar]
- Smith, P.J.; Fujio, Y. Genetic variation in marine teleosts: high variability in habitat specialists and low variability in habitat generalists. Mar. Biol. 1982, 69, 7–20. [Google Scholar]
- Rocha, L.A.; Robertson, D.R.; Roman, J.; Bowen, B.W. Ecological speciation in tropical reef fishes. Proc. Roy. Soc. Lond B 2005, 272, 573–579. [Google Scholar]
- Mitton, J.B.; Lewis, W.M.J. Relationships between genetic variability and life-history features of bony fishes. Evolution 1989, 43, 1712–1723. [Google Scholar]
- Selander, R.K.; Kaufman, D.W. Genetic variability and strategies of adaptation in animals. Proc. Natl. Acad. Sci. USA 1973, 70, 1875–1877. [Google Scholar]
- Kuiter, R.H. Coastal Fishes of South-Eastern Australia; University of Hawaii Press: Honolulu, HI, USA, 1993; pp. 1–437. [Google Scholar]
- Randall, J.E.; Allen, G.R.; Steene, R.C. Fishes of the Great Barrier Reef and Coral Sea; Crawford House Publishing: Bathurst, Australia, 1997; pp. 1–557. [Google Scholar]
- Fishbase. Avaliable on line: http://www.fishbase.org (accessed on 1 June 2011).
- Ocean Biogeographic Information System. Avaliable on line: http://www.iobis.org (accessed on 1 June 2011).
- Fautin, D.G.; Allen, G.R. Anemone Fishes and Their Host Sea Anemones: A Guide for Aquarists and Divers; Western Australian Museum: Perth, Australia, 1997; pp. 1–170. [Google Scholar]
- Bay, L.K.; Buechler, K.; Gagliano, M.; Caley, M.J. Intraspecific variation in the pelagic larval duration of tropical reef fishes. J.Fish Biol. 2006, 68, 1206–1214. [Google Scholar]
- Doherty, P.J.; Planes, S.; Mather, P. Gene flow and larval duration in seven species of fish from the Great Barrier Reef. Ecology 1995, 76, 2373–2391. [Google Scholar]
- Thorrold, S.R.; Milicich, M.J. Comparison of larval duration and pre- and post-settlement growth in two species of damselfish, Chromis atripectoralis and Pomacentrus coelestis (Pisces: Pomacentridae), from the Great Barrier Reef. Mar. Biol. 1990, 105, 375–384. [Google Scholar]
- Sambrook, J.; Russell, D. Molecular cloning. A laboratory manual, 3rd Edition ed; Cold Spring Harbor Laboratory Press: Cold Spring Harbor, NY, USA, 2001. [Google Scholar]
- Bay, L.K.; Crozier, R.H.; Caley, M.J. The relationship between population genetic structure and pelagic larval duration in coral reef fishes on the Great Barrier Reef. Mar. Biol. 2006, 149, 1247–1256. [Google Scholar]
- Bornet, B.; Branchard, M. Nonanchored inter simple sequence repeat (ISSR) markers: Reproducible and specific tools for genome fingerprinting. Plant Mol. Biol. Rep. 2001, 19, 209–215. [Google Scholar]
- Zietkiewicz, E.; Rafalski, A.; Labuda, D. Genome fingerprinting by simple sequence repeat (SSR)-anchored polymerase chain reaction amplification. Genomics 1994, 20, 176–183. [Google Scholar]
- Swofford, D.L. Phylogenetic Analysis Using Parsimony (*and other methods), Version 4. Sinauers Associates: Sunderland, MA, USA, 1998. [Google Scholar]
- Posada, D.; Crandall, K.A. Modeltest: testing the model of DNA substitution. Bioinformatics 1998, 14, 817–818. [Google Scholar]
- Nei, M. Molecular Evolutionary Genetics. Colombia University Press: New York, NY, USA, 1987; pp. 1–512. [Google Scholar]
- Nei, M.N.; Graur, D. Extent of protein polymorphism and the neutral mutation theory. Evol.Biol. 1984, 17, 73–118. [Google Scholar]
- Schneider, S.; Roessli, D.; Excoffier, L. Arlequin: A software for population genetics data analysis, Version 2.000. Genetics and Biometry Laboratory, Department of Anthropology: University of Geneva, Geneva , Switzerland, 2000. [Google Scholar]
- Sokal, R.R.; Rohlf, F.J.; Biometry. The Principles and Practice of Statistics in Biological Research; W. H. Freeman and Company: New York, NY, USA, 1995; pp. 1–887. [Google Scholar]
- Rozas, J.; Sanchez-Delbarrio, J.C.; Messeguer, X.; Rozas, R. DnaSP, DNA polymorphism analyses by the coalescent and other methods. Bioinformatics 2003, 19, 2496–2497. [Google Scholar]
- Burnham, K.P.; Anderson, D.R. Model Selection and Multimodel Inference: A Practical Information-Theoretic Approach; Springer: New York, NY, USA, 2002; pp. 1–488. [Google Scholar]
- Lynch, M.; Milligan, B.G. Analysis of population genetic structure with RAPD markers. Mol. Ecol. 1994, 3, 91–99. [Google Scholar]
- Vekemans, X.; Beauwens, T.; Lemaire, M.; Roldan-Ruiz, I. Data from amplified fragment length polymorphism (AFLP) markers show indication of size homoplasy and of a relationship between degree of homoplasy and fragment size. Mol. Ecol. 2002, 11, 139–151. [Google Scholar]
- Peakall, R.; Smouse, P.E. GenALEx V5: Genetic Analysis in Excel. Population Genetic Software for Teaching and Research. Australian National University: Canberra, Australia, 2001. Avaliable online: http://www.anu.au/BoZo/GenALEx/. [Google Scholar]
- Fauvelot, C.; Bernardi, G.; Planes, S. Reductions in the mitochondrial DNA diversity of coral reef fish provide evidence of population bottlenecks resulting from Holocene sea-level change. Evolution 2003, 57, 1571–1583. [Google Scholar]
- Grant, W.S.; Bowen, B.W. Shallow population histories in deep evolutionary lineages of marine fishes: Insights from sardines and anchovies and lessons for conservation. Heredity 1998, 89, 415–426. [Google Scholar]
- Messmer, V.; van Herwerden, L.; Munday, P.; Jones, G. Phylogeography of colour polymorphism in the coral reef fish Pseudochromis fuscus, from Papua New Guinea and the Great Barrier Reef. Coral Reefs 2005, 24, 392–402. [Google Scholar]
- Klanten, O.S.; Choat, J.H.; Hva Herwerden, L. Extreme genetic diversity and temporal rather than spatialpartitioning in a widely distributed coral reef. Mar. Biol. 2007, 150, 659–670. [Google Scholar]
- Avise, J.C.; Phylogeography. The History and Formation of Species; Harvard University Press: Cambridge, MA USA, 2000; pp. 1–447. [Google Scholar]
- McMillan, W.O.; Weigt, L.A.; Palumbi, S.R. Color pattern evolution, assortative mating, and genetic differentiation in brightly colored butterflyfishes (Chaetodontidae). Evolution 1999, 53, 247–260. [Google Scholar]
- Van Herwerden, L.; Doherty, P.J. Contrasting genetic structures across two hybrid zones of a tropical reef fish, Acanthochromis polyacanthus (Bleeker 1855). J. Evol. Biol. 2006, 19, 239–252. [Google Scholar]
- Yaakub, S.M.; Bellwood, D.R.; van Herwerden, L.; Walsh, F.M. Hybridization in coral reef fishes: Introgression and bi-directional gene exchange in Thalassoma (family Labridae). Mol. Phylogenet. Evol. 2006, 40, 84–100. [Google Scholar]
- Marie, A.D.; van Herwerden, L.; Choat, J.H.; Hobbs, J.P. Hybridisation of reef fish at the Indo-Pacific biogeographic barrier: A case study. Coral Reefs 2007, 26, 841–850. [Google Scholar]
- Davies, P.J. Evolution of the Great Barrier Reef—Reductionist dream or expansionist vision. Proceedings of the 6th International Coral Reef Symposium, Townsville, Australia; Choat, J.H., Barnes, D., Borowitzka, M.A., Coll, J.C., Davies, P.J., Flood, P., Hatcher, B.G., Hopley, D., Hutchings, P.A., Kinsey, D., et al, Eds.; Reefbase: Townsville, Australia, 1989; 1, pp. 9–17. [Google Scholar]
- Hopley, D.; Thom, B.G. Australian Sea levels in the last 15000 years: An introductory review. In Australian Sea Levels in the Last 15000 Years: A Review; Hopley, D., Ed.; Department of Geography, James Cook University: Townsville, Australia, 1983; pp. 29–36. [Google Scholar]
- Larcombe, P. Holocene Great Barrier Reef: Sedimentary controls and implications for environmental management. In Gondwana to Greenhouse. Australian Environmental Geoscience; Gostin, V.A., Ed.; Southwood Press: Sydney, Australia, 2001; Volume 21, pp. 281–294. [Google Scholar]
- Planes, S.; Doherty, P.J.; Bernardi, G. Strong genetic divergence among populations of a marine fish with limited dispersal, Acanthochromis polyacanthus, within the Great Barrier Reef and the Coral Sea. Evolution 2001, 55, 2263–2273. [Google Scholar]
- Bay, L.K.; Caley, M.J.; Crozier, R.H. Meta-population structure in a coral reef fish demonstrated by genetic data on patterns of migration, extinction and re-colonisation. BMC Evol. Biol. 2008, 8, 248. [Google Scholar]
- Briggs, J.C. Centrifugal speciation and centres of origin. J. Biogeogr. 2000, 27, 1183–1188. [Google Scholar]
- Brown, W.L.J. Centrifugal speciation. Q. Rev. Biol. 1957, 32, 247–277. [Google Scholar]
- Briggs, J.C. Marine Zoogeography; McGraw-Hill book Company: New York, NY, USA, 1974. [Google Scholar]
- Quenouille, B.; Bermingham, E.; Planes, S. Molecular systematics of the damselfishes (Teleosti: Pomacentridae): Bayesian phylogenetic analyses of mitochondrial and nuclear DNA sequences. Mol. Phylogenet. Evol. 2004, 31, 66–88. [Google Scholar]
- Frankham, R. Genetics and extinction. Biol. Conservat. 2005, 126, 131–140. [Google Scholar]
- Dudgeon, C.L.; Gust, N.; Blair, D. No apparent genetic basis to demographic differences in scarid fishes across the continental shelf of the Great Barrier Reef. Mar. Biol. 2000, 137, 1059–1066. [Google Scholar]
- Jones, D.B.; Jerry, D.R.; McCormick, M.I.; Bay, L.K. The population genetic structure of a common tropical damselfish on the Great Barrier Reef and eastern Papua New Guinea. Coral Reefs 2010, 29, 455–467. [Google Scholar]
© 2011 by the authors; licensee MDPI, Basel, Switzerland. This article is an open access article distributed under the terms and conditions of the Creative Commons Attribution license (http://creativecommons.org/licenses/by/3.0/).
Share and Cite
Bay, L.K.; Caley, M.J. Greater Genetic Diversity in Spatially Restricted Coral Reef Fishes Suggests Secondary Contact among Differentiated Lineages. Diversity 2011, 3, 483-502. https://doi.org/10.3390/d3030483
Bay LK, Caley MJ. Greater Genetic Diversity in Spatially Restricted Coral Reef Fishes Suggests Secondary Contact among Differentiated Lineages. Diversity. 2011; 3(3):483-502. https://doi.org/10.3390/d3030483
Chicago/Turabian StyleBay, Line K., and M. Julian Caley. 2011. "Greater Genetic Diversity in Spatially Restricted Coral Reef Fishes Suggests Secondary Contact among Differentiated Lineages" Diversity 3, no. 3: 483-502. https://doi.org/10.3390/d3030483
APA StyleBay, L. K., & Caley, M. J. (2011). Greater Genetic Diversity in Spatially Restricted Coral Reef Fishes Suggests Secondary Contact among Differentiated Lineages. Diversity, 3(3), 483-502. https://doi.org/10.3390/d3030483