Abstract
Water stress represents one of the most critical limiting factors affecting plant distribution, growth rate, biomass accumulation, and crop yield across diverse growth stages. Variations in species’ drought tolerance fundamentally shape global biodiversity patterns by influencing survival rates, distribution ranges, and community composition under changing environmental conditions. This study investigated the physiological responses of six plant species (Haloxylon ammodendron (H.A.), Nitraria tangutorum Bobr. (N.T.B.), Sympegma regelii Bge. (S.R.B.), Tamarix chinensis (T.C.), Potentilla fruticosa (P.F.R.), and Sabina chinensis (Linn.) Ant. (S.C.A.)) to varying water stress levels through controlled water gradient experiments. Four treatment levels were established: W1 (full water supply, >70% field water holding capacity); W2 (mild stress, 50–55%); W3 (moderate stress, 35–40%); and W4 (severe stress, 20–25%). Height growth and leaf mass per area decreased significantly with increasing water stress across all species. S.C.A. consistently exhibited the highest leaf mass per area among the six species, while H.A. showed the lowest values across all treatments. Leaf water content declined progressively with intensifying water stress, with T.C. and P.F.R. showing the most pronounced reductions (T.C.: 16.53%, 18.07%, and 33.37% under W2, W3, and W4, respectively; P.F.R.: 19.45%, 28.52%, and 36.08%), whereas N.T.B. and H.A. demonstrated superior water retention capacity (N.T.B.: 2.44%, 6.64%, and 9.76%; H.A.: 1.44%, 4.39%, and 5.52%). Water saturation deficit increased correspondingly with declining soil moisture. Diurnal leaf water potential patterns exhibited a characteristic V-shaped curve under well-watered (W1) and mildly stressed (W2) conditions, transitioning to a double-valley pattern with unstable fluctuations under moderate (W3) and severe (W4) stress. Leaf water potential showed linear relationships with air temperature and relative humidity, and a quadratic relationship with atmospheric water potential. For all six species, the relationship between pre-dawn leaf water potential and soil water content followed the curve equation y = a + b/x. Under water-deficient conditions, S.C.A. exhibited the greatest water physiological changes, followed by P.F.R. Both logarithmic and power function relationships between leaf and soil water potentials were highly significant (all F > 55.275, all p < 0.01). T.C. leaf water potential was the most sensitive to soil water potential changes, followed by S.C.A., while H.A. demonstrated the least sensitivity. These findings provide essential theoretical foundations for selecting drought-resistant plant species in arid regions of the Qaidam Basin. This study elucidates the response mechanisms of six distinct drought-tolerant plant species under water stress. It provides critical theoretical support for selecting drought-tolerant species, designing community configurations, and implementing water management strategies in vegetation restoration projects within the arid Qaidam Basin. Furthermore, it contributes empirical data at the plant physiological level to understanding the mechanisms sustaining species diversity in arid ecosystems.
1. Introduction
Water availability serves as a primary determinant of plant distribution, growth rates, and biomass production in drylands, directly regulating stomatal conductance, carbon assimilation, and survival under water deficit conditions [1,2]. In water-limited regions throughout China, moisture represents the most critical constraint for vegetation restoration, ecological improvement, and environmental reconstruction [3,4]. The Qaidam Basin, situated in the northeastern Qinghai–Tibetan Plateau, experiences an extreme continental plateau desert climate characterized by annual evaporation exceeding 2000 mm and precipitation below 50 mm [5]. These severe water limitations, combined with poor soil conditions for forest establishment, result in consistently low afforestation survival rates [6]. Consequently, extensive vegetation decline and mortality frequently occur during environmental fluctuations. Moreover, establishment of vegetation in certain areas often lacks adequate water balance considerations, leading to biomass and coverage levels that exceed local water resource carrying capacity [7]. This vegetation overloading disrupts the water balance equilibrium, triggering decline in growth and potentially inducing soil desiccation and salinization, which ultimately threatens the persistence of native vegetation. These processes not only fail to improve ecological conditions but also incur substantial economic losses [8,9,10]. Therefore, identifying drought-resistant tree species and understanding their physiological–ecological responses and adaptive mechanisms under drought stress are essential for enhancing afforestation success and maintaining healthy tree growth in water-limited arid and semi-arid regions. Such knowledge also advances our understanding of how species-specific drought tolerance shapes global diversity patterns by determining species persistence within particular environmental niches.
Water stress represents one of multiple stressors affecting plant development across different growth stages, and it remains among the most limiting factors for plant survival and productivity [11]. Water deficit develops when soil moisture fails to meet plant water demands, while drought conditions arise from severe water deficiency within plant tissues [12,13]. Plant growth under drought conditions serves as a key indicator of drought resistance, primarily reflected in height increment, basal diameter expansion, and leaf characteristics. Drought stress differentially inhibits growth across plant organs including leaves, roots, and stems. Leaves, as primary photosynthetic organs, exhibit heightened sensitivity to environmental stresses [14]. Under drought conditions, leaves display various stress responses including shrinkage, yellowing, and abscission, resulting in reduced leaf area and numbers. These modifications decrease transpirational water loss and represent adaptive self-regulatory mechanisms for drought environments [15,16]. Following growth inhibition under water stress, leaves undergo specific adaptations to water-limited conditions, particularly through alterations in leaf water potential and relative water content [17,18,19]. These foliar adjustments typically enhance water-use efficiency during water scarcity, with interspecific variation in these adaptive responses underscoring the role of differential drought tolerance in maintaining global biodiversity through ecological niche differentiation.
This study selected six native species from the Qaidam Basin as experimental materials: Haloxylon ammodendron (H.A.), Nitraria tangutorum Bobr. (N.T.B.), Sympegma regelii Bge. (S.R.B.), Tamarix chinensis (T.C.), Potentilla fruticosa (P.F.R.), and Sabina chinensis (Linn.) Ant. (S.C.A.). All six species possess varying degrees of drought resistance. While previous studies have investigated drought resistance in these species [20,21,22], existing research remains fragmented, examining single aspects without systematic or comparative analyses across all six species.
To address this knowledge gap, we propose the following hypotheses: (1) The six native species exhibit significant interspecific variation in growth and leaf water physiological indicators across water stress gradients; (2) Species-specific differences in the sensitivity of growth and water physiological responses to soil water content and potential can differentiate drought resistance levels among the six species; (3) Quantitative relationships exist between leaf water potential and both environmental factors and soil water conditions, characterizing species-specific adaptive mechanisms to water stress. Based on these hypotheses, our objectives were as follows: (1) to quantify differential response patterns in height growth and leaf mass per area among the six species across four water stress gradients; (2) to compare variations in leaf water physiological indicators under different water stress levels; (3) to establish quantitative models relating leaf water potential to environmental factors, soil water content, and soil water potential; and (4) to comprehensively evaluate drought resistance among the six species, based on integrated growth and water physiological indicators. This research provides theoretical foundations for drought-resistant species selection in the Qaidam Basin’s arid environment while advancing understanding of how variations in drought tolerance influence patterns of diversity in arid and semi-arid ecosystems.
2. Materials and Methods
2.1. Experiment Site
The experiment was conducted at the experimental station in the Xiangride Irrigation Area, Qaidam Basin, Qinghai Province, located on the southeastern margin of the Qaidam Basin in Dulan County (Figure 1). The irrigation area extends approximately 10 km east–west and 20 km north–south, covering a total area of approximately 200 km2. The region is characterized by scarce precipitation, low atmospheric humidity, high solar radiation, and abundant sunshine. The climate is relatively mild with favorable thermal conditions. Mean annual temperature ranges from 3.1 to 4.4 °C, with a frost-free period of 89–109 days. Annual precipitation varies between 66.8 and 248.3 mm, while annual evaporation reaches 2285.4 mm. The humidity coefficient ranges from 0.20 to 0.49, classifying the region as arid.
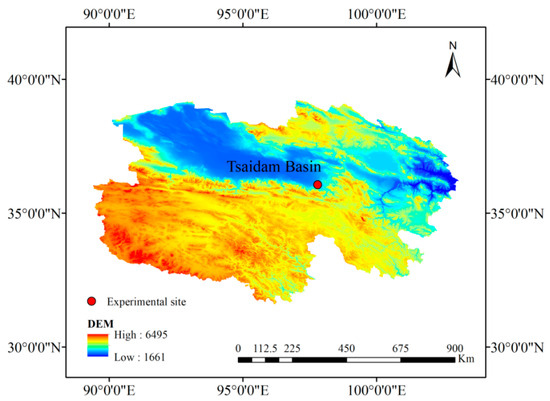
Figure 1.
Experimental site.
The experiment was conducted during the primary growing season of the six native species in the Qaidam Basin, from May to September 2023. This period encompasses peak plant growth and development, with seasonal temperature and precipitation patterns representative of natural environmental conditions experienced by these species, ensuring the ecological relevance of the current experimental results.
2.2. Experimental Design
Six representative plant species from the Qaidam Basin were selected to investigate their drought resistance characteristics. Table 1 presents the basic properties of the experimental species. Drought resistance was evaluated by establishing different water availability gradients and monitoring multiple physiological indicators. To ensure statistical independence (a critical prerequisite for valid statistical inference), the experimental design was explicitly defined as follows: (1) The pot was designated as the independent experimental unit; (2) Each pot contained exactly one individual plant (no multiple plants per pot), such that each experimental unit corresponded to one unique plant individual. This design eliminated intra-pot competition (for water, nutrients, or light) and avoided pseudo replication, where non-independent samples would skew statistical results. Healthy individuals with uniform growth characteristics were selected as experimental subjects, with one plant per pot serving as an independent experimental unit to ensure statistical independence. Plants with comparable growth conditions were transplanted into pots and maintained under regular irrigation until experimental treatments commenced. The local soil exhibited a maximum field water holding capacity of 24% and bulk density of 1.42 g cm−3. Four water availability treatments were established: W1 represented full water supply, maintaining soil moisture above 70% field water holding capacity (volumetric water content > 16.8%). W2 represented mild water stress, maintaining soil moisture at 50–55% field water holding capacity (volumetric water content 12.0–13.2%). W3 represented moderate water stress, maintaining soil moisture at 35–40% field water holding capacity (volumetric water content 8.4–9.6%). W4 represented severe water stress, maintaining soil moisture at 20–25% field water holding capacity (volumetric water content 4.8–6.0%). Each water treatment was maintained continuously for 8 weeks. Throughout the treatment period, soil volumetric water content was monitored daily at 09:00 using time domain reflectometry (TDR, DELTA-T DEVICES Ltd., Cambridge, CB, UK), with three measurements per pot averaged to minimize measurement error. Water was supplemented using a gravimetric method, calculating the required water volume based on the pots’ weight loss to maintain target soil moisture levels for each treatment. For each plant species × water treatment combination, four replicate pots were established equivalent to four independent experimental units (each with one plant individual), ensuring sufficient statistical power to detect treatment effects while preserving the independence of each replicate. Plants with comparable growth conditions were transplanted into pots filled with local topsoil collected from the irrigation area (consistent with the native soil of the experimental site). Its key properties were determined as follows: pH = 8.2, electrical conductivity (EC) = 1.8 mS/cm. No additional fertilizers or soil amendments were added to avoid interfering with plant water stress responses. After transplanting, plants were maintained under regular irrigation (soil moisture > 70% field water holding capacity) for 2 weeks to acclimate (promote root establishment and recover from transplant shock) before experimental treatments commenced.

Table 1.
Basic properties of experiment tree species.
2.3. Measurement and Calculation
2.3.1. Height Growth of Plant and Leaf Mass per Area
Height growth was determined by measuring plant height at experiment initiation and termination.
For leaf mass per area determination, leaves were harvested from each plant at experiment conclusion and immediately weighed for fresh mass. Leaves were then scanned to determine their area (LA), dried at 85 °C for 48 h, and reweighed for dry mass (M). Leaf mass per area (LMA) was calculated as the ratio of leaf dry weight to leaf area [23,24], as follows:
where LMA is the leaf mass per area, g·cm−2; M is the leaf dry weight, g; LA is the leaf area, cm2.
2.3.2. Relative Water Content and Water Saturation Deficit
At experiment termination, two leaves from upper, middle, and lower canopy positions were collected in early morning and immediately weighed for fresh mass (FM). Leaves were then submerged in water in darkness for 24 h and reweighed for turgid mass (SM), followed by drying at 80 °C for 48 h and weighing for dry mass (DM). Pre-experimental tests on the six target species showed that 24 h of submersion in water was sufficient to fully restore leaf turgor; beyond this duration, no significant increase in leaf mass was observed. This ensured that leaves reached maximum water-holding capacity, a critical prerequisite for accurate calculation of relative water content (RWC) and water saturation deficit (WSD). Hydration was conducted at a constant temperature of 25 ± 1 °C. This temperature was chosen to match the mean daytime temperature of the Qaidam Basin’s growing season, ensuring that rehydration occurred under ecologically relevant thermal conditions. Constant temperature also eliminated variability in water uptake rates caused by temperature fluctuations. Hydration in darkness prevented photosynthetic activity, which would otherwise consume water and disrupt the equilibrium of leaf water content. Dark conditions also inhibited stomatal opening. Stomatal closure in darkness reduces water loss via transpiration, allowing leaves to focus on passive water absorption through cell walls and membranes, further ensuring accurate measurement of maximum turgid mass. Leaf relative water content (RWC) and water saturation deficit (WSD) were calculated according to [25,26] the following:
where RWC is the relative water content, %; WSD is the water saturation deficit, %; FM is the fresh weight of leaves, g; DM is the dry weight of leaves, g; SM is the saturation weight of leaves, g.
2.3.3. Measurement of Water Conservation Capacity
Leaf water conservation capacity was assessed using a natural dehydration method. On the final experimental day, two leaves from upper, middle, and lower canopy positions were collected in early morning, immediately weighed (Mf), and placed in darkness for natural dehydration. Leaves were reweighed at 2 h intervals until constant weight was achieved (Mh). Cumulative water loss (D) was calculated as follows:
where D is the cumulative water loss, %; Mf is the natural fresh weight of leaves, g; Mh is the weight of leaves per moment, g.
2.3.4. Measurement of Leaf Water Potential
Leaf water potential was determined using a dew-point water potential meter (L-51, WESCOR, Logan, UT, USA) [27]. Calibration was performed using standard solutions of known water potential at 25 °C, with a calibration check conducted every 5 measurements to ensure accuracy (calibration error < ±0.02 MPa). For leaf sampling, fully expanded, healthy leaves from the middle canopy layer of each plant were selected; leaves were of uniform age to minimize variability from leaf development stages. Measurements were conducted at several-day intervals in early morning to assess water stress effects. Diurnal variation in leaf water potential was determined on a representative day during the experimental period, with measurements at 2 h intervals from 07:00 to 19:00.
2.3.5. Soil Water Content and Soil Water Potential
Soil water content (SWC, %, v/v) was measured using time domain reflectometry (DELTA-T DEVICES Ltd., Cambridge, UK). Soil water potential was determined using a dew-point potentiometer (WESCOR, Logan, UT, USA). A soil probe (PST-55, WESCOR, Logan, UT, USA) was inserted into the soil 24 h prior to measurement. Following proper instrument connection, diurnal variation in soil water potential was recorded automatically.
2.4. Data Processing
Plant growth characteristics (height growth and leaf mass per area) and leaf water physiological parameters (relative water content, water conservation capacity, and leaf water potential) were analyzed across species and moisture treatments using correlation analysis, regression analysis, and significance testing. Statistical analyses were conducted as follows: (1) All data were tested to confirm conformity with parametric test assumptions; (2) One-way analysis of variance (ANOVA) was employed to compare growth and water physiological parameters among water treatments and species, with significance level set atα = 0.05; (3) Pearson correlation analysis examined linear relationships between leaf water potential and environmental factors, while quadratic regression analyzed relationships between leaf water potential and atmospheric water potential; (4) Hyperbolic models fitted relationships between pre-dawn leaf water potential and soil water content, while logarithmic and power function models described relationships between leaf water potential and soil water potential. All statistical analyses were performed using IBM SPSS 22.0 (IBM Corp., Armonk, NY, USA, 2013), with figures generated using OriginPro 9.0 (OriginLab Corp., Northampton, MA, USA, 2017).
3. Results
3.1. Effects of Water Stress on Plant Growth
3.1.1. Height Growth
Plant growth responded significantly to water stress conditions. Plant height served as a key indicator of growth response. Figure 2 illustrates height growth variations among the six species under different soil moisture regimes.
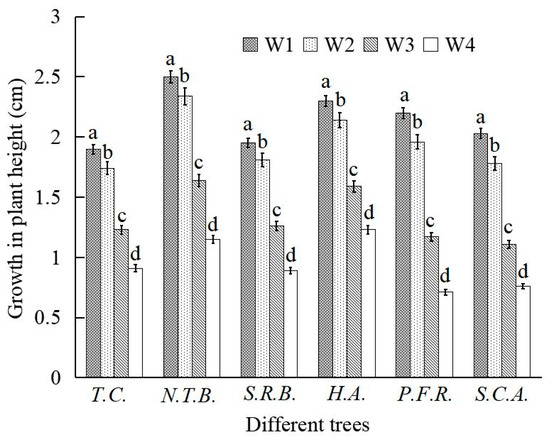
Figure 2.
Changes in the stem height growth of six plants under different soil water content conditions.
Water stress significantly affected height growth across all six species. Height increment decreased progressively with increasing water stress intensity. Relative to W1 treatment, height growth reductions under W2 treatment remained relatively modest. Under W2 conditions, N.T.B., H.A., T.C., and S.R.B. exhibited height growth reductions of 6.40%, 6.96%, 8.42%, and 7.18%, respectively, while P.F.R. and S.C.A. showed greater reductions of 10.91% and 12.32%, respectively. Under W3 and W4 treatments, height growth reductions intensified considerably compared to W1 treatment. Under W4 conditions, height growth decreased by 54.00%, 52.11%, 46.52%, 54.36%, 67.73%, and 62.56% for N.T.B., T.C., H.A., S.R.B., P.F.R., and S.C.A., respectively. These results demonstrate that decreasing water availability and intensifying stress progressively inhibited height growth, with increasingly pronounced effects as stress severity increased.
Among the six species, H.A. exhibited the smallest height growth reduction across all water stress treatments (6.96% under W2, 46.52% under W4), while P.F.R. and S.C.A. showed the greatest reductions (P.F.R.: 10.91% under W2, 67.73% under W4; S.C.A.: 12.32% under W2, 62.56% under W4). Height growth reductions among N.T.B., T.C., and S.R.B. showed no significant differences. Under W3 and W4 treatments, P.F.R. and S.C.A. exhibited markedly greater height growth reductions than the other four species, with P.F.R. showing greater sensitivity than S.C.A. Overall, H.A. demonstrated the greatest drought tolerance based on height growth maintenance, followed by N.T.B., then S.R.B. and T.C., with S.C.A. and P.F.R. showing the least tolerance.
3.1.2. Leaf Mass per Area
Leaf mass per area, expressed as the ratio of leaf dry weight to leaf area, serves as an indicator of plant growth rate and foliar development. Previous research has established relationships between leaf mass per area and both nitrogen fixation and photosynthetic capacity. Lower leaf mass per area typically correlates with higher leaf water content, while higher values indicate greater chloroplast density and increased leaf thickness. Figure 3 presents leaf mass per area variations across species under different water stress levels.
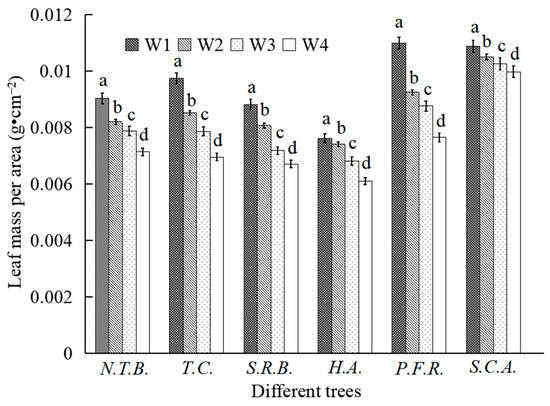
Figure 3.
Changes in leaf mass per area of different tree species under different water stress.
Leaf mass per area declined with increasing water stress intensity, though the magnitude varied among species. Relative to W1 treatment, H.A. showed minimal decline under W2 conditions (2.68%), with greater reductions under W3 and W4 treatments (13.27% and 19.84%, respectively). S.C.A. exhibited the second-smallest decline under W2 treatment (3.45%), with reductions of 5.74% and 8.35% under W3 and W4 treatments, representing the smallest overall decrease among all species under moderate and severe stress. Compared to W1 treatment, N.T.B. showed reductions of 9.19%, 14.98%, and 21.02% under W2, W3, and W4 treatments, respectively; T.C. decreased by 12.51%, 17.23%, and 29.66%; S.R.B. by 8.50%, 18.59%, and 26.28%; and P.F.R. by 15.82%, 20.29%, and 30.43%.
Under mild water stress, H.A. maintained relatively stable leaf mass per area, indicating preserved physiological function with minimal growth inhibition. Under moderate and severe stress, H.A. leaf mass per area declined substantially, though less than other species except S.C.A., suggesting growth inhibition onset under moderate stress but with lower severity. T.C. and P.F.R. showed substantial reductions even under mild stress, indicating early growth inhibition. S.C.A. maintained the smallest reductions across all treatments, demonstrating minimal water stress effects on foliar development. Across all treatments, S.C.A. consistently exhibited the highest leaf mass per area values while H.A. showed the lowest, correlating with species-specific leaf thickness characteristics.
3.2. Effects of Water Stress on Leaf Water Physiology
3.2.1. Relative Water Content
Leaf relative water content and water saturation deficit reflect internal plant water status under drought conditions and serve as drought resistance indicators. Table 2 presents variations in these parameters across species under different water stress levels.
Table 2.
Changes in leaf relative water content and water saturation deficit of different plants under water stress.
Leaf water content decreased with declining soil moisture, with species-specific variation reflecting differential drought resistance. All six species showed decreasing trends in leaf relative water content with reduced soil moisture. Under W1 treatment, H.A. exhibited the highest leaf water content, followed by T.C., with S.R.B. and N.T.B. intermediate, and S.C.A. and P.F.R. lowest. As water stress intensified, T.C. and P.F.R. showed the greatest reductions while N.T.B. and H.A. showed the least. T.C. decreased by 20.76%, 22.70%, and 41.92% under W2, W3, and W4 treatments, respectively. Compared to W1 treatment, P.F.R. decreased by 19.45%, 28.52%, and 36.08%; N.T.B. by 2.44%, 6.64%, and 9.76%; H.A. by 1.44%, 4.39%, and 5.52%; S.R.B. by 5.88%, 15.58%, and 25.03%; and S.C.A. by 6.19%, 12.48%, and 15.59% under W2, W3, and W4 treatments, respectively.
Two-way ANOVA revealed contrasting results. Under W4, N.T.B.and H.A. had significantly smaller relative water content reductions than T.C., P.F.R., and S.C.A.; simultaneously, N.T.B. and H.A. maintained significantly lower water saturation deficits than P.F.R. and S.C.A. (p < 0.05). Water saturation deficit increased progressively with declining soil moisture, showing inverse trends to relative water content. H.A. exhibited the lowest water saturation deficit values across all treatments (17.68% under W1, 22.22% under W4). T.C. also maintained relatively low values, while S.C.A. and P.F.R. showed higher deficits. Lower water saturation deficits indicate reduced drought impact and stronger water balance maintenance capacity, enabling better growth maintenance and enhanced foliar water retention. Based on relative water content changes and water saturation deficits, N.T.B. and H.A. demonstrated superior drought tolerance with minimal water content reductions and lowest saturation deficits, followed by S.R.B., while T.C., P.F.R., and S.C.A. showed relatively weaker drought tolerance with larger reductions and higher deficits.
3.2.2. Water Conservation Capacity
Leaf water conservation capacity reflects the anti-dehydration ability of excised leaves and their capacity to maintain original water content. This parameter indicates plant water retention ability under drought conditions and plays crucial roles in physiological processes, serving as a drought resistance indicator.
Leaf water loss rates decreased with declining soil moisture across all six species, indicating universal drought resistance mechanisms. However, water loss rate magnitudes varied significantly among species within each treatment. Under identical environmental conditions, higher dehydration rates indicate lower water conservation capacity and relatively poor drought resistance.
The six species clustered into three distinct groups based on water loss rates (Figure 4): Group 1 comprised S.C.A. with the lowest water loss rate; Group 2 included H.A., S.R.B., and N.T.B. with intermediate rates; Group 3 contained T.C. and P.F.R. with the highest rates. The slower water loss in S.C.A. correlated with scale-like leaf morphology and thicker cuticle structures, indicating superior water conservation capacity and dehydration resistance. T.C. and P.F.R. exhibited significantly higher water loss rates than other species, indicating weaker water conservation capacity.
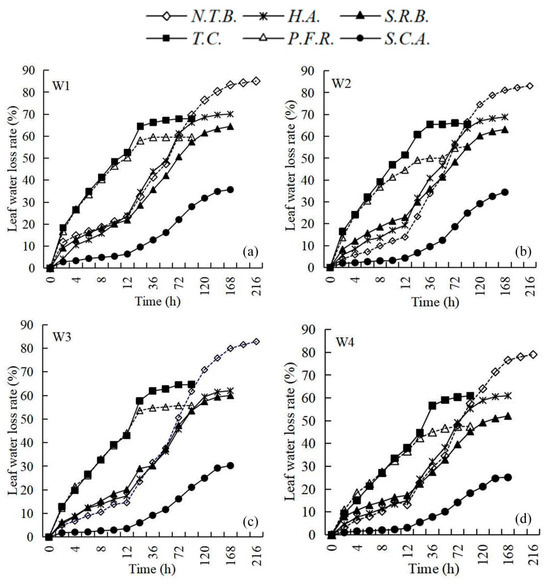
Figure 4.
Comparison of leaf water conservation capacity of different plants with different soil water content ((a) W1 (full water supply, >70% field water holding capacity); (b) W2 (mild stress, 50–55%); (c) W3 (moderate stress, 35–40%); and (d) W4 (severe stress, 20–25%)).
Leaf water loss rates decreased with intensifying water stress across all treatments. This enhanced water conservation capacity represents an adaptive response to water stress environments, reducing transpirational losses. Time required for excised leaves to reach constant weight varied among species: N.T.B. required 216 h, S.C.A. 168 h, H.A. and S.R.B. 144 h each, while T.C. and P.F.R. required only 36 h. Slower water loss rates correlate with longer times to constant weight and enhanced dehydration resistance. Therefore, N.T.B. demonstrated the strongest dehydration resistance and water conservation capacity, while T.C. and P.F.R. showed the weakest. However, drought resistance assessment requires comprehensive evaluation beyond water conservation capacity alone, incorporating growth and physiological–ecological parameters.
3.2.3. Leaf Water Potential
Daily Variation of Leaf Water Potential Under the Same Soil Moisture Conditions
Leaf water potential represents a critical indicator of plant water status. Figure 5 illustrates diurnal leaf water potential patterns across species under identical soil moisture conditions, using W1 treatment as representative.
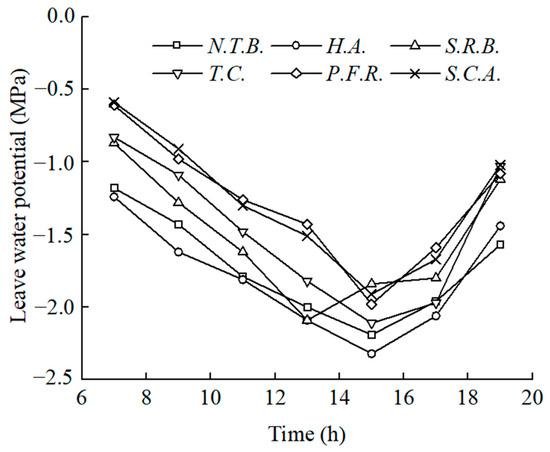
Figure 5.
Daily changes of leaf water potential of six plants under W1 treatment.
Under uniform soil moisture conditions, all six species exhibited similar diurnal patterns, characterized by initial decline followed by recovery. Maximum values occurred in the early morning. Following sunrise, increasing light intensity and temperature, coupled with decreasing atmospheric humidity, initiated physiological activities requiring water consumption. This created internal water deficits, causing a decline in leaf water potential. Minimum values occurred between 13:00 and 15:00 (S.R.B. at approximately 13:00, others at approximately 15:00). Subsequently, declining temperature and light intensity reduced physiological activity rates and water consumption, enabling recovery of water potential. However, evening values typically remained lower than morning values. This diurnal pattern reflects the imbalance between physiological water demand and limited soil water availability when root absorption cannot satisfy plant requirements.
Variations in leaf water potential reflect internal water status, with lower values indicating enhanced water absorption capacity and drought resistance [28,29]. Formal statistical contrasts (Tukey’s HSD, α = 0.05) between W1 pre-dawn and midday leaf water potential showed that H.A. and N.T.B. had significantly lower values than P.F.R. and S.C.A. (p < 0.05). Among the six species, H.A. maintained the lowest leaf water potential, followed by N.T.B., with S.R.B. and T.C. intermediate, and P.F.R. and S.C.A. highest, indicating superior water recovery capacity in H.A.
Table 3 presents daily maximum and minimum leaf water potential values under W1 treatment. H.A. exhibited the lowest pre-dawn water potential (−1.24 MPa) and midday minimum (−2.32 MPa) among all species. Additionally, H.A. showed the smallest diurnal amplitude, indicating superior drought tolerance. N.T.B. values slightly exceeded H.A. but remained lower than the other four species, with the smallest diurnal range indicating strong drought resistance. P.F.R. and S.C.A. exhibited higher pre-dawn values. Based on daily extremes and diurnal amplitudes under identical environmental conditions, H.A. and N.T.B. demonstrated superior drought tolerance, followed by T.C. and S.R.B., with P.F.R. and S.C.A. showing relatively weaker tolerance.
Table 3.
Daily highest and lowest leaf water potential of six plants under W1 treatment (a–d indicates significant differences).
Daily Variation of Leaf Water Potential of the Same Plant Under Different Soil Moisture Conditions
Figure 6 illustrates diurnal leaf water potential patterns across soil moisture gradients. Leaf water potential decreased with declining soil moisture across all species. Under W1 and W2 treatments, all six species maintained V-shaped diurnal patterns with morning maxima and afternoon minima. Two-way ANOVA on daily mean leaf water potential across treatments showed that under W4 treatment, H.A. and N.T.B. maintained significantly lower daily mean values than P.F.R. and S.C.A. (p < 0.05). Across all time points and treatments, H.A. and N.T.B. maintained relatively low values, followed by T.C. and S.R.B., with P.F.R. and S.C.A. showing highest values. H.A. exhibited the lowest daily mean water potential across all treatments. Lower water potential generally indicates enhanced drought tolerance, suggesting superior drought resistance in H.A. and N.T.B. Under water-limited conditions (W3 and W4), diurnal patterns shifted to double-valley curves with unstable fluctuations. Low soil moisture combined with rising temperature and light intensity enhanced physiological activity and water consumption. When soil moisture cannot satisfy plant water demands, internal deficits affect leaf water potential dynamics. Plants respond through physiological adjustments to minimize water loss while maintaining vital functions.
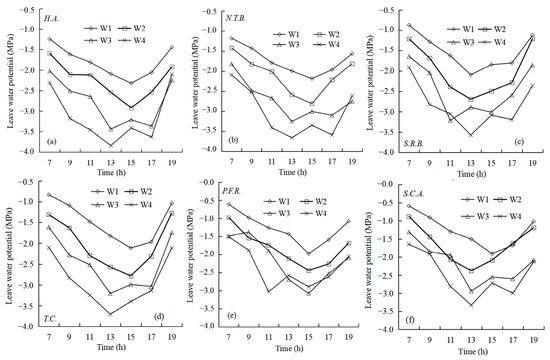
Figure 6.
Daily changes in leaf water potential of six plants with different soil water content ((a) H.A.; (b) N.T.B.; (c) S.R.B.; (d) T.C.; (e) P.F.R.; (f) S.C.A.).
3.3. Study of Potential Energy Gradients in SPAC Systems
3.3.1. Relationship Between the Leaf Water Potential and Environmental Factors
In arid environments, leaf water potential dynamics reflect drought resistance strength. Leaf water potential correlates closely with environmental factors, as shown in Figure 6. Unlike the diurnal patterns described in Section 3.2.3, this section examines coupling mechanisms between diurnal water potential variation and environmental drivers. Morning maxima coincided with low temperature and high humidity conditions that minimized transpiration demand and water loss. Rising solar radiation increased light intensity and temperature while decreasing relative humidity, enhancing transpiration rates beyond root absorption capacity, causing continuous water potential decline until reaching minima between 13:00 and 15:00 (consistent with observations in Section 3.2.3). Subsequently, declining radiation and temperature reduced transpirational pressure, enabling gradual water balance recovery and potential increase, though cumulative daily water consumption prevented full recovery to morning levels. Minimum water potential typically preceded maximum temperature and minimum atmospheric humidity, reflecting adaptive plant responses to arid conditions.
Table 4 presents correlation analyses between leaf water potential and environmental factors under W1 treatment. Among 18 relational models, 14 showed highly significant correlations and 4 showed significant correlations (all temperature relationships). Leaf water potential exhibited linear relationships with air temperature and relative humidity, and quadratic relationships with atmospheric water potential. These results confirm strong environmental control of leaf water potential, particularly through atmospheric humidity and water potential effects.
Table 4.
Regression equation between daily changes in leaf water potential and meteorologic factors.
3.3.2. Relationship Between Leaf Water Potential and Soil Water Content
Figure 7 illustrates relationships between pre-dawn leaf water potential and soil water content. Water potential reflects internal plant water status and significantly influences water absorption from soil and transpiration to atmosphere. Pre-dawn values indicate plant water status following daily environmental stress recovery, serving as resistance indicators. All six species showed declining pre-dawn water potential with decreasing soil moisture. Reduced soil moisture limits water absorption, and when absorption cannot compensate for transpirational losses, leaf water potential declines. Lower water potential enhances soil water absorption capacity, representing drought adaptation. This trend reflects cumulative effects of soil water supply capacity on daily plant water balance, clarifying soil moisture’s driving effect on this characteristic.
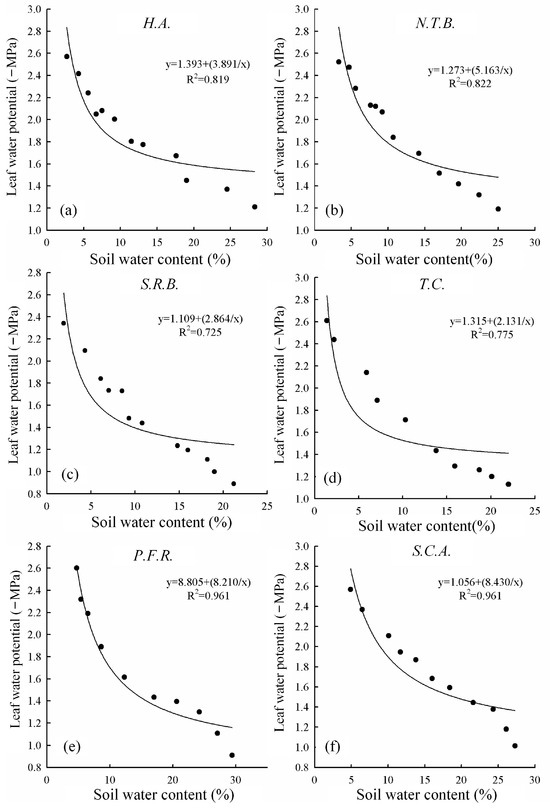
Figure 7.
Relationships between leaf water potential of six species and soil water content ((a) H.A.; (b) N.T.B.; (c) S.R.B.; (d) T.C.; (e) P.F.R.; (f) S.C.A.).
The hyperbolic equation y = a + b/x describes relationships between pre-dawn leaf water potential and soil water content. Parameter a represents water potential change amplitude with soil moisture variation, while parameter b indicates change intensity. Parameter b values ranked: S.C.A. (8.43) > P.F.R. (8.21) > N.T.B. (5.163) > H.A. (3.891) > S.R.B. (2.864) > T.C. (2.131). Lower b values indicate smaller water physiological changes under water deficit. Therefore, S.C.A. exhibited the greatest water physiological changes under deficit conditions, followed by P.F.R.
3.3.3. Relationship Between Leaf Water Potential and Soil Water Potential
Table 5 presents relationships between pre-dawn leaf water potential and soil water potential during wilting experiments. Under adequate water conditions, leaf water potential relates primarily to environmental factors. Under water deficit, leaf water potential additionally responds to soil moisture and water potential changes. In this study, initially, high soil water content and potential facilitated plant water absorption with high free water availability. Transpiration consumed substantial water, rapidly decreasing soil water content and potential. With further moisture decline, reduced free water availability forced plants to rely on bound water with lower accessibility. Under stress, plants exhibited leaf yellowing and wilting, reducing transpiration below water demand requirements and decreasing leaf water potential at slower rates than under high moisture conditions.
Table 5.
Mathematical simulation models of the relation between soil water potential and leaf water potential in six plants.
Logarithmic and power function equations effectively described leaf–soil water potential relationships, with all relationships highly significant (F > 55.275, p < 0.01). Parameters a and b reflect rate and amplitude of leaf water potential changes with soil water potential, with larger values indicating greater response amplitude. Power function parameters (a, b) ranked: T.C. (38.674, 1.050), S.C.A. (26.815, 0.919), S.R.B. (22.596, 0.920), N.T.B. (21.400, 0.847), P.F.R. (18.323, 0.799), H.A. (11.204, 0.627). T.C. leaf water potential showed the strongest dependence on soil water potential, followed by S.C.A., while H.A. showed least dependence.
4. Discussion
Previous studies have documented species-specific drought response mechanisms in our study species. H.A. exhibits transcriptomic and metabolomic adjustments to water and salinity stress, with drought-responsive ASR-family gene regulation [30,31]. N.T. demonstrates flexible water source switching across soil layers and activates hormone and MAPK signaling pathways under drought conditions [32]. T.C. displays remarkable plasticity in leaf traits and sap-flow thresholds along groundwater and salinity gradients [33]. P.F.R. employs partitioned hydraulic and photosynthetic strategies across microhabitats on the Qinghai–Tibetan Plateau [34], with shrubland communities enhancing soil water retention relative to adjacent meadows [35]. S.R. occupies desert communities at the plateau margin, reflecting evolutionary selection for extreme drought and salinity tolerance [36]. Recent dendro-physiological studies on S.C. have linked growth sensitivity and leaf heteromorphy to climatic stress responses [37,38]. Water stress represents a primary abiotic constraint significantly reducing plant growth and productivity [39]. Growth reduction and yield decline under water stress correlate closely with photosynthetic inhibition through multiple mechanisms. Decreased leaf mass per area reduces chlorophyll biosynthesis capacity [40], while stress-induced stomatal closure limits CO2 influx, directly suppressing photosynthetic rates [41,42]. Additionally, water stress disrupts plant morphological attributes, water relations, and stomatal regulation [43], largely due to imbalances between reactive oxygen species production and antioxidant defense systems [44]. Plant organ responses to water stress are mediated by alterations in growth regulatory pathways. Our results demonstrated significant height growth reductions across all six species with increasing water stress intensity (Figure 2). This growth inhibition results from suppressed cellular turgor pressure, which restricts cell expansion under water deficit conditions [45]. Consistent with previous findings showing water stress reduces leaf area and growth traits [46,47], our data revealed progressive declines in leaf mass per area with intensifying water stress. Species-specific physiological characteristics and environmental responses produced differential growth and water physiological patterns. Based on growth responses, drought tolerance ranked as follows: H.A. showed greatest tolerance, followed by N.T.B., then S.R.B. and T.C., with S.C.A. and P.F.R. exhibiting least tolerance.
Our correlation analyses revealed threshold-dependent responses consistent with established drought physiology principles. Under declining leaf water potential, plants typically reduce stomatal conductance, thereby lowering photosynthetic rates and altering water-use efficiency [1]. This “stomatal–leaf water potential” coupling in drought-tolerant shrubs is typically accompanied by coordinated regulation of root water-uptake strategies and leaf traits [21,48]; T.C. reorganizes leaf functional traits along groundwater and salinity gradients [18], thereby explaining the linear/quadratic coupling relationships between leaf water potential and environmental factors observed in our study, as well as the differences in slope coefficients across species. In arid-adapted shrubs, coordination between leaf-level traits and root water uptake patterns governs drought exposure and recovery dynamics [32]. For T.C., variations in groundwater depth and salinity fundamentally restructure leaf functional traits and sap-flow responses, supporting the nonlinear relationships we observed [33]. Leaf mass per area and nitrogen allocation patterns constrain photosynthetic capacity and photosynthetic nitrogen-use efficiency across woody species [49,50].
Relative water content serves as a crucial parameter for evaluating plant growth and leaf water physiology under water stress [51], providing robust assessment of drought tolerance across species [52]. Water stress consistently reduces plant water content and water potential [53]. Among our study species, T.C. and P.F.R. exhibited the greatest reductions in leaf relative water content (T.C.: 33.37% decrease under W4; P.F.R.: 36.08% decrease under W4), while N.T.B. and H.A. showed minimal reductions (N.T.B.: 9.76% decrease under W4; H.A.: 5.52% decrease under W4) across experimental water gradients. Species maintaining higher leaf relative water content demonstrate superior drought tolerance [54]. Interspecific variation in relative water content under identical conditions relates to differences in leaf cell dimensions [55] and root system architecture. These species differences align closely with regional studies: H.A.’s functional trait maintenance under precipitation exclusion and groundwater depletion treatments [22] corresponds with the slight reduction in RWC in our study; N.T.’s deep–shallow water source switching [48] and its transcriptomic drought-tolerance pathways [21] support its robust leaf water stability; while P.F.R.’s strategic differentiation in alpine meadow–shrubland microhabitats under water stress [34,35] aligns with the larger decline in RWC that we documented.
Leaf water conservation capacity represents the anti-dehydration ability of excised leaves and their capacity to maintain original water content. This parameter reflects plant water retention ability under drought conditions and plays crucial roles in physiological processes. Decreasing water loss rates with declining soil moisture across all six species (Figure 4) indicates universal drought resistance mechanisms, though magnitudes varied significantly among species and treatments. Under identical environmental conditions, higher dehydration rates indicate reduced water conservation capacity. Under water stress, root systems shift from passive to active water-uptake modes, continuously maintaining absorption capacity to compensate for daytime transpirational deficits [48,56]. Plants enhance drought tolerance through dual mechanisms: reducing transpirational water loss and maintaining membrane stability [57]. In regional comparisons, the slower water loss rate of S.C.A. aligns with its needle/scale-like leaves and thick cuticle structure, consistent with studies on its morphogenetic response and annual ring sensitivity under climatic stress [37,38]; whereas the faster water loss of T.C. and P.F.R. aligns with their trait plasticity and water threshold characteristics under salt–water gradients [18,34].
Leaf water potential variations directly reflect internal plant water status. Declining leaf water potential enhances water absorption capacity and indicates stronger drought resistance. All six species exhibited characteristic diurnal patterns with morning maxima and subsequent decline followed by recovery (Figure 5), closely coupled with environmental factors. Our regression results showing a linear relationship between leaf water potential and air temperature/relative humidity, and a quadratic relationship with atmospheric water potential, align with the process model of evapotranspiration demand-driven, root-water-supply-constrained, passive downregulation of leaf water potential under drought conditions [1,2]. T.C. exhibited the highest sensitivity to changes in soil water potential, reflecting its water signal threshold under dual groundwater–salinity gradients [33]. In contrast, H.A. exhibited the lowest dependence of leaf water potential on soil water potential, consistent with its maintenance of robust functional traits in field experiments under “precipitation removal + groundwater decline” conditions [22], and its molecular basis for drought tolerance is supported by the ASR pathway [30,31].
The diverse drought response strategies observed among these six species underscore the critical role of species-specific tolerance in maintaining ecological diversity within arid ecosystems like the Qaidam Basin. Our findings reveal significant interspecific variation in adaptive mechanisms across water stress gradients. H.A. and N.T.B. maintained relatively stable water retention (evidenced by smaller reductions in leaf relative water content) and minimal physiological fluctuations under stress, while S.C.A. and P.F.R. demonstrated greater physiological plasticity with more pronounced changes in leaf water potential and water content under experimental conditions. This functional differentiation enables multi-species coexistence across moisture gradients, with each species occupying a distinct “hydrological niche” defined by its drought tolerance threshold [58]. Such diversity enhances community resilience. Under fluctuating water availability, loss of stress-sensitive species (e.g., P.F.R.) can be compensated by persistence of tolerant species (e.g., H.A.), ensuring ecosystem functionality maintenance. Furthermore, the distinct physiological traits observed (including variations in leaf mass per area, water saturation deficit, and water potential regulation) facilitate resource partitioning, reducing competition for limited water resources and sustaining overall biodiversity [59]. These species-specific drought adaptation variations constitute key drivers of diversity maintenance in arid regions, emphasizing the critical importance of preserving plant diversity for ecological restoration in water-limited environments [9].
Photosynthetic inhibition represents a primary physiological consequence of drought stress. Therefore, understanding photosynthetic behavior under water stress is essential for identifying drought-tolerant species. Stomatal closure reduces water loss while increasing intrinsic water-use efficiency [60]. However, photosynthetic responses to drought are complex and depend on plant species identity, stress duration, and intensity [61]. These differential drought tolerance characteristics have important implications for species selection in extreme arid zone protection forests and vegetation restoration programs.
This study provides valuable insights into drought tolerance mechanisms of six native species, offering critical guidance for drought-resistant plant selection in the Qaidam Basin. However, several limitations warrant acknowledgment. First, the pot experiments using only 0–30 cm topsoil inadequately simulated the natural soil profiles and groundwater recharge processes characteristic of the Qaidam Basin, potentially creating discrepancies between experimental results and field conditions. Second, the relatively short observation period precluded assessment of long-term drought adaptation mechanisms and responses to extreme climatic events, limiting temporal representativeness. Third, the evaluation of drought resistance focused primarily on aboveground traits, lacking crucial belowground data including root hydraulic conductivity, rooting depth, and root biomass allocation patterns, and these parameters are essential for understanding water acquisition strategies under drought stress. Future research should address these limitations through several approaches. Field experiments under natural conditions would provide more realistic assessments of drought responses. Long-term monitoring programs could capture extended drought adaptation dynamics and extreme event responses. Integrated aboveground-belowground trait analyses would comprehensively reveal whole-plant drought resistance mechanisms. Additionally, multi-omics approaches could elucidate molecular and biochemical foundations of drought resistance, identifying key genes, metabolites, and regulatory pathways governing drought adaptation. Such advances would strengthen theoretical foundations for drought-resistant plant breeding and ecological restoration in arid regions.
5. Conclusions
This study systematically evaluated drought tolerance mechanisms across six native plant species under controlled conditions of water stress. Plant growth responded significantly to water availability gradients, with height increment decreasing progressively as water stress intensified. Among the study species, H.A. exhibited minimal growth reduction under water stress, demonstrating superior drought tolerance. Leaf mass per area declined across all species with increasing water deficit, with S.C. maintaining the highest values and H.A. the lowest across all treatment levels.
Leaf relative water content decreased markedly with intensifying water stress, with species-specific variation reflecting differential drought resistance. Tamarix chinensis and Potentilla fruticosa showed the most substantial reductions (33.37% and 36.08% decreases under W4, respectively), while Nitraria tangutorum and H. ammodendron demonstrated superior water retention capacity (9.76% and 5.52% decreases under W4, respectively). Water saturation deficit increased progressively with declining soil moisture, with H. ammodendron maintaining the lowest values across all treatments (22.22% under W4). These integrated water physiological responses indicate that N. tangutorum and H. ammodendron possess the strongest drought tolerance under experimental conditions.
Environmental coupling analyses revealed distinct relationships between leaf water potential and atmospheric variables. Leaf water potential exhibited linear correlations with air temperature and relative humidity, while showing quadratic relationships with atmospheric water potential. The hyperbolic model (y = a + b/x) effectively describes the pre-dawn leaf water potential responses to soil water content across all species. Highly significant logarithmic and power function relationships characterized the leaf–soil water potential dynamics. T. chinensis leaf water potential showed the strongest sensitivity to soil water potential changes, followed by S. chinensis, while H. ammodendron demonstrated the least dependence.
This research acknowledges several methodological constraints. Pot experiments utilizing only 0–30 cm topsoil cannot fully replicate natural soil profiles and groundwater dynamics characteristic of the Qaidam Basin, while observations from a single growing season fail to capture long-term adaptation processes or extreme climate responses. Additionally, the absence of belowground trait data (particularly root hydraulic conductivity) limits comprehensive assessment of drought resistance. For practical ecological management and restoration in the basin, H. ammodendron and N. tangutorum are recommended as pioneer species for severely arid zones (desert margins with soil volumetric water content < 8.4%), while S. chinensis and P. fruticosa are better suited to mild water stress conditions. The established quantitative models, particularly the leaf water potential–soil water content hyperbolic relationship, provide guidance for adaptive water management strategies, such as maintaining soil moisture above 8.4% for T. chinensis and Sympegma regelii. Mixed-species assemblages incorporating drought-tolerant arbor layers (H. ammodendron) with shrub components (N. tangutorum) could enhance ecosystem resilience in restoration initiatives.
Author Contributions
Conceptualization, H.L. and M.D.; methodology, H.L. and M.D.; software, Q.W.; validation, Q.W. and M.D.; formal analysis, H.L. and M.D.; investigation, H.L., M.D. and Q.W.; resources, H.L. and M.D.; data curation, H.L., M.D. and Q.W.; writing—original draft preparation, H.L., M.D. and Q.W.; writing—review and editing, H.L. and M.D.; visualization, H.L. and M.D.; supervision, H.L.; project administration, H.L.; funding acquisition, H.L. and M.D. All authors have read and agreed to the published version of the manuscript.
Funding
This work was supported by 2022 Fund Project of Yangling Vocational and Technical College (ZK22-56) and 2021 Fund Project of Yangling Vocational and Technical College (BG2021002).
Conflicts of Interest
The authors declare no conflict of interest.
References
- Grossiord, A.; Rico-Medina, A.; Caño-Delgado, A.I. The physiology of plant responses to drought. Science 2020, 368, 266–269. [Google Scholar] [CrossRef]
- Wang, X.Y.; Li, X.M.; Zhao, W.; Hou, X.M.; Dong, S.K. Current views of drought research: Experimental methods, adaptation mechanisms and regulatory strategies. Front. Plant Sci. 2024, 15, 1371895. [Google Scholar] [CrossRef]
- Li, S.B.; He, S.Y.; Xu, Z.; Liu, Y.; von Bloh, W. Desertification Process and its Effects on Vegetation Carbon Sources and Sinks Vary under Different Aridity Stress in Central Asia during 1990–2020. Catena 2023, 221, 106767. [Google Scholar] [CrossRef]
- Zheng, T.; Jia, Y.P.; Zhang, S.J.; Li, X.B.; Wu, Y.; Wu, C.L.; He, H.D.; Peng, Z.R. Impacts of Vegetation on Particle Concentrations in Roadside Environments. Environ. Pollut. 2021, 282, 117067. [Google Scholar] [CrossRef]
- Jin, X.M.; Guo, R.H.; Xia, W. Distribution of Actual Evapotranspiration over Qaidam Basin, an Arid Area in China. Remote Sens. 2013, 5, 6976–6996. [Google Scholar] [CrossRef]
- Keram, A.; Halik, Ü.; Aishan, T.; Keyimu, M.; Jiapaer, K.; Li, G.L. Tree Mortality and Regeneration of Euphrates Poplar Riparian Forests along the Tarim River, Northwest China. For. Ecosyst. 2021, 8, 49. [Google Scholar] [CrossRef]
- Hickin, M.; Preisser, E.L. Effects of Light and Water Availability on the Performance of Hemlock Woolly Adelgid (Hemiptera: Adelgidae). Environ. Entomol. 2015, 44, 128–135. [Google Scholar] [CrossRef]
- Wang, L.N.; Gesang, Q.Z.; Luo, J.F.; Wu, X.L.; Rebi, N.S.; You, Y.G.; Zhou, J.X. Drivers of plant diversification along an altitudinal gradient in the alpine desert grassland, Northern Tibetan Plateau. Glob. Ecol. Conserv. 2024, 53, e02987. [Google Scholar] [CrossRef]
- Bai, Y.H.; Tang, Z.Y. Enhanced effects of species richness on resistance and resilience of global tree growth to prolonged drought. Proc. Natl. Acad. Sci. USA 2024, 121, e2410467121. [Google Scholar] [CrossRef]
- Zhao, S.H.; Cong, D.M.; He, K.X.; Yang, H.; Qin, Z.H. Spatial-Temporal Variation of Drought in China from 1982 to 2010 Based on a modified Temperature Vegetation Drought Index (mTVDI). Sci. Rep. 2017, 7, 17473. [Google Scholar] [CrossRef]
- Guillen-Cruz, G.; Rodríguez-Sánchez, A.L.; Fernández-Luqueño, F.; Flores-Rentería, D. Influence of Vegetation Type on the Ecosystem Services Provided by Urban Green Areas in an Arid Zone of Northern Mexico. Urban For. Urban Green. 2021, 62, 127135. [Google Scholar] [CrossRef]
- D’Ippólito, S.; Rey-Burusco, M.F.; Feingold, S.E.; Guevara, M.G. Role of Proteases in the Response of Plants to Drought. Plant Physiol. Biochem. 2021, 168, 1–9. [Google Scholar] [CrossRef]
- Xie, X.H.; Wang, X.Q.; Wu, L.; Lv, J.N.; Zhou, X. Spatiotemporal variations of soil water retention and its influencing factors in the alpine-cold river source area, southern Gansu Plateau. J. Hydrol. 2024, 639, 131597. [Google Scholar] [CrossRef]
- Liu, Z.X.; Guo, C.X.; Wu, R.; Wang, J.J.; Zhou, Y.P.; Yu, X.L.; Zhang, Y.X.; Zhao, Z.H.; Liu, H.; Sun, S.S.; et al. Identification of the Regulators of Epidermis Development under Drought- and Salt-Stressed Conditions by Single-Cell RNA-Seq. Int. J. Mol. Sci. 2022, 23, 2759. [Google Scholar] [CrossRef]
- Xiao, L.; Min, X.X.; Liu, G.B.; Li, P.; Xue, S. Effect of Plant-Plant Interactions and Drought Stress on the Response of Soil Nutrient Contents, Enzyme Activities and Microbial Metabolic Limitations. Appl. Soil Ecol. 2023, 181, 104666. [Google Scholar] [CrossRef]
- Li, C.Y.; Berninger, F.; Koskela, J.; Sonninen, E. Drought Responses of Eucalyptus microtheca Provenances Depend on Seasonality of Rainfall in Their Place of Origin. Aust. J. Plant Physiol. 2000, 27, 231–238. [Google Scholar] [CrossRef]
- Elshamly, A.M.S.; Parrey, Z.A.; Gaafar, A.R.Z.; Siddiqui, M.H.; Hussain, S. Potassium Humate and Cobalt Enhance Peanut Tolerance to Water Stress Through Regulation of Proline, Antioxidants, and Maintenance of Nutrient Homeostasis. Sci. Rep. 2024, 14, 1625. [Google Scholar] [CrossRef]
- Mao, P.L.; Lin, Q.Z.; Pang, Y.X.; Wang, K.X.; Ni, R.Q.; Han, X.; Cao, B.H. Eco-physiological response mechanism of Tamarix chinensis to soil water changes in coastal wetlands of the Yellow River Delta. Front. Mar. Sci. 2023, 10, 1231928. [Google Scholar] [CrossRef]
- Mohkami, A.; Yazdanpanah, N.; Saeidnejad, A. Vermicompost-based Amendment Compensated for the Reducing Effect of Water Stress on Growth and Yield of Quinoa by Improving Soil Moisture Characteristic. Paddy Water Environ. 2024, 22, 155–171. [Google Scholar] [CrossRef]
- Long, R.W.; Pratt, R.B.; Jacobsen, A.L. Drought Resistance in Two Populations of Invasive Tamarix Compared Using Multiple Methods. Tree Physiol. 2024, 44, 140. [Google Scholar] [CrossRef]
- Liu, C.G.; Duan, N.; Chen, X.N.; Li, H.Q.; Zhao, X.L.; Duo, P.Z.; Wang, J.; Li, Q.H. Metabolic Pathways Involved in the Drought Stress Response of Nitraria tangutorum as Revealed by Transcriptome Analysis. Forests 2022, 13, 509. [Google Scholar] [CrossRef]
- Liu, S.S.; Xu, G.Q.; Chen, T.Q.; Wu, X.; Li, Y. Quantifying the Effects of Precipitation Exclusion and Groundwater Drawdown on Functional Traits of Haloxylon ammodendron—How Does This Xeric Shrub Survive the Drought? Sci. Total Environ. 2023, 904, 166945. [Google Scholar] [CrossRef] [PubMed]
- Chelli, S.; Bricca, A.; Tsakalos, J.L.; Andreetta, A.; Bonari, G.; Campetella, G.; Carnicelli, S.; Cervellini, M.; Puletti, N.; Wellstein, C.; et al. Multiple Drivers of Functional Diversity in Temperate Forest Understories: Climate, Soil, and Forest Structure Effects. Sci. Total Environ. 2024, 916, 170258. [Google Scholar] [CrossRef] [PubMed]
- Gillani, S.F.A.; Zhuang, Z.L.; Rasheed, A.; UlHaq, I.; Abbasi, A.; Ahmed, S.; Wang, Y.X.; Khan, M.T.; Sardar, R.; Peng, Y.L. Brassinosteroids Induced Drought Resistance of Contrasting Drought-responsive Genotypes of Maize at Physiological and Transcriptomic Levels. Front. Plant Sci. 2022, 25, 13. [Google Scholar] [CrossRef]
- Chaimala, A.; Jogloy, S.; Vorasoot, N.; Holbrook, C.C.; Kvien, C.K.; Laohasiriwong, S. The Variation of Relative Water Content, SPAD Chlorophyll Meter Reading, Stomatal Conductance, Leaf Area, and Specific Leaf Area of Jerusalem artichoke Genotypes under Different Durations of Terminal Drought in Tropical Region. J. Agron. Crop Sci. 2021, 209, 12–26. [Google Scholar] [CrossRef]
- Khan, B.; Anjum, M.M.; Ali, N.; Ullah, M.; Khan, G.R. Grain Quality, Biochemical Traits, and Internal Water Status of Chinese Elite Wheat Lines by Sowing Interval in Semiarid Conditions. Gesunde Pflanz. 2023, 75, 1653–1664. [Google Scholar] [CrossRef]
- Rodriguez-Dominguez, C.M.; Forner, A.; Martorell, S.; Choat, B.; Lopez, R.; Peters, J.M.R.; Pfautsch, S.; Mayr, S.; Carins-Murphy, M.R.; McAdam, S.A.M.; et al. Leaf water potential measurements using the pressure chamber: Synthetic testing of assumptions towards best practices for precision and accuracy. Plant Cell Environ. 2022, 45, 2037–2061. [Google Scholar] [CrossRef]
- Guo, B.H.; Arndt, S.K.; Miller, R.E.; Szota, C.; Farrell, C. How Does Leaf Succulence Relate to Plant Drought Resistance in Woody Shrubs. Tree Physiol. 2023, 43, 1501–1513. [Google Scholar] [CrossRef]
- Minif, F.L.; Chaieb, M. Effects of water stress on growth phenology photosynthesis and leaf water potential in Stipagrostis ciliata (Desf.) De Winter in North Africa. J. Arid Land. 2022, 15, 77–90. [Google Scholar] [CrossRef]
- Dou, H.T.; Xu, Q.; Lin, T.; Tong, Z.W.; Aili, A.S.J.; Xu, H.L. Metabolic and antioxidant responses drive Haloxylon ammodendron’s adaptation to drip irrigation with saline and freshwater in saline-alkali soils. Environ. Exp. Bot. 2025, 238, 106225. [Google Scholar] [CrossRef]
- Cao, Y.H.; Ren, W.; Gao, H.J.; Lü, X.P.; Zhao, Q.; Zhang, H.; Rensing, C.; Zhang, J.L. HaASR2 from Haloxylon ammodendron confers drought and salt tolerance in plants. Plant Sci. 2023, 328, 111572. [Google Scholar] [CrossRef] [PubMed]
- Qiu, D.D.; Zhu, G.F.; Bhat, M.A.; Wang, L.; Liu, Y.W.; Sang, L.Y.; Lin, X.R.; Zhang, W.H.; Sun, N. Water use strategy of nitraria tangutorum shrubs in ecological water delivery area of the lower inland river: Based on stable isotope data. J. Hydrol. 2023, 624, 129918. [Google Scholar] [CrossRef]
- Tayir, M.; Dai, Y.; Shi, Q.D.; Abdureyim, A.; Erkin, F.; Huang, W.Y. Distinct leaf functional traits of Tamarix chinensis at different habitats in the hinterland of the Taklimakan desert. Front. Plant Sci. 2022, 13, 1094049. [Google Scholar] [CrossRef] [PubMed]
- Fan, B.L.; Ding, N.N.; Tian, T.T.; Gao, P.F.; Wan, Y.K.; Ma, M.J.; Sun, K. Different water and photosynthetic resource use strategies explain the widespread distribution of Dasiphora fruticosa in Qinghai-Tibet Plateau alpine meadows. Environ. Exp. Bot. 2025, 231, 106106. [Google Scholar] [CrossRef]
- Dai, L.C.; Fu, R.Y.; Guo, X.W.; Du, Y.G.; Hu, Z.M.; Cao, G.M. Alpine shrub had a stronger soil water retention capacity than the alpine meadow on the northeastern Qinghai-Tibetan Plateau. Ecol. Indic. 2021, 133, 108362. [Google Scholar] [CrossRef]
- Tu, W.Q.; Lu, W.X.; Gu, J.Q.; Lou, A.R. The species diversity and phylogenetic structure patterns of desert plant communities in the Turpan-Hami region, Xinjiang. Glob. Ecol. Conserv. 2024, 55, e03239. [Google Scholar] [CrossRef]
- Jia, J.; Qu, G.J.; Jia, P.; Li, D.Z.; Yao, Y.F. The contest between artificial management and natural environment determines the adaptive strategies of leaf morphogenesis in Sabina chinensis. Tree Physiol. 2024, 44, tpae060. [Google Scholar] [CrossRef]
- Ma, T.T.; Luo, T.R.; Feng, Z.K.; Yu, Z.; An, J.Y.; Wang, S.; Hu, L.L.; Shao, Y.K.; Zhang, B. Radial Growth Responses of Sabina chinensis (L.) Ant. cv. Kaizuca to Climate Shifts in the Northern Transition Zones of the Yangtze River Delta (YRD) Coastal Region. Forests 2025, 16, 433. [Google Scholar] [CrossRef]
- Hussein, H.A.A.; Alshammari, S.O.; Kenawy, S.K.M.; Elkady, F.M.; Badawy, A.A. Grain-priming with L-arginine improves the growth performance of wheat (Triticum aestivum L.) plants under drought stress. Plants 2022, 11, 1219. [Google Scholar] [CrossRef]
- Khoshru, B.; Mitra, D.; Khoshmanzar, E.; Myo, E.M.; Uniyal, N.; Mahakur, B.; Mohapatra, P.K.D.; Panneerselvam, P.; Boutaj, H.; Alizadeh, M. Current Scenario and Future Prospects of Plant Growth-Promoting Rhizobacteria: An Economic Valuable Resource for the Agriculture Revival under Stressful Conditions. J. Plant Nutr. 2020, 43, 3062–3092. [Google Scholar] [CrossRef]
- Al-Amri, S.M. Application of Bio-Fertilizers for Enhancing Growth and Yield of Common Bean Plants Grown under Water Stress Conditions. Saudi J. Biol. Sci. 2021, 28, 3901–3908. [Google Scholar] [CrossRef]
- Delavaux, C.S.; Smith-Ramesh, L.M.; Kuebbing, S.E. Beyond Nutrients: A Meta-Analysis of the Diverse Effects of Arbuscular Mycorrhizal Fungi on Plants and Soils. Ecology 2017, 98, 2111–2119. [Google Scholar] [CrossRef] [PubMed]
- Abid, M.; Ali, S.; Qi, L.K.; Zahoor, R.; Tian, Z.; Jiang, D.; Snider, J.L.; Dai, T. Physiological and Biochemical Changes During Drought and Recovery Periods at Tillering and Jointing Stages in Wheat (Triticum aestivum L.). Sci. Rep. 2018, 8, 4615. [Google Scholar] [CrossRef] [PubMed]
- Da Costa, M.; Huang, B. Changes in Antioxidant Enzyme Activities and Lipid Peroxidation for Bentgrass Species in Response to Drought Stress. J. Am. Soc. Hortic. Sci. 2007, 132, 319–326. [Google Scholar] [CrossRef]
- Abd Elbar, O.H.; Farag, R.E.; Shehata, S.A. Effect of Putrescine Application on Some Growth, Biochemical and Anatomical Characteristics of Thymus vulgaris L. under Drought Stress. Ann. Agric. Sci. 2019, 64, 129–137. [Google Scholar] [CrossRef]
- Kusvuran, S. Microalgae (Chlorella vulgaris Beijerinck) Alleviates Drought Stress of Broccoli Plants by Improving Nutrient Uptake, Secondary Metabolites, and Antioxidative Defense System. Hortic. Plant J. 2021, 7, 221–231. [Google Scholar] [CrossRef]
- Ahmed, A.H.H.; Darwish, E.; Alobaidy, M.G. Impact of Putrescine and 24-Epibrassinolide on Growth, Yield and Chemical Constituents of Cotton (Gossypium barbadense L.) Plant Grown under Drought Stress Conditions. Asian J. Plant Sci. 2017, 16, 9–23. [Google Scholar]
- Qin, J.; Si, J.H.; Jia, B.; Zhao, C.Y.; Zhou, D.M.; He, X.H.; Wang, C.L.; Zhu, X.L. Water use strategies of Nitraria tangutorum in the lake-basin region of the Badain Jaran Desert. Front. Plant Sci. 2023, 14, 1240656. [Google Scholar] [CrossRef]
- Jia, M.; Colombo, R.; Rossini, M.; Celesti, M.; Zhu, J.; Cogliati, S.; Cheng, T.; Tian, Y.C.; Zhu, Y.; Cao, W.X.; et al. Estimation of leaf nitrogen content and photosynthetic nitrogen use efficiency in wheat using sun-induced chlorophyll fluorescence at the leaf and canopy scales. Eur. J. Agron. 2021, 122, 126192. [Google Scholar] [CrossRef]
- Lei, Z.Y.; Wang, H.; Wright, I.J.; Zhu, X.G.; Niinemets, Ü.; Li, Z.L.; Sun, D.S.; Dong, N.; Zhang, W.F.; Zhou, Z.L.; et al. Enhanced photosynthetic nitrogen use efficiency and increased nitrogen allocation to photosynthetic machinery under cotton domestication. Photosynth. Res. 2021, 150, 239–250. [Google Scholar] [CrossRef]
- Hatfield, J.L.; Dold, C. Water-Use Efficiency: Advances and Challenges in a Changing Climate. Front. Plant Sci. 2019, 10, 103. [Google Scholar] [CrossRef] [PubMed]
- Khoyerdi, F.F.; Shamshiri, M.H.; Estaji, A. Changes in Some Physiological and Osmotic Parameters of Several Pistachio Genotypes under Drought Stress. Sci. Hortic. 2016, 198, 44–51. [Google Scholar] [CrossRef]
- Badawy, A.A.; Alotaibi, M.O.; Abdelaziz, A.M.; Osman, M.S.; Khalil, A.M.A.; Saleh, A.M.; Mohammed, A.E.; Hashem, A.H. Enhancement of Seawater Stress Tolerance in Barley by the Endophytic Fungus Aspergillus ochraceus. Metabolites 2021, 11, 428. [Google Scholar] [CrossRef]
- Lotfi, N.; Vahdati, K.; Amiri, R.; Kholdebarin, B. Drought-Induced Accumulation of Sugars and Proline in Radicle and Plumule of Tolerant Walnut Varieties During Germination Phase. Acta Hortic. 2010, 861, 289–296. [Google Scholar] [CrossRef]
- Liu, B.H.; Cheng, L.; Liang, D.; Zou, Y.J.; Ma, F.W. Growth, Gas Exchange, Water-Use Efficiency, and Carbon Isotope Composition of ‘Gale Gala’ Apple Trees Grafted onto 9 Wild Chinese Rootstocks in Response to Drought Stress. Photosynthetica 2012, 50, 401–410. [Google Scholar] [CrossRef]
- De-Ville, S.; Edmondson, J.; Green, D.; Stirling, R.; Dawson, R.; Stovin, V. Effect of Vegetation Treatment and Water Stress on Evapotranspiration in Bioretention Systems. Water Res. 2024, 252, 121182. [Google Scholar] [CrossRef]
- Sharma, M.; Delta, A.K.; Kaushik, P. Glomus mosseae and Pseudomonas fluorescens Application Sustains Yield and Promote Tolerance to Water Stress in Helianthus annuus L. Stresses 2021, 1, 305–316. [Google Scholar] [CrossRef]
- Richardson, M.; Kumar, P. Discerning the Thermodynamic Feasibility of the Spontaneous Coexistence of Multiple Functional Vegetation Groups. Sci. Rep. 2020, 10, 18321. [Google Scholar] [CrossRef]
- Zhao, Y.J.; Sun, Y.H.; Lu, X.M.; Zhao, X.Z.; Yang, L.; Sun, Z.Y.; Bai, Y.F. Hyperspectral Retrieval of Leaf Physiological Traits and Their Links to Ecosystem Productivity in Grassland Monocultures. Ecol. Indic. 2021, 122, 107267. [Google Scholar] [CrossRef]
- Liu, B.H.; Liang, J.; Tang, G.M.; Wang, X.F.; Liu, F.C.; Zhao, D.C. Drought Stress Affects on Growth, Water use efficiency, Gas Exchange and Chlorophyll Fluorescence of Juglans Rootstocks. Sci. Hortic. 2019, 250, 230–235. [Google Scholar] [CrossRef]
- Kalaji, H.M.; Jajoo, A.; Oukarroum, A.; Brestic, M.; Zivcak, M.; Samborska, I.A.; Cetner, M.D.; Lukasik, I.; Goltsev, V.; Ladle, R.J. Chlorophyll a Fluorescence as a Tool to Monitor Physiological Status of Plants under Abiotic Stress Conditions. Acta Physiol. Plant. 2016, 38, 102. [Google Scholar] [CrossRef]
Disclaimer/Publisher’s Note: The statements, opinions and data contained in all publications are solely those of the individual author(s) and contributor(s) and not of MDPI and/or the editor(s). MDPI and/or the editor(s) disclaim responsibility for any injury to people or property resulting from any ideas, methods, instructions or products referred to in the content. |
© 2025 by the authors. Licensee MDPI, Basel, Switzerland. This article is an open access article distributed under the terms and conditions of the Creative Commons Attribution (CC BY) license (https://creativecommons.org/licenses/by/4.0/).