Article

Enhanced Sequence Evolution Rates Correlate with Significant Rearrangements in Coccoid Mitochondrial Genomes

College of Plant Protection, Henan Agricultural University, Zhengzhou 450046, China
*
Authors to whom correspondence should be addressed.
Diversity 2025, 17(8), 515; https://doi.org/10.3390/d17080515
Submission received: 11 June 2025 / Revised: 21 July 2025 / Accepted: 23 July 2025 / Published: 25 July 2025
(This article belongs to the Section Phylogeny and Evolution)

Abstract

Scale insects, which belong to the superfamily Coccoidea within the order Hemiptera, encompass more than 8000 species worldwide. The adult females of these species are characterized by their immobility, and often lack wings and legs. Scale insects feed on plant tissues and can cause significant agricultural damage as pests. This study presents the sequencing of five coccoid mitogenomes, revealing detailed annotations and comparisons with other Hemiptera. The sequencing yielded between 73 million and over 121 million reads, allowing for the reconstruction of mitogenomes ranging from 12,821 to 14,446 nucleotides. Notably, a high A + T content was observed across the newly sequenced mitogenomes. Gene rearrangements were identified in all five newly sequenced mitogenomes, with the evolutionary rate analysis indicating that Coccoidea exhibit the highest Ka and Ka/Ks values among the hemipterans. In a phylogenetic context, the mitogenomes of representative species from Coccoidea and Aleyrodoidea exhibit more frequent mitochondrial gene rearrangements than those of other hemipteran groups. The analysis suggests that the frequent mitochondrial gene rearrangements observed in the coccoid species are associated with accelerated nucleotide substitution rates, supporting a connection between genetic evolution and structural variation in mitogenomes.

1. Introduction

Mitochondria are essential organelles in insect cells, primarily generating adenosine triphosphate (ATP), the chemical energy source that sustains cellular activities and development [1,2,3]. The mitochondrial genetic system is independent of the nuclear genome, consisting of a distinct set of genes that make up the mitochondrial genome (mitogenome) [1,2]. The gene content and organization of insect mitochondrial genomes are often highly conserved across lineages of insects [4,5]. Typically, these genomes contain a total of 37 genes: 13 protein-coding genes (PCGs), 2 ribosomal RNA (rRNA) genes, and 22 transfer RNA (tRNA) genes [1,4,5]. Additionally, there is a large non-coding region, also known as the control region or AT-rich region, which is believed to be involved in transcription regulation and often has the highest AT content in the entire mitogenome [1,4,5]. The gene arrangement in insect mitogenomes is generally stable, with the fruit fly mitogenome serving as the ancestral pattern observed in most insects [6]. However, exceptions exist in specific lineages. Mitogenome rearrangements have been identified in certain groups within Hymenoptera [7,8,9,10,11], Hemiptera [12,13,14,15,16], Embioptera [17], Trichoptera [18], etc. Among hemipterans, scale insect mitogenomes exhibit the most frequent gene rearrangements [15,16].
Scale insects are small plant-feeding insects. Phylogenetically, they are closely related to aphids. There are more than 8000 species of scale insects across about 32 different families worldwide, classified in the superfamily Coccoidea (Hemiptera: Sternorrhyncha). Scale insects are notable for their unusual external morphology, particularly in adult females. Adult females are typically immobile, lacking wings and often even legs, and remain sedentary on host plants, feeding on either surface or concealed plant tissues. Males, which generally exhibit a less reduced morphology, possess forewings with reduced venation and may have hamulohalteres or lack hind wings entirely. However, males are often shorter-lived. Some coccoid species, belonging to the superfamily Coccoidea of scale insects, are recognized as highly destructive agricultural pests and invasive species due to their reproductive potential and genetic adaptability. Their damage consists of both direct feeding on plants and the transmission of plant pathogens. In China, 63 species, including the gray pineapple mealybug (Dysmicoccus neobrevipes) from the family Pseudococcidae within the superfamily Coccoidea, are classified as quarantine pests.
The traditional classification and systematics of Coccoidea primarily depend on their morphological characteristics. However, classifying these insects based on morphology presents challenges due to a lack of comprehensive scientific research on their various life stages. This difficulty is partly attributed to the fact that many life stages are less conspicuous, have shorter durations, and exert a less direct influence on host plants. Furthermore, there are a limited number of molecular phylogenetic studies focused on scale insects. Mitogenomes, as molecular markers, have been widely used in insect phylogenetics [4,5]. However, there are very few mitogenome sequences available for scale insects. As of 2 April 2025, only 19 complete or nearly complete mitogenomes have been published in GenBank. The number of sequenced mitogenomes of scale insects lags significantly behind other Hemiptera groups, such as the closely related aphids. Despite the limited sequence data, all currently published mitogenomes of scale insects exhibit significant gene rearrangements, making them the group with the most frequent and extensive mitogenome rearrangements within Hemiptera. Therefore, sequencing more mitogenomes of scale insects will provide new insights into the evolution of insect mitogenomes, such as the mechanisms of mitogenome rearrangement.
In this study, we newly sequenced five coccoid mitogenomes and provided detailed characteristic annotations. Specifically, we compared the gene order of coccoid mitogenomes with those of other Hemiptera and other hemimetabolous insects. The potential evolutionary mechanisms of mitogenome rearrangements are discussed within a phylogenetic framework.

2. Materials and Methods

2.1. Specimens and Taxonomy

Five species from the Pseudococcidae family were used for sequencing: Dysmicoccus neobrevipes, Maconellicoccus hirsutus, Phenacoccus solani, Phenacoccus solenopsis, and Pseudococcus baliteus. Adult mealybug specimens were collected during the inspection and quarantine of fruits and other plants at Zhengzhou Airport Port, Henan Province, China, from 2019 to 2023. Species identification was primarily based on comparisons of morphological characteristics and was further verified using DNA barcoding with cox1 gene sequences through BOLD SYSTEMS (https://id.boldsystems.org/, accessed on 8 July 2024). Voucher specimens have been deposited at the Entomological Museum of Henan Agricultural University in Zhengzhou, China, under the following accession numbers: Coccoid_WGS_S37 (D. neobrevipes), Coccoid_WGS_S35 (M. hirsutus), Coccoid_WGS_S31 (P. baliteus), Coccoid_WGS_S34 (P. solani), and Coccoid_RNA-seq_A (P. solenopsis).

2.2. DNA and RNA Extraction

For the species of D. neobrevipes, M. hirsutus, P. solani, and P. baliteus, total genomic DNA was extracted from muscle tissue using the TIANamp Genomic DNA Kit (TIANGEN BIOTECH CO., LTD., Beijing, China) following the manufacturer’s instructions. DNA was quantified with the Quant-iT PicoGreen dsDNA Assay Kit (Invitrogen, Life Technologies, Carlsbad, CA, USA) and its integrity was assessed via electrophoresis on a 2% agarose gel. The DNA was fragmented using a Covaris sonicator E220 (Covaris, Brighton, UK). DNA libraries were constructed with the DNBSEQ DNB Rapid Prep Kit V2.0 (MGI Tech Co., Shenzhen, China) with an insert size of ~400 bp. Whole-genome sequencing was performed on the MGI DNBSEQ-T7 platform (paired-end 150 bp reads). Raw data quality was evaluated using FastQC v0.12.1 [19]. Trimmomatic v0.32 was used to trim adapters and filter out low-quality reads. As a result, the high-quality reads with a Q30 score > 90% were used in the subsequent mitogenome assembly.
For the species P. solenopsis, RNA extraction was performed using Trizol reagent (Invitrogen, Carlsbad, CA, USA) as per the manufacturer’s instructions. This involved homogenizing tissue samples in Trizol, followed by chloroform extraction to separate RNA from proteins and cellular debris. The aqueous phase containing RNA was collected, precipitated with isopropanol, and washed with ethanol to eliminate impurities. Next, cDNA libraries were constructed from 375 bp mRNA fragments using the TruSeq RNA Sample Preparation Kit (Illumina Inc., San Diego, CA, USA). This process included poly-A selection for mRNA enrichment, RNA fragmentation, reverse transcription to synthesize cDNA, and PCR amplification. Library quantification was conducted with the Quant-iT PicoGreen dsDNA Assay Kit (Invitrogen, Life Technologies, Carlsbad, CA, USA) to measure double-stranded DNA concentration accurately. Quality assessment of the libraries was performed using an Agilent 2100 Bioanalyzer (Santa Clara, CA, USA) to evaluate size distribution and concentration. RNA sequencing was carried out on the Illumina NextSeq 500 platform (San Diego, CA, USA) with paired-end 150 bp reads. To ensure high data quality, we applied stringent quality control measures akin to those used for genomic sequencing. We filtered out low-quality reads and retained only high-quality data with a Q30 score greater than 90%, ensuring reliable data for subsequent mitogenome assembly and analysis.

2.3. Mitogenome Assembly and Annotation

We used GetOrganelle v1.7.5 [20] for the de novo assembly of the mitogenomes for both whole-genome and transcriptome sequencing results, employing a wide range of k-mers with the following parameter settings: −k 21, 45, 65, 85, 105. The option “animal_mt” was selected as the preferred organelle genome type database (−F animal_mt). Geneious R11 was used to map the mitochondrial contigs to obtain coverage statistics [21].
Mitogenome annotation was preliminarily performed using MITOS v2 [22]. The gene boundaries of protein-coding genes and rRNA genes were refined by aligning them with closely related species. The annotation of tRNAs was primarily conducted using MITOS2 [22] and cross-referenced with results from ARWEN v1.2.3 [23]. PhyloSuite v1.2.3 [24] was utilized to extract annotated genes from newly sequenced and published insect mitogenomes, and to generate a gene order map for each analyzed mitogenome. We used the CREx v2 [25] program to heuristically infer the rearrangement scenarios between the new mitogenomes and those with a putative ancestral gene order.

2.4. Sequence Alignment and Evolution Rate Analysis of Protein-Coding Genes

Each of the 13 protein-coding genes was individually aligned using TranslatorX (http://www.translatorx.co.uk/, accessed on 21 July 2024) [26], which performed multiple alignments of nucleotide sequences guided by amino acid translations. Parameters included the Invertebrate Mitochondrial genetic code and Muscle v3 [27] for protein alignment. Gene alignments were manually trimmed based on codons to remove columns with >30% gaps. Stop codons were also eliminated. Trimmed alignments were concatenated into supermatrices using FASconCAT-G v1.04 [28], with the option “-l” for additional partition file output. We used DnaSP v. 5 [29] to estimate the values of the synonymous substitution rate (Ks) and nonsynonymous substitution rate (Ka). Correlation analyses between mitochondrial gene rearrangement numbers and Ka, Ks, or Ka/Ks values were performed using Microsoft Excel.

2.5. Phylogenetic Analysis

To investigate the evolution of mitochondrial gene order among scale insects and their hemipteran relatives within a phylogenetic framework, we analyzed representative species from four suborders: Sternorrhyncha, Auchenorrhyncha, Coleorrhyncha, and Heteroptera (Table S1). Additionally, five species from Orthoptera were included as the outgroup.
Tree reconstruction was performed using the Maximum Likelihood (ML) method. Partitioned ML analyses were conducted with IQ-TREE version 2.2.15 [30], utilizing the nucleotide matrix. Partition files generated by FASconCAT-G v1.04 [28] were used for each analysis, enabling each partition to have its own evolutionary rate with the “−p” option [31]. The best-fitting substitution models for each partition were automatically selected by ModelFinder v1.1 [32]. Node support values (BS) were estimated using ultrafast bootstrapping with 1000 replicates [33].

3. Results

3.1. General Characteristics of New Mitogenomes

The statistics regarding genome and transcriptome sequencing are available in Table 1. Genome sequencing generated between 73,858,913 reads (P. baliteus) and 121,628,353 reads (M. hirsutus). The number of matched mitochondrial reads ranged from 80,697 (D. neobrevipes) to 500,853 (M. hirsutus). Mean coverage ranged from 776× (D. neobrevipes) to 5089× (M. hirsutus). Transcriptome sequencing for P. solenopsis generated a total of 62,424,175 clean reads, 61,214 of which were mitochondrial reads. The mean coverage of the mitochondrial contig is 770.
The newly reconstructed mitogenomes for two species, M. hirsutus and P. solani, are nearly complete. These mitogenome sequences have lengths of 14,446 bp and 14,300 bp, respectively. The mitogenome of M. hirsutus contains 32 out of the typical 37 mitochondrial genes, with 5 tRNA genes (trnA, trnL1, trnR, trnV, and trnY) missing. In contrast, the mitogenome of P. solani has 29 genes, with the protein-coding gene nad1 and 7 tRNA genes (trnC, trnF, trnK, trnL1, trnQ, trnS2, and trnY) absent. The three remaining mitogenomes vary in length, ranging from 11,557 bp in P. solenopsis to 14,118 bp in D. neobrevipes. D. neobrevipes contains 26 genes, P. baliteus has 24 genes, and P. solenopsis has 23 genes. All five new mitogenomes exhibit significant A + T composition, with A + T content ranging from 89.7% in P. solenopsis to 91.6% in D. neobrevipes. The major strand shows negative AT skew, ranging from −0.353 in M. hirsutus to −0.178 in P. baliteus and −0.056 in P. solenopsis.

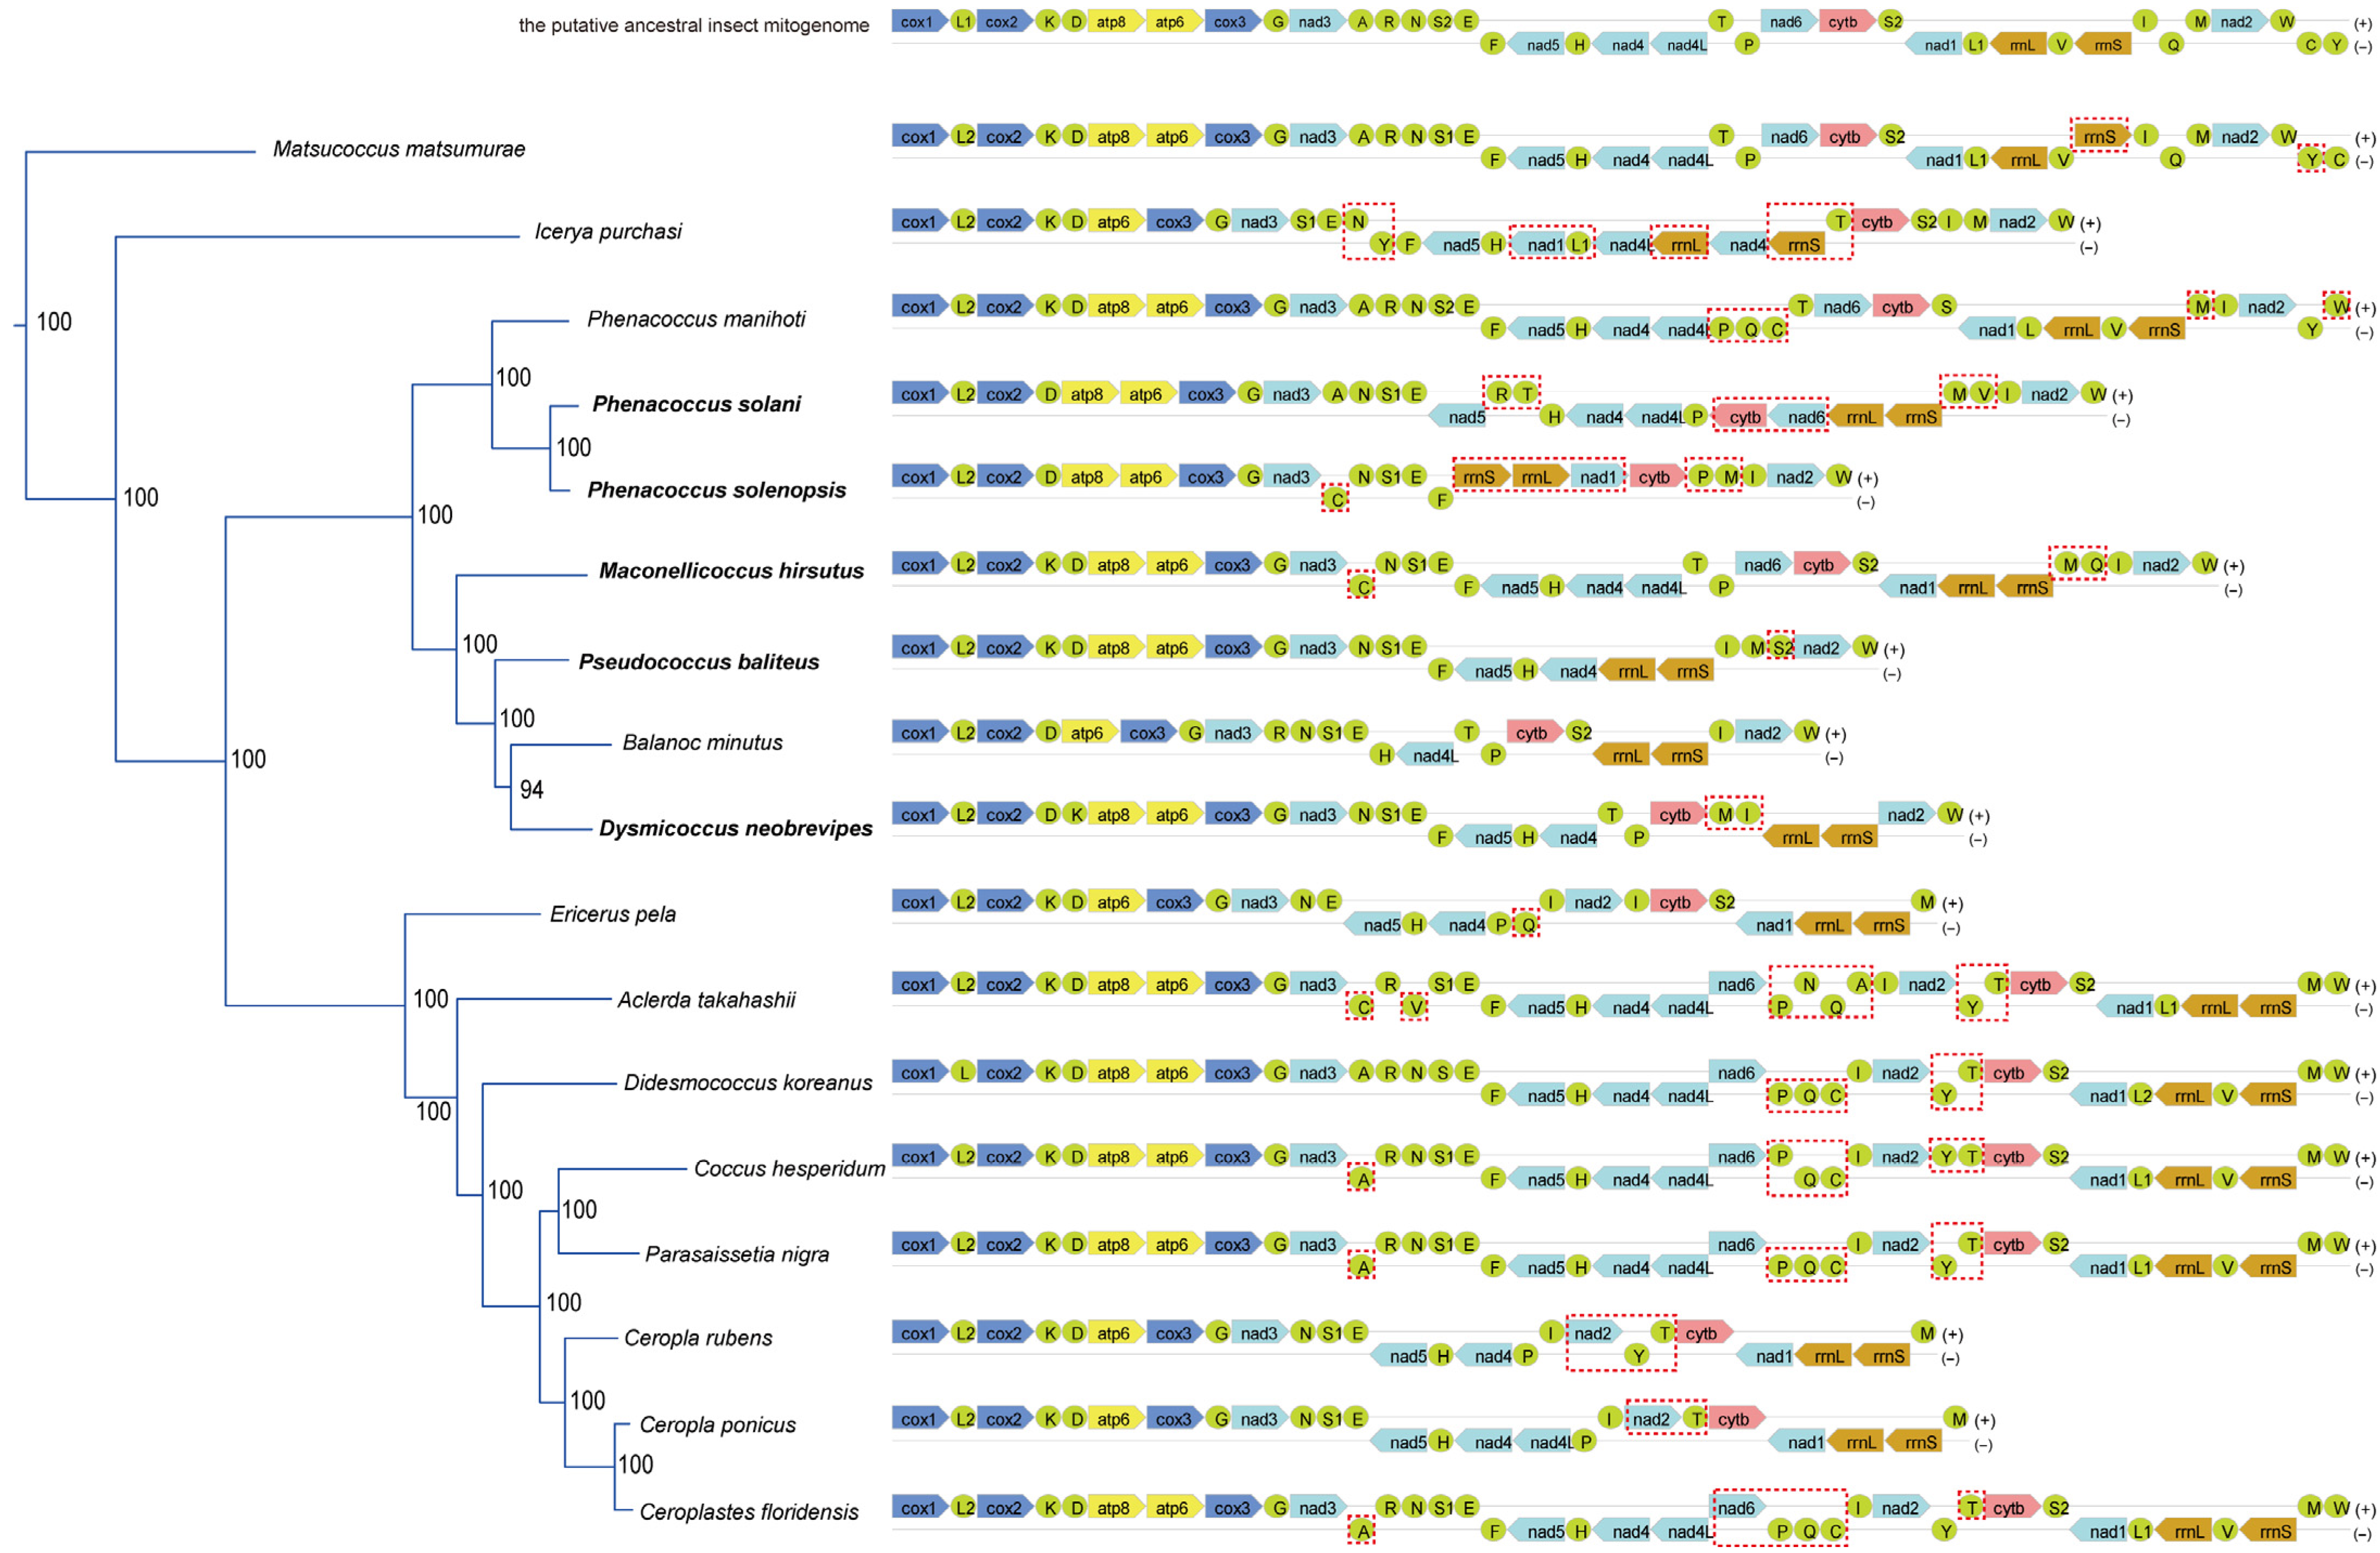
3.2. Rearrangement Patterns in Mitogenomes and Evolution Rate Analysis

Gene rearrangements have been identified in all five newly sequenced mitogenomes (Figure 1). Compared to the putative ancestral mitogenome, the following changes were observed: tRNA genes C, M, Q, and I in M. hirsutus; tRNA genes R, T, M, V, and I, and the protein-coding genes cytb and nad6 in P. solani; tRNA gene clusters DK and MI in D. neobrevipes; tRNA genes M, I, and S2 in P. baliteus; and tRNA genes C, P, M, and I, the protein-coding genes nad1 and cytb, and the two rRNA genes rrnS and rrnL in P. solenopsis.
The CREx analyses revealed the following events in the new mitogenomes that led to the observed rearrangement patterns. M. hirsutus: inversion (M) and inverse transposition (Q, M and I); P. solani: transposition (R, N, S1, E and nad5), transposition (H, nad4, nad4L, T), inversion (V), tdrl (rrnS, M, V and I), and inversion (nad6 and cytb); D. neobrevipes: transposition (K and D), inversion (I), inversion (M), and inverse transposition (I, M, rrnL and rrnS); P. baliteus: transposition (S2, rrnL, rrnS, I and M); P. solenopsis: transposition (N, S1, E, F, P, cytb, nad1, rrnL, rrnS, I, M, nad2, W and C), transposition (I and M), inversion (P, cytb, nad1, rrnL and rrnS), and inversion (cytb).
The evolutionary rate analysis showed that the mitogenome sequences of Coccoidea have the highest Ka and Ka/Ks values (Table S2). Among other groups, Aleyrodoidea exhibited the second highest Ka values. Correlation analysis revealed that the number of mitochondrial gene rearrangements is correlated with the Ka values (correlation coefficient = 0.55).

3.3. Phylogenetic Inference

Within Hemiptera, the monophyly of the suborders Sternorrhyncha, Coleorrhyncha, and Heteroptera were supported, but not Auchenorrhyncha (Figure S1). The infraorders Cicadomorpha and Fulgoromorpha were recovered as separate clades, rendering Auchenorrhyncha non-monophyletic. Both nucleotide and amino acid datasets yielded identical tree topologies for the superfamily relationships within Sternorrhyncha. Coccoidea was identified as the sister group to Aphidoidea, with strong support (BS = 100), and both were sister groups to Aleyrodoidea. Psylloidea was a sister group to all other Sternorrhyncha.
The two newly sequenced Phenacoccus species, P. solani and P. solenopsis, clustered together as sister species to P. manihoti. The other three newly sequenced species—M. hisutus, P. baliteus, and D. neobrevipes—formed a separate clade with B. minutus. Together, all seven species formed a clade corresponding to the monophyletic family Pseudococcidae.

4. Discussion

CREx analysis suggests that tandem duplication followed by random loss (TDRL) explains rearrangements in coccoid mitogenomes, a dominant mechanism in vertebrate mitochondrial genomes [9]. A previous study also proposed TDRL as a likely mechanism for gene shuffling in insect mitochondrial genomes [15].
The mitochondrial gene rearrangements have been found in many insect orders (Hymenoptera: [7,8,9,10,11]; Psocopdea: Shao et al., 2001 [34]; Shao and Barker 2003 [35]; Yoshizawa et al., 2018 [36]; Hemiptera: [16], Trichoptera: [18]; Embioptera: [17]). The rate of mitochondrial gene rearrangement varies significantly among orders and even among lineages within a single order [37]. Hemiptera, the largest order of hemimetabolous insects, encompasses over 100,000 described species worldwide. This order includes four suborders: Sternorrhyncha (aphids, scale bugs, whiteflies, and psyllids), Auchenorrhyncha (planthoppers, cicadas, leafhoppers, spittlebugs, and froghoppers), Coleorrhyncha (moss bugs), and Heteroptera (true bugs) [18,23]. Among these, the mitogenomes of scale bugs and whiteflies within Sternorrhyncha exhibit a higher rate of gene rearrangements compared to other hemipteran lineages. Published coccoid and newly determined mealybug mitogenomes show significant gene rearrangements. In contrast, there is little to no variation in gene arrangement among species within the other superfamilies of Sternorrhyncha and the three remaining hemipteran suborders. This study revealed a taxonomic correlation in mitochondrial gene rearrangement rates at the superfamily level in Hemiptera.
The rearrangement of mitochondrial genomes in insects is influenced by a variety of factors, including evolutionary dynamics, selective pressures, and the inherent characteristics of mitochondrial DNA. Several studies have explored these aspects, providing insights into the mechanisms driving mitochondrial gene rearrangements. One significant factor contributing to mitochondrial genome rearrangement is the evolutionary dynamics within specific insect groups. For instance, Wei et al. (2014) highlighted independent rearrangements of protein-coding genes in the families Bethylidae and Mutillidae, suggesting that these changes may be driven by lineage-specific evolutionary pressures [8]. Similarly, Mao et al. (2014) noted that the Evaniomorpha group exhibits an intermediate rate of gene rearrangement, indicating that different taxa may experience varying rates of genomic change due to their unique ecological and evolutionary contexts [9]. Selective neutrality has also been proposed as a factor influencing tRNA gene positioning within mitochondrial genomes. Dowton et al. (2009) found evidence that mitochondrial tRNA gene arrangements are selectively neutral in Hymenoptera, implying that while rearrangements occur, they do not necessarily confer a selective advantage or disadvantage [10]. In addition to these factors, studies such as those by Zhang et al. (2013) and Kômoto et al. (2012) have documented novel gene rearrangements in specific insect lineages [12,17], further illustrating how unique evolutionary paths can lead to distinct mitochondrial genome architectures. In the case of scale insects, this study shows that certain mitochondrial genes are prone to rearrangement due to their close proximity within the genome. For instance, gene rearrangements associated with the tRNA clusters C-Y and T-P are observed in several species.
In DNA sequences, AT-rich regions and GC-rich regions exhibit different mutation rates, with AT-rich regions generally mutating more easily. In this study, 10 out of 17 coccoid mitogenomes analyzed showed the highest A + T content among insects, ranging from 87% to 91%. This exceptionally high A + T content corresponds to the Apocrita suborder of Hymenoptera [8], which also includes many species with frequent mitochondrial gene rearrangements. Base substitution mutations are a major source of genetic novelty [38]. In Plasmodium falciparum, high A + T content is linked to genome-wide patterns of de novo mutation [39]. The exceptionally high A + T content of coccoid mitogenomes is likely to be a factor associated with frequent mitochondrial gene rearrangements.
Previous research by Shao et al. (2003) demonstrated a correlation between mitochondrial gene rearrangement rates and nucleotide substitution [40]. Our findings corroborate this relationship. In our analysis of evolutionary rates, we found that coccoid mitogenomes exhibited the highest values of Ka and Ka/Ks ratios. This observation suggests that the increased rate of sequence substitution may drive the occurrence of mitochondrial gene rearrangements in Coccoidea.
Besides the high A + T content, the frequent mitochondrial genome rearrangements observed in scale insects can be attributed to several interrelated factors, including their unique lifestyle and reproductive strategies. Scale insects are primarily sessile, feeding on plant sap, which has significant implications for their evolutionary dynamics [41,42]. This sedentary lifestyle may reduce gene flow between populations, leading to isolated evolutionary pressures that can promote genomic rearrangements [41,43]. The lack of mobility may also contribute to a more stable environment where specific adaptations can become fixed over generations, resulting in a higher incidence of mitochondrial gene rearrangement as a means of genetic diversification [43,44]. Additionally, the reproductive strategies of scale insects often involve parthenogenesis (asexual reproduction), which can lead to rapid population expansion and increased genetic drift [41,43,45]. The combination of these factors creates an environment conducive to frequent rearrangements as populations adapt to varying ecological niches or respond to selective pressures from host plants.

5. Conclusions

In this study, the five newly sequenced mealybug mitogenomes underwent gene rearrangements involving tRNA genes, protein-coding genes, and ribosomal RNA genes. Phylogenetic comparisons revealed that mitogenomes of Coccoidea exhibit much more frequent gene rearrangements than those of other groups within Hemiptera. The analysis of the synonymous and nonsynonymous substitution rates revealed that the Coccoidea mitogenomes exhibit both the highest Ka values and Ka/Ks ratios among the examined groups. This suggests a correlation between extensive mitogenome rearrangements and accelerated sequence evolution in coccoids.

Supplementary Materials

The following supporting information can be downloaded at: https://www.mdpi.com/article/10.3390/d17080515/s1, Table S1: Taxonomy, accession numbers, and mitogenome sequence lengths of species in the phylogenetic analysis. Table S2: Evolutionary rate analysis of mitogenome sequences. Figure S1: The complete maximum likelihood (ML) tree, based on a nucleotide data matrix consisting of 10,977 nucleotide sites, is presented here. The numbers at the nodes represent the bootstrap support values. On the right, the mitogenome structures for each species are illustrated. Species within the clade that share identical mitogenome structures are represented by a single mapping. The red color highlights the gene that has undergone rearrangement. Due to the large number of terminal species included in this tree, it has been divided into three separate pages. On the left side, the gray box indicates the position of this page within the overall tree structure. Arrows are used to illustrate the connections between the previous and subsequent sections.

Author Contributions

Conceptualization: N.S. and Y.X.; methodology, software, data collection, and curation, L.Z., J.J., N.S. and Y.X.; resources, N.S.; formal analysis, L.Z., J.J. and N.S.; writing—original draft preparation, N.S. and J.J.; writing—review and editing, L.Z., J.J., N.S. and Y.X.; supervision, N.S. and Y.X.; funding acquisition, L.Z. and N.S. All authors have read and agreed to the published version of the manuscript.

Funding

This work was supported by the National Natural Science Foundation of China (grant number: 32470470) and the Natural Science Foundation of Henan Province (252300420190).

Institutional Review Board Statement

Not applicable.

Data Availability Statement

Raw Illumina reads have been deposited in the NCBI Sequence Read Archive (BioProject: PRJNA1099799, https://www.ncbi.nlm.nih.gov/bioproject/?term=PRJNA1099799, accessed on 20 April 2024). The accession numbers for the whole-genome and transcriptome sequencing data are as follows: Dysmicoccus neobrevipes: SRR28672255, Maconellicoccus hirsutus: SRR28672260, Pseudococcus baliteus: SRR28671608, Phenacoccus solani: SRR28671903, and Phenacoccus solenopsis: SRR28672339. Additionally, the new mitogenome sequences have been submitted to GenBank with accession numbers PV541151-PV541155.

Conflicts of Interest

The authors declare no conflicts of interest.

References

  1. Boore, J.L. Animal mitochondrial genomes. Nucl. Acids Res. 1999, 27, 1767–1780. [Google Scholar] [CrossRef] [PubMed]
  2. Chandel, N.S. Mitochondria. Cold Spring Harb. Perspect. Biol. 2021, 13, a040543. [Google Scholar] [CrossRef] [PubMed]
  3. Chinnery, P.F.; Schon, E.A. Mitochondria. J. Neurol. Neurosurg. Psychiat. 2003, 74, 1188–1199. [Google Scholar] [CrossRef] [PubMed]
  4. Cameron, S.L. How to sequence and annotate insect mitochondrial genomes for systematic and comparative genomics research. Syst. Entomol. 2014, 39, 400–411. [Google Scholar] [CrossRef]
  5. Cameron, S.L. Insect mitochondrial genomics: Implications for evolution and phylogeny. Annu. Rev. Entomol. 2014, 59, 95–117. [Google Scholar] [CrossRef] [PubMed]
  6. Boore, J.L.; Brown, W.M. Big trees from little genomes: Mitochondrial gene order as a phylogenetic tool. Curr. Opin. Genet. Dev. 1998, 8, 668–674. [Google Scholar] [CrossRef] [PubMed]
  7. Wei, S.-J.; Shi, M.; Sharkey, M.J.; van Achterberg, C.; Chen, X.-X. Comparative mitogenomics of Braconidae (Insecta: Hymenoptera) and the phylogenetic utility of mitochondrial genomes with special reference to Holometabolous insects. BMC Genom. 2010, 11, 371. [Google Scholar] [CrossRef] [PubMed]
  8. Wei, S.-J.; Li, Q.; van Achterberg, K.; Chen, X.-X. Two mitochondrial genomes from the families Bethylidae and Mutillidae: Independent rearrangement of protein-coding genes and higher-level phylogeny of the Hymenoptera. Mol. Phylogenet. Evol. 2014, 77, 1–10. [Google Scholar] [CrossRef] [PubMed]
  9. Mao, M.; Gibson, T.; Dowton, M. Evolutionary dynamics of the mitochondrial genome in the Evaniomorpha (Hymenoptera)—A group with an intermediate rate of gene rearrangement. Genome Biol Evol. 2014, 6, 1862–1874. [Google Scholar] [CrossRef] [PubMed]
  10. Dowton, M.; Cameron, S.L.; Dowavic, J.I.; Austin, A.D.; Whiting, M.F. Characterization of 67 mitochondrial tRNA gene rearrangements in the Hymenoptera suggests that mitochondrial tRNA gene position is selectively neutral. Mol. Biol. Evol. 2009, 26, 1607–1617. [Google Scholar] [CrossRef] [PubMed]
  11. Dowton, M.; Austin, A.D. Evolutionary dynamics of a mitochondrial rearrangement “hot spot” in the Hymenoptera. Mol. Biol. Evol. 1999, 16, 298–309. [Google Scholar] [CrossRef] [PubMed]
  12. Zhang, K.-J.; Zhu, W.-C.; Rong, X.; Zhang, Y.-K.; Ding, X.-L.; Liu, J.; Chen, D.-S.; Du, Y.; Hong, X.-Y. The complete mitochondrial genomes of two rice planthoppers, Nilaparvata lugens and Laodelphax striatellus: Conserved genome rearrangement in Delphacidae and discovery of new characteristics of atp8 and tRNA genes. BMC Genom. 2013, 14, 417. [Google Scholar] [CrossRef] [PubMed]
  13. Thao, M.L.; Baumann, L.; Baumann, P. Organization of the mitochondrial genomes of whiteflies, aphids, and psyllids (Hemiptera, Sternorrhyncha). BMC Evol. Biol. 2004, 4, 25. [Google Scholar] [CrossRef] [PubMed]
  14. Song, N.; Liang, A.-P. Complete mitochondrial genome of the small brown planthopper, Laodelphax striatellus (Delphacidae: Hemiptera), with a novel gene order. Zool. Sci. 2009, 26, 851–860. [Google Scholar] [CrossRef] [PubMed]
  15. Lu, C.; Huang, X.; Deng, J. Mitochondrial genomes of soft scales (Hemiptera: Coccidae): Features, structures and significance. BMC Genom. 2023, 24, 37. [Google Scholar] [CrossRef] [PubMed]
  16. Liu, H.-L.; Chen, Q.-D.; Chen, S.; Pu, D.-Q.; Chen, Z.-T.; Liu, Y.-Y.; Liu, X. The highly rearranged mitochondrial genomes of three economically important scale insects and the mitochondrial phylogeny of Coccoidea (Hemiptera: Sternorrhyncha). PeerJ 2020, 8, e9932. [Google Scholar] [CrossRef] [PubMed]
  17. Kômoto, N.; Yukuhiro, K.; Tomita, S. Novel gene rearrangements in the mitochondrial genome of a webspinner, Aposthonia japonica (Insecta: Embioptera). Genome 2012, 55, 222–233. [Google Scholar] [CrossRef] [PubMed]
  18. Ge, X.; Peng, L.; Vogler, A.P.; Morse, J.C.; Yang, L.; Sun, C.; Wang, B. Massive gene rearrangements of mitochondrial genomes and implications for the phylogeny of Trichoptera (Insecta). Syst. Entomol. 2023, 48, 278–295. [Google Scholar] [CrossRef]
  19. Andrews, S. FastQC: A Quality Control Tool for High Throughput Sequence Data; Babraham Institute: Cambridge, UK, 2010. [Google Scholar]
  20. Jin, J.-J.; Yu, W.-B.; Yang, J.-B.; Song, Y.; DePamphilis, C.W.; Yi, T.-S.; Li, D.-Z. GetOrganelle: A fast and versatile toolkit for accurate de novo assembly of organelle genomes. Genome Biol. 2020, 21, 241. [Google Scholar] [CrossRef] [PubMed]
  21. Kearse, M.; Moir, R.; Wilson, A.; Stones-Havas, S.; Cheung, M.; Sturrock, S.; Buxton, S.; Cooper, A.; Markowitz, S.; Duran, C. Geneious Basic: An integrated and extendable desktop software platform for the organization and analysis of sequence data. Bioinfo 2012, 28, 1647–1649. [Google Scholar] [CrossRef] [PubMed]
  22. Bernt, M.; Donath, A.; Jühling, F.; Externbrink, F.; Florentz, C.; Fritzsch, G.; Pütz, J.; Middendorf, M.; Stadler, P.F. MITOS: Improved de novo metazoan mitochondrial genome annotation. Mol. Phylogenet. Evol. 2013, 69, 313–319. [Google Scholar] [CrossRef] [PubMed]
  23. Laslett, D.; Canbäck, B. ARWEN: A program to detect tRNA genes in metazoan mitochondrial nucleotide sequences. Bioinfo 2008, 24, 172–175. [Google Scholar] [CrossRef] [PubMed]
  24. Xiang, C.Y.; Gao, F.; Jakovlić, I.; Lei, H.P.; Hu, Y.; Zhang, H.; Zou, H.; Wang, G.T.; Zhang, D. Using PhyloSuite for molecular phylogeny and tree-based analyses. Imeta 2023, 2, e87. [Google Scholar] [CrossRef] [PubMed]
  25. Bernt, M.; Merkle, D.; Ramsch, K.; Fritzsch, G.; Perseke, M.; Bernhard, D.; Schlegel, M.; Stadler, P.F.; Middendorf, M. CREx: Inferring genomic rearrangements based on common intervals. Bioinfo 2007, 23, 2957–2958. [Google Scholar] [CrossRef] [PubMed]
  26. Abascal, F.; Zardoya, R.; Telford, M.J. TranslatorX: Multiple alignment of nucleotide sequences guided by amino acid translations. Nucl. Acids Res. 2010, 38, W7–W13. [Google Scholar] [CrossRef] [PubMed]
  27. Edgar, R.C. MUSCLE: Multiple sequence alignment with high accuracy and high throughput. Nucl. Acids Res. 2004, 32, 1792–1797. [Google Scholar] [CrossRef] [PubMed]
  28. Kück, P.; Longo, G.C. FASconCAT-G: Extensive functions for multiple sequence alignment preparations concerning phylogenetic studies. Front. Zool. 2014, 11, 81. [Google Scholar] [CrossRef] [PubMed]
  29. Librado, P.; Rozas, J. DnaSP v5: A software for comprehensive analysis of DNA polymorphism data. Bioinfo 2009, 25, 1451–1452. [Google Scholar] [CrossRef] [PubMed]
  30. Minh, B.Q.; Schmidt, H.A.; Chernomor, O.; Schrempf, D.; Woodhams, M.D.; Von Haeseler, A.; Lanfear, R. IQ-TREE 2: New models and efficient methods for phylogenetic inference in the genomic era. Mol. Biol. Evol. 2020, 37, 1530–1534. [Google Scholar] [CrossRef] [PubMed]
  31. Chernomor, O.; Von Haeseler, A.; Minh, B.Q. Terrace aware data structure for phylogenomic inference from supermatrices. Syst. Biol. 2016, 65, 997–1008. [Google Scholar] [CrossRef] [PubMed]
  32. Kalyaanamoorthy, S.; Minh, B.Q.; Wong, T.K.; Von Haeseler, A.; Jermiin, L.S. ModelFinder: Fast model selection for accurate phylogenetic estimates. Nat. Methods 2017, 14, 587–589. [Google Scholar] [CrossRef] [PubMed]
  33. Minh, B.Q.; Nguyen, M.A.T.; Von Haeseler, A. Ultrafast approximation for phylogenetic bootstrap. Mol. Biol. Evol. 2013, 30, 1188–1195. [Google Scholar] [CrossRef] [PubMed]
  34. Shao, R.; Campbell, N.J.; Barker, S.C. Numerous gene rearrangements in the mitochondrial genome of the wallaby louse, Heterodoxus macropus (Phthiraptera). Mol. Biol. Evol. 2001, 18, 858–865. [Google Scholar] [CrossRef] [PubMed]
  35. Shao, R.; Barker, S.C. The highly rearranged mitochondrial genome of the plague thrips, Thrips imaginis (Insecta: Thysanoptera): Convergence of two novel gene boundaries and an extraordinary arrangement of rRNA genes. Mol. Biol. Evol. 2003, 20, 362–370. [Google Scholar] [CrossRef] [PubMed]
  36. Yoshizawa, K.; Johnson, K.P.; Sweet, A.D.; Yao, I.; Ferreira, R.L.; Cameron, S.L. Mitochondrial phylogenomics and genome rearrangements in the barklice (Insecta: Psocodea). Mol. Phylogenet. Evol. 2018, 119, 118–127. [Google Scholar] [CrossRef] [PubMed]
  37. Song, N.; Wei, S.-J.; Wang, M. Mitochondrial genome rearrangements and phylogenomics of the Hymenoptera (Insecta) using an expanded taxon sample. Mitochondrial DNA A 2023, 34, 49–65. [Google Scholar] [CrossRef] [PubMed]
  38. Weller, A.M.; Rödelsperger, C.; Eberhardt, G.; Molnar, R.I.; Sommer, R.J. Opposing forces of A/T-biased mutations and G/C-biased gene conversions shape the genome of the nematode Pristionchus pacificus. Genetics 2014, 196, 1145–1152. [Google Scholar] [CrossRef] [PubMed]
  39. Hamilton, W.L.; Claessens, A.; Otto, T.D.; Kekre, M.; Fairhurst, R.M.; Rayner, J.C.; Kwiatkowski, D. Extreme mutation bias and high AT content in Plasmodium falciparum. Nucl. Acids Res. 2017, 45, 1889–1901. [Google Scholar] [PubMed]
  40. Shao, R.; Dowton, M.; Murrell, A.; Barker, S.C. Rates of gene rearrangement and nucleotide substitution are correlated in the mitochondrial genomes of insects. Mol. Biol. Evol. 2003, 20, 1612–1619. [Google Scholar] [CrossRef] [PubMed]
  41. Gullan, P.J.; Kosztarab, M. Adaptations in scale insects. Annu. Rev. Entomol. 1997, 42, 23–50. [Google Scholar] [CrossRef] [PubMed]
  42. Hardy, N.B.; Gullan, P.J.; Hodgson, C.J. A subfamily-level classification of mealybugs (Hemiptera: Pseudococcidae) based on integrated molecular and morphological data. Syst. Entomol. 2008, 33, 51–71. [Google Scholar] [CrossRef]
  43. Normark, B.B. The evolution of alternative genetic systems in insects. Annu. Rev. Entomol. 2003, 48, 397–423. [Google Scholar] [CrossRef] [PubMed]
  44. Shao, R.; Kirkness, E.F.; Barker, S.C. The single mitochondrial chromosome typical of animals has evolved into 18 minichromosomes in the human body louse, Pediculus humanus. Genome Res. 2009, 19, 904–912. [Google Scholar] [CrossRef] [PubMed]
  45. Ross, L. Genetic Conflict and Sex Allocation in Scale Insects. Ph.D. Thesis, University of Groningen, Groningen, The Netherlands, 2010. [Google Scholar]
Figure 1. Mapping and comparison of the mitogenome structures of Coccoidea based on a maximum likelihood (ML) tree derived from a nucleotide data matrix comprising 10,977 nucleotide sites. The left tree illustrates the partition that includes only the Coccoidea, extracted from the overall maximum likelihood (ML) tree topology. The numbers at the nodes indicate the bootstrap support values. Species that were newly sequenced in this study are highlighted in bold. The complete tree, which encompasses all terminals, is presented in Figure S1. The image on the right illustrates the genome organization of the included coccoid species, with gene rearrangements highlighted by red dashed boxes. Color coding in the genome structure is as follows: blue: cox1-3, yellow: atp6 and atp8, cyan: nad1-6 and nad4L, pink: cytb, orange: rrnS and rrnL, green: 22 tRNA genes.
Diversity 17 00515 g001
Table 1. Statistics of genome and transcriptome sequencing for newly sequenced species in this study.
Species NameData TypeNumber of Clean ReadsMitochondrial Contigs Matched ReadsMitochondrial Contig LengthsMean CoverageMaximum Coverage
D. neobrevipesGenome84,116,61280,69714,1187763774
M. hirsutusGenome121,628,353500,85314,446508928,787
P. baliteusGenome73,858,91380,71512,8218433039
P. solaniGenome96,691,26185,02114,3008552916
P. solenopsisTranscriptome62,424,17561,21411,5577702924
Disclaimer/Publisher’s Note: The statements, opinions and data contained in all publications are solely those of the individual author(s) and contributor(s) and not of MDPI and/or the editor(s). MDPI and/or the editor(s) disclaim responsibility for any injury to people or property resulting from any ideas, methods, instructions or products referred to in the content.

