Article

Reconstruction of Pleistocene Evolutionary History of the Root Vole Alexandromys oeconomus (Cricetidae, Rodentia) in Northern Asia

by
Tatyana V. Petrova
1,*,
Andrey A. Lissovsky
2,
Semyon Yu. Bodrov
1,
Aivar V. Kuular
3,
Nikolay I. Putintsev
3,
Munkhtsog Bariushaa
4 and
Natalia I. Abramson
1,*
1
Laboratory of Evolutionary Genomics and Paleogenomics, Zoological Institute of Russian Academy of Sciences (RAS), Saint Petersburg 199034, Russia
2
Laboratory of Mammalian Microevolution, A.N. Severtsov Institute of Ecology and Evolution, RAS, Moscow 119071, Russia
3
Department of Biology and Ecology, Tuvan State University, Lenina Str. 36, Kyzyl 667000, Russia
4
Institute of Biology, Mongolian Academy of Sciences, Ulaanbaatar 13330, Mongolia
*
Authors to whom correspondence should be addressed.
Diversity 2025, 17(7), 497; https://doi.org/10.3390/d17070497
Submission received: 29 June 2025 / Revised: 15 July 2025 / Accepted: 18 July 2025 / Published: 20 July 2025

Abstract

Previous phylogeographic study of the root vole (Alexandromys oeconomus) revealed four mitochondrial cytochrome b lineages—North and Central European, North (=Central) Asian and Beringian. Three of them were studied in detail, while the North Asian lineage, which occupies the most extensive territory and is considered to be the place of origin for the species, was understudied. In the framework of the current study, we obtained 95 new sequences (34 localities) from the wide territory of Northern Asia and in total, examined 940 specimens from 181 localities throughout the species’ distribution range. The North Asian lineage was found to be more diverse than the Beringian and the European lineages. Southern Siberia and especially the Altai–Sayan region displayed the highest haplotype and nucleotide diversity, suggesting the region’s role as a genetic diversity hotspot. We suppose that the expansion of the North Asian lineage started from Western Transbaikalia. Its representatives colonised the territory from the Urals to the northern shore of the Okhotsk Sea, and then spread in the opposite direction, to Southern Siberia. As a result, a mixture of haplogroups is observed in the Altai–Sayan region. According to the BEAST analysis calibrated with the first A. oeconomus records, the MRCA of North Asian and Beringian lineages is dated back to ~0.82 Mya, and the first divergence within the North Asian lineage may have occurred ~0.6 Mya. When compared with colonisation times of other representatives of the Arvicolinae subfamily, our dating seems to be overestimated. In this regard, molecular data for dated fossil remains of the root vole are essential for subsequent studies.

Graphical Abstract

1. Introduction

The root, or tundra vole (Alexandromys oeconomus Pallas, 1776), is a widespread species inhabiting wet meadows of both Arctic and temperate zones from northwestern Europe through north and central Asia to Alaska and western Canada. The species is among the earliest rootless voles documented in the fossil record, found in Pleistocene deposits of Eurasia. Its ancestral form—Microtus minoeconomus Zheng and Cai, 1991—was found in Danangou (Nihewan Basin, northern China) since 1.2 Mya [1]. The first remains of A. oeconomus are reported from very similar age deposits in Asia, the Transbaikal region, site Zasukhino [2] and south of European Russia, Volgo–Don basin [3]. These sites refer to the Early Pleistocene age within the interval 2.6–0.8 Mya. Fossil remains of root vole in numbers have been recorded in Western Europe but appear in layers significantly younger, from the Middle to Late Pleistocene [4,5,6,7]. The settlement of the New World is a rather recent event. Up to the present, there is no definite answer about the time of species migration to the New World. Paleontological evidence [8,9,10,11] dates it back to the Late Illinoian (>130 kya). Molecular dating [12,13] gives lower time estimates, but these values may be underestimated.
Phylogeographic study of A. oeconomus based on mitochondrial cytochrome b (mt cytb) analysis revealed four major mt lineages—North European, Central European, Central Asian and Beringian [13]. Several subsequent studies [14,15,16,17,18,19] covered in detail the European and Beringian parts of the species’ geographic distribution. However, the so-called Central Asian part of the distribution range, considered the place of origin for the root vole, has so far remained virtually unexplored, with the exception of a few additional localities [20,21].
The aim of the study was to assess the genetic variability and the population structure of A. oeconomus using mtDNA cytb within the main, largest in distribution Asian part of the range, and to compare these data with the earlier studied populations in other parts of the range. Taking into account the vast extent of the territory under study, heterogeneous landscapes, and the complex climatic history of the region, we expect to uncover higher genetic diversity than was reported earlier and strong genetic structuring, which may shed light on the colonisation history and origin of particular populations.

2. Materials and Methods

2.1. Sampling, DNA Isolation and Mitochondrial Cytochrome B Amplification

In total, 940 root voles from 181 localities throughout the species’ geographic range were included in the molecular analysis. Cytochrome b sequences from 95 specimens were obtained within the framework of the current study; tissues were stored in the collection of the Zoological Institute RAS. Sequence of A. oeconomus (XJ17041) was extracted from the complete mitogenome, published by Wang et al. [22]. The remaining sequences, mainly from the European and Beringian parts of the species’ geographic distribution, were downloaded from the NCBI Nucleotide database or taken from our previous studies (Table S1).
Isolation of genomic DNA from fresh muscle tissue samples stored in 96% ethanol was performed with the ExtractDNA Blood & Cells Kit (Evrogen, Russia). A part of the cytb gene was amplified with primers UCBU and LM by a standard protocol described elsewhere [23].
Sequences were edited and aligned with the CLUSTALW algorithm [24] implemented in BioEdit [25]. Sequences obtained in the current study were submitted to GenBank under the following accession numbers: PV658158–PV658252 (Table S1).

2.2. Phylogenetic Analyses

The level of genetic differentiation in cytb on the basis of p-distances was estimated in MEGA 7.0.18 [26]. Phylogenetic reconstruction based on cytb sequences was performed using 401 haplotypes of A. oeconomus, whereas specimens of A. kikuchii Kuroda, 1920 (AF163896), A. maximowiczii Schrenck, 1859 (FJ986303), A. fortis Büchner, 1889 (AF163894), A. mongolicus Radde, 1861 (FJ986304), A. limnophilus Büchner, 1889 (MK750928), A. montebelli Milne-Edwards, 1872 (AF163900) and Lasiopodomys mandarinus Milne-Edwards, 1871 (FJ986322) served as an outgroup. The final alignment comprised a 1140 bp cytb fragment; several sequences were shorter.
Maximum likelihood (ML) analysis was performed on the IQ-TREE Web server [27] with 10,000 ultrafast bootstrap replicates [28]. Bayesian inference (BI) analysis was carried out in MrBayes 3.2.6 [29] with the following parameters: nst = mixed and the distribution of the substitution rates between sites; the dataset was divided into partitions by codon position (1 + 2, 3). Each analysis involved two replicates with four Markov chains (MCMC) for two million generations each, with the results recorded every 1000th generation. Stationarity and convergence of separate runs were assessed using ESS statistics in Tracer v1.7 [30]. A maximum clade credibility tree was constructed based on the trees sampled after 25% burn-in and was visualised by means of FigTree v1.6 software (http://tree.bio.ed.ac.uk/software/figtree/, accessed on 26 November 2021).

2.3. Divergence Dating

Divergence time points within the root vole’s phylogeny were estimated in BEAST v2.7.7 [31]. The most recent common ancestor (MRCA) of A. oeconomus was calibrated following Markova [3] and Erbaeva [2], who gave similar dates (2.6–0.8 Mya, Early/Lower Pleistocene) for A. oeconomus fossil remains in Rostovskaya oblast and western Transbaikalia, respectively. Thus, we used a lognormal prior (offset = 0.8 Mya, 95% HPD interval 0.83–2.5 Mya) for this node; its mean value was fixed as 1.2 Mya based on the first records of Microtus minoeconomus [1].
The GTR+I+G substitution model for both (1st + 2nd) and 3rd codon positions, empirical base frequencies and optimised relaxed clock with Yule model were applied as tree priors. Two replicate runs of 50 million MCMC generations each were performed, sampling trees and parameters estimated every 10,000 generations. The convergence of run parameters was examined in TRACER v1.7 [30], and the independent runs appeared to sample all parameters well. A maximum clade credibility tree fixing node heights as common ancestor heights was constructed in TreeAnnotator [32] based on the trees sampled after 25% burn-in and was visualised using FigTree v1.6 software (http://tree.bio.ed.ac.uk/software/figtree/, accessed on 26 November 2021).

2.4. Demographic Analyses

Haplotype (Hd) and nucleotide (Pi) diversity levels, along with their standard deviations and pairwise mismatch distribution, were calculated in DnaSP v6.12.03 [33]. DnaSP v5.10 was used to assess three tests of selective neutrality (Tajima‘s D, Ramos-Onsins and Rozas R2, and Fu’s Fs) to infer signatures of demographic expansion in each sublineage; their p-values were calculated using 10,000 bootstrap replicates. The analysis of the transition/transversion (ti/tv) ratio was performed with jmodeltest v2.1.10 [34].
The alignment used for the network analysis and the calculation of genetic diversity indices was truncated to the length of shorter sequences (with the final length comprising the 889 bp fragment) and included 522 sequences (several specimens were excluded due to insufficient sequence length).
The phylogenetic network was computed via the median-joining algorithm implemented in Network 10.2.0 [35]. As several sequences were shorter, we computed an additional network (on a shortened alignment, 705 bp). These haplotypes were manually added to the final figure.

3. Results

3.1. Sequence Analysis

There were 270 different cytb haplotypes defined by 294 (25.8%) variable sites among the 940 specimens of A. oeconomus. Across a 1140 bp-long alignment, 206 nucleotide sites were parsimony informative. The calculated transition/transversion (ti/tv) ratios for North European and Central European lineages were 21.0 and 21.9, respectively and almost twice as low for Beringian and North Asian ones (10.8 and 11.8). The average base composition of cytb (T/C/A/G) was 21.9/24.7/30.1/23.3% for the first codon; 42.0/24.9/20.6/12.5% for the second, and 11.8/44.1/40.8/3.3% for the third one that corresponds with other mammals [36]. The overall haplotype and nucleotide diversity were 0.994 and 2.351, respectively.

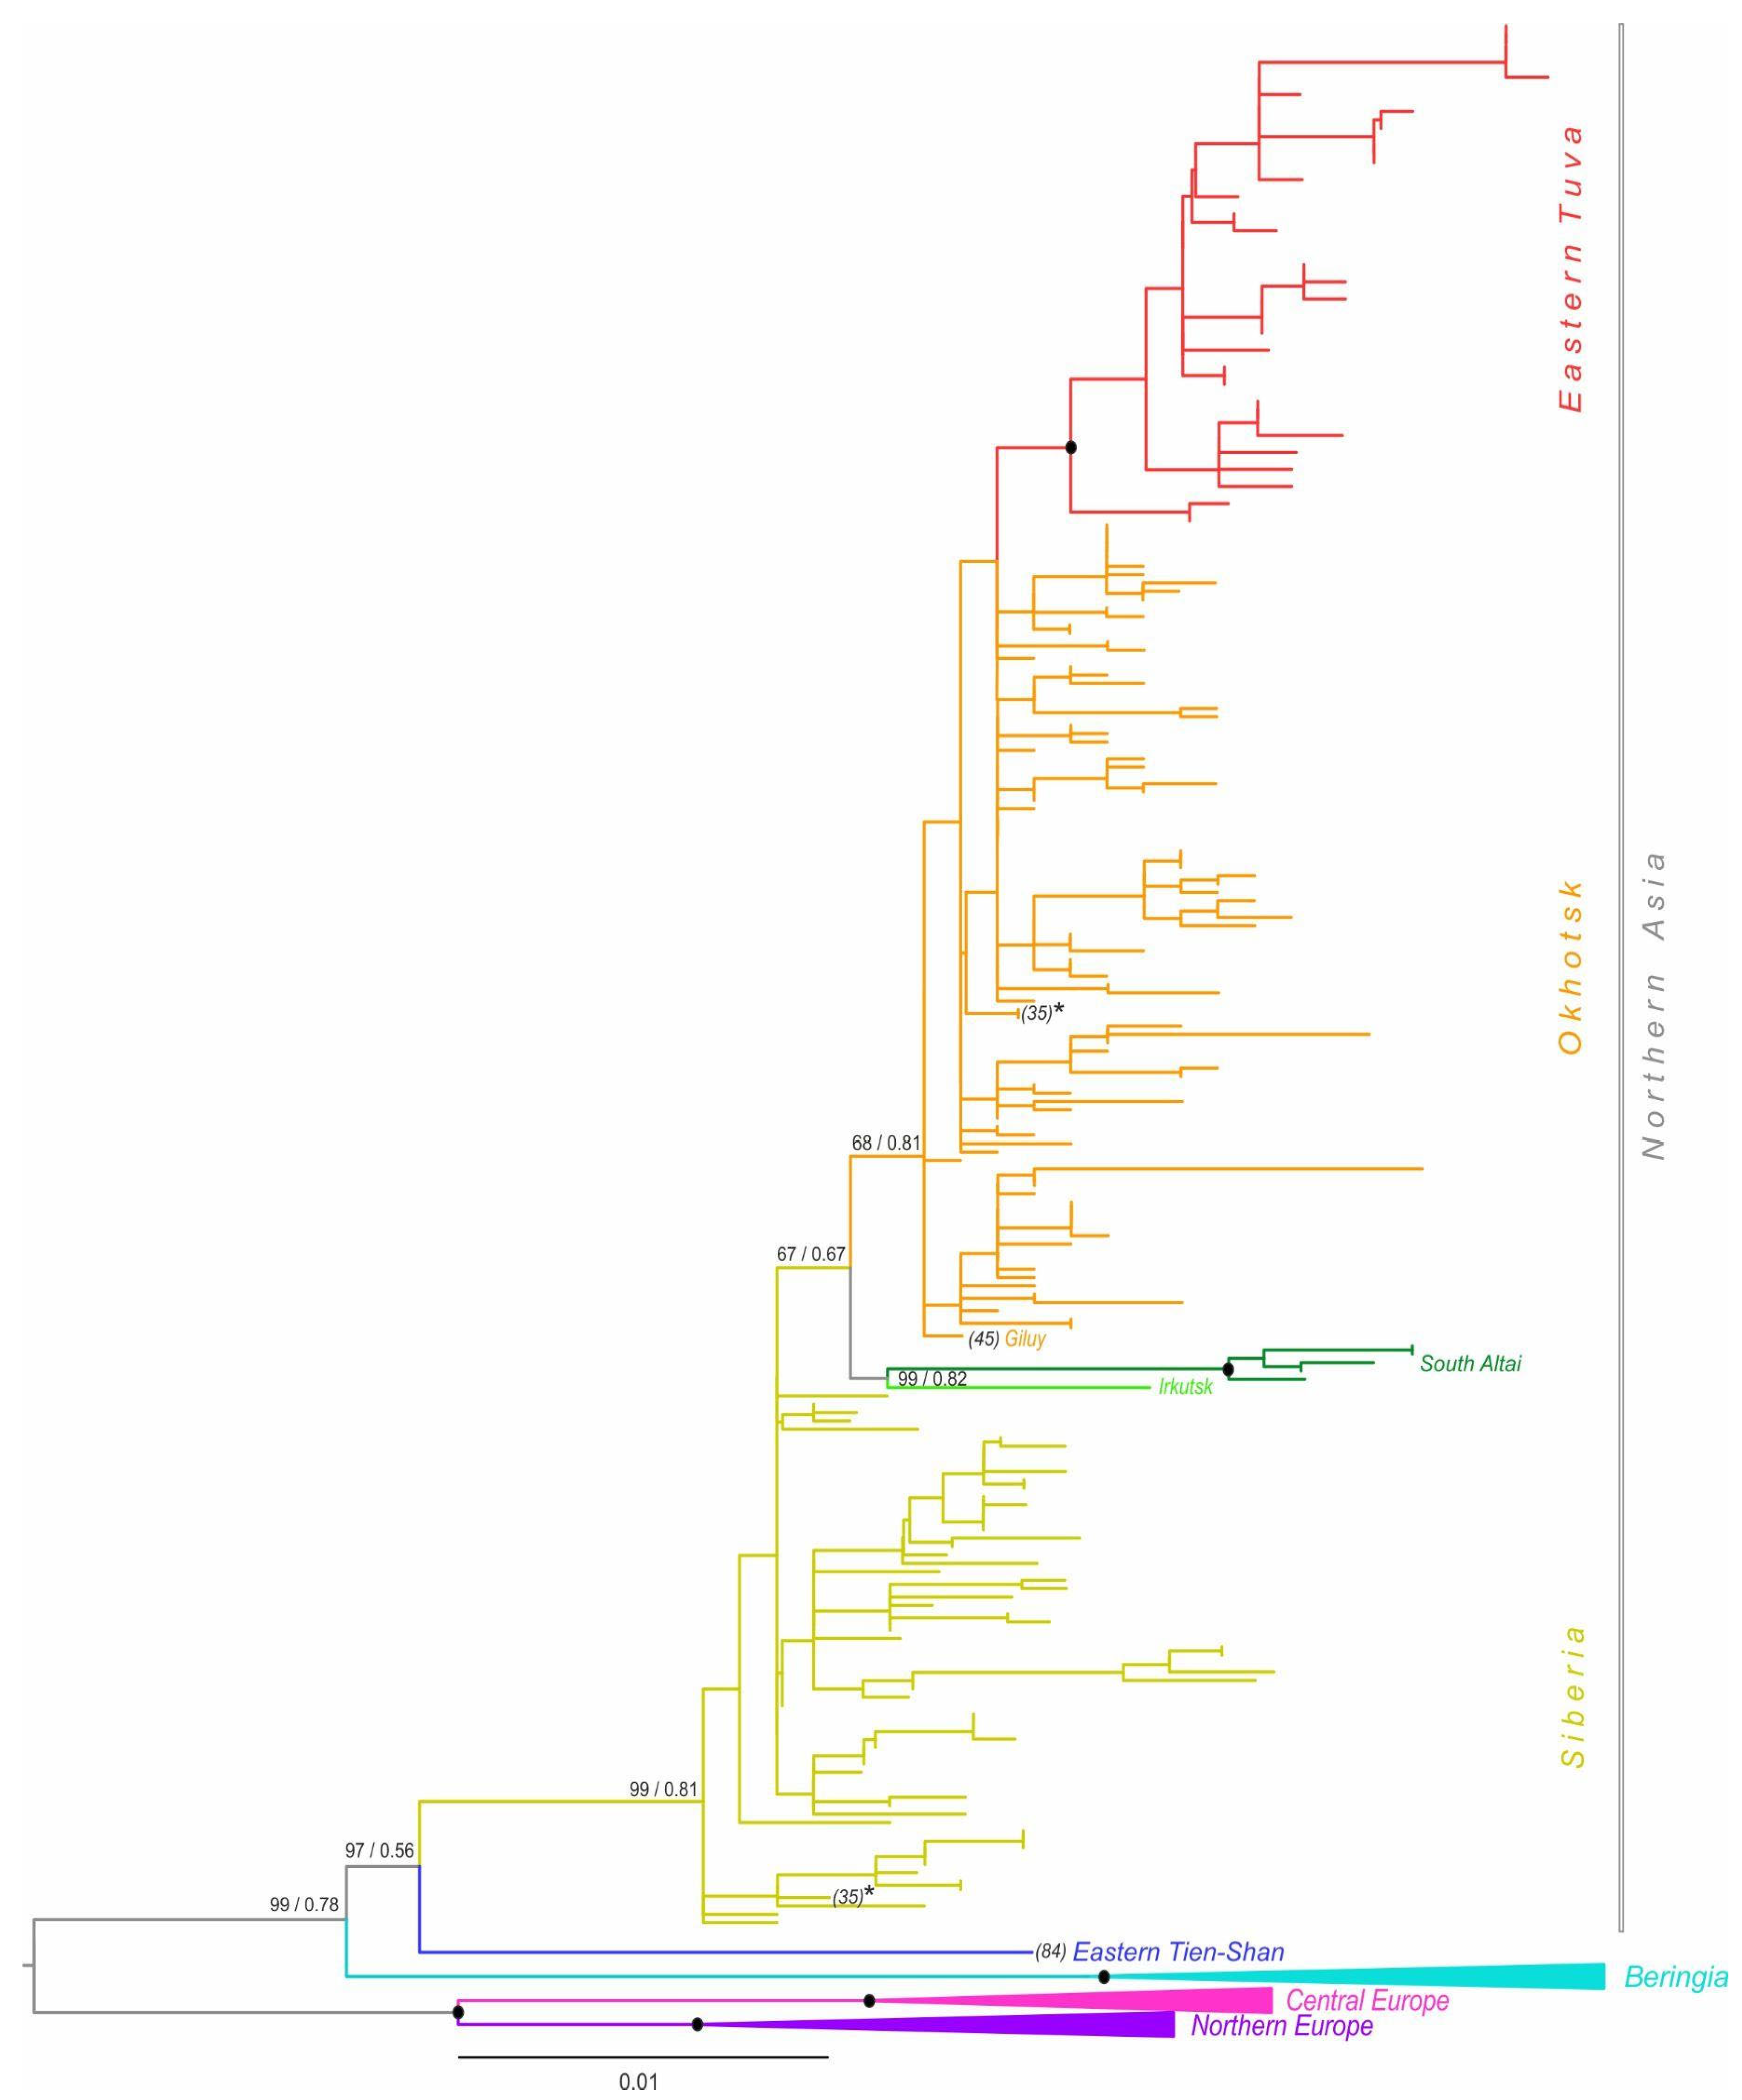
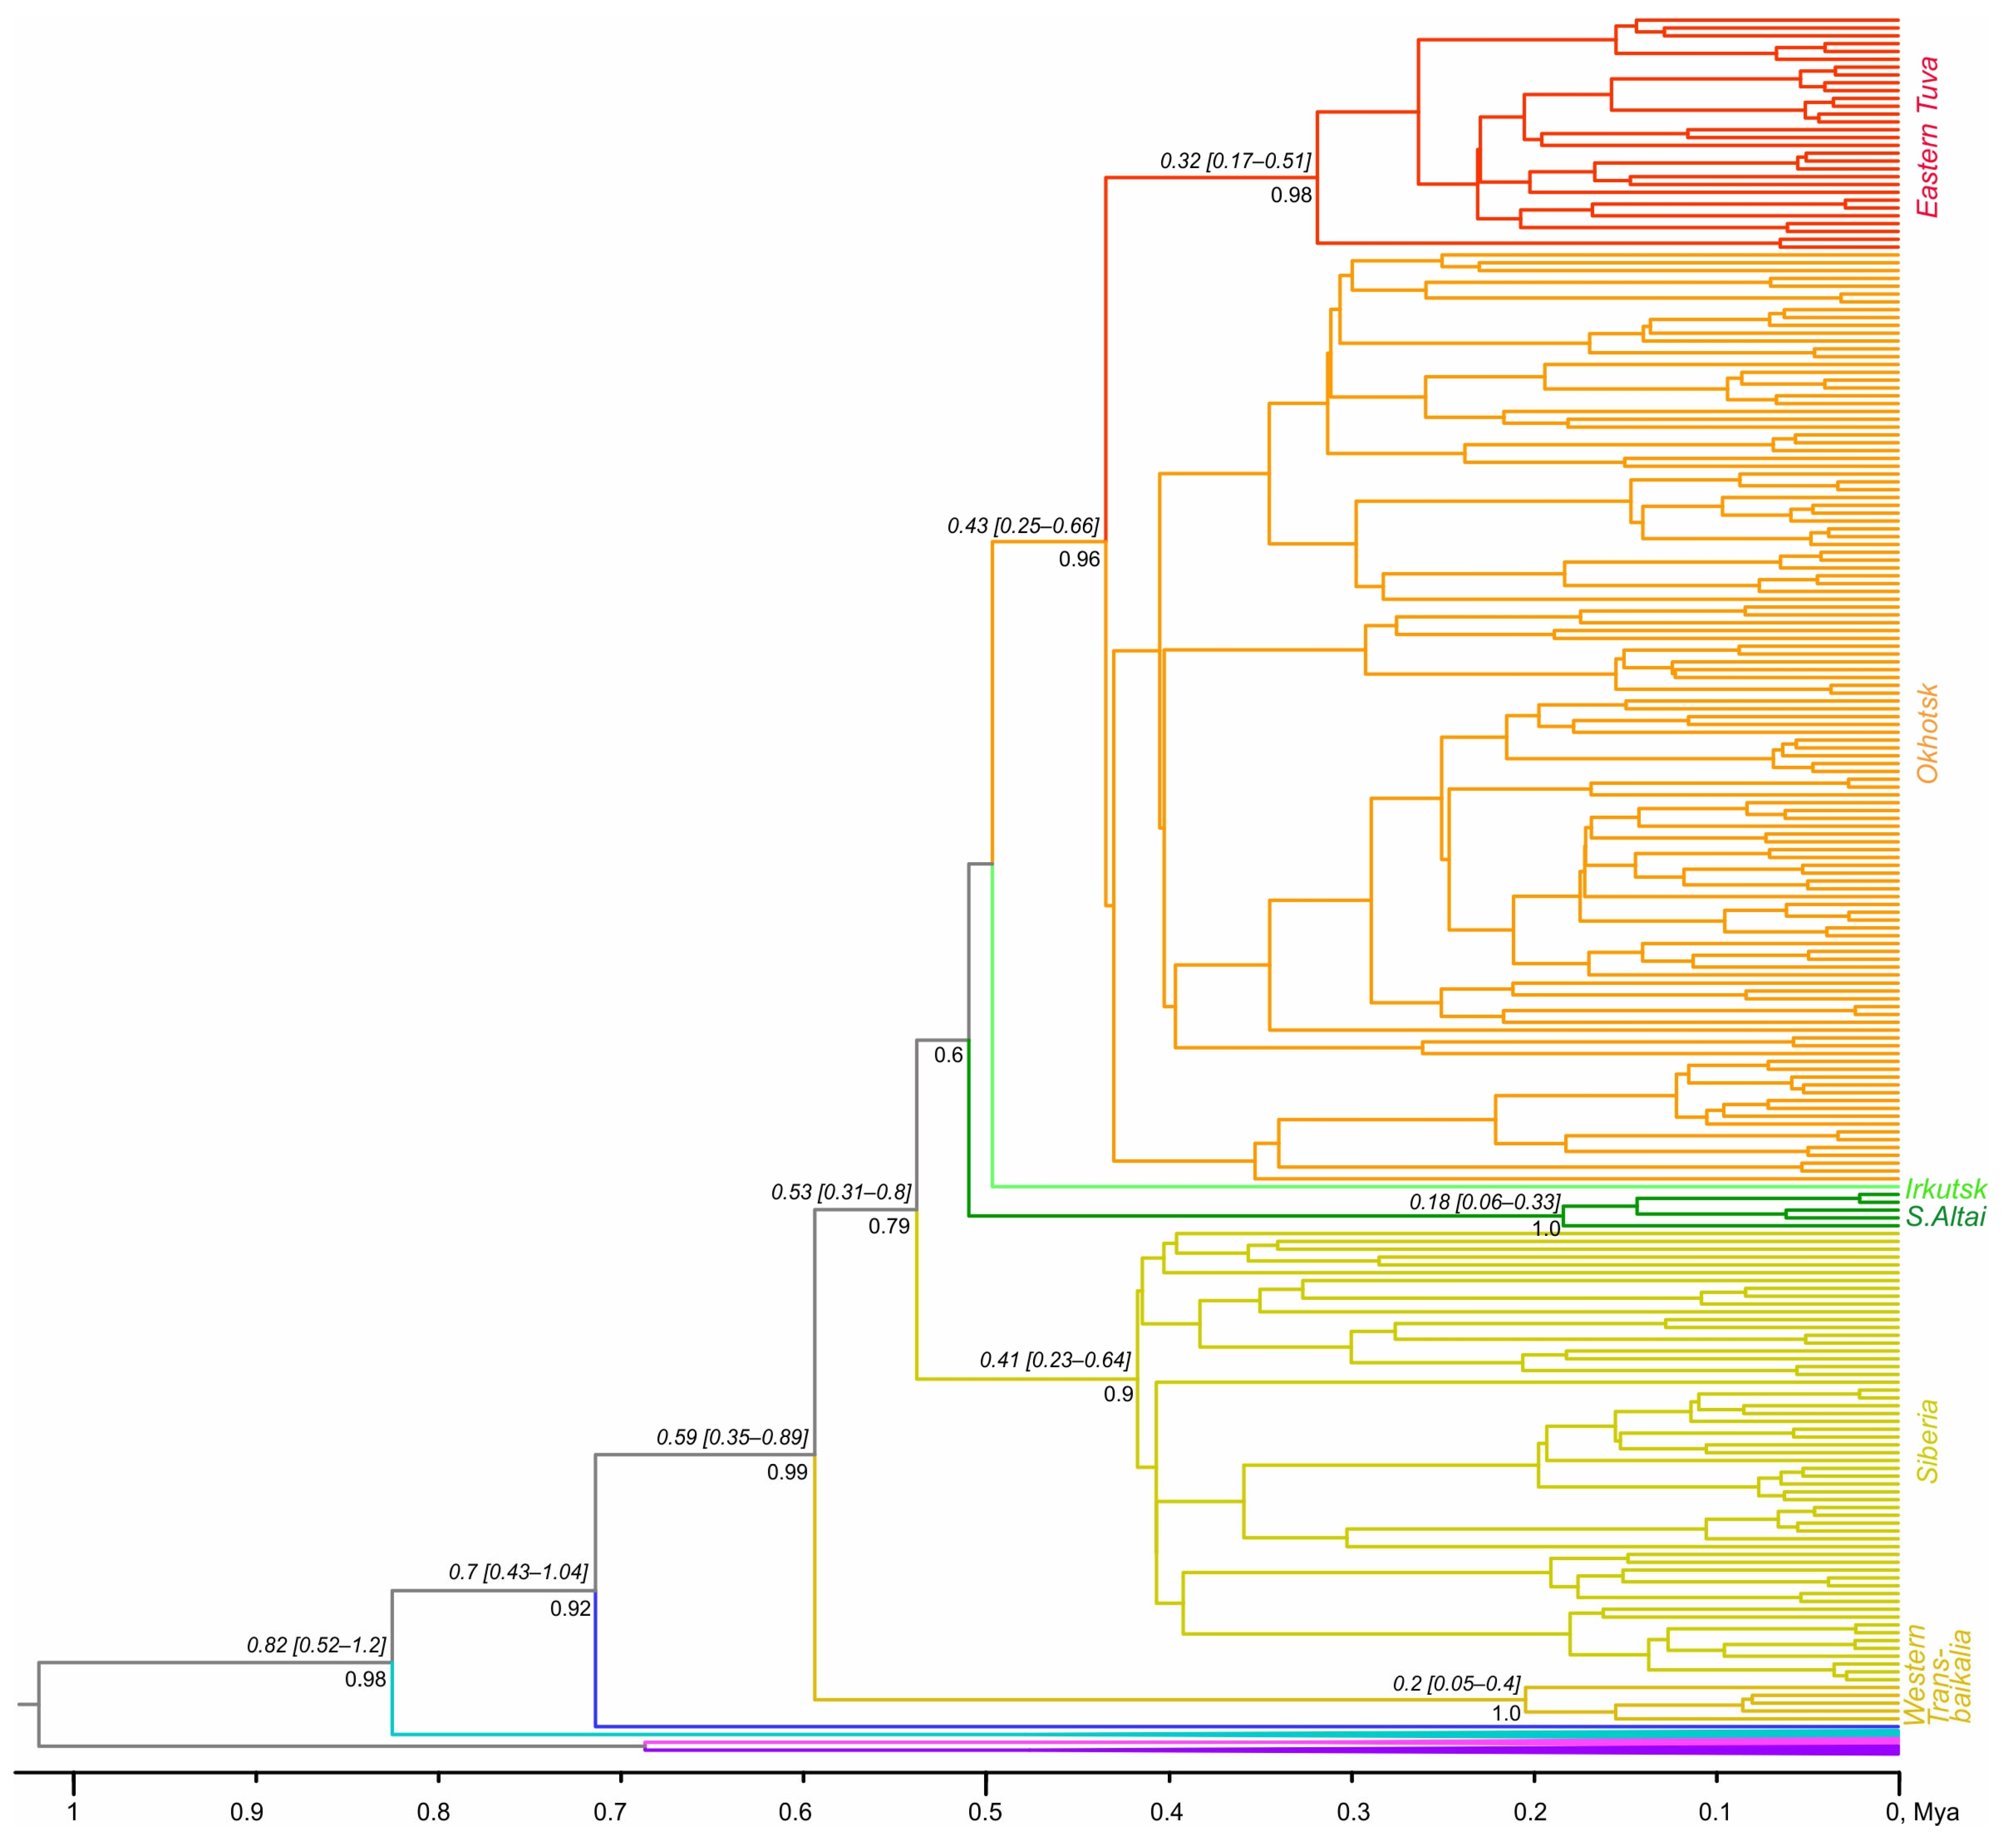
3.2. Phylogenetic Analyses and Divergence Time

On phylogenetic trees constructed using ML and BI methods (Figure 1), four main lineages are distinguished with high support: Central and North European, Beringian and North Asian. These lineages form two branches—European and Asian + Nearctic.
Since the focus of this article is on the North Asian lineage, the remaining three phylogroups are compressed for better visualisation. Although the overall topology within the North Asian clade is poorly resolved, several geographic clusters (Figure 1 and Figure 2) are distinguished within it. The Siberian cluster (highlighted in yellow) includes samples from the Ural Mountains through the Krasnoyarsk Territory (lower Yenisey River basin), to Yakutia (Lena River basin) in the north, and Northern Mongolia and Western Transbaikalia in the south. The Okhotsk cluster (highlighted in orange) occupies a territory in Eastern Asia, extending from Northern Transbaikalia through the upper Giluy River (Amur River basin) to the Kolyma River basin. The cluster of Eastern Tuva (highlighted in red), in addition to the territories of Eastern Tuva itself, includes localities in Western and Eastern Sayan (in southern Krasnoyarsk region and western Buryatia, respectively) and the Darkhad Basin in northern Mongolia (Figure 2B). A mixture of two clusters (Siberian and Okhotsk) was found in Transbaikalia (loc. 35 marked with asterisks, Figure 1 and Figure 2).
The haplotype from the Irkutsk region (loc. 38) and the southern Altai haplogroup (Northern China and a point in western Mongolia, locs. 40, 43, 44), respectively highlighted in light and dark green, stand apart. Their cluster is supported by the high ML bootstrap support, while the Bayesian posterior probability is quite low.
Although with low BI support, the North Asian group is joined by a sample from Eastern Tien Shan (China, Xingjiang Province, Hejing County), loc. 84, highlighted in blue.
The genetic distances (Table 1) between the four major lineages range from 2.4% (between the two European lineages) to 4% (between the North Asian and Central European lineages). Within population distances are maximal in the North Asian lineage (0.97%).
The divergence dating analysis (Figure 3) revealed very wide 95% HPD intervals related to the calibration point interval. According to our results, the MRCA of the North Asian lineage dates back to the Middle Pleistocene, 0.7 Mya [95% HPD 0.43–1.04 Mya] if the specimen from the Eastern Tien Shan (loc. 84) is included and 0.59 Mya [0.35–0.89] without it. The expansion of the Siberian and Okhotsk lineages begins almost simultaneously, about 0.41 Mya. The MRCA of the Eastern Tuva lineage dates back to 0.32 Mya. According to the results of this analysis, we do not see clustering of the South Altai and Irkutsk lineages; their separation from the main stem dates back approximately to 0.49 and 0.47 Mya, respectively.
We have collapsed the other three major lineages for better visualisation. The MRCA dating of the Beringian lineage obtained by us was 0.48 Mya [0.23–0.73], and for the Central and North European, 0.34 Mya [0.17–0.54] and 0.48 Mya [0.26–0.74], respectively.

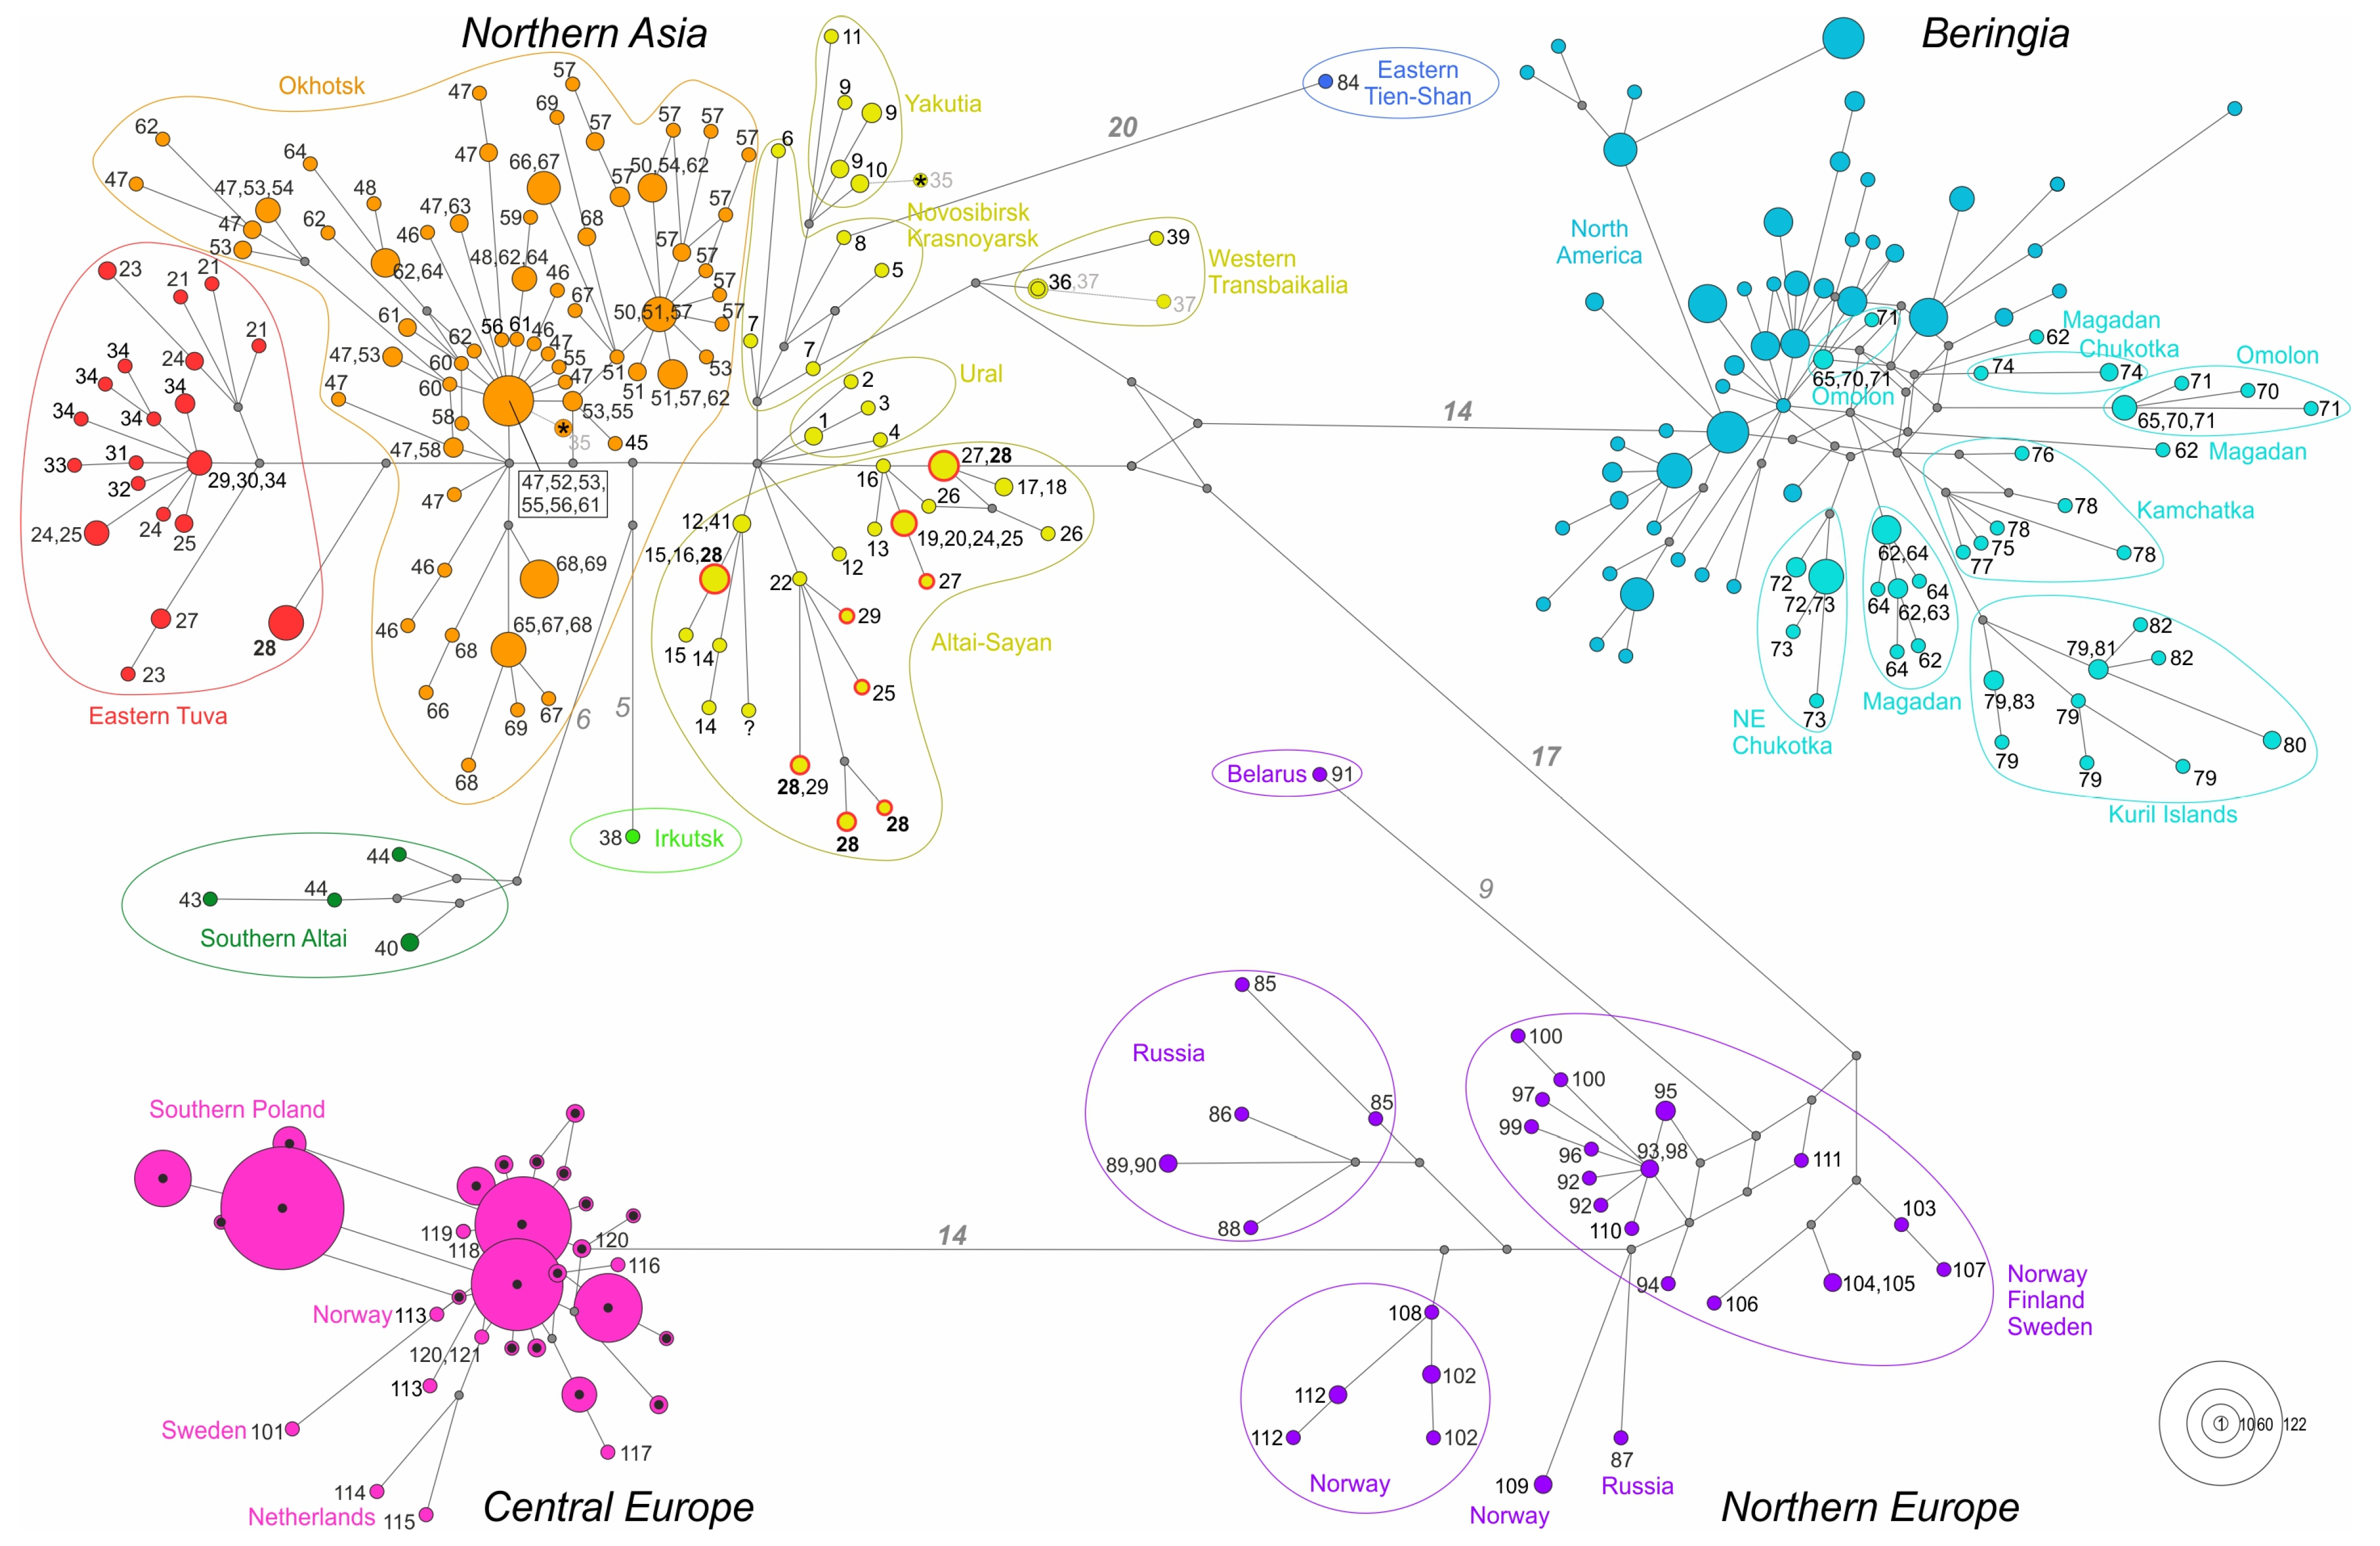
3.3. Demographic Analyses

The median-joining haplotype network (Figure 4) shows the same four main clusters. The distances between them range from 14 to 17 mutation steps (per 889 bp used in the analysis). The sample from Eastern Tien Shan (loc. 84) is adjacent to the North Asian cluster but is separated from it by 20 nucleotide substitutions. Star-like structures are observed for the Beringian, Central European, Okhotsk, and Altai–Sayan groups.
The North Asian lineage is the most extensive one. Within it, the Siberian group (highlighted in yellow) occupies the closest position to the conditional “centre” of the network. There are clear geographical groups within it: the Urals (locs. 1–4), Novosibirsk–Krasnoyarsk (locs. 5–8), Yakutia (locs. 9–11), Altai–Sayan region (locs. 12–29) and Western Transbaikalia (locs. 36, 37 and 39). The Okhotsk group (highlighted in orange) turns out to be a derivative of the Siberian one. The Eastern Tuva haplogroup (highlighted in red), the terminal on the network, in turn, is a derivative of the Okhotsk one.
Haplotype diversity is high (above 0.98) in all four major lineages (Table 2). Nucleotide diversity is maximal in the North Asian lineage (0.968%). Within the North Asian lineage, nucleotide diversity is highest in the Altai–Sayan group, with the Okhotsk group in second place. The haplotype diversity is highest in the group inhabiting the territory from the Urals to the Krasnoyarsk Territory; however, this pattern is probably due to the small sample size (mostly localities are represented by single specimens). Excluding this sample, the Altai–Sayan and Okhotsk groups are also leading in terms of haplotype diversity.
The neutrality test statistics (Table 2) do not provide an unambiguous answer on the demographic history of the analysed groups. In most cases, significant indices of Ramos-Onsins and Rozas R2 were obtained (in all cases except for the Eastern Tuva lineage), Fu’s Fs results were rarely significant, and Tajima’s D were significant only in two groups. All three statistics turned out to be significant only when analysing the Beringian lineage. In the case of the North Asian lineage, only Fu’s Fs was insignificant. In Northern Asia, population growth was supported by two of the three statistics for the Okhotsk and Altai–Sayan haplogroups within the Siberian group. In other cases, the values were statistically indistinguishable from those expected for a stable population.
The mismatch distribution results (Figure S1) for several groups within the North Asian lineage supported the model of population growth decline. For the Okhotsk and Siberian lineages, the observed values of pairwise differences almost matched the expected ones. The Altai–Sayan (Figure 2B) and Torekhol (loc. 28) groups demonstrated multimodal distributions.

4. Discussion

4.1. The Early Divergence of the Root Vole

In addition to the main purpose of the work, we summarised the previously conducted results concerning different parts of the wide circumpolar range of the species. The topology of the phylogenetic tree does not allow us to judge where the species originally settled from, since we only see a division into western (European) and eastern (Asian and North American) lineages. The fact that the species originated in Asia can be judged on the basis of the paleontological record and indirectly on the basis of the distribution of the sister species, the Taiwan vole, A. kikuchi. Genetic diversity within the species is also in favour of its Asian origin.
So far, the cytb mutation rate has been used to calibrate divergence time analyses, while noting that the cytb gene of the root vole did not seem to be evolving in a clock-like manner [13]. Alternatively, we tried to use paleontological calibrations in our work. As a result, the age estimates of the nodes increased strongly. Thus, the tMRCA of Central Asian and the Beringian lineages was estimated as 0.82 Mya [0.52–1.2], while the dating result of Brunhoff et al. [13] was 0.13–0.48 Mya.
The MRCA dating of the Beringian lineage obtained by us was 0.48 [0.23–0.73] Mya. The lower boundary of its 95% HPD interval almost coincides with the assumptions of Rausch [8] and MacPherson [9], that the root vole possibly colonised Beringia and the Nearctic during the penultimate (Illinoian, ~130–300 Kya [38]) glaciation. The oldest reported fossils in North America date to late Illinoian time (~130–200 Kya [10,39]). Previous estimates of the expansion time of the Beringian lineage made by Galbreath & Cook [14] were much lower (35.6–101 Kya based on different divergence rates).
We estimated the tMRCA of two European lineages as 0.69 Mya [0.39–1.04], while Brunhoff et al. [13] dated this node to about 0.13–0.46 Mya. The result of Jancewicz et al. [17] based on the molecular clock rate suggested by Herman et al. [40] was much lower, 36.6 Kya [26.2–48.2].
MRCA of the North European lineage was dated at 0.48 Mya [0.26–0.74]. Brunhoff et al. [15], using a divergence rate of 6–10% per million years [13], dated this node at about 40–200 Kya. The MRCA of Central European lineage was dated as 0.34 Mya [0.17–0.55], which is also much higher than mean values (12.9–75.6 Kya) estimated by Jancewicz et al. [17] based on different mutation rates.
According to our results, as was already noted before [13], ti/tv ratios varied among lineages, but the difference in values is not large, about twice as high for European lineages. At the same time, on the enlarged sample set, these values of the two European lineages were almost equal.

4.2. Evolutionary History of A. oeconomus in Northern Asia

Our goal was to study the phylogeography of A. oeconomus with an emphasis on the previously almost unexplored territory of Northern Asia. In most of the preceding works following Brunhoff et al. [13], this lineage was called “Central Asian”, which is incorrect from a geographical point of view. Haring et al. [41] also pointed out that this term was not very accurate and designated this clade as the “Siberian” one. We prefer to use the term “North Asian” because Siberia is just a subcluster within this wide-range lineage.
Contrary to the assumption of previous authors [13], as is shown by genetic indices (Table 2) and haplotype network (Figure 4), the North Asian lineage is appreciably more diverse than the Beringian one and even more so than both European lineages. This result is expected, since the geographic range of the North Asian lineage is much wider than that of the other lineages, and besides, this territory is considered to be the ancestral territory of the species. There were no cover glaciations in this area [42], and the Pleistocene climate fluctuations could only have had a partially adverse effect on the root vole’s existence, due to a significant decrease in precipitation and cooling. However, there have always been corridors along the river valleys that facilitate the widespread expansion of the species.
The MRCA of the North Asian lineage, excluding the specific sample from Eastern Tien Shan, dates back approximately to 0.59 Mya; when this sample is included, the date is ~0.7 Mya. The main diversity of this clade is concentrated in southern Siberia. Several haplogroups (marked with yellow, red, and green colours) are found here (Figure 2). Based on the haplotype network (Figure 4), genetic diversity indices (Table 2), and mismatch distribution analysis (Figure S1), it can be assumed that there were several refugia throughout the Pleistocene. The Altai–Sayan region is crossed by mountain ranges, which create mosaic landscapes and natural barriers that contribute to the isolation of local populations.
Judging by the topology of the dated tree (Figure 3) where Transbaikal lineage is basal within the North Asian lineage, and the network (Figure 4), showing the position of this cluster close to the net center, we suppose that Western Transbaikalia was the refugium for the root vole and origin of North Asian lineage in Middle Pleistocene. Colonisation from this refugium was going in two directions: to the west (to the Altai–Sayan region), and north (to Northern Urals, Krasnoyarsk Territory and Yakutia). Northern territories are characterised by low values of genetic diversity indices (Table 2), which indicates a relatively recent colonisation of these areas.
Altai–Sayan region (Figure 2B) and especially the vicinity of Torekhol Lake (loc. 28) in the Ubsunur basin is the most genetically diverse within the Siberian lineage, which is clearly shown with multimodal mismatch distribution for these territories (Figure S1). The Siberian lineage haplotypes are very diverse in the vicinity of Torekhol; moreover, the Eastern Tuva lineage haplotype is also present in this area (Figure 3), thus we may suppose the refugium in the Middle and Late Pleistocene here. This assumption is also confirmed by the climatic history of this territory. In the Late Pleistocene, the climate of the Ubsunur basin was much wetter [43], thus environmental conditions for A. oeconomus were probably more favourable than at present. This refugium is most probably repeatedly well isolated. During the Zyryansk glaciation, the Sayano-Tuva Highlands were covered by a glacier, mainly of a valley nature, but large Scandinavian-type glaciers were formed in North-Eastern Tuva, especially large ones on the watershed of the Biy-Khem and Oka rivers (at the border of Tuva and Buryatia, Figure 2B) [44]. During the last Sartan glaciation, the glaciers here were also very significant.
A separate position within the North Asian lineage is occupied by a haplogroup from the Southern Altai (highlighted in dark green, locs 40, 43, 44) and a haplotype from the Irkutsk region (light green, loc. 38). These territories may have been isolated from the main geographic range since about 0.5 Mya. The sister position of the Southern Altai and Irkutsk groups is unstable (Figure 1 and Figure 3); more data from these territories are needed for confident conclusions about their evolutionary history.
The Okhotsk haplogroup (highlighted in orange) is most likely a derivative of the Siberian group; its MRCA dates back to about 0.4 Mya. One of the central haplotypes of this group on the network is a specimen from the upper Giluy River (loc. 45). The haplotype of the Okhotsk haplogroup is also found in the mixed population in Northern Transbaikalia, loc. 35 (Figure 1, Figure 2 and Figure 4). Based on the results of mismatch distribution analysis (Figure S1) and haplotype network with star-like structures (Figure 4), we may suppose recent population growth for this lineage. Fu’s Fs and R2 statistics also support this assumption; Tajima’s D value was not significant, but negative with p-value < 0.1 (Table 2). A secondary contact of the North Asian lineage (Okhotsk haplogroup) and the Beringian lineage is observed in the Omolon River basin and in the vicinity of Magadan (Figure 2C). Many studies have been devoted to this contact area [14,16,18,19].
Another haplogroup, widespread in the eastern part of the Altai–Sayan region (Eastern Tuva), is, in turn, a derivative of the Okhotsk group and terminal at the tree and haplotype network (Figure 1 and Figure 4). Thus, it is likely that the colonisation of A. oeconomus took place first to the east (to the Kolyma River basin) and then back to the west (with the recolonisation of the eastern part of the Altai–Sayan region). Since the Torekhol branch occupies a basal position within the Eastern Tuva group (Figure 1), it can be assumed that this territory could be the source of the Eastern Tuva lineage settlement For this lineage, only the value of Fu’s Fs supports the hypothesis of a recent population growth, however, when excluding the “basal” haplotype from the Torekhol (loc. 28), significant results of Fu’s Fs and R2 are obtained, and Tajima’s D almost reaches the 95% significance level (p = 0.058). MRCA of the Eastern Tuva cluster is accessed as 0.32 [0.17–0.51] Mya.
According to our scarce sampling in the Darkhad Basin in Northern Mongolia (Figure 2B, locs. 31–33), this region is inhabited by the Eastern Tuva lineage only. By our estimates, the MRCA of the samples from the Darkhad basin is dated to about 40 Kya. This dating is probably overstated because the basin has been occupied by a palaeolake since the maximum of the Late Pleistocene glaciation [45]. Last glaciers advanced to near their maximum positions at ∼17–19 ka, and a shallower paleolake briefly occupied the basin at ∼11 ka. After ∼10 ka, the basin was probably largely dry [46]. Taking into account this glacial history, we may suppose that the expansion of the Eastern Tuva lineage to the Darkhad basin could occur only in the Holocene. These populations could have originated from a refugium in the Ubsunur basin. We have no material from the Selenga River basin, but this territory could also potentially be a source of settlement for this lineage. One of the major nodes of floral biodiversity has been detected there [47], thus this territory could also serve as a refugium.
The haplotype from the Eastern Tien Shan, China, Hejing County, to the North-West from Bositeng Lake (Figure 2, loc. 84, highlighted in blue) turns out to be inside the North Asian cluster, but is very far removed from the rest of the haplotypes. It may be supposed that this is a NUMT, but the sequence was assembled by Wang et al. [22] from genome-wide reads (where the proportion of mitochondrial sequences is much higher than that of nuclear ones). The territory where this material was collected is a part of the geographic range isolated by the ridges of the Eastern Tien Shan; therefore, it is likely that an ancient refugium may have existed there. However, with such a small amount of material, it is premature to make any guesses.

4.3. Comparative Phylogeography of Wide-Ranging Small Rodent Species in Northern Palearctic

Among the vole species, the pattern of the root vole’s wide distribution through the Palearctic is roughly similar to such species as red vole, Cletrionomys rutilus Pallas, 1779, grey red-backed vole, Craseomys rufocanus Sundevall, 1846, wood lemming, Myopus schisticolor Lilljeborg, 1844 and an open landscape dweller, narrow-headed vole, Lasiopodomys gregalis Pallas, 1779. For this reason, it makes sense to compare the phylogeographic patterns of these species. Therefore, we can uncover whether there are common geographic and temporal patterns of genetic diversity and divergence among populations of co-distributed species that have arisen in response to common historical events and processes [48]. Comparing the listed species with A. oeconomus, we should take into account that, despite a similar distribution range, significant differences exist in niche preferences. The first three listed species are mostly forest dwellers, L. gregalis prefers tundra and steppe landscapes, while A. oeconomus is an inhabitant of open mesic landscapes. Nevertheless, the partial similarity in phylogeographic patterns can be noticed across all the mentioned species.
The main diversity of the C. rufocanus is concentrated in Primorye, Sakhalin, and the Japanese islands, but a similarity can be noted with A. oeconomus in terms of territory colonisation in the northern Okhotsk Sea region. Thus, the populations of the grey red-backed vole inhabiting the area from the Amur Region to the vicinity of Magadan are also considered to be descendants of those inhabiting southern Siberia [49] and most probably colonised the territory after the last glaciation from the refugium in South Siberia. The root vole also used the same routes, as evidenced by the results of our study. It is worth noting that both species also spread in the opposite direction from the western coast of the Sea of Okhotsk to the southwest.
Phylogeographic patterns in red and root voles coincide in demonstrating well-defined Beringian clades as well as the division of the Eurasian part of the geographic range into western and eastern parts [50]. In the red vole, the border between them, however, does not run along the Ural Mountains, but to the east, approximately along the Yenisey River. At the same time, a mixture of mt lineages is observed in several territories, and in particular in the Altai–Sayan region.
The wood lemming exhibits a very weak phylogeographic structure [51], which may indicate that ancestral lineages have not been preserved in refugia. Species basal divergence was dated back to ~140 kya (the Saalian glaciation). The southeastern lineage inhabits the territory from northern Transbaikalia to the upper Giluy River. The northern lineage probably originated in eastern Siberia (to the east of Baikal) and colonised most of Eurasia in the western direction during forest advances in the last interglacial.
The pattern with the direction of the root vole colonisation to the east and then in the opposite direction, and, in particular, the recent recolonisation of the territory of eastern Tuva and Darkhad basin, is in good agreement with that shown by L. gregalis [52]. In the narrow-headed vole, recent expansion in the vicinity of Khuvsgul Lake and Eastern Tuva probably originated from the Selenga River basin. Such a scenario is also possible for the root vole. It is also interesting that the mixed populations (Figure 2B) are located in the same area (on both sides of the pass through the Tannu-Ola ridge), where the secondary contact of the two lineages of narrow-headed voles was shown [53].
With such a resemblance in phylogeographic structure, the sharp difference in dates of similar events is confusing. Thus, the time of colonisation of the northern Okhotsk Sea region by C. rufocanus was dated back to the Kargino time period [49], which is much younger than the supposed dates of A. oeconomus’ colonisation of the same territory. For the narrow-headed vole [52], the recolonisation time of Eastern Tuva is estimated as about 16 Kya (with cytb sequences of Late Pleistocene radiocarbon-dated specimens used as calibrations), while for the root vole, the recolonisation time is an order of magnitude higher. Brunhoff et al. [8] already noted that the cytb gene of the root vole does not seem to be evolving in a clock-like manner. Perhaps even the relaxed clock model cannot adequately account for the increase in mutation rate as it approaches the terminal branches. The calibration of the analysis (in particular, the inclusion of younger calibration points) is of critical importance for the obtained node ages; thus, molecular data for dated fossils of this species are needed.

4.4. Genetic Diversity and Taxonomic Structure

In general, similar to many other wide-ranging species, the genetic subdivision in A. oeconomus does not correspond at all to the known taxonomic structure of the species described in the last century. Based on minor differences in size, molar pattern, and fur colour during the past two centuries, up to 20 subspecies have been described in the Palearctic and up to 15 in the Nearctic parts of the range [54,55,56,57,58,59,60]. Morphometric revisions [61,62,63] failed to retrieve any concordance with distinguished taxonomic units, and no consensus was found between various authors [64].
In the context of mitochondrial DNA within the species, at least four geographically meaningful, evolutionarily significant units may be distinguished. Combining morphometric revisions [61] and current molecular data, partial support is received for the validity of A. o. koreni G.Allen, 1914 (Okhotsk subcluster of North Asian clade) and its close relationships with A. o. dauricus Kashchenko, 1910 and A. o. suntaricus Dukelsky, 1928 (Siberian subcluster, designated in yellow, Figure 2 and Figure 3). Interestingly, even clearer clustering of these subspecies was obtained in Haring et al. [41] with the mt control region as a marker.
The Beringian clade includes at less than three subspecies described in Palearctic: A. o. kamtschaticus Pallas, 1779, from Kamchatka peninsula and A. o. uchidae Kuroda, 1924, from the northern Kuril Islands, probably forming separate subclusters (Figure 3) due to isolation, A. o. tschuktschorum Miller, 1899, from Chukotka, and several subspecies for Alaska. However, genetically and morphologically [61,62], all constitute one well-defined group united by common origin and evolutionary history, thus constituting an evolutionary unit that may be reasonably described as a taxon at the subspecies level.

Supplementary Materials

The following supporting information can be downloaded at: https://www.mdpi.com/article/10.3390/d17070497/s1, Figure S1: Pairwise mismatch distribution results; Table S1: Material used in the study.

Author Contributions

Conceptualisation, T.V.P. and N.I.A.; methodology, T.V.P.; formal analysis, T.V.P.; investigation, T.V.P., A.A.L., S.Y.B., A.V.K., N.I.P., M.B. and N.I.A.; data curation, N.I.A.; writing—original draft preparation, T.V.P. and N.I.A.; writing—review and editing, T.V.P., A.A.L., S.Y.B. and N.I.A.; visualisation, T.V.P.; supervision, N.I.A.; funding acquisition, T.V.P., N.I.A. and M.B. All authors have read and agreed to the published version of the manuscript.

Funding

For T.P., N.A. and S.B., this research was funded by the Russian Science Foundation grant N19-74-20110-P. For A.L, this study was performed within the frame of the research project of the Severtsov Institute of Ecology and Evolution (FFER-2024-0012).

Institutional Review Board Statement

Not applicable.

Informed Consent Statement

Not applicable.

Data Availability Statement

The sequences obtained in the current study were deposited in GenBank under the following accession numbers: PV658158–PV658252. Other raw data are available upon request.

Acknowledgments

The authors thank all colleagues who helped in numerous field research trips and shared materials necessary for the study: A.V. Abramov, F.N. Golenischev, L.L. Voyta (St. Petersburg), B.I. Sheftel, N. Yu. Feoktistova (Moscow), A.N. Kuksin, U.-M. G. Chash (Kyzyl), and I.V. Moroldoev (Novosibirsk).

Conflicts of Interest

The authors declare they have no conflicts of interest. The funders had no role in the design of the study; in the collection, analyses, or interpretation of data; in the writing of the manuscript; or in the decision to publish the results.

References

  1. Zheng, S.; Cai, B. Micromammalian Fossils from Danangou of Yuxian, Hebei. In Contributions to the XIII INQUA; Beijing Scientific and Technological Publishing House: Beijing, China, 1991; pp. 100–131. [Google Scholar]
  2. Erbaeva, M.A. The Late Cenozoic Faunistic Complexes of Transbaikalia with Special Reference to the Micromammalia. In Quartärpaläontologie Band 6; Kahlke, H.D., Ed.; De Gruyter: Berlin, Germany, 1986; pp. 25–28. ISBN 978-3-11-265256-5. [Google Scholar]
  3. Markova, A.K. The Sequence of Early Pleistocene Small-Mammal Faunas from the South Russian Plain. Quartarpalaontologie 1990, 8, 131–151. [Google Scholar]
  4. Janossy, D. Pleistocene Vertebrate Faunas of Hungary. In Developments in Palaeontology and Stratigraphy; Elsevier: Amsterdam, The Netherlands, 1986; Volume 8. [Google Scholar]
  5. Chaline, J. Arvicolid Data (Arvicolidae, Rodentia) and Evolutionary Concepts. Evol. Biol. 1987, 21, 237–310. [Google Scholar]
  6. Nadachowski, A. Origin and History of the Present Rodent Fauna in Poland Based on Fossil Evidence. Acta Theriol. 1989, 34, 37–53. [Google Scholar] [CrossRef]
  7. Kordos, L. The Evolution of Upper Pleistocene Voles in Central Europe. In International Symposium Evolution, Phylogeny and Biostratigraphy of Arvicolids (Rodentia, Mammalia); Fejfar, O., Heinrich, W.-D., Eds.; Geological Survey: Prague, Czech Republic, 1990; pp. 275–284. [Google Scholar]
  8. Rausch, R.L. A Review of the Distribution of Holarctic Recent Mammals. In Pacific Basin Biogeography; Gressett, J.L., Ed.; Bishop Museum Press: Honolulu, HI, USA, 1963; pp. 29–44. [Google Scholar]
  9. MacPherson, A.H. The Origin of Diversity in Mammals of the Canadian Arctic Tundra. Syst. Zool. 1965, 14, 153–173. [Google Scholar] [CrossRef]
  10. Jopling, A.V.; Irving, W.N.; Beebe, B.F. Stratigraphic, Sedimentological and Faunal Evidence for the Occurrence of Presangamonian Artifacts in Northern Yukon. Arctic 1981, 34, 3–33. [Google Scholar] [CrossRef]
  11. MacDonal, S.O.; Cook, J.A. Recent Mammals of Alaska; University of Alaska Press: Fairbanks, AK, USA, 2009; Volume 91, ISBN 978-1-60223-047-7. [Google Scholar]
  12. Lance, E.W.; Cook, J.A. Biogeography of Tundra Voles (Microtus oeconomus) of Beringia and the Southern Coast of Alaska. J. Mammal. 1998, 79, 53–65. [Google Scholar] [CrossRef]
  13. Brunhoff, C.; Galbreath, K.E.; Fedorov, V.B.; Cook, J.A.; Jaarola, M. Holarctic Phylogeography of the Root Vole (Microtus oeconomus): Implications for Late Quaternary Biogeography of High Latitudes. Mol. Ecol. 2003, 12, 957–968. [Google Scholar] [CrossRef]
  14. Galbreath, K.E.; Cook, J.A. Genetic Consequences of Pleistocene Glaciations for the Tundra Vole (Microtus oeconomus) in Beringia. Mol. Ecol. 2004, 13, 135–148. [Google Scholar] [CrossRef]
  15. Brunhoff, C.; Yoccoz, N.G.; Ims, R.A.; Jaarola, M. Glacial Survival or Late Glacial Colonization? Phylogeography of the Root Vole (Microtus oeconomus) in North-west Norway. J. Biogeogr. 2006, 33, 2136–2144. [Google Scholar] [CrossRef]
  16. Iwasa, M.A.; Kostenko, V.A.; Frisman, L.V.; Kartavtseva, I.V. Phylogeography of the Root Vole Microtus oeconomus in Russian Far East: A Special Reference to Comparison between Holarctic and Palaearctic Voles. Mammal Study 2009, 34, 123–130. [Google Scholar] [CrossRef]
  17. Jancewicz, E.; Falkowska, E.; Ratkiewicz, M. mtDNA Evidence for a Local Northern Latitude Pleistocene Refugium for the Root Vole (Microtus oeconomus, Arvicolinae, Rodentia) from Eastern Poland. J. Zool. Syst. Evol. Res. 2015, 53, 331–339. [Google Scholar] [CrossRef]
  18. Pereverzeva, V.V.; Dokuchaev, N.E.; Primak, A.A.; Dubinin, E.A. Variability of the Gene Cytochrome b mtDNA of the Tundra Vole (Alexandromys oeconomus Pallas, 1776) in North-Eastern Asia and Alaska. Usp. Sovrem. Biol. 2023, 143, 149–164. [Google Scholar] [CrossRef]
  19. Pereverzeva, V.V.; Dokuchaev, N.E.; Primak, A.A.; Dubinin, E.A.; Kiselev, S.V. Variability of the Cytochrome b mtDNA Gene of the Root Vole (Alexandromys oeconomus Pallas, 1776) from the Northern Coast of the Sea of Okhotsk. Usp. Sovrem. Biol. 2022, 142, 90–104. [Google Scholar]
  20. Bannikova, A.A.; Lebedev, V.S.; Lissovsky, A.A.; Matrosova, V.; Abramson, N.I.; Obolenskaya, E.V.; Tesakov, A.S. Molecular Phylogeny and Evolution of the Asian Lineage of Vole Genus Microtus (Rodentia: Arvicolinae) Inferred from Mitochondrial Cytochrome b Sequence: Molecular Phylogeny of Asian Microtus. Biol. J. Linn. Soc. 2010, 99, 595–613. [Google Scholar] [CrossRef]
  21. Lissovsky, A.A.; Petrova, T.V.; Yatsentyuk, S.P.; Golenishchev, F.N.; Putincev, N.I.; Kartavtseva, I.V.; Sheremetyeva, I.N.; Abramson, N.I. Multilocus Phylogeny and Taxonomy of East Asian Voles Alexandromys (Rodentia, Arvicolinae). Zool. Scr. 2018, 47, 9–20. [Google Scholar] [CrossRef]
  22. Wang, X.; Liang, D.; Wang, X.; Tang, M.; Liu, Y.; Liu, S.; Zhang, P. Phylogenomics Reveals the Evolution, Biogeography, and Diversification History of Voles in the Hengduan Mountains. Commun. Biol. 2022, 5, 1124. [Google Scholar] [CrossRef]
  23. Abramson, N.I.; Rodchenkova, E.N.; Kostygov, A.Y. Genetic Variation and Phylogeography of the Bank Vole (Clethrionomys glareolus, Arvicolinae, Rodentia) in Russia with Special Reference to the Introgression of the mtDNA of a Closely Related Species, Red-Backed Vole (Cl. Rutilus). Russ. J. Genet. 2009, 45, 533–545. [Google Scholar] [CrossRef]
  24. Thompson, J.D.; Higgins, D.G.; Gibson, T.J. CLUSTAL W: Improving the Sensitivity of Progressive Multiple Sequence Alignment through Sequence Weighting, Position-Specific Gap Penalties and Weight Matrix Choice. Nucleic Acids Res. 1994, 22, 4673–4680. [Google Scholar] [CrossRef] [PubMed]
  25. Hall, T.A. BioEdit: A User-Friendly Biological Sequence Alignment Editor and Analysis Program for Windows 95/98/NT. Nucleic Acids Symp. Ser. 1999, 41, 95–98. [Google Scholar]
  26. Kumar, S.; Stecher, G.; Tamura, K. MEGA7: Molecular Evolutionary Genetics Analysis Version 7.0 for Bigger Datasets. Mol. Biol. Evol. 2016, 33, 1870–1874. [Google Scholar] [CrossRef]
  27. Trifinopoulos, J.; Nguyen, L.-T.; von Haeseler, A.; Minh, B.Q. W-IQ-TREE: A Fast Online Phylogenetic Tool for Maximum Likelihood Analysis. Nucleic Acids Res. 2016, 44, W232–W235. [Google Scholar] [CrossRef]
  28. Hoang, D.T.; Chernomor, O.; Von Haeseler, A.; Minh, B.Q.; Vinh, L.S. UFBoot2: Improving the Ultrafast Bootstrap Approximation. Mol. Biol. Evol. 2018, 35, 518–522. [Google Scholar] [CrossRef] [PubMed]
  29. Ronquist, F.; Teslenko, M.; Van Der Mark, P.; Ayres, D.L.; Darling, A.; Höhna, S.; Larget, B.; Liu, L.; Suchard, M.A.; Huelsenbeck, J.P. MrBayes 3.2: Efficient Bayesian Phylogenetic Inference and Model Choice Across a Large Model Space. Syst. Biol. 2012, 61, 539–542. [Google Scholar] [CrossRef] [PubMed]
  30. Rambaut, A.; Drummond, A.J.; Xie, D.; Baele, G.; Suchard, M.A. Posterior Summarization in Bayesian Phylogenetics Using Tracer 1.7. Syst. Biol. 2018, 67, 901–904. [Google Scholar] [CrossRef] [PubMed]
  31. Bouckaert, R.; Heled, J.; Kühnert, D.; Vaughan, T.; Wu, C.-H.; Xie, D.; Suchard, M.A.; Rambaut, A.; Drummond, A.J. BEAST 2: A Software Platform for Bayesian Evolutionary Analysis. PLoS Comput. Biol. 2014, 10, e1003537. [Google Scholar] [CrossRef]
  32. Heled, J.; Bouckaert, R.R. Looking for Trees in the Forest: Summary Tree from Posterior Samples. BMC Evol. Biol. 2013, 13, 221. [Google Scholar] [CrossRef]
  33. Rozas, J.; Ferrer-Mata, A.; Sánchez-DelBarrio, J.C.; Guirao-Rico, S.; Librado, P.; Ramos-Onsins, S.E.; Sánchez-Gracia, A. DnaSP 6: DNA Sequence Polymorphism Analysis of Large Data Sets. Mol. Biol. Evol. 2017, 34, 3299–3302. [Google Scholar] [CrossRef]
  34. Darriba, D.; Taboada, G.L.; Doallo, R.; Posada, D. jModelTest 2: More Models, New Heuristics and Parallel Computing. Nat. Methods 2012, 9, 772. [Google Scholar] [CrossRef]
  35. Bandelt, H.J.; Forster, P.; Rohl, A. Median-Joining Networks for Inferring Intraspecific Phylogenies. Mol. Biol. Evol. 1999, 16, 37–48. [Google Scholar] [CrossRef]
  36. Irwin, D.M.; Kocher, T.D.; Wilson, A.C. Evolution of the Cytochromeb Gene of Mammals. J. Mol. Evol. 1991, 32, 128–144. [Google Scholar] [CrossRef]
  37. Linzey, A.V.; Shar, S.; Lkhagvasuren, D.; Juškaitis, R.; Sheftel, B.; Meinig, H.; Amori, G.; Henttonen, H. Microtus oeconomus (Errata Version Published in 2017). The IUCN Red List of Threatened Species 2016: e.T13451A115113894. 2016. Available online: https://dx.doi.org/10.2305/IUCN.UK.2016-3.RLTS.T13451A22347188.en (accessed on 17 July 2025).
  38. Bowen, D.Q.; Richmond, G.M.; Fullerton, D.S.; Sibrava, V.; Fulton, R.J.; Velichko, A.A. Correlation of Quaternary Glaciations in the Northern Hemisphere. Quat. Sci. Rev. 1986, 5, 509–510. [Google Scholar] [CrossRef]
  39. Zakrzewski, R.J. The Fossil Record. In Biology of New World Microtus; Tamarin, R.H., Ed.; American Society of Mammalogists: Washington, DC, USA, 1985. [Google Scholar]
  40. Herman, J.S.; McDevitt, A.D.; Kawałko, A.; Jaarola, M.; Wójcik, J.M.; Searle, J.B. Land-Bridge Calibration of Molecular Clocks and the Post-Glacial Colonization of Scandinavia by the Eurasian Field Vole Microtus agrestis. PLoS ONE 2014, 9, e103949. [Google Scholar] [CrossRef] [PubMed]
  41. Haring, E.; Sheremetyeva, I.N.; Kryukov, A.P. Phylogeny of Palearctic Vole Species (Genus Microtus, Rodentia) Based on Mitochondrial Sequences. Mamm. Biol. 2011, 76, 258–267. [Google Scholar] [CrossRef]
  42. Avenarius, I.G.; Muratova, M.V.; Spasskaya, I.I. Paleogeography of Northern Eurasia in the Late Pleistocene-Holocene and Geographical Forecast; Nauka: Moscow, Russia, 1978. [Google Scholar]
  43. Grunert, J.; Lehmkuhl, F.; Walther, M. Paleoclimatic Evolution of the Uvs Nuur Basin and Adjacent Areas (Western Mongolia). Quat. Int. 2000, 65–66, 171–192. [Google Scholar] [CrossRef]
  44. Obruchev, S.V. The eastern part of the sayan-tuva highland in the quaternary period. Izv Union Geogr. Soc. 1953, 85, 533–547. [Google Scholar]
  45. Krivonogov, S.K.; Sheinkman, V.S.; Mistruykov, A.A. Stages in the Development of the Darhad Dammed Lake (Northern Mongolia) during the Late Pleistocene and Holocene. Quat. Int. 2005, 136, 83–94. [Google Scholar] [CrossRef]
  46. Gillespie, A.R.; Burke, R.M.; Komatsu, G.; Bayasgalan, A. Late Pleistocene Glaciers in Darhad Basin, Northern Mongolia. Quat. Res. 2008, 69, 169–187. [Google Scholar] [CrossRef]
  47. Namzalov, B.B. The most important nodes of biodiversity and phytogeographic phenomena of mountain steppes of Southern Siberia. Arid Ecosyst. 2021, 27, 24–36. [Google Scholar] [CrossRef]
  48. McGaughran, A.; Liggins, L.; Marske, K.A.; Dawson, M.N.; Schiebelhut, L.M.; Lavery, S.D.; Knowles, L.L.; Moritz, C.; Riginos, C. Comparative Phylogeography in the Genomic Age: Opportunities and Challenges. J. Biogeogr. 2022, 49, 2130–2144. [Google Scholar] [CrossRef]
  49. Abramson, N.I.; Petrova, T.V.; Dokuchaev, N.E.; Obolenskaya, E.V.; Lissovsky, A.A. Phylogeography of the Gray Red-Backed Vole Craseomys Rufocanus (Rodentia: Cricetidae) across the Distribution Range Inferred from Nonrecombining Molecular Markers. Russ. J. Theriol. 2012, 11, 137–156. [Google Scholar] [CrossRef]
  50. Kohli, B.A.; Fedorov, V.B.; Waltari, E.; Cook, J.A. Phylogeography of a Holarctic Rodent (Myodes rutilus): Testing High-latitude Biogeographical Hypotheses and the Dynamics of Range Shifts. J. Biogeogr. 2015, 42, 377–389. [Google Scholar] [CrossRef]
  51. Fedorov, V.B.; Goropashnaya, A.V.; Boeskorov, G.G.; Cook, J.A. Comparative Phylogeography and Demographic History of the Wood Lemming (Myopus schisticolor): Implications for Late Quaternary History of the Taiga Species in Eurasia. Mol. Ecol. 2008, 17, 598–610. [Google Scholar] [CrossRef] [PubMed]
  52. Petrova, T.V.; Kuksin, A.N.; Putintsev, N.I.; Lopatina, N.V.; Lissovsky, A.A. Phylogeography of Lasiopodomys gregalis (Cricetidae, Rodentia) in the Southern Part of Its Geographic Range. Russ. J. Theriol. 2023, 22, 102–119. [Google Scholar] [CrossRef]
  53. Petrova, T.V.; Genelt-Yanovskiy, E.A.; Lissovsky, A.A.; Chash, U.-M.G.; Masharsky, A.E.; Abramson, N.I. Signatures of Genetic Isolation of the Three Lineages of the Narrow-Headed Vole Lasiopodomys gregalis (Cricetidae, Rodentia) in a Mosaic Steppe Landscape of South Siberia. Mamm. Biol. 2021, 101, 275–285. [Google Scholar] [CrossRef]
  54. Gromov, I.M.; Erbaeva, M.A. Mammals of the Fauna of Russia and Adjacent Regions. Lagomorphs and Rodents; Zoological Institute RAS: Saint Petersburg, Russia, 1995. [Google Scholar]
  55. Ognev, S.I. Zveri SSSR I Prilezhashhih Stran (The Mammals of the USSR and Adjacent Countries). Vol VII. Gryzuny (Rodentia); Publ. Acad. Nauk USSR: Leningrad, Russia, 1950. [Google Scholar]
  56. Gromov, I.M.; Polyakov, I.Y. Voles (Microtinae); Brill: Leiden, The Netherlands, 1992; Volume 3. [Google Scholar]
  57. Bobrinsky, N.A.; Kuznetsov, B.A.; Kuzyakin, A.P. Check-List of the Mammals of the USSR; Prosveshchenie: Moscow, Russia, 1965. [Google Scholar]
  58. Vorontsov, N.N.; Lyapunova, E.A.; Boeskorov, G.G.; Revin, Y.V. Stability of the root vole (Microtus oeconomus) karyotype in the central part of its range and the history of formation of the species present range. Zool. Zhurnal 1986, 65, 1705–1715. [Google Scholar]
  59. Pavlinov, I.Y.; Rossolimo, O.L. Systematics of the USSR Mammals; Moscow State University Press: Moscow, Russia, 1987. [Google Scholar]
  60. Kostenko, V.A.; Allenova, T.V. Intraspecies differentiation of the root vole in the Far East and distributional history of its subspecific form. In Theriological Studies of the Southern Far East; Kostenko, V.A., Ed.; Far East Div. Russian Acad. Sci.: Vladivostok, Russia, 1989; pp. 4–25. [Google Scholar]
  61. Abramson, N.I.; Tikhonova, E.P. Reevaluation of Taxonomic Structure of the Root Vole (Microtus oeconomus Pallas, 1776, Rodentia, Arvicolidae) from the Territory of the Former USSR Based on Evidence of Craniometric and Molecular Data. Russ. J. Theriol. 2005, 4, 63–73. [Google Scholar] [CrossRef]
  62. Lissovsky, A.A.; Obolenskaya, E.V. The structure of craniometrical diversity of grey voles Microtus subgenus Alexandromys. Proc. Zool. Inst. RAS 2011, 315, 461–477. [Google Scholar] [CrossRef]
  63. Pozdnyakov, A.A.; Litvinov, Y.N. Ecogeographic interpretation of morphotypical variability of the molars in Microtus oeconomus (Rodentia, Arvicolidae). Zool. J. 1994, 73, 151–157. [Google Scholar]
  64. Kryštufek, B.; Shenbrot, G. Voles and Lemmings (Arvicolinae) of the Palaearctic Region; University of Maribor, University Press: Maribor, Slovenia, 2022; ISBN 978-961-286-611-2. [Google Scholar]
Figure 1. Phylogenetic reconstruction for Alexandromys oeconomus on the basis of cytochrome b data. The topology is given according to the ML tree. Values above major nodes denote ML bootstrap support and BI posterior probabilities. Black circles indicate nodes with 95–100% ML bootstrap support and 0.95–1.0 BI posterior probabilities. Several map IDs (see Figure 2) are marked at the tips in brackets, two samples of different lineages from the same locality are marked with an asterisk. The outgroup species is not shown for better presentation.
Diversity 17 00497 g001
Figure 2. Spatial distribution of cytochrome b haplogroups in A. oeconomus. The Nearctic part is not shown. (A) Sampling localities of A. oeconomus in Eurasia. (B) Altai–Sayan territory. (C) The coast of the Sea of Okhotsk. Cytochrome b lineages are colored. Locality IDs correspond to Table S1. Species distribution according to The IUCN Red List of Threatened Species [37] with corrections.
Diversity 17 00497 g002
Figure 3. The maximum clade credibility tree for root vole cytochrome b haplotypes. Bayesian posterior probability (above 0.5) of major clades is presented below the nodes. Common ancestor heights and 95% HPD in Mya are presented above the nodes. The outgroup species is not shown for better presentation.
Diversity 17 00497 g003
Figure 4. Median-joining network of the root vole cytochrome b haplotypes. The size of the circles is proportional to the haplotype frequency. The number of mutational steps separating the haplotypes within haplogroups is proportional to the branch lengths. For the branches longer than five steps, the length is indicated in grey colour, and the length of between-haplogroup branches (shortened for better visibility) is marked in bold. The haplotypes of the Siberian clade (Altai–Sayan region, marked in yellow), found in the same localities as the Eastern Tuva ones, are circled in red. The Torekhol locality (#28) is highlighted in bold. The dotted line shows haplotypes, added manually based on the results of the analysis of a shorter (705 bp) fragment (locality numbers 35 and 37, in grey). Haplotypes from locality 35 with a mixture of haplogroups are marked with an asterisk. For haplotype labels (locality IDs), refer to Figure 2 and Table S1. Points of North America are not numbered (since they are not shown on the map), as well as many haplotypes widespread in Poland (marked with black dots), see the article by Jancewicz et al. [17].
Diversity 17 00497 g004
Table 1. Average p-distances between (below diagonal) and within major lineages (diagonal) according to cytochrome b data.
Northern EuropeCentral EuropeBeringiaNorthern Asia
Northern Europe0.0089
Central Europe0.02400.0049
Beringia0.03920.03950.0080
Northern Asia0.03430.03970.02960.0097
P-distances within lineages marked in bold.
Table 2. Genetic diversity within the major cytochrome b haplogroups of A. oeconomus.
Lineage/Region Within N. Asian LineagenHHd (SD)Pi% (SD)FsR2D
Northern Europe36290.987 (0.010)0.889 (0.061)−17.0180.0726−1.19686
Central Europe33310.996 (0.009) *0.493 (0.050)−34.0980.0528−1.76647
Beringia204830.980 (0.003)0.795 (0.031)−69.2560.0316−1.92808
Northern Asia2501260.987 (0.002)0.968 (0.028)−32.6940.0311−1.90935
Siberia (except Altai and Transbaikalia)19140.965 (0.028)0.589 (0.045)−5.2790.0760−1.26709
Okhotsk (locs. 46–65) **144630.969 (0.006)0.612 (0.024)−54.4430.0391−1.73805
Ural-Krasnoyarsk (locs. 1–8)1090.978 (0.054)0.487 (0.067)−4.0860.0865−1.29682
Yakutia (locs. 9–11)950.861 (0.087)0.287 (0.063)−0.3060.1609−0.59820
Altai–Sayan (locs. 12–34)77410.971 (0.008)1.033 (0.030)n/an/an/a
Altai–Sayan (Siberian haplogroup)37220.949 (0.020)0.630 (0.058)−8.8710.0655−1.47954
Eastern Tuva40190.935 (0.022)0.544 (0.037)−5.7790.0741−1.08068
Eastern Tuva (except Torekhol)32180.954 (0.018)0.428 (0.038)−8.4900.0638−1.45114
n—sample size; H—number of haplotypes; Hd—haplotype diversity; Pi—nucleotide diversity; SD—standard deviation; Fs—Fu’s Fs; R2—Ramos-Onsins and Rozas R2; D. Tajima’s D. Significant values of neutrality test statistics marked in bold. * The value is overestimated (sample from Poland is excluded, there are from 8 to 122 individuals per popular haplotype (Jancewicz et al. [17]). ** Without Beringian haplotypes.
Disclaimer/Publisher’s Note: The statements, opinions and data contained in all publications are solely those of the individual author(s) and contributor(s) and not of MDPI and/or the editor(s). MDPI and/or the editor(s) disclaim responsibility for any injury to people or property resulting from any ideas, methods, instructions or products referred to in the content.

