Article

Comparative Analysis of Microtendipes Mitogenomes (Diptera: Chironomidae) and Their Phylogenetic Implications

1
Zhejiang Provincial Key Laboratory of Plant Evolutionary Ecology and Conservation, School of Life Sciences, Taizhou University, Taizhou 318000, China
2
Zhejiang Environment Technology Co., Ltd., Hangzhou 310012, China
*
Authors to whom correspondence should be addressed.
Diversity 2025, 17(6), 424; https://doi.org/10.3390/d17060424
Submission received: 24 April 2025 / Revised: 12 June 2025 / Accepted: 13 June 2025 / Published: 16 June 2025
(This article belongs to the Section Phylogeny and Evolution)

Abstract

Insect mitochondrial genomes are vital to understanding evolutionary relationships and identifying species. This study focused on Microtendipes (Chironomidae), a genus with unresolved phylogenetic positioning and cryptic species challenges. We sequenced and analyzed eight mitogenomes from five Microtendipes species, integrating 23 published Chironominae mitogenomes to reconstruct phylogenies using Maximum Likelihood and Bayesian Inference. The mitogenomes exhibited conserved gene arrangements but variable control region lengths (338–1266 bp) and high AT content (94.14–96.42% in control regions). Our results show that Microtendipes species may be a separate group within the subfamily, while also supporting the monophyly of the Harnischia, Polypedilum, and Chironomus complexes. The monophyly of Microtendipes bimaculus was weakly supported, which may demonstrate the presence of two potential cryptic species. Notably, larval morphology-based species groupings conflicted with the molecular data, suggesting that classifications derived from larval morphological traits may be unreliable. This study advances the evolutionary understanding of Chironomidae and underscores the limitations of single-gene barcodes in species-rich genera.

1. Introduction

In most insect orders, mitochondrial genomes are typically circular molecules ranging in size from 14 to 20 kilobases (kb), encoding a conserved arrangement of thirteen protein-coding genes (PCGs), twenty-two transfer RNAs (tRNAs), and two ribosomal RNAs (rRNAs) in a characteristic order and orientation [1]. These genomes have proven instrumental in diverse fields, including species identification [2,3,4] and population genetics [5,6], due to their advantages, which stem from maternal inheritance, rapid substitution rates, and ease of accessibility [7]. Moreover, investigating the characteristics of the mitochondrial genomes, such as nucleotide composition, codon usage, evolutionary rates, and secondary structures of RNA genes, has significantly contributed to a deeper understanding of the evolutionary trajectories of diverse organismal groups [8,9,10,11,12,13]. Within the insect family Chironomidae, mitogenomes have been extensively utilized in studies aiming to elucidate phylogenetic relationships within the family and explore its evolutionary history [14,15,16,17].
Chironomidae, otherwise known as non-biting midges, exhibit a remarkable diversity of species that have evolved to thrive under extreme abiotic environments. These include species capable of enduring temperatures ranging from extremely low to extremely high, as well as those resilient to oxygen scarcity, high levels of salinity, both acidic and alkaline conditions (low and high pH), and even complete desiccation [18,19]. Their remarkable adaptability allows them to inhabit an extensive range of habitats, spanning from the frigid, glacier-covered peaks of the tallest mountains to the depths of freshwater bodies, demonstrating their remarkable versatility and resilience in diverse environments [20,21].
Microtendipes Kieffer, 1915, a genus of the tribe Chironomini in the subfamily Chironominae, exhibits a cosmopolitan distribution across all zoogeographical regions [22]. Its immature stages are predominantly found within littoral and sublittoral sediments of vast aquatic habitats, with a limited number of species also inhabiting flowing water environments. Their extensive variability in body colors, encompassing thoracic, leg, and wing pigmentation, leads to challenges when defining species solely based on color pattern changes [23]. DNA barcode data are pivotal in supporting the interpretation of pigmentation variations as interspecific differences [24].
Previous studies have employed morphological analysis and molecular markers to investigate species delimitation and phylogeny within Microtendipes [22,23,24], yet certain questions remain unaddressed. First, a complex scenario arises when samples displaying identical color patterns form distinct clades on the evolutionary tree based on COI (cytochrome oxidase subunit I) gene sequences, accompanied by significant genetic distances, rendering species delimitation uncertain. There is debate regarding the appropriateness of classifying deeply divergent specimens as the same species when forming paraphyletic groups in COI-based phylogenetic trees, as suggested by Song et al. (2023) [24]. This underscores the need for unexplored avenues such as the application of mitogenomes to elucidate phylogenetic relationships. Prior to this investigation, only a single Microtendipes species had been documented with a mitogenome [25], and no comparative analysis of nucleotide composition or evolutionary rates within the genus had been conducted. Second, the phylogenetic position of Microtendipes has long been a subject of controversy. Sæther (1977) constructed a phylogenetic tree based on female chironomid characteristics, placing the genus within Chironomini [26]. In the phylogenetic tree, Microtendipes formed a monophyletic group with Paratendipes Kieffer/Nilothauma Kieffer, and it was therefore suggested that these genera should be established as a fourth subfamily-level taxonomic unit. However, when Sasa (1989) documented the chironomid fauna of Japan, he placed Microtendipes within the Polypedilum complex (including Nilothuma and Paratendipes), belonging to Chironomini [27]. When molecular data were introduced, Cranston et al. (2012) supported the grouping of Microtendipes with several related genera (excluding Paratendipes) into a generic group, which formed a sister relationship with Pseudochironomini [28].
In this study, we presented eight mitogenomes belonging to five species of Microtendipes: M. bimaculatus, M. baishanzuensis, M. wuyiensis, M. robustus, and M. tuberosus. Following this, we conducted a thorough analysis of their mitogenomic characteristics. By incorporating previously documented mitogenomes into our analysis, we reconstructed the phylogenetic evolution of Chironominae using a comprehensive dataset comprising 31 mitochondrial genomes. To achieve this, we employed both Maximum Likelihood (ML) and Bayesian Inference (BI) methodologies, enabling us to accurately determine the phylogenetic positioning of Microtendipes within the subfamily. Furthermore, this study aims to evaluate the limitations of the conventional COI 5′ barcode in resolving species boundaries within Microtendipes, particularly in cases of cryptic diversity and deep intraspecific divergence. By comparing COI-based results with mitogenome-wide analyses, we seek to clarify the utility and constraints of single-gene barcoding in taxonomically complex genera.

2. Materials and Methods

2.1. Taxon Sampling and Sequencing

All Microtendipes individuals were collected from Baishanzu National Reserve and Wuyi Mountain National Reserve in 2021 and 2022, except for Microtendipes bimaculatus—Clade 1 (MZ981734), which was retrieved from our previous study [25]. The specimens were dissected and mounted with Euparal, excluding the tissues used for total genomic DNA extraction (thorax, head, and one pair of legs). The extraction procedure followed the instructions of the Qiagen DNeasy Blood and Tissue kit, except for varying the amount of elution buffer used from 100 to 150 µL according to the body size of the specimens. The thorax exoskeletons were cleaned and mounted on the corresponding voucher. A segment of the cox1 5′ region for each species was amplified with the primer pair LCO1490-L and HCO2198-L [29] and sequenced with Sanger sequencing as described by Song et al. (2018) [30], further confirming the identification. The genomic DNA was subsequently pooled and sequenced using the Illumina Novaseq 6000 (PE150, Illumina, San Diego, CA, USA) platform. Multiple programs—Mitoz (v3.4) (Chongqing, China) [31], NOVOPlasty (v4.3.1) (Brussel, Belgium) [32], and SPAdes (v4.0.0) (St. Petersburg, Russia) [33]—were employed to assemble the reads, and the results of the three assemblers were used for revisions to obtain accurate mitogenomes. The mitogenomes were annotated using MITOS2 (Greifswald, Germany) (v2.1.7) [34] and then visualized using the Java package CGView (v2.0.3) (Edmonton, AB, Canada) [35].

2.2. Genome Composition and Codon Usage

The base composition was analyzed utilizing seqkit (v2.3.0) (Tianjin, China) [36]. The codon usage of PCGs was analyzed using EMBOSS (v6.6.0.0) (Hinxton, UK) [37] and Python module codonw-slim (v1.5.0) (Düsseldorf, Germany); the relevant figures were generated using R package ggplot2 (v3.5.1) (Boston, MA, USA) [38].

2.3. Substitution Rate and Phylogenetic Analyses

For phylogenetic reconstruction, we analyzed mitochondrial genomes from 22 Chironominae genera (Table 1), including eight newly sequenced mitogenomes. Rheocricotopus villiculus (Orthocladiinae: MW373526) was designated as the outgroup, reflecting its established position as the sister subfamily to Chironominae [28]. This phylogenetically proximate outgroup minimized long-branch attraction artifacts while ensuring robust tree rooting. Taxon selection prioritized taxonomic diversity, data completeness, and relevance to resolving the systematic placement of Microtendipes within Chironominae. The thirteen protein-coding genes (PCGs) were aligned using MAFFT (version 7.505) [39], with all stop codons retained and indels removed during the process. Subsequent to alignment, all sequences were manually reviewed, corrected, and concatenated for further analyses. Pairwise genetic distances among the 13 PCGs were computed using MEGA11 [40]. Statistical comparisons of genetic distances were conducted using the Friedman test in R, with multiple pairwise comparisons performed using the Wilcoxon rank-sum test, and p-values were adjusted using the Benjamini–Hochberg (BH) method to control for false discovery rate. The resulting boxplot was generated using the R package ggplot2.
A total of four datasets were concatenated for phylogenetic analyses, namely: (i) a PCG matrix comprising all thirteen protein-coding genes (PCGs) totaling 11,094 base pairs (bp), (ii) a PCGrRNA matrix incorporating the thirteen PCGs and the two ribosomal RNA (rRNA) genes, amounting to 12,643 bp, (iii) a PCG12 matrix containing the first and second codon positions of the thirteen PCGs, and (iv) a PCG12rRNA matrix (7396 bp), which includes PCG12 and the two rRNA genes, totaling 8945 bp. All the matrices were analyzed using Maximum Likelihood (ML) with RAxML (version 8.2.12) or RAxML-NG [41], and Bayesian Inference (BI) with MrBayes (version 3.2.7a) [42]. PartitionFinder2 (version 2.1.1) [43] was employed to identify the optimal partitioning schemes and substitution models. Both ML and BI analyses were performed on both partitioned and non-partitioned data to construct the phylogenetic trees. Details of the partitions and corresponding substitution models are provided in Supplementary File S1. In the BI analysis, four simultaneous Markov chain Monte Carlo (MCMC) runs of 100 million generations each were executed, with trees sampled every 2000 generations. The first 25% of the steps were discarded as burn-in. Stationarity was deemed to be achieved when the average standard deviation of split frequencies dropped below 0.01. All custom scripts used in this study are publicly available at https://github.com/geduo42/mitogenome (accessed on 2 June 2025). The resulting trees from all analyses were visualized and edited using iTOL (https://itol.embl.de) (accessed on 10 October 2024) [44].

3. Results and Discussion

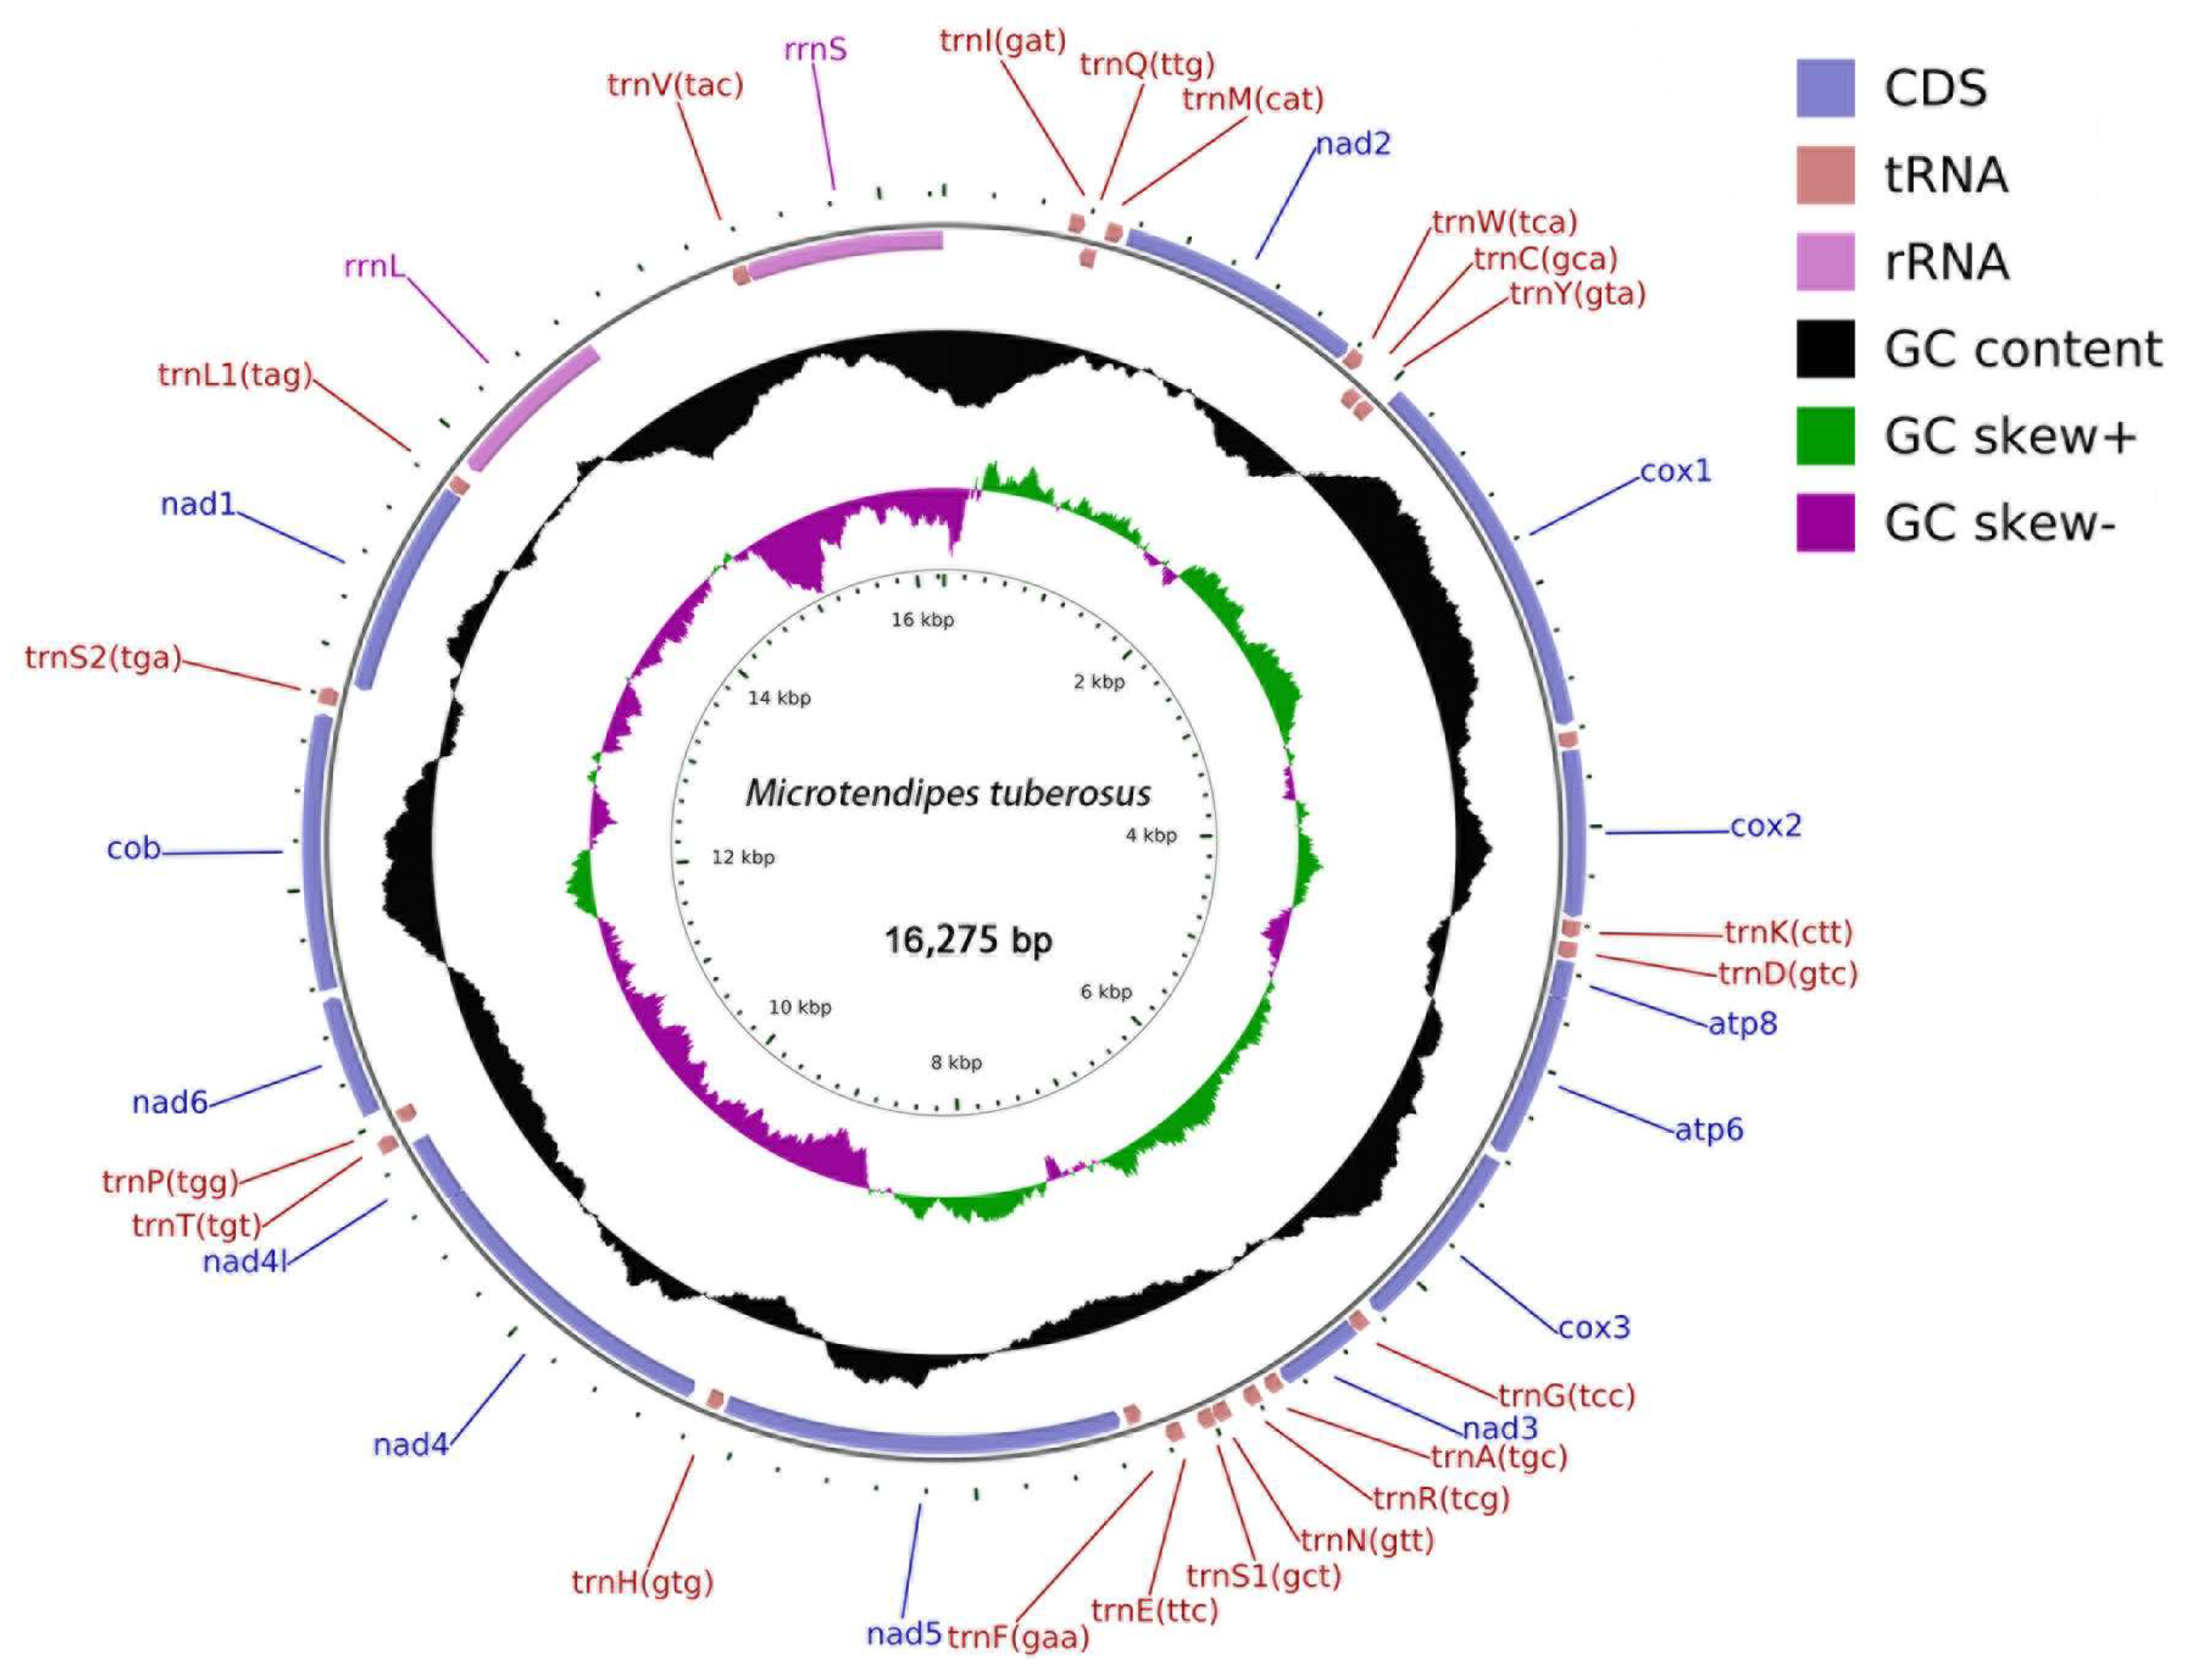
3.1. Genome Organization

The complete mitochondrial genomes of the Microtendipes species were successfully sequenced. These genomes consist of double-stranded circular molecules, with sizes ranging from 15,756 bp (PP966950) to 16,340 bp (PP966952). Each genome encodes a total of thirty-seven genes, comprising thirteen protein-coding genes (PCGs), two ribosomal RNA (rRNA) genes, and twenty-two transfer RNA (tRNA) genes, as detailed in Table 1. The primary source of length variation among these genomes is the control region, which exhibits a size range from 338 bp (PP966951) to 1266 bp (PP966952). Regarding the coding sequences, minimal variation is observed in the lengths of the PCGs, tRNAs, and rRNAs. Specifically, the PCGs span from 11,106 bp (PP966952) to 11,154 bp (PP966949), the tRNAs range from 1575 bp (PP966952) to 1595 bp (PP966949), and the rRNAs vary between 1488 bp (PP966950) and 1508 bp (PP966949). Notably, these thirty-seven genes maintain a consistent order across all nine genomes examined. Furthermore, twenty-three of these genes (including nine PCGs and fourteen tRNAs) are encoded by the majority strand (J-strand), while the remaining genes are encoded by the minority strand (N-strand), as illustrated in Figure 1 for Microtendipes tuberosus (the others are represented in the Figures S1–S7).

3.2. Nucleotide Composition

The nucleotide compositions of the nine mitochondrial genomes exhibit considerable similarity, as outlined in Table 2. The AT content varies between 79.19% in Microtendipes wuyiensis (PP966951) and 80.77% in Microtendipes robustus (PP966954). Notably, the AT content within the control region is significantly elevated compared to the entire genome, with a range from 94.14% in Microtendipes bimaculatus (PP966953) to 96.42% in Microtendipes robustus (PP966950). Similarly, the AT content in both the rRNA and tRNA regions surpasses the overall genome level, with rRNA varying between 81.43% and 82.51%, and tRNA ranging from 82.18% to 82.93%. Conversely, the PCG sequences demonstrate a lower AT content, spanning from 76.07% in Microtendipes wuyiensis to 78.09% in Microtendipes robustus (PP966954). All nine mitogenomes exhibit a positive AT-skew, ranging from 1.08% to 2.66%, and a negative GC-skew, varying between −22.26% and −18.04%. In contrast, the tRNA sequences display a negative AT-skew, ranging from −2.43% to −3.76%, and a positive GC-skew, spanning from 27.47% to 31.67%. The rRNA sequences exhibit positive AT-skew and GC-skew values, with ranges of 3.92% to 5.05% and 12.23% to 16.23%, respectively. For the PCG sequences, a notable negative AT-skew is observed, ranging from −17.31% to −19.16%, whereas the GC-skew is relatively insignificant, varying from −1.57% to 2.38%.

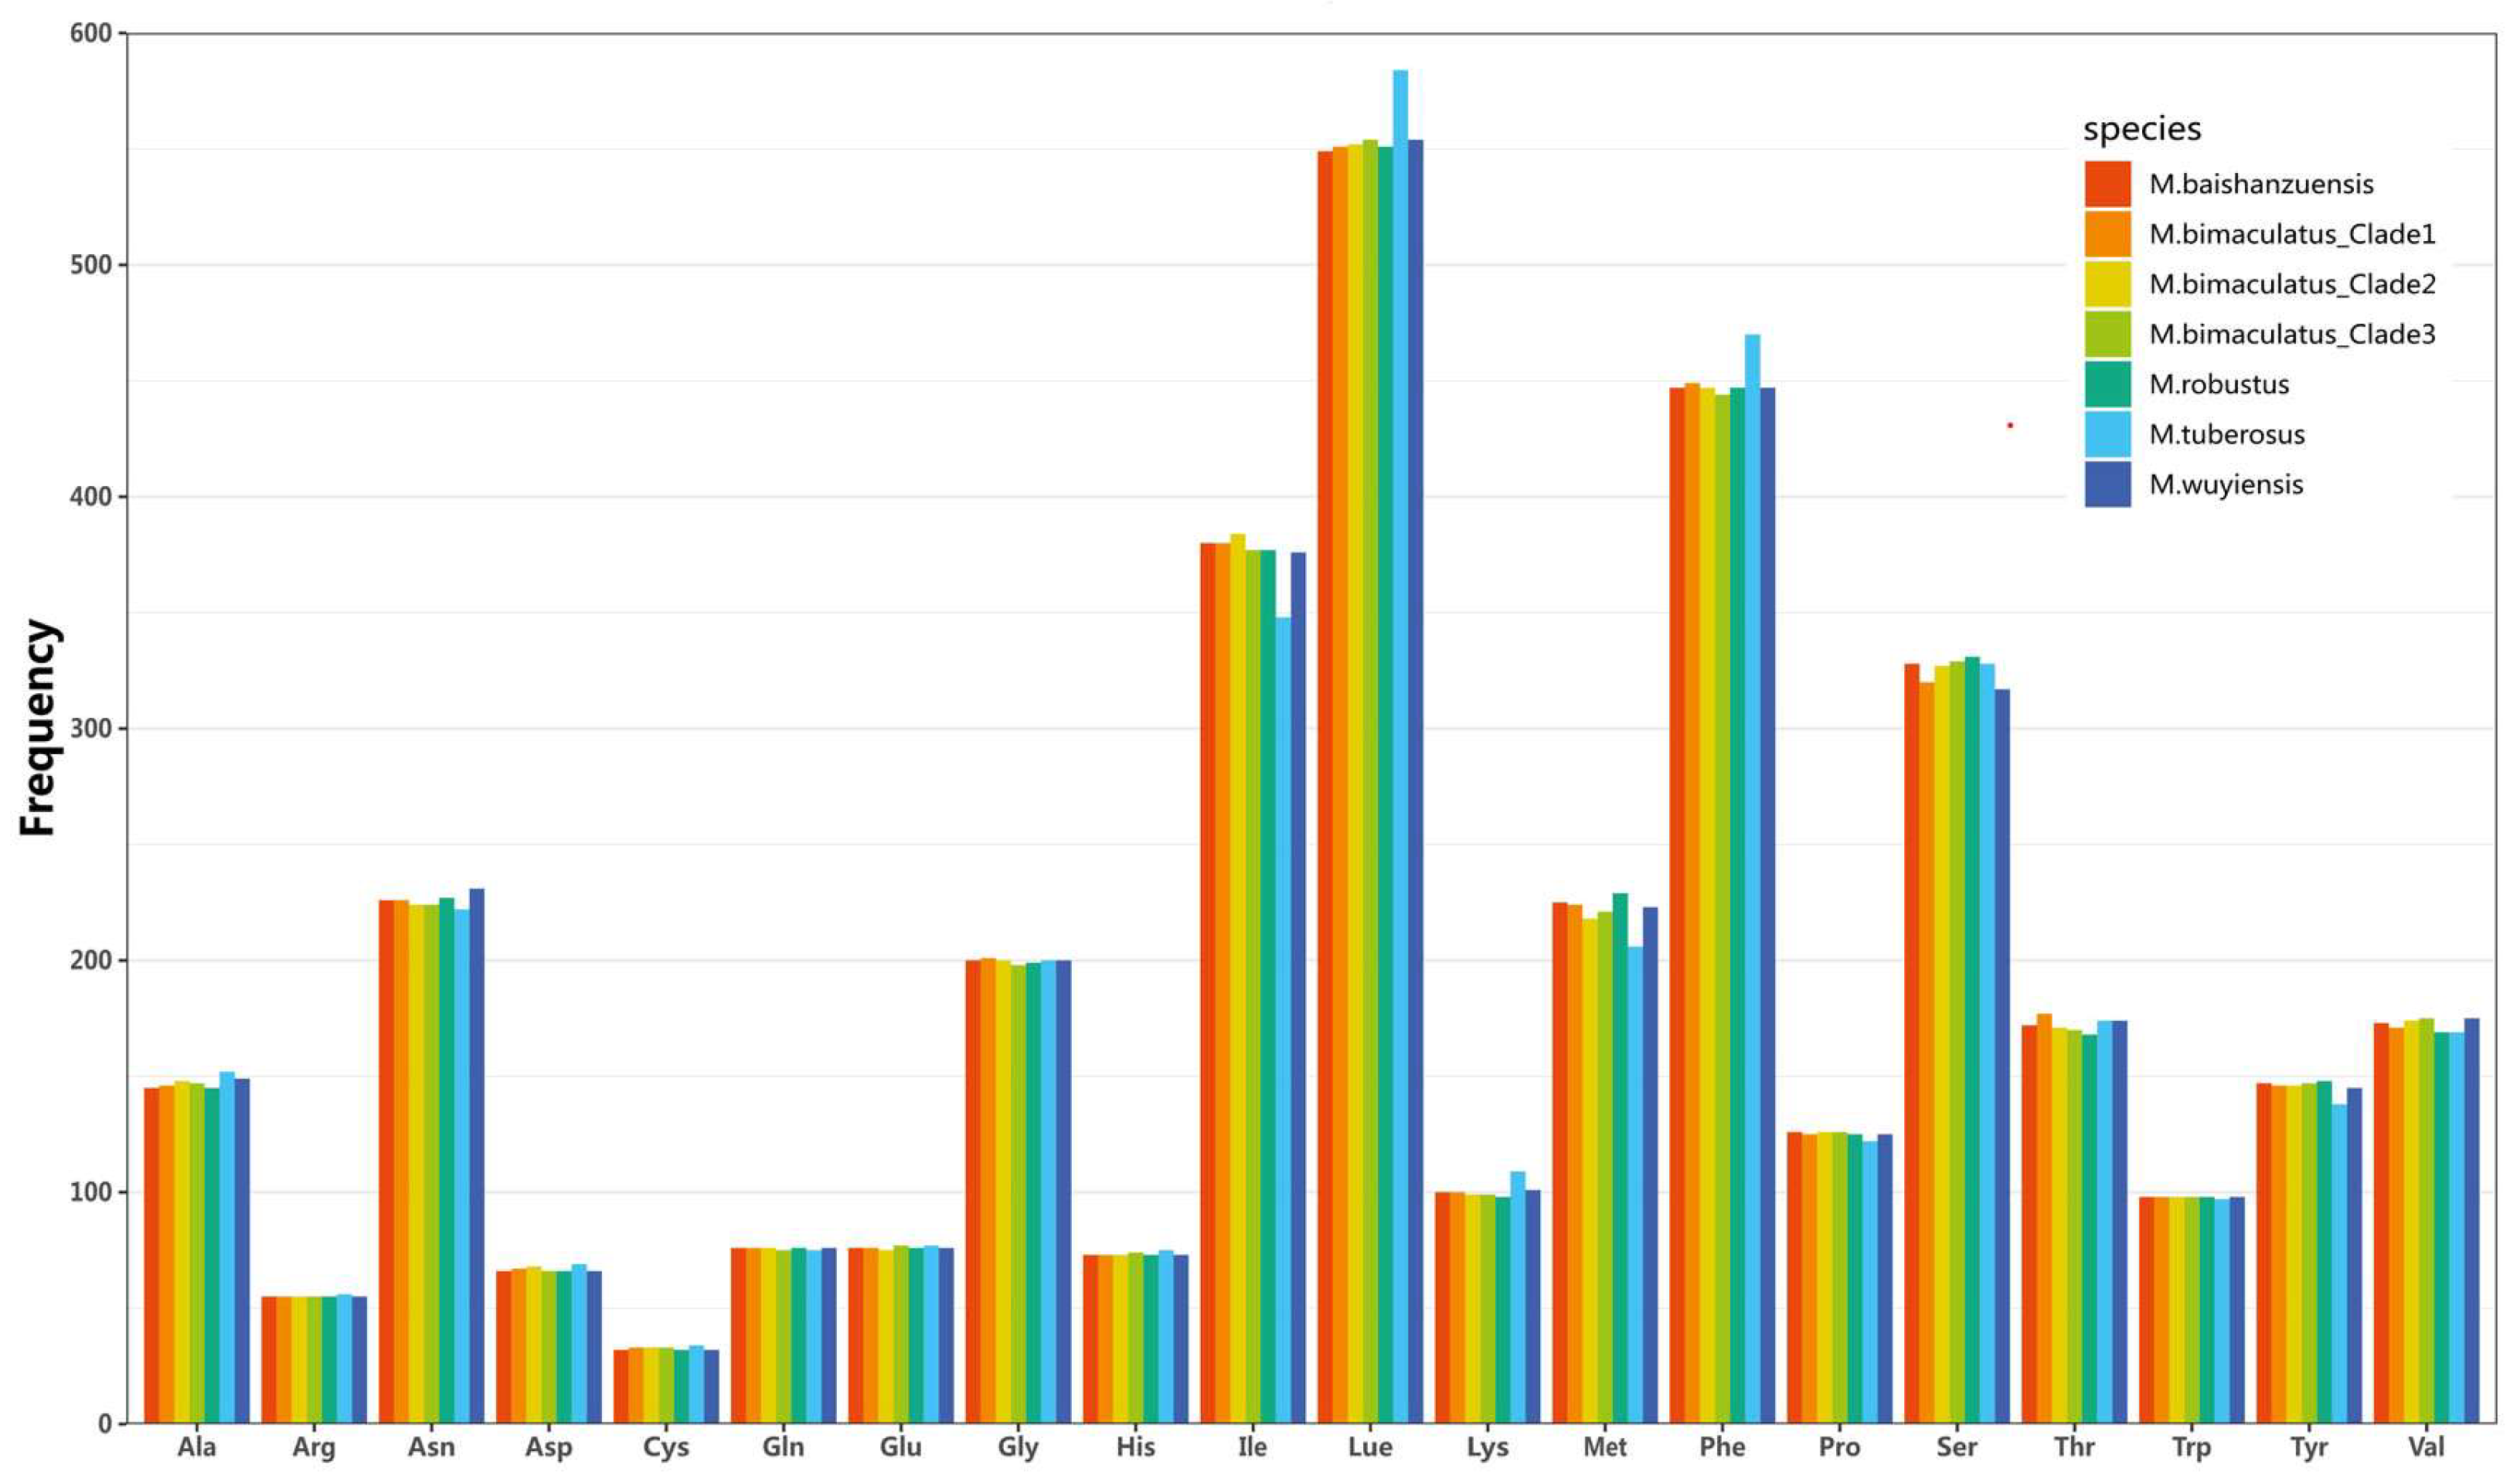
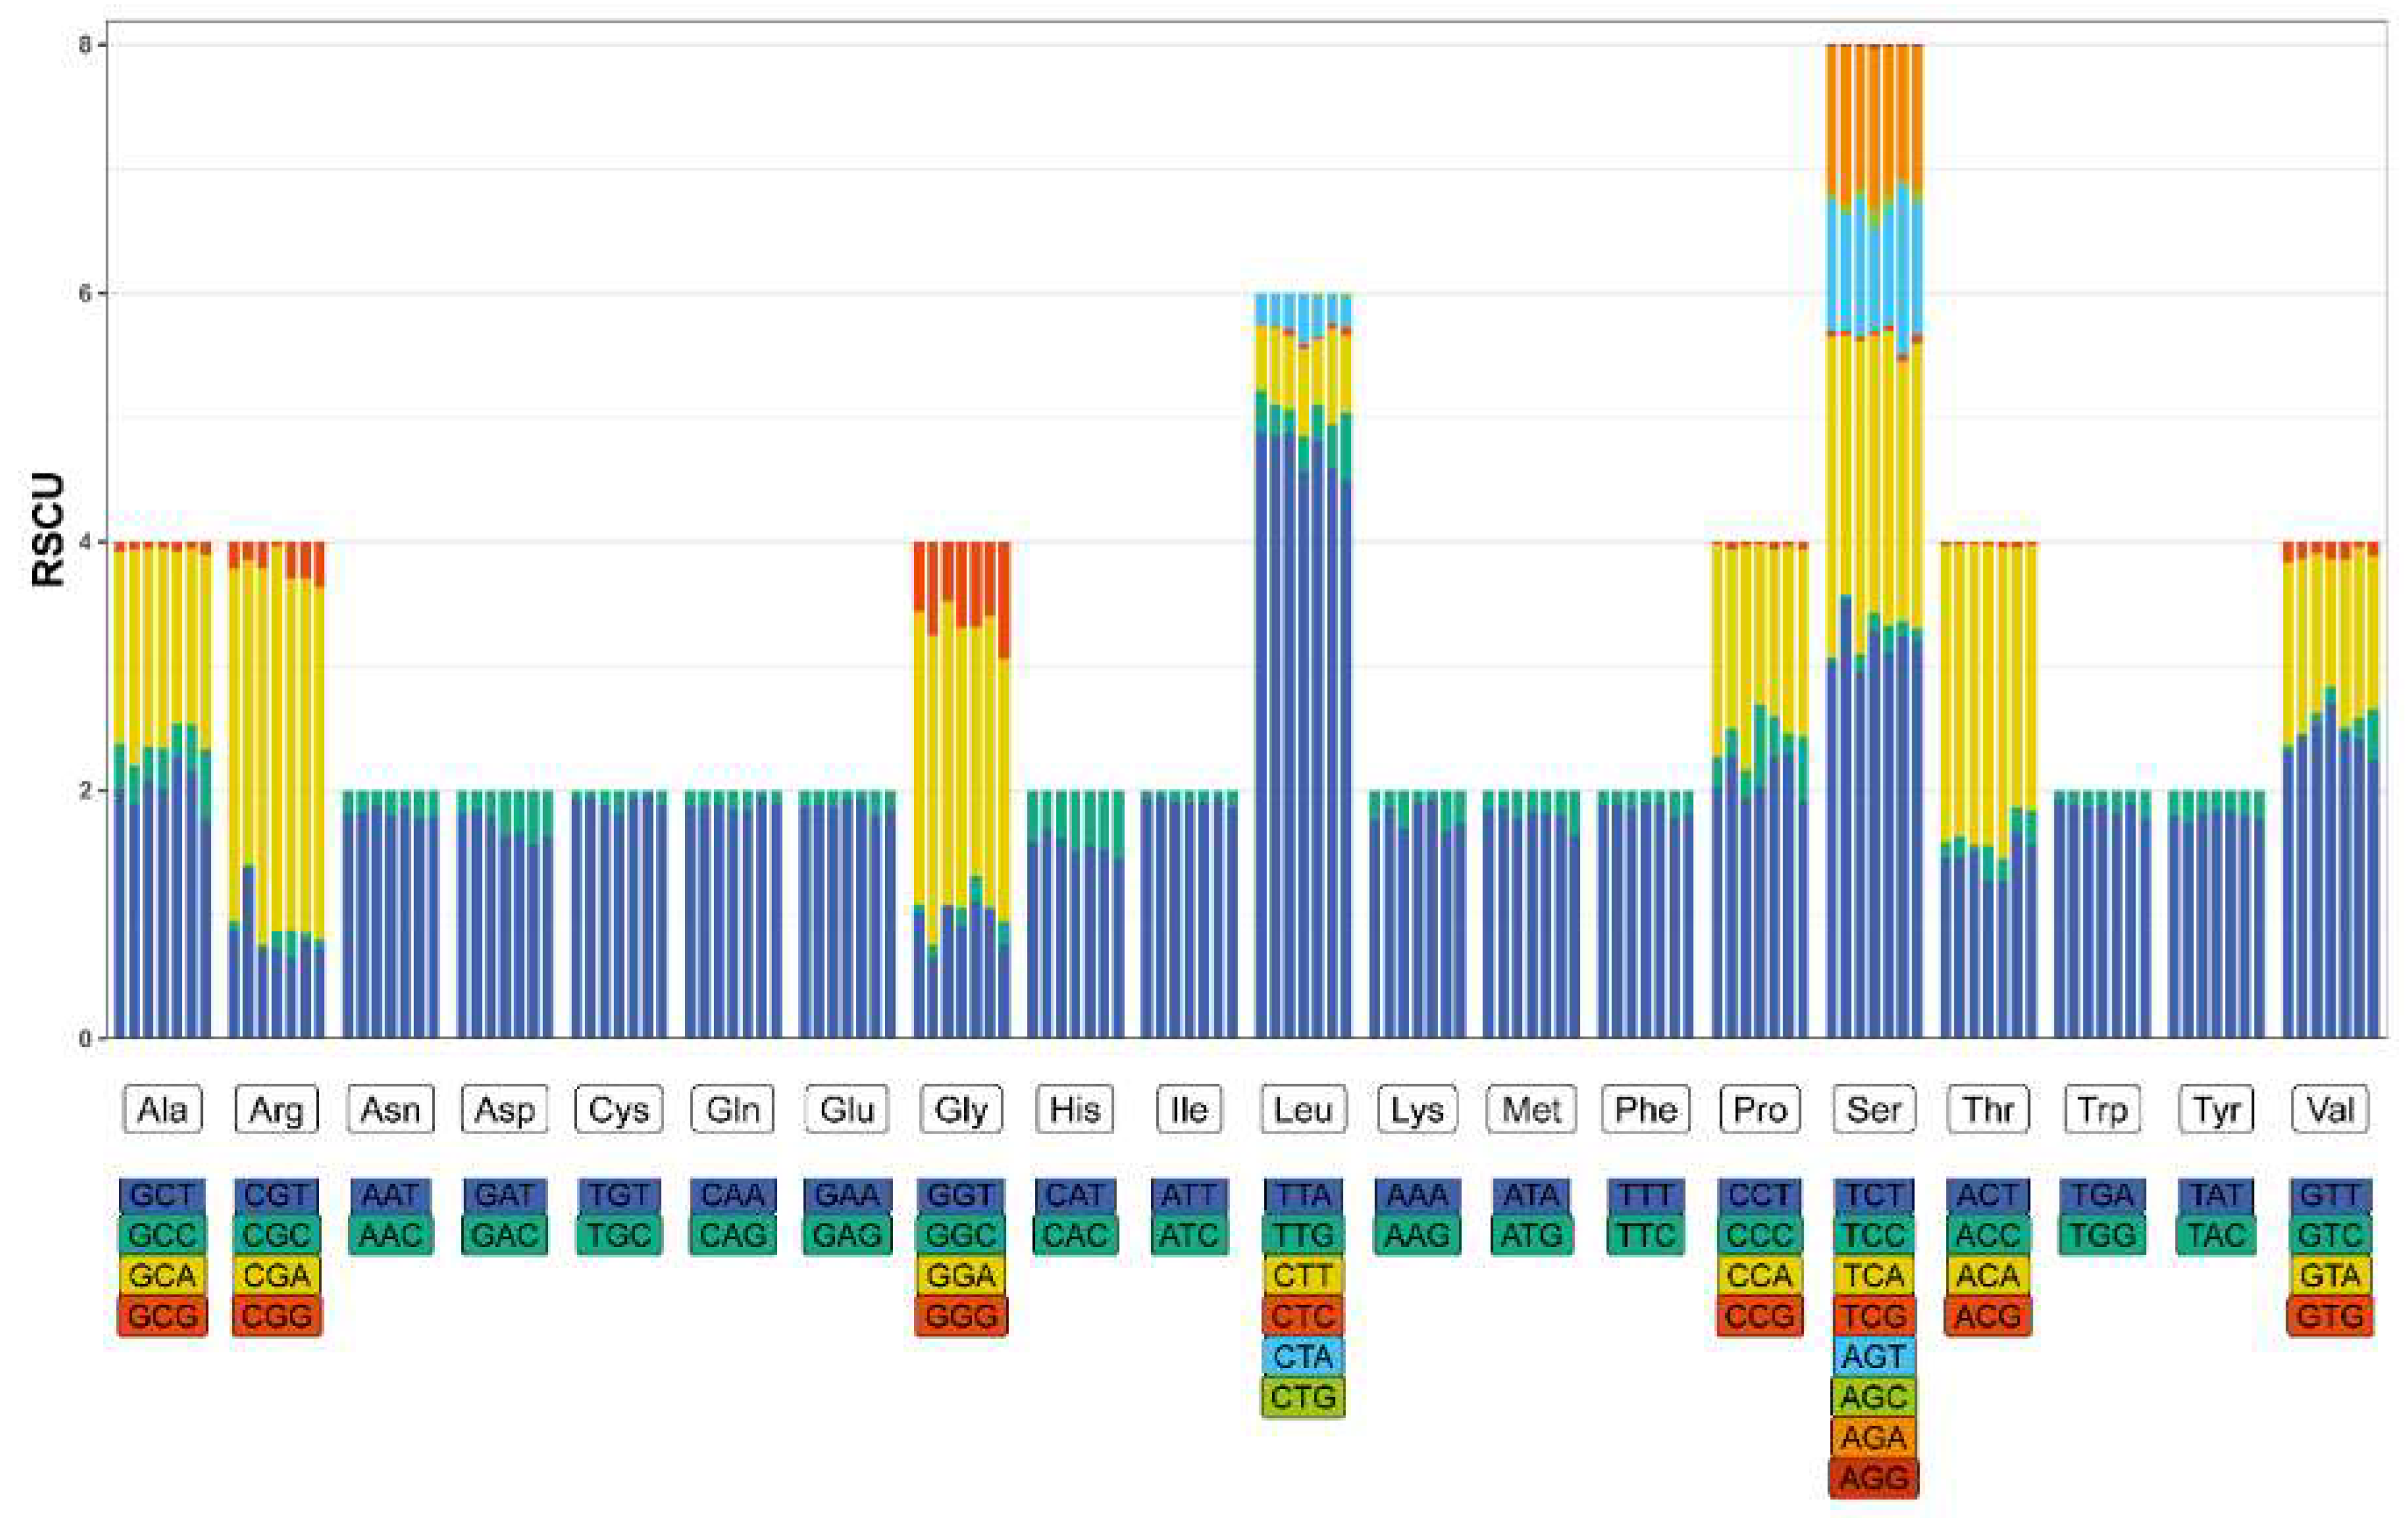
3.3. Protein-Coding Genes and Codon Usage

Among the thirteen protein-coding genes (PCGs) in the nine mitochondrial genomes, twelve utilize ATG/ATT as their start codons. An exception is the cox1 gene, which employs ATA as its start codon in Microtendipes wuyiensis (PP966951) and TTG in the other eight mitogenomes. The nad1 gene in Microtendipes wuyiensis terminates with a TAG stop codon, whereas all other genes in the remaining mitochondrial genomes utilize TAA as their stop codon. Tables S1 and S2 provide the amino acid compositions and codon usage tables, respectively. Excluding stop codons, the total number of codons ranges from 3689 to 3705. Notably, the four M. bimaculatus mitogenomes contain 3689, 3689, 3694, and 3694 codons. The most frequently utilized codons are Leu (UUA), Phe (UUU), and Ile (AUU), as illustrated in Figure 2. It is worth mentioning that, with the exception of Microtendipes bimaculatus (Clade3), the AGG codon (encoding Ser) is absent in the other mitogenomes. Similarly, the CUG codon (encoding Leu) is absent in all mitogenomes except for Microtendipes robustu and Microtendipes wuyiensis. After excluding termination codons, the relative synonymous codon usage (RSCU) was calculated and summarized for the Microtendipes species, as shown in Figure 3. Additionally, we evaluated a suite of codon usage bias metrics, including the Codon Adaptation Index (CAI), Frequency of Optimal Codons (FOP), Effective Number of Codons (ENC), and GC content at the third codon position (GC3), which are detailed in Tables S3–S7. No significant differences were observed among the Microtendipes species in these metrics.

3.4. Single-Gene-Based Barcode Limitations and Mitogenomic Advantages

The COI 5′ region barcode has been instrumental in advancing our understanding of species diversity due to its high level of sequence variation and ease of amplification. However, as our understanding of species complexity deepens, the limitations of this barcode have become increasingly apparent. One potential problem exposed by DNA barcodes is the excessive division of species, particularly in extremely diverse genera, e.g., Tanytarsus and Polypedilum [30,45]. Conversely, as identified by Song et al. (2023), Microtendipes bimaculatus Song et Qi showed deep intraspecific genetic divergence and formed three paraphyletic clades in the phylogenetic tree [24]. It is difficult to judge whether there are potential cryptic species in this group based on the overall situation at the time of the study. In this study, however, four mitogenome specimens from the three clades were used—MZ981734 for Microtendipes bimaculatus—Clade 1; PP966948 for Microtendipes bimaculatus—Clade 2; and PP966952 and PP966953 for Microtendipes bimaculatus—Clade 3—showing a genetic distance of up to 10.6%. In contrast, mitogenome-wide analyses recovered monophyly (Figure 4). We also attempted to compare the genetic differences between 13 different protein-coding genes, reassessing the genetic distances individually, as detailed in Supplementary Tables S8–S21. The intraspecific distances varied considerably: 5.3% for nad4L, 7.0% for nad1, 7.2% for nad2, 8.8% for nad4, 8.2% for nad5, 9.0% for nad3, 9.3% for cox1, 9.5% for co2, 9.6% for ATP6, 10.0% for COB, 10.0% for NAD6, 10.1% for CO3, and 13.8% for ATP8. Based on distance-threshold methods, a threshold of 2–3% is proposed for insect species; however, genus-specific thresholds have been suggested for some Chironomidae, including 4–5% for Tanytarsus [45] and 5–8% for Polypedilum [30]. Such single-gene-based barcodes might be misleading when closely related species show deep intraspecific splits [46,47]. We also constructed phylogenetic trees to infer the relationships between Microtendipes species separately, using each coding gene, the concatenated 13 protein-coding mitogenome genes, and all the mitogenome sequences (Supplementary Trees S1–S15). Only the trees based on nad3 and nad4 supported the monophyly of Microtendipes bimaculatus, albeit with low bootstrap values. Therefore, they should be considered part of the Microtendipes bimaculatus species complex, as defined by Song et al. (2023), or sibling species that are difficult to distinguish morphologically [24]. The other divergent species, Microtendipes robustus (PP966950 versus PP966954), formed robust relationships. Further analysis of the variance among different genes was conducted (Figure 4). The pairwise genetic distances were computed for thirteen PCGs across nine specimens. For the majority of PCGs, the genetic distances remained statistically indistinguishable. However, two notable exceptions were observed: the genetic distance of ATP8 was significantly higher compared to that of all other PCGs, whereas the genetic distance of nad4L was markedly lower than that of its counterparts.
While the 658 bp cox1 5′ region barcode has served as a valuable foundation for species identification and biodiversity research, the mitogenome-based barcode offers a promising alternative that may prove to be more suitable for certain applications. Its advantage lies in its ability to harness the vast genetic information contained within the mitochondrial genome. This allows for a more nuanced and accurate assessment of species relationships. Furthermore, the mitogenome-based barcode’s comprehensive nature enables researchers to delve deeper into the evolutionary history and population dynamics of species, providing insights that can inform conservation efforts and management strategies.

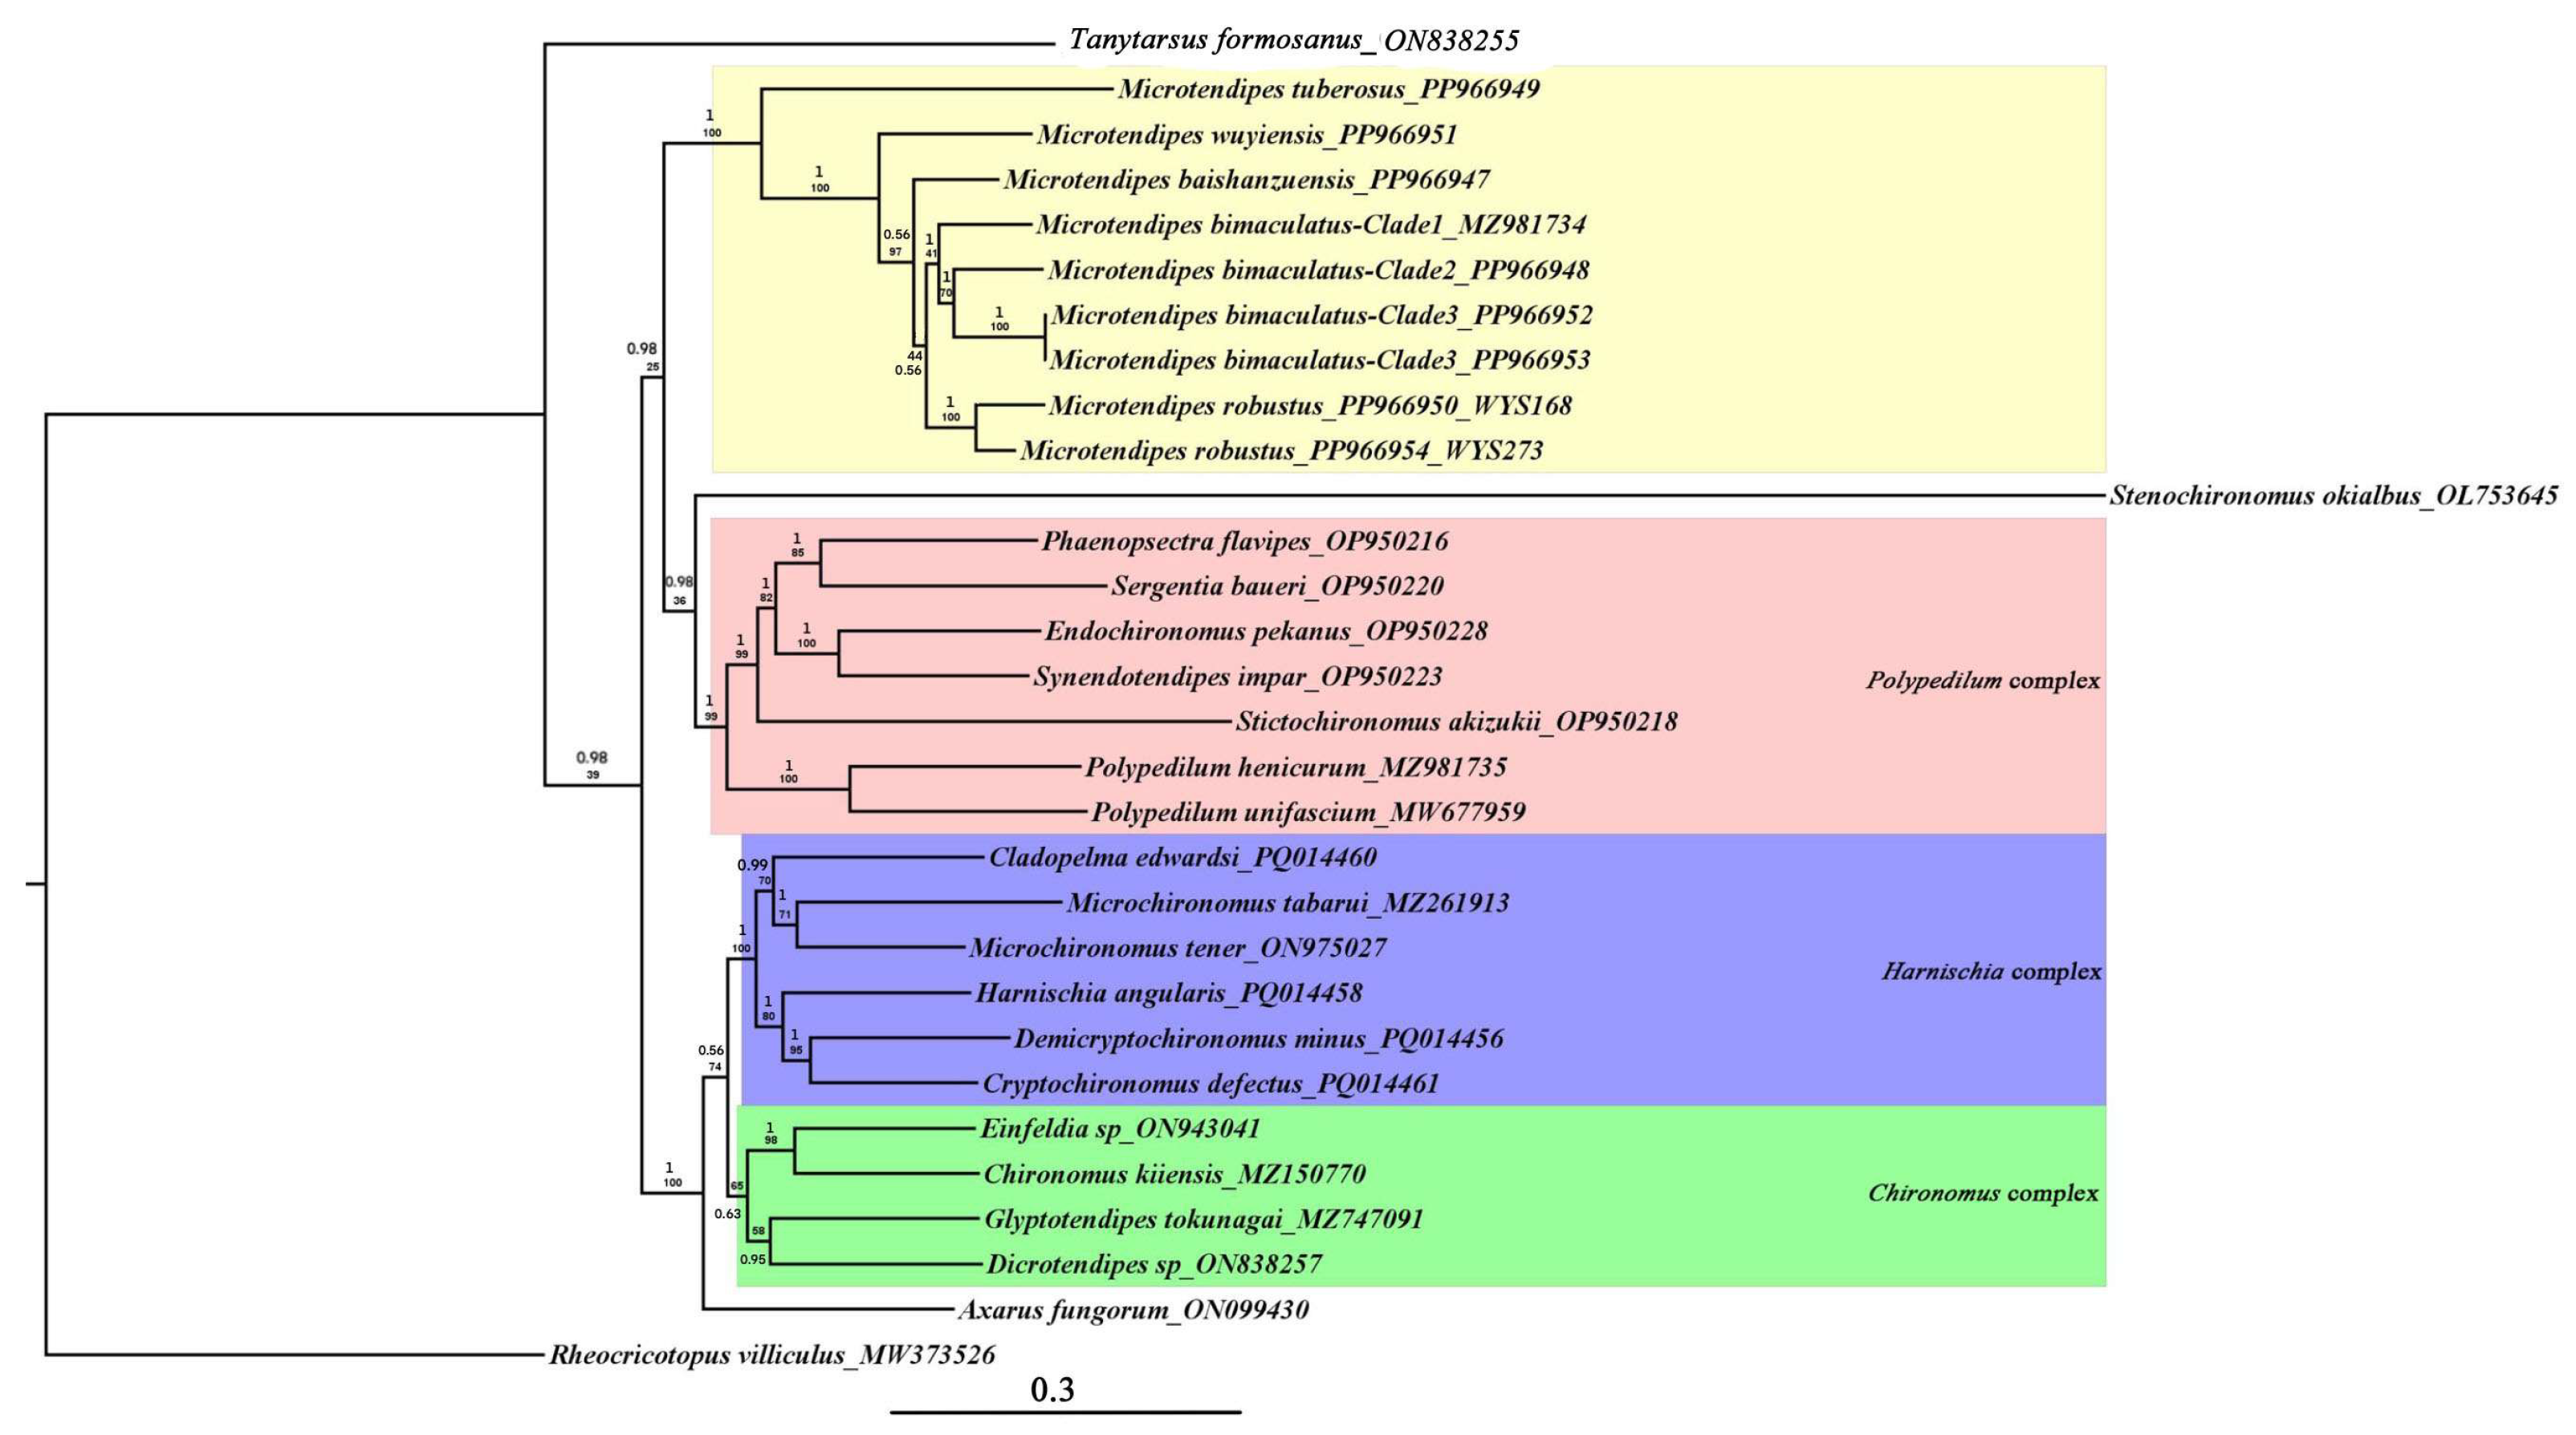
3.5. Phylogeny of Chironominae

In our analysis, all the generic complexes, such as the Polypedilum (excluding Microtendipes), Chironomus, and Harnischia complexes, formed monophyletic groups (Figure 5 and Supplementary Trees S16–S23). The genus Stenochironomus exhibited instability in our phylogenetic trees, being a sister to either other Chironominae species or to species within the Polypedilum complex. When Stenochironomus was removed from our analysis, topologies remained consistent with those generated prior to taxon removal, demonstrating no structural alterations in the phylogenetic relationships within Chironominae (Tree S24). Similarly, the phylogenetic position of Microtendipes within Chironominae was unstable. Three primary topologies were constructed: (1) Tanytarsus, (Polypedilum complex, (Microtendipes, (Harnischia complex + Chironomus complex))), (2) Tanytarsus, ((Chironomus complex + Harnischia complex), (Polypedilum complex, Microtendipes)), and (3) Tanytarsus, (Microtendipes, (Polypedilum complex, (Chironomus complex + Harnischia complex))), with the last one resembling that proposed by Sæther (1977) [26]. This similarity suggests that Microtendipes and its related taxa may constitute a generic complex or potentially represent the fourth tribe within this subfamily. Dataset (iii) proposed the (Chironomus complex (Polypedilum complex (Tanytarsus, Microtendipes))), relationship, which does not show ideal alignment with current taxonomy. Specifically, the positioning of Tanytarsus within the Chironomini tribe is incongruent, whereas the similar relationship between Microtendipes and Tanytarsus echoes observations made by Cranston et al. (2012) [28]. Importantly, most results do not support the inclusion of Microtendipes within the Polypedilum complex, thereby refuting the categorization proposed by Sasa (1989) [27]. Given the absence of mitochondrial genome data for Pseudochironomini, we are currently unable to conclusively determine the genus’s taxonomic status. Nonetheless, we are committed to expanding our study by incorporating additional taxa from Tanytarsini and Pseudochironomini, aiming to unravel the precise phylogenetic positioning of Microtendipes with greater accuracy.
The phylogenetic relationships within the genus Microtendipes have remained an enigmatic puzzle, particularly concerning subdivision into species groups. Two distinct species groups, the pedellus group and the rydalensis group, were established based on larval stages, utilizing two pivotal characters: the number of premandibular teeth and the shape of a median tooth on the mentum [48]. According to this diagnostic criterion, M. baishanzuensis is classified within the rydalensis group, whereas Microtendipes tuberosus and Microtendipes robustus are assigned to the pedellus group (unpublished data). However, it is evident that this classification system does not align seamlessly with the phylogenetic tree, as Microtendipes tuberosus occupies a basal position within the genus’s clade, while other species occupy distinct and separate clades (Figure 5). This discrepancy underscores the need for further investigation to clarify the evolutionary relationships and taxonomic structure within the genus Microtendipes.

4. Conclusions

All eight mitogenomes that were newly sequenced in this study demonstrated a striking congruity in their structural features and nucleotide compositions when juxtaposed against previously published Chironomidae data. Mitogenome-based species delimitation within the genus Microtendipes offers a more precise and nuanced perspective than COI-based barcoding, particularly those that involve substantial intraspecific genetic distances. Our comparative analysis of Microtendipes (Diptera: Chironomidae) mitogenomes has yielded invaluable insights into their phylogenetic relationships, which do not support the division into two species groups based on larvae. This analysis also has definitively refuted the placement of Microtendipes within the Polypedilum complex, instead tentatively establishing it as a distinct species group and tribe, thereby advancing our understanding of this intriguing taxonomic entity.

Supplementary Materials

The following supporting information can be downloaded at: https://www.mdpi.com/article/10.3390/d17060424/s1. Tree files can be visualized using FigTree v.1.4.2 [49]. Pairwise distances were calculated in MEGA 11 [40] under the Kimura 2-parameter (K2P) substitution model [50]. Table S1: Amino acid composition of Microtendipes; Table S2: codon usage of Microtendipes; Table S3: Codon adaptation index of Microtendipes; Table S4: Frequency of optimal codons of Microtendipes; Table S5: Effective number of codons of Microtendipes; Table S6: Base composition by position of Microtendipes; Table S7: Relative synonymous codon usage of Microtendipes; Table S8: Genetic divergences based on ATP6; Table S9: Genetic divergences based on ATP8; Table S10: Genetic divergences based on COb; Table S11: Genetic divergences based on CO1; Table S12: Genetic divergences based on CO1-658; Table S13: Genetic divergences based on COII; Table S14: Genetic divergences based on CO3; Table S15: Genetic divergences based on nad1; Table S16: Genetic divergences based on nad2; Table S17: Genetic divergences based on nad3; Table S18: Genetic divergences based on nad4; Table S19: Genetic divergences based on na4L; Table S20: Genetic divergences based on nad5; Table S21: Genetic divergences based on nad6; Tree S1 ML tree based on ATP6; Tree S2 ML tree based on ATP8; Tree S3 ML tree based on COI; Tree S4 ML tree based on CO2; Tree S5 ML tree based on CO3; Tree S6 ML tree based on COb; Tree S7 ML tree based on nad1; Tree S8 ML tree based on nad2; Tree S9 ML tree based on nad3; Tree S10 ML tree based on nad4; Tree S11 ML tree based on nad4L; Tree S12 ML tree based on nad5; Tree S13 ML tree based on nad6; Tree S14 BI tree based on protein coding genes; Tree S15 BI tree based on mitogenome genes; Tree S16 ML tree-based protein coding genes without partition; Tree S17 ML tree-based protein coding genes codon 1st and codon 2nd without partition; Tree S18 ML tree-based protein coding genes codon 1st and codon 2nd and rDNA without partition; Tree S19 ML tree-based protein coding genes and rDNA without partition; Tree S20 ML tree-based protein coding genes with partition; Tree S21 ML tree-based protein coding genes codon 1st and codon 2nd with partition; Tree S22 ML tree-based protein coding genes codon 1st and codon 2nd and rDNA with partition; Tree S23 ML tree-based protein coding genes and rDNA with partition. Tree S24 BI tree based on all mitogenomes without partition. Figure S1: Mitochondrial genome map of Microtendipes baishanzuensis; Figure S2: Mitochondrial genome map of Microtendipes bimaculatus—clade 2; Figure S3: Mitochondrial genome map of Microtendipes bimaculatus—clade 3; Figure S4: Mitochondrial genome map of Microtendipes bimaculatus—clade 3-2; Figure S5: Mitochondrial genome map of Microtendipes robustus-1; Figure S6: Mitochondrial genome map of Microtendipes robustus-2; Figure S7: Mitochondrial genome map of Microtendipes wuyinensis.

Author Contributions

Performed the experimental procedures and data collection: W.W., Y.W., T.L. and C.S. Conceived and designed the research project: L.L. and X.Q. Analyzed the data and wrote the manuscript: C.S., L.L. and X.Q. All authors have read and agreed to the published version of the manuscript.

Funding

This research was funded by the National Natural Science Foundation of China (NSFC, Grant Nos. 32100353 and 32070481) and the Zhejiang Provincial Natural Science Foundation of China (Grant No. LY22C040003).

Institutional Review Board Statement

Not applicable.

Data Availability Statement

Data supporting this study are available in the article and accompanying online Supplementary Materials, and in NCBI GenBank (https://www.ncbi.nlm.nih.gov/) under the following accession numbers: PP966947–PP966954.

Conflicts of Interest

Author Luxian Li was employed by the company Zhejiang Environment Technology Co., Ltd. The remaining authors declare that the research was conducted in the absence of any commercial or financial relationships that could be construed as a potential conflict of interest.

References

  1. Cameron, S.L. Insect Mitochondrial Genomics: Implications for Evolution and Phylogeny. Annu. Rev. Entomol. 2014, 59, 95–117. [Google Scholar] [CrossRef] [PubMed]
  2. Chen, L.P.; Zheng, F.Y.; Bai, J.; Wang, J.M.; Li, X.J. Comparative analysis of mitogenomes among six species of grasshoppers (Orthoptera: Acridoidea: Catantopidae) and their phylogenetic implications in wing-type evolution. Int. J. Biol. Macromol. 2020, 159, 1062–1072. [Google Scholar] [CrossRef] [PubMed]
  3. Jiang, J.; Chen, X.; Li, C.; Song, Y.H. Mitogenome and phylogenetic analysis of typhlocybine leafhoppers (Hemiptera: Cicadellidae). Sci. Rep. 2021, 11, 10053. [Google Scholar] [CrossRef] [PubMed]
  4. Zheng, C.; Zhu, X.; Wang, Y.; Dong, X.; Yang, R.; Tang, Z.; Bu, W. Mitogenomes Provide Insights into the Species Boundaries and Phylogenetic Relationships among Three Dolycoris Sloe Bugs (Hemiptera: Pentatomidae) from China. Insects 2024, 15, 134. [Google Scholar] [CrossRef]
  5. Mohamed, W.M.A.; Moustafa, M.A.M.; Thu, M.J.; Kakisaka, K.; Chatanga, E.; Ogata, S.; Hayashi, N.; Taya, Y.; Ohari, Y.; Naguib, D.; et al. Comparative mitogenomics elucidates the population genetic structure of Amblyomma testudinarium in Japan and a closely related Amblyomma species in Myanmar. Evol. Appl. 2022, 15, 1062–1078. [Google Scholar] [CrossRef]
  6. Yamamoto, K.; Sakaue, S.; Matsuda, K.; Murakami, Y.; Kamatani, Y.; Ozono, K.; Momozawa, Y.; Okada, Y. Genetic and phenotypic landscape of the mitochondrial genome in the Japanese population. Commun. Biol. 2020, 3, 104. [Google Scholar] [CrossRef]
  7. Boore, J.L. Animal mitochondrial genomes. Nucleic Acids Res. 1999, 27, 1767–1780. [Google Scholar] [CrossRef]
  8. Finstermeier, K.; Zinner, D.; Brameier, M.; Meyer, M.; Kreuz, E.; Hofreiter, M.; Roos, C.; Stanyon, R. A mitogenomic phylogeny of living primates. PLoS ONE 2013, 8, e69504. [Google Scholar] [CrossRef]
  9. Ma, Q.; Li, F.; Zheng, J.; Liu, C.; Wang, A.; Yang, Y.; Gu, Z. Mitogenomic phylogeny of Cypraeidae (Gastropoda: Mesogastropoda). Front Ecol. Evol. 2023, 11, 1138297. [Google Scholar] [CrossRef]
  10. Irwin, A.R.; Strong, E.E.; Kano, Y.; Harper, E.M.; Williams, S.T. Eight new mitogenomes clarify the phylogenetic relationships of Stromboidea within the caenogastropod phylogenetic framework. Mol. Phylogenet. Evol. 2021, 158, 107081. [Google Scholar] [CrossRef]
  11. Phillips, M.J.; Zakaria, S.S. Enhancing mitogenomic phylogeny and resolving the relationships of extinct megafaunal placental mammals. Mol. Phylogenet. Evol. 2021, 158, 107082. [Google Scholar] [CrossRef] [PubMed]
  12. Poliseno, A.; Feregrino, C.; Sartoretto, S.; Aurelle, D.; Wörheide, G.; McFadden, C.S.; Vargas, S. Comparative mitogenomics, phylogeny and evolutionary history of Leptogorgia (Gorgoniidae). Mol. Phylogenet. Evol. 2017, 115, 181–189. [Google Scholar] [CrossRef] [PubMed]
  13. Timmermans, M.J.T.N.; Lees, D.C.; Simonsen, T.J. Towards a mitogenomic phylogeny of Lepidoptera. Mol. Phylogenet. Evol. 2014, 79, 169–178. [Google Scholar] [CrossRef] [PubMed]
  14. Fang, X.; Wang, X.; Mao, B.; Xiao, Y.; Shen, M.; Fu, Y. Comparative mitogenome analyses of twelve non-biting flies and provide insights into the phylogeny of Chironomidae (Diptera: Culicomorpha). Sci. Rep. 2023, 13, 9200. [Google Scholar] [CrossRef]
  15. Li, S.Y.; Chen, M.H.; Sun, L.; Wang, R.H.; Li, C.H.; Gresens, S.; Li, Z.; Lin, X.L. New mitogenomes from the genus Cricotopus (Diptera: Chironomidae, Orthocladiinae): Characterization and phylogenetic implications. Arch. Insect Biochem. Physiol. 2024, 115, e22067. [Google Scholar] [CrossRef]
  16. Lin, X.L.; Liu, Z.; Yan, L.P.; Duan, X.; Bu, W.J.; Wang, X.H.; Zheng, C.G. Mitogenomes provide new insights of evolutionary history of Boreheptagyiini and Diamesini (Diptera: Chironomidae: Diamesinae). Ecol. Evol. 2022, 12, e8957. [Google Scholar] [CrossRef]
  17. Zhang, D.; He, F.X.; Li, X.B.; Aishan, Z.; Lin, X.L. New mitogenomes of the Polypedilum generic complex (Diptera: Chironomidae): Characterization and phylogenetic implications. Insects 2023, 14, 238. [Google Scholar] [CrossRef]
  18. Kawai, K.; Kawaguchi, K.; Kodama, A.; Saito, H. Fundamental studies on acid-tolerant chironomids in Japan. Limnology 2019, 20, 101–107. [Google Scholar] [CrossRef]
  19. Pinder, L.C.V. Biology of freshwater Chironomidae. Annu. Rev. Entomol. 1986, 31, 1–23. [Google Scholar] [CrossRef]
  20. Martel-Cea, A.; Astorga, G.A.; Hernández, M.; Caputo, L.; Abarzúa, A.M. Modern chironomids (Diptera: Chironomidae) and the environmental variables that influence their distribution in the Araucanian lakes, south-central Chile. Hydrobiologia 2021, 848, 2551–2568. [Google Scholar] [CrossRef]
  21. Kozeretska, I.; Serga, S.; Kovalenko, P.; Gorobchyshyn, V.; Convey, P. Belgica antarctica (Diptera: Chironomidae): A natural model organism for extreme environments. Insect Sci. 2022, 29, 2–20. [Google Scholar] [CrossRef] [PubMed]
  22. Qi, X.; Wang, X.H. A review of Microtendipes Kieffer from China (Diptera: Chironomidae). Zootaxa 2006, 1108, 37–51. [Google Scholar] [CrossRef]
  23. Tang, H.; Niitsuma, H. Review of the Japanese Microtendipes (Diptera: Chironomidae: Chironominae), with description of a new species. Zootaxa 2017, 4320, 535–553. [Google Scholar] [CrossRef]
  24. Song, C.; Wang, L.; Lei, T.; Qi, X. New color-patterned species of Microtendipes Kieffer, 1913 (Diptera: Chironomidae) and a deep intraspecific divergence of species by DNA barcodes. Insects 2023, 14, 227. [Google Scholar] [CrossRef]
  25. Cao, J.K.; Lei, T.; Gu, J.J.; Song, C.; Qi, X. Codon bias analysis of the mitochondrial genome reveals natural selection in the nonbiting midge Microtendipes umbrosus Freeman, 1955 (Diptera: Chironomidae). Pan-Pac. Entomol. 2023, 99, 217–225. [Google Scholar] [CrossRef]
  26. Sæther, O.A. Female genitalia in Chironomidae and other Nematocera: Morphology, phylogenies, keys. Bull. Fish. Res. Board Canada 1977, 197, 1–209. [Google Scholar]
  27. Sasa, M. Chironomidae of Japan: Checklist of species recorded, key to males and taxonomic notes. NIES Res. Rep. 1989, 125, 1–177. [Google Scholar]
  28. Cranston, P.S.; Hardy, N.B.; Morse, G.E. A dated molecular phylogeny for the Chironomidae (Diptera). Syst. Entomol. 2012, 37, 172–188. [Google Scholar] [CrossRef]
  29. Folmer, O.; Black, M.; Hoeh, W.; Lutz, R.; Vrijenhoek, R. DNA primers for amplification of mitochondrial oxidase subunit I from diverse metazoan invertebrates. Mol. Mar. Biol. Biotechnol. 1994, 3, 294–299. [Google Scholar]
  30. Song, C.; Lin, X.L.; Wang, Q.; Wang, X.H. DNA barcodes successfully delimit morphospecies in a superdiverse insect genus. Zool. Scr. 2018, 47, 311–324. [Google Scholar] [CrossRef]
  31. Meng, G.; Li, Y.; Yang, C.; Liu, S. MitoZ: A toolkit for animal mitochondrial genome assembly, annotation and visualization. Nucleic Acids Res. 2019, 47, e63. [Google Scholar] [CrossRef] [PubMed]
  32. Dierckxsens, N.; Mardulyn, P.; Smits, G. NOVOPlasty: De novo assembly of organelle genomes from whole genome data. Nucleic Acids Res. 2017, 45, e18. [Google Scholar] [PubMed]
  33. Prjibelski, A.; Antipov, D.; Meleshko, D.; Lapidus, A.; Korobeynikov, A. Using SPAdes de novo assembler. Curr. Protoc. Bioinform. 2020, 70, e102. [Google Scholar] [CrossRef] [PubMed]
  34. Stothard, P.; Wishart, D.S. Circular genome visualization and exploration using CGView. Bioinformatics 2005, 21, 537–539. [Google Scholar] [CrossRef]
  35. Donath, A.; Jühling, F.; Al-Arab, M.; Bernhart, S.H.; Reinhardt, F.; Stadler, P.F.; Middendorf, M.; Bernt, M. Improved annotation of protein-coding genes boundaries in metazoan mitochondrial genomes. Nucleic Acids Res. 2019, 47, 10543–10552. [Google Scholar] [CrossRef]
  36. Shen, W.; Sipos, B.; Zhao, L. SeqKit2: A Swiss army knife for sequence and alignment processing. iMeta 2024, 5, e191. [Google Scholar] [CrossRef]
  37. Rice, P.; Longden, I.; Bleasby, A. EMBOSS: The European molecular biology open software suite. Trends Genet. 2000, 16, 276–277. [Google Scholar] [CrossRef]
  38. Wickham, H.; Chang, W.; Wickham, M.H. Package ‘ggplot2’. Create elegant data visualizations using the grammar of graphics. Version 2016, 2, 1–189. [Google Scholar]
  39. Katoh, K.; Standley, D.M. MAFFT multiple sequence alignment software version 7: Improvements in performance and usability. Mol. Biol. Evol. 2013, 30, 772–780. [Google Scholar] [CrossRef]
  40. Tamura, K.; Stecher, G.; Kumar, S. MEGA11: Molecular evolutionary genetics analysis version 11. Mol. Biol. Evol. 2021, 38, 3022–3027. [Google Scholar] [CrossRef]
  41. Stamatakis, A. RAxML version 8: A tool for phylogenetic analysis and post-analysis of large phylogenies. Bioinformatics 2014, 30, 1312–1313. [Google Scholar] [CrossRef] [PubMed]
  42. Ronquist, F.; Teslenko, M.; Van der Mark, P.; Ayres, D.L.; Darling, A.; Höhna, S.; Larget, B.; Liu, L.; Suchard, M.A.; Huelsenbeck, J.P. MRBAYES 3.2: Efficient Bayesian phylogenetic inference and model selection across a large model space. Syst. Biol. 2012, 61, 539–542. [Google Scholar] [CrossRef] [PubMed]
  43. Lanfear, R.; Frandsen, P.B.; Wright, A.M.; Senfeld, T.; Calcott, B. PartitionFinder 2: New methods for selecting partitioned models of evolution for molecular and morphological phylogenetic analyses. Mol. Biol. Evol. 2017, 34, 772–773. [Google Scholar] [CrossRef] [PubMed]
  44. Letunic, I.; Bork, P. Interactive Tree of Life (iTOL) v5: An online tool for phylogenetic tree display and annotation. Nucleic Acids Res. 2021, 49, W293–W296. [Google Scholar] [CrossRef]
  45. Lin, X.L.; Stur, E.; Ekrem, T. Exploring genetic divergence in a species-rich insect genus using 2790 DNA barcodes. PLoS ONE 2015, 10, e0138993. [Google Scholar] [CrossRef]
  46. Meier, R.; Shiyang, K.; Vaidya, G.; Ng, P.K.L. DNA barcoding and taxonomy in diptera: A tale of high intraspecific variability and low identification success. Syst. Biol. 2006, 55, 715–728. [Google Scholar] [CrossRef]
  47. Yeo, D.; Puniamoorthy, J.; Ngiam, R.W.; Meier, R. Towards holomorphology in entomology: Rapid and cost-effective adult–larva matching using NGS barcodes. Syst. Entomol. 2018, 43, 678–691. [Google Scholar] [CrossRef]
  48. Epler, J.H.; Ekrem, T.; Cranston, P.S. The larvae of Holarctic Chironominae (Diptera: Chironomidae)–Keys and diagnoses. Insect Syst. Evol. 2013, 66, 387–556. [Google Scholar]
  49. Rambaut, A. FigTree v1.4.2. 2018. Available online: http://tree.bio.ed.ac.uk/software/figtree/ (accessed on 23 April 2025).
  50. Kimura, M. A simple method for estimating evolutionary rate of base substitutions through comparative studies of nucleotide sequences. J. Mol. Evol. 1980, 16, 111–120. [Google Scholar] [CrossRef]
Figure 1. Mitochondrial genome map of Microtendipes tuberosus. The CDS, tRNAs, rRNAs, GC skew, and GC content are shown in the map.
Diversity 17 00424 g001
Figure 2. Amino acid frequencies of PCGs in mitochondrial genomes of Microtendipes species. Different colors represent different species.
Diversity 17 00424 g002
Figure 3. Relative synonymous codon usage (RSCU) of PCGs in mitochondrial genomes of Microtendipes species. The seven bars of each group represent M. baishanzuensis, M. bimaculatus_Clade1, M. bimaculatus_Clade2, M. bimaculatus_Clade3, M. robustus, M. tuberosus, and M. wuyiensis, separately.
Diversity 17 00424 g003
Figure 4. Phylogenetic tree of Maximum Likelihood inference for selected Chironominae species based on all non-partitioned mitogenome sequences. Branches are color-coded by genus complex. The upper values on each branch represent the bootstrap supports (%), and the lower values are Bayesian posterior probabilities (PPs).
Diversity 17 00424 g004
Figure 5. The genetic distance of PCGs between nine specimens. CO1_658 represents the 658 bp COI barcode. Genes with shared letters (a–h) are not significantly different (p > 0.05, Friedman test and Wilcoxon rank-sum test).
Diversity 17 00424 g005
Table 1. List of the mitochondrial genomes analyzed in the present study; * means from this study.
SpeciesAccession No.SpeciesAccession No.
Axarus fungorumON099430Demicryptochironomus minusPQ014456
Chironomus kiiensisMZ150770Cryptochironomus defectusPQ014461
Microchironomus tabaruiMZ261913Cladopelma edwardsiPQ014460
Microtendipes bimaculatusclade1MZ981734Dicrotendipes sp.ON838257
Microtendipes bimaculatusclade2PP966948 *Einfeldia sp.ON943041
Microtendipes bimaculatusclade3PP966952 *Endochironomus pekanusOP950228
Microtendipes bimaculatusclade3PP966953 *Glyptotendipes tokunagaiMZ747091
Microtendipes baishanzuensisPP966947 *Microchironomus tenerON975027
Microtendipes tuberosusPP966949 *Phaenopsectra flavipesOP950216
Microtendipes wuyiensisPP966951 *Sergentia baueriOP950220
Microtendipes robustusPP966950 *Stictochironomus akizukiiOP950218
Microtendipes robustusPP966954 *Synendotendipes imparOP950223
Polypedilum henicurumMZ981735Synendotendipes sp.1OP950221
Polypedilum unifasciumMW677959Tanytrarsus formosanusON838255
Stenochironomus okialbusOL753645Rheocricotopus villiculusMW373526
Harnischia angularisPQ014458
Table 2. Nucleotide compositions of nine Microtendipes mitogenomes.
SpeciesWhole GenomePCGtRNA
Length
(bp)
AT%AT-Skew%GC%GC-
Skew%
Length
(bp)
AT%AT-
Skew%
GC%GC-
Skew%
Length
(bp)
AT%AT-
Skew%
GC%GC-
Skew%
M. bimaculatus15,82780.411.0819.59−18.1311,12177.84−17.6922.161.62157882.76−3.6717.2429.41
M. bimaculatus15,84880.11.8819.9−18.8711,12177.63−17.6622.370.88158382.56−3.7617.4428.99
M. bimaculatus16,34080.282.6219.72−20.7311,10677.06−17.9122.94−1.65157582.67−3.6917.3329.67
M. bimaculatus15,82379.762.6620.24−20.311,10677.02−17.9422.98−1.57158382.82−3.4317.1830.15
M. baishanzuensis15,83780.352.0819.65−19.5411,12177.8−17.3222.21.90157782.18−3.7017.8231.67
M. tuberosus16,25779.972.6120.03−19.7411,15476.94−19.1623.060.16159582.88−2.4317.1227.47
M. robustus15,75680.122.1019.88−18.9711,10977.5−18.0422.50.56159382.93−2.9517.0729.41
M. robustus16,05080.771.6719.23−18.0411,10978.09−17.9221.912.38158282.62−3.2917.3831.64
M. wuyiensis16,19379.192.3420.81−22.2611,11876.07−18.1323.930.56158782.61−3.1617.3928.99
SpeciesrRNACR
Length
(bp)
AT%AT
-Skew%
GC%GC-
Skew%
Length
(bp)
AT%AT-
Skew%
GC%GC-
Skew%
M. bimaculatus149282.445.0517.5612.9872694.9−8.275.1−56.76
M. bimaculatus149482.264.4817.7416.2340894.36−2.335.64−47.83
M. bimaculatus149682.294.7917.7113.96126694.550.585.45−62.32
M. bimaculatus149882.314.9417.6913.9692294.1405.86−55.56
M. baishanzuensis149282.514.3017.4913.4179894.74−9.525.26−57.14
M. tuberosus150881.433.9218.5714.2966494.585.415.42−72.22
M. robusts148882.394.7317.6115.2772796.420.723.58−53.85
M. robusts149082.425.0517.5813.7461595.45−0.854.55−35.71
M. wuyiensis150181.485.6518.5212.2333895.56−3.414.44−46.67
Disclaimer/Publisher’s Note: The statements, opinions and data contained in all publications are solely those of the individual author(s) and contributor(s) and not of MDPI and/or the editor(s). MDPI and/or the editor(s) disclaim responsibility for any injury to people or property resulting from any ideas, methods, instructions or products referred to in the content.

