Article

Advancing Regional Adaptation and Nitrogen Stress Resilience Through Integrative Phenotyping of Watkins Wheat Landraces via Source–Sink Dynamics

1
Shenzhen Branch, Guangdong Laboratory for Lingnan Modern Agriculture, Genome Analysis Laboratory of the Ministry of Agriculture, Agricultural Genomics Institute at Shenzhen, Chinese Academy of Agricultural Sciences, Shenzhen 518020, China
2
College of Agriculture, South China Agricultural University, Guangzhou 510642, China
*
Authors to whom correspondence should be addressed.
These authors contributed equally to this work.
Diversity 2025, 17(5), 359; https://doi.org/10.3390/d17050359
Submission received: 27 March 2025 / Revised: 15 May 2025 / Accepted: 16 May 2025 / Published: 19 May 2025
(This article belongs to the Section Plant Diversity)

Abstract

:
Historical landrace collections, such as the Watkins Wheat Collection, harbor immense genetic diversity that holds the potential to transform our understanding of crop resilience and adaptation. This study employs a novel integrative phenotyping approach to dissect regional adaptation and nitrogen stress resilience in Watkins wheat landraces under contrasting nitrogen regimes. By leveraging a multidimensional framework, including stress indices, geographic analyses, and multivariate clustering, this work identifies 48 landraces with contrasting responses to nitrogen limitation. High-performing genotypes, such as WATDE0013 and WATDE0020, exhibited superior biomass partitioning under stress, reflecting historical adaptation to low-input agroecosystems spanning Europe, Asia, and North Africa. These findings emphasize the value of phenotypic plasticity in nitrogen use efficiency (NUE) improvement. In contrast, low-performing accessions, such as WATDE1055, highlighted vulnerabilities to nitrogen limitation, illustrating the importance of comprehensive phenotypic screening for gene-bank prioritization. Regional adaptation patterns, elucidated through geographic analyses, uncovered stress-resilient genotypes clustered in historically marginal agricultural regions, revealing adaptive traits shaped by environmental selection pressures. Principal component analysis (PCA) and hierarchical clustering delineated five distinct phenotypic groups, enhancing our understanding of evolutionary trajectories within this collection. This integrative approach transcends traditional phenotyping methods by linking phenotype, genotype, and geographic context to uncover nuanced adaptive traits. By bridging gene bank conservation with a systems-level understanding of crop evolution, this study provides actionable insights and a robust framework for breeding climate-resilient wheat varieties. These findings underscore the critical role of preserving genetic diversity in landraces to address global challenges in nitrogen stress and climate resilience.

1. Introduction

Wheat (Triticum aestivum L.) is one of the most important cereal crops globally, serving as a staple food for over 35% of the world’s population [1]. As a key rabi season crop, wheat plays a vital role in ensuring food security, particularly in developing nations [2]. However, achieving optimal wheat yields requires careful management of nutrients throughout its growth cycle, which spans 140–160 days [3,4]. Among the essential nutrients, nitrogen is particularly critical due to its central role in plant physiological processes [5]. Nitrogen is a fundamental component of amino acids, chlorophyll, nucleic acids, ATP, and phytohormones, all of which are indispensable for plant growth and development [6,7].
Watkins wheat landraces represent a unique and underexplored genetic resource characterized by their historical cultivation and adaptation to diverse environments [8]. We leveraged the extensive genetic, geographic, and phenotypic variation present in the A.E. Watkins bread wheat landrace collection (referred to as ‘Watkins’ in this study), which includes 827 accessions gathered from 32 countries during the 1920s and 1930s [9]. These landraces exhibit significant variability in traits related to nitrogen use efficiency, biomass allocation, and source–sink dynamics, making them an ideal model for studying the effects of nitrogen regimes on plant growth and yield [10]. Unlike modern wheat varieties, which have been bred for high yield and uniformity, Watkins landraces retain a broad genetic diversity that can provide valuable insights into the physiological and evolutionary basis of stress tolerance and resource use efficiency [8,11]. The historical cultivation of Watkins landraces in low-input agricultural systems has shaped their unique adaptive traits, such as robust root systems and high nitrogen efficiency, which are largely lost in modern high-yielding cultivars. These landraces offer a genetic reservoir for improving climate resilience and nutrient use efficiency in wheat, highlighting their importance for gene bank conservation and breeding programs. Despite their potential, limited research has been conducted on the source–sink relationships in Watkins wheat landraces, particularly under varying nitrogen conditions [12].
Nitrogen availability directly influences the photosynthetic rate, biomass production, grain yield, and nutritional quality of wheat [13]. According to [14], nitrogen fertilizers have been instrumental in boosting crop productivity, supporting over 48% of the global population. However, excessive use of nitrogen fertilizers has led to diminishing returns in terms of yield gains, while also contributing to environmental issues such as groundwater contamination, eutrophication, and greenhouse gas emissions [15,16,17]. Therefore, optimizing nitrogen application is essential for sustainable wheat production [18]. Site-specific nitrogen management strategies can enhance both yield and grain quality while minimizing environmental impacts [19,20]. The growth and development of plants depend on the coordinated functioning of source and sink organs [21]. Source organs are responsible for the net uptake of resources through photosynthesis, while sink organs utilize these resources for growth and storage [22]. The relationship between sources and sinks is dynamically regulated by molecular mechanisms that ensure optimal resource allocation under varying environmental conditions [23,24]. Source–sink dynamics are influenced by a variety of factors, including plant type, climatic conditions, pest and disease pressure, and nutrient availability [25,26,27]. In wheat, the source–sink balance is particularly important during the grain-filling stage, when the demand for assimilates is highest [28]. Nitrogen plays a pivotal role in regulating this balance, as it directly affects photosynthetic efficiency, leaf area development, and biomass partitioning [29,30]. Under nitrogen-deficient conditions, the source capacity of shoots is reduced, leading to decreased carbohydrate production and limited resource availability for sink organs [31,32]. Conversely, excessive nitrogen can disrupt the source–sink balance by promoting excessive vegetative growth at the expense of grain development [23,33,34].
Various stress indices have been proposed by different scientists to assess tolerance and productivity under stress conditions [35,36,37]. These include the tolerance index (TOL), mean productivity (MP), geometric mean productivity (GMP), stress tolerance index (STI), stress susceptibility index (SSI), relative stress index (RSI), harmonic mean (HM), yield stability index (YSI), stress susceptibility productivity index (SSPI), and yield index (YI). According to Rosielle and Hamblin (1981) [38], TOL is defined as the difference between yield under stress and non-stress conditions, while MP represents the average of Yp (yield under normal conditions) and Ys (yield under stress conditions). Raman et al. (2012) [39] highlighted GMP as a robust index for comparing yield performance under both normal and stressed environments. Fernandez (1993) [40] described STI as the ratio of the product of yield performance under stress and normal conditions to the squared mean yield under normal conditions, with GMP being the square root of the product of genotype performance under stress and normal conditions. Fischer and Maurer (1978) [41] introduced the SSI index, where genotypes with lower SSI values are considered more tolerant to heat stress. Fernandez (1993) [40] also emphasized the use of STI to identify cultivars with high yield potential and stress tolerance. Additionally, Gavuzzi et al. (1997) [42] employed these indices to evaluate the stability of genotypes under both normal and stress conditions. This study highlights the critical interplay between nitrogen availability and source–sink dynamics in optimizing wheat productivity and resource use efficiency. By dissecting source–sink competition in Watkins wheat landraces under low and normal nitrogen regimes, the research provides valuable insights into the mechanisms governing biomass allocation and yield formation. Low nitrogen conditions are expected to reduce shoot source capacity, leading to decreased carbohydrate production and altered root–shoot biomass partitioning, while normal nitrogen conditions are anticipated to enhance photosynthetic activity and promote a balanced source–sink relationship.
Through this comparative analysis, the study aims to identify genotypes with optimal source–sink dynamics, addressing the variability and diversity of Watkins wheat landraces under varying nitrogen conditions. The findings will not only elucidate the mechanisms underlying source–sink competition but also contribute to the development of improved wheat varieties with enhanced productivity and resilience to nitrogen stress. Furthermore, this study establishes a foundational baseline for future research on source–sink manipulations and nutrient management strategies, paving the way for sustainable wheat production under nitrogen-limiting conditions.

2. Materials and Methods

2.1. Plant Material Screening and Selection

This study employed a two-phase approach to examine nitrogen-use efficiency (NUE) in wheat. In the initial phase, a genetically diverse set of Watkins wheat landraces was obtained from the Agricultural Genomic Institute at Shenzhen, Chinese Academy of Agricultural Sciences, for screening under hydroponic conditions (a complete list of landraces is provided in Table S1). The landraces were assessed for key NUE-related traits, including above- and below-ground biomass accumulation, as well as nitrogen uptake efficiency under low-nitrogen stress (0.2 mM N). Based on the screening results, 48 landraces exhibiting the greatest phenotypic variation—representing both high and low NUE extremes—were selected for in-depth analysis. These 48 genotypes were then further studied to explore their adaptive responses to nitrogen limitation.

2.2. Controlled Growth Conditions and Hydroponic Protocols

The selected landraces were cultivated in climate-controlled hydroponic systems under strictly controlled conditions: day/night temperatures of 25/22 °C, a light intensity of 300 µmol m−2 s−1 with a 10/14 h photoperiod, relative humidity maintained between 65 and 70%, and a nutrient solution pH kept between 6.0 and 6.5. The seeds underwent surface sterilization with 2% H2O2 for 30 min, followed by rinsing with distilled water, and were then germinated using the paper roll method. Five-day-old seedlings were transferred into 96-well hydroponic boxes containing modified Hoagland solutions (as detailed in Table S2). The nutrient solution was refreshed every 4 days to ensure consistent ion availability. To eliminate positional bias, the location of the boxes was randomized weekly.

2.3. Experimental Design and Nitrogen Treatments

The experimental design encompassed four independent trials conducted across different seasonal cycles during 2023–2024 to capture environmental variability. Each trial followed a completely randomized design with two nitrogen treatments, low nitrogen (LN; 0.2 mM N, 2.4 mM Ca2+) and normal nitrogen (NN; 1 mM N, 1.5 mM Ca2+), with calcium concentrations adjusted using CaCl2·4H2O to ensure ionic balance. For each landrace, three biological replicates per treatment were randomly assigned to each trial. This resulted in 12 plants per landrace per treatment (3 replicates × 4 trials), with a total of 1152 plants in the experimental cohort (48 landraces × 12 plants × 2 treatments).

2.4. Sampling and Measurements

After 28 days of transplantation, the plants were harvested. At harvest, the fresh plants were separated into shoot and root portions. For phenotyping, two main steps were followed. First, the samples were blotted dry with paper towels to remove surface moisture and then weighed using an electronic balance to record the fresh weight. Second, the samples were oven-dried at 70 °C for 96 h, after which they were re-weighed to determine the dry weight.

2.5. Statistical Validation and Data Integration

Before conducting the final analysis, a one-way ANOVA (p < 0.05) was performed to confirm that there were no significant inter-trial differences in the measured traits, thus validating the homogeneity of variance across the seasonal replicates. Data from all trials were then pooled to increase statistical power, resulting in a final dataset of 576 plants per treatment. This combined approach ensured that the observed phenotypic responses were attributable to genotypic differences and nitrogen treatments, rather than transient environmental effects.

2.6. Evaluating Stress Indices and Physiological Assay

To identify landraces exhibiting high source–sink yield under both normal and low nitrogen stress conditions, 3D scatterplots were created using stress indices such as TOL, MP, GMP, STI, SSI, RSI, HM, YSI, and YI. These plots were generated using the iPASTIC software package developed by [43]. The goal was to rank and pinpoint landraces with consistently superior yields under both conditions, treating this as a representative trait [44]. In this method, the average sum of ranks (ASRs) across all variables/indices served as a criterion for selecting the top-performing landraces. Under this approach, the landrace with the best performance for a specific variable is assigned the lowest rank. Consequently, landraces with the lowest ASR values and the smallest standard deviations were deemed the highest performers. The derived indices were subsequently subjected to multivariate analyses for further validation using default settings and standardization options in SAS-JMP Pro 16 (SAS Institute Inc., Cary, NC, USA, 1989–2021) (Table 1).

3. Results

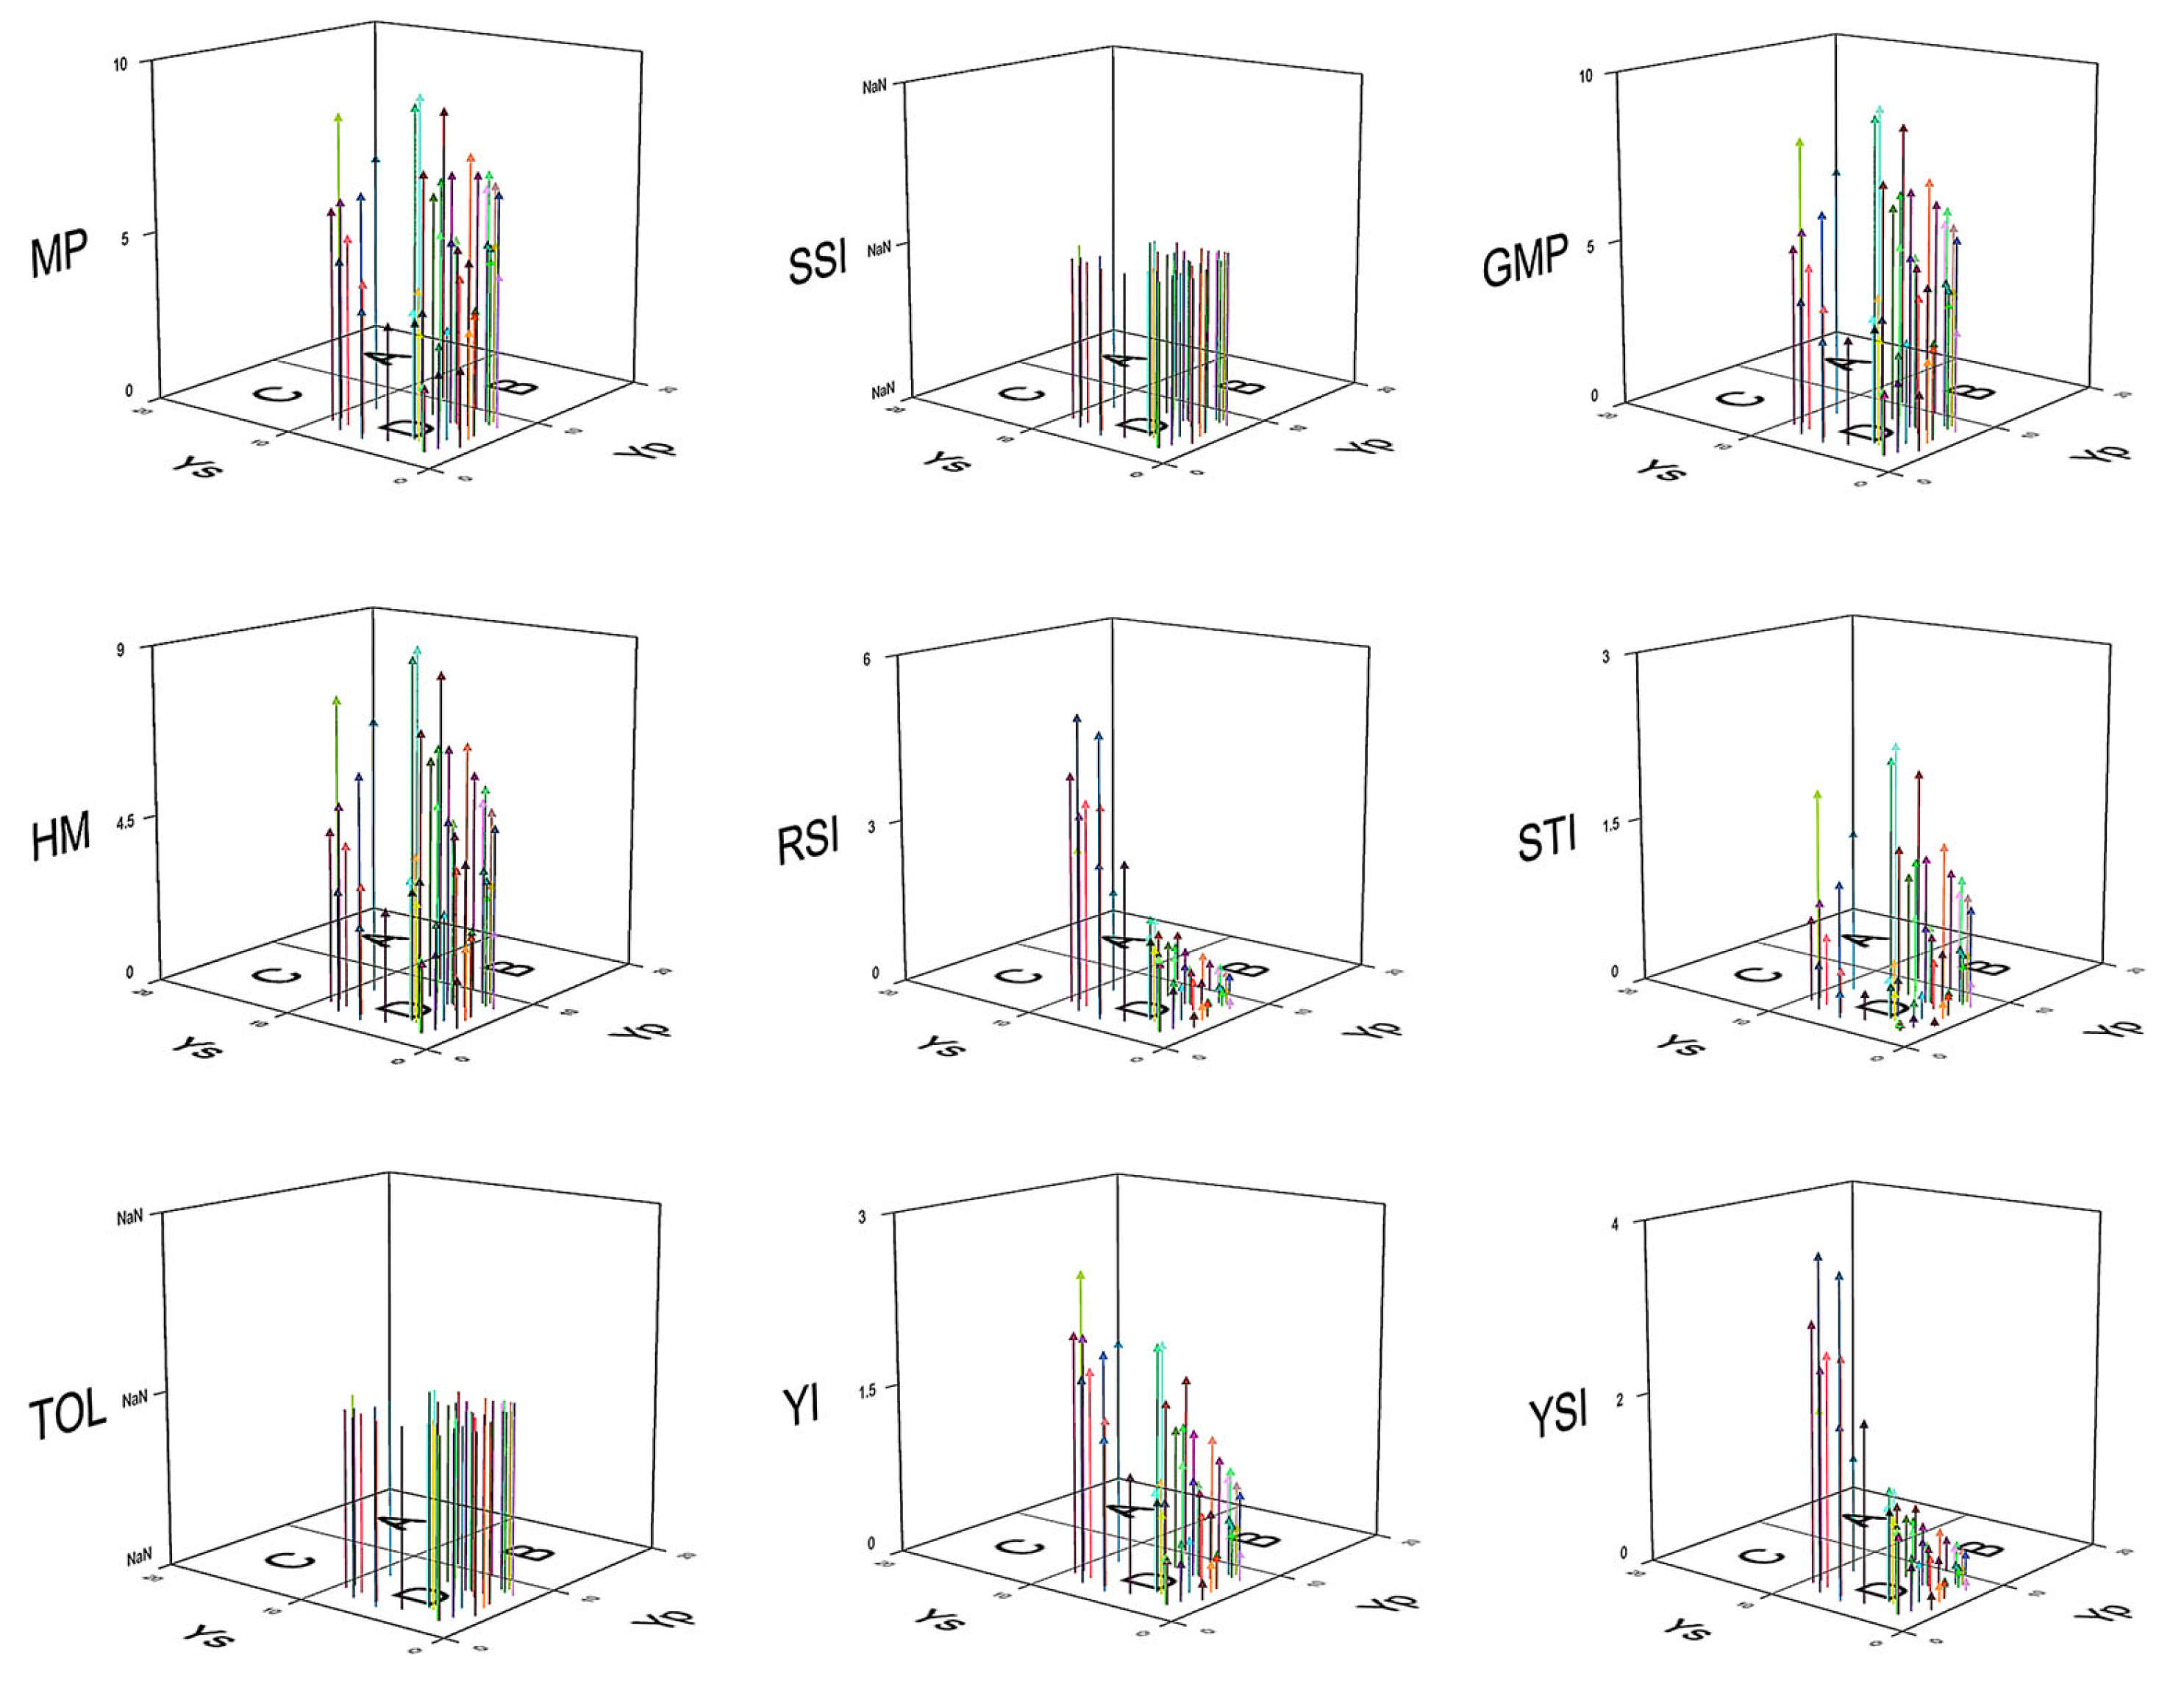
3.1. Three-Dimensional Scatter Plot Illustration

A comprehensive analysis of 48 Watkins wheat landraces (WATDE) reveals striking contrasts in their performance across multiple stress tolerance and productivity indices, underscoring distinct adaptive strengths and vulnerabilities. Landraces such as WATDE0020 and WATDE0013 emerge as consistent high performers, while others, including WATDE1055 and WATDE0044, lag across metrics, highlighting critical differences in their resilience and yield stability (Figure 1).

3.1.1. Yield Potential (Yp) and Stress Response (Ys)

Under optimal conditions, WATDE0020 (10.31), WATDE0259 (10.3), and WATDE0092 (10.11) dominate with the highest yields, demonstrating robust growth in non-stress environments. Conversely, WATDE0044 (1.615) and WATDE1055 (3.815) exhibit markedly poor productivity, suggesting limited adaptability to favorable growing conditions. Transitioning to Ys, WATDE0013 (11.21) stands out as exceptional, surpassing peers like WATDE0027 (9.34) and WATDE0099 (9.195), which also show notable resilience. However, WATDE1055 (0.825) and WATDE0290 (1.23) falter dramatically under stress, reflecting acute susceptibility to adverse conditions (Table S3).

3.1.2. Stress Adaptation and Stability Indices

The reduction coefficient (RC), which quantifies yield retention under stress, further distinguishes these landraces. WATDE0013 (−88.88) exhibits minimal yield loss, followed by WATDE0027 (−202.76), signaling their capacity to buffer against stress. In stark contrast, WATDE0090 (0.47) and WATDE0763 (9.38) suffer severe reductions, indicating poor stress buffering. Similarly, the stress susceptibility index (SSI) highlights WATDE0013 (−3.26) and WATDE0027 (−7.45) as least affected by stress, while WATDE0763 (0.34) and WATDE0127 (0.24) rank among the most vulnerable.

3.1.3. Productivity and Tolerance Metrics

MP and GMP underscore the reliability of top performers like WATDE0020 (MP: 8.66; GMP: 8.50) and WATDE0013 (MP: 8.57; GMP: 8.16), which maintain high yields across diverse conditions. Conversely, WATDE1055 (MP: 2.32; GMP: 1.77) and WATDE0044 (MP: 3.79; GMP: 3.10) show instability, struggling to sustain productivity. The harmonic mean (HM) reinforces this pattern, with WATDE0020 (8.34) and WATDE0087 (8.99) excelling in balanced performance, while WATDE1055 (1.36) and WATDE0119 (1.97) lag significantly.

3.1.4. Tolerance and Yield Stability

The TOL identifies WATDE0092 (7.17) and WATDE0630 (6.96) as highly stress-tolerant, whereas WATDE0044 (−4.35) and WATDE0054 (−5.87) display poor adaptability. The stress tolerance index (STI) results align closely, with WATDE0013 (1.79) and WATDE0020 (1.94) leading, while WATDE1055 (0.08) and WATDE0651 (0.13) show minimal tolerance. The yield stability index (YSI) further validates WATDE0013 (1.89) and WATDE0450 (1.40) as stable under stress, contrasting sharply with WATDE1055 (0.22) and WATDE0044 (3.69), which exhibit erratic performance.

3.1.5. Implications for Breeding and Selection

RSI culminates in these findings, with WATDE0013 (2.60) and WATDE0450 (1.92) demonstrating superior stress adaptation, while WATDE1055 (0.30) and WATDE0044 (5.08) remain ill-suited for challenging environments. These results not only pinpoint elite landraces for breeding programs but also expose critical weaknesses in others, guiding targeted improvements. The consistent dominance of WATDE0020 and WATDE0013 across indices underscores their genetic potential as candidates for developing stress-resilient wheat varieties, whereas the poor performance of WATDE1055 and WATDE0044 signals a need for genetic revitalization or exclusion from stress-prone regions.

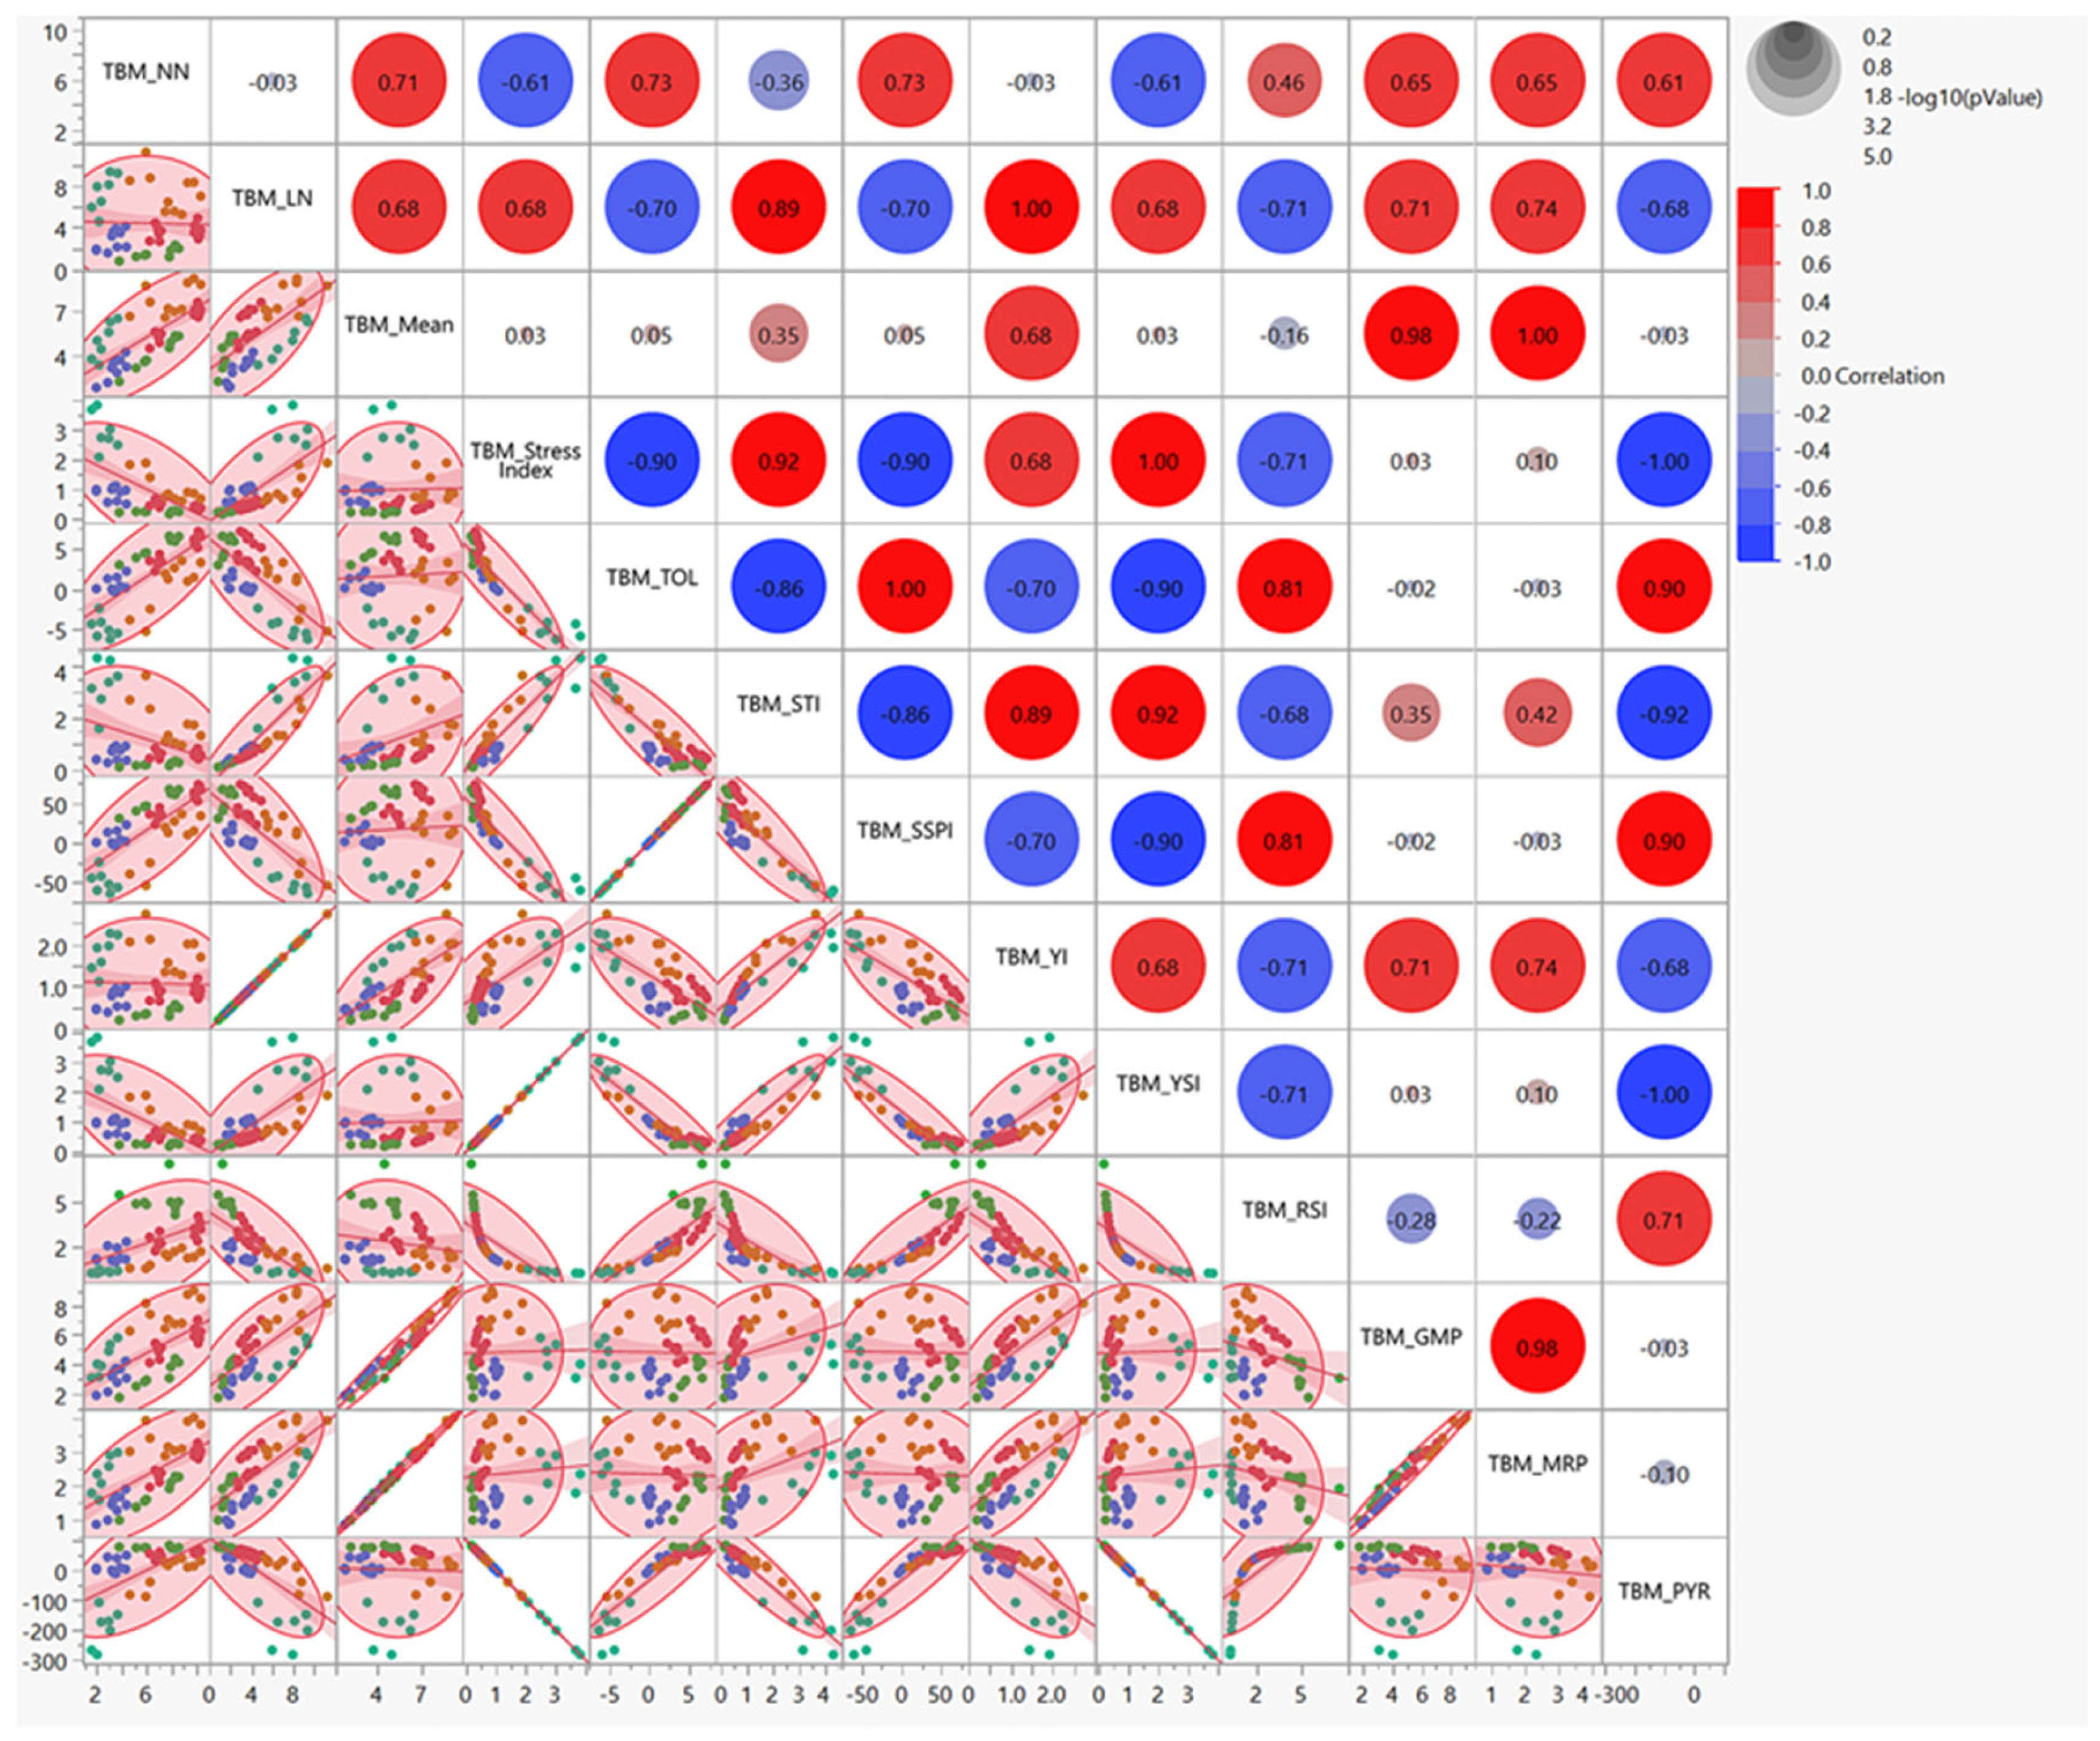
3.2. Multivariate Correlation Analysis of Nitrogen Stress Tolerance

The multivariate correlation analysis presented in Table 2 provides insights into the relationships between various stress tolerance and yield-related parameters. The correlation coefficients range from −1 to 1, where values close to 1 indicate a strong positive relationship, values close to −1 indicate a strong negative relationship, and values around 0 suggest little to no correlation. The analysis reveals several key relationships between various stress tolerance and yield-related parameters, providing insights into the performance of landraces under different conditions. The mean shows a strong positive correlation with GMP (0.979) and MRP (0.9967), indicating that landraces with high mean performance also tend to exhibit high GMP and mean relative performance. However, the mean has a weak correlation with the stress index (0.025) and PYR (−0.025), suggesting that mean performance is not strongly influenced by stress conditions or yield reduction under stress. The stress index exhibits a strong positive correlation with the STI (0.9184) and YSI (1), indicating that landraces with a high stress index are also likely to have high stress tolerance and yield stability indices. Conversely, it shows a strong negative correlation with the TOL (−0.8964) and PYR (−1), suggesting that landraces with a high stress index are less tolerant to stress and experience greater yield reduction under stress conditions. The TOL has a strong positive correlation with the SSPI (1) and RSI (0.8092), indicating that landraces with high tolerance indices also tend to have high stress susceptibility and relative stress indices. It shows a strong negative correlation with the stress index (−0.8964) and STI (−0.8614), suggesting that tolerance is inversely related to stress susceptibility and stress tolerance indices. The STI has a strong positive correlation with the stress index (0.9184) and YSI (0.9184), indicating that landraces with high stress tolerance indices are also likely to have high stress indices and yield stability indices. It shows a strong negative correlation with the TOL (−0.8614) and RSI (−0.6833), suggesting that stress tolerance is inversely related to tolerance and relative stress indices. GMP shows a strong positive correlation with the mean (0.979) and MRP (0.9812), indicating that landraces with high GMP also tend to have high mean performance and mean relative performance. It has a weak correlation with the stress index (0.0271) and PYR (−0.0271), suggesting that geometric mean productivity is not strongly influenced by stress conditions or yield reduction under stress. Finally, the PYR shows a strong negative correlation with the stress index (−1) and YSI (−1), indicating that landraces with high yield reduction under stress are likely to have low stress indices and yield stability indices. It has a strong positive correlation with the TOL (0.8964) and SSPI (0.8964), suggesting that yield reduction under stress is associated with high tolerance and stress susceptibility indices (Figure 2).

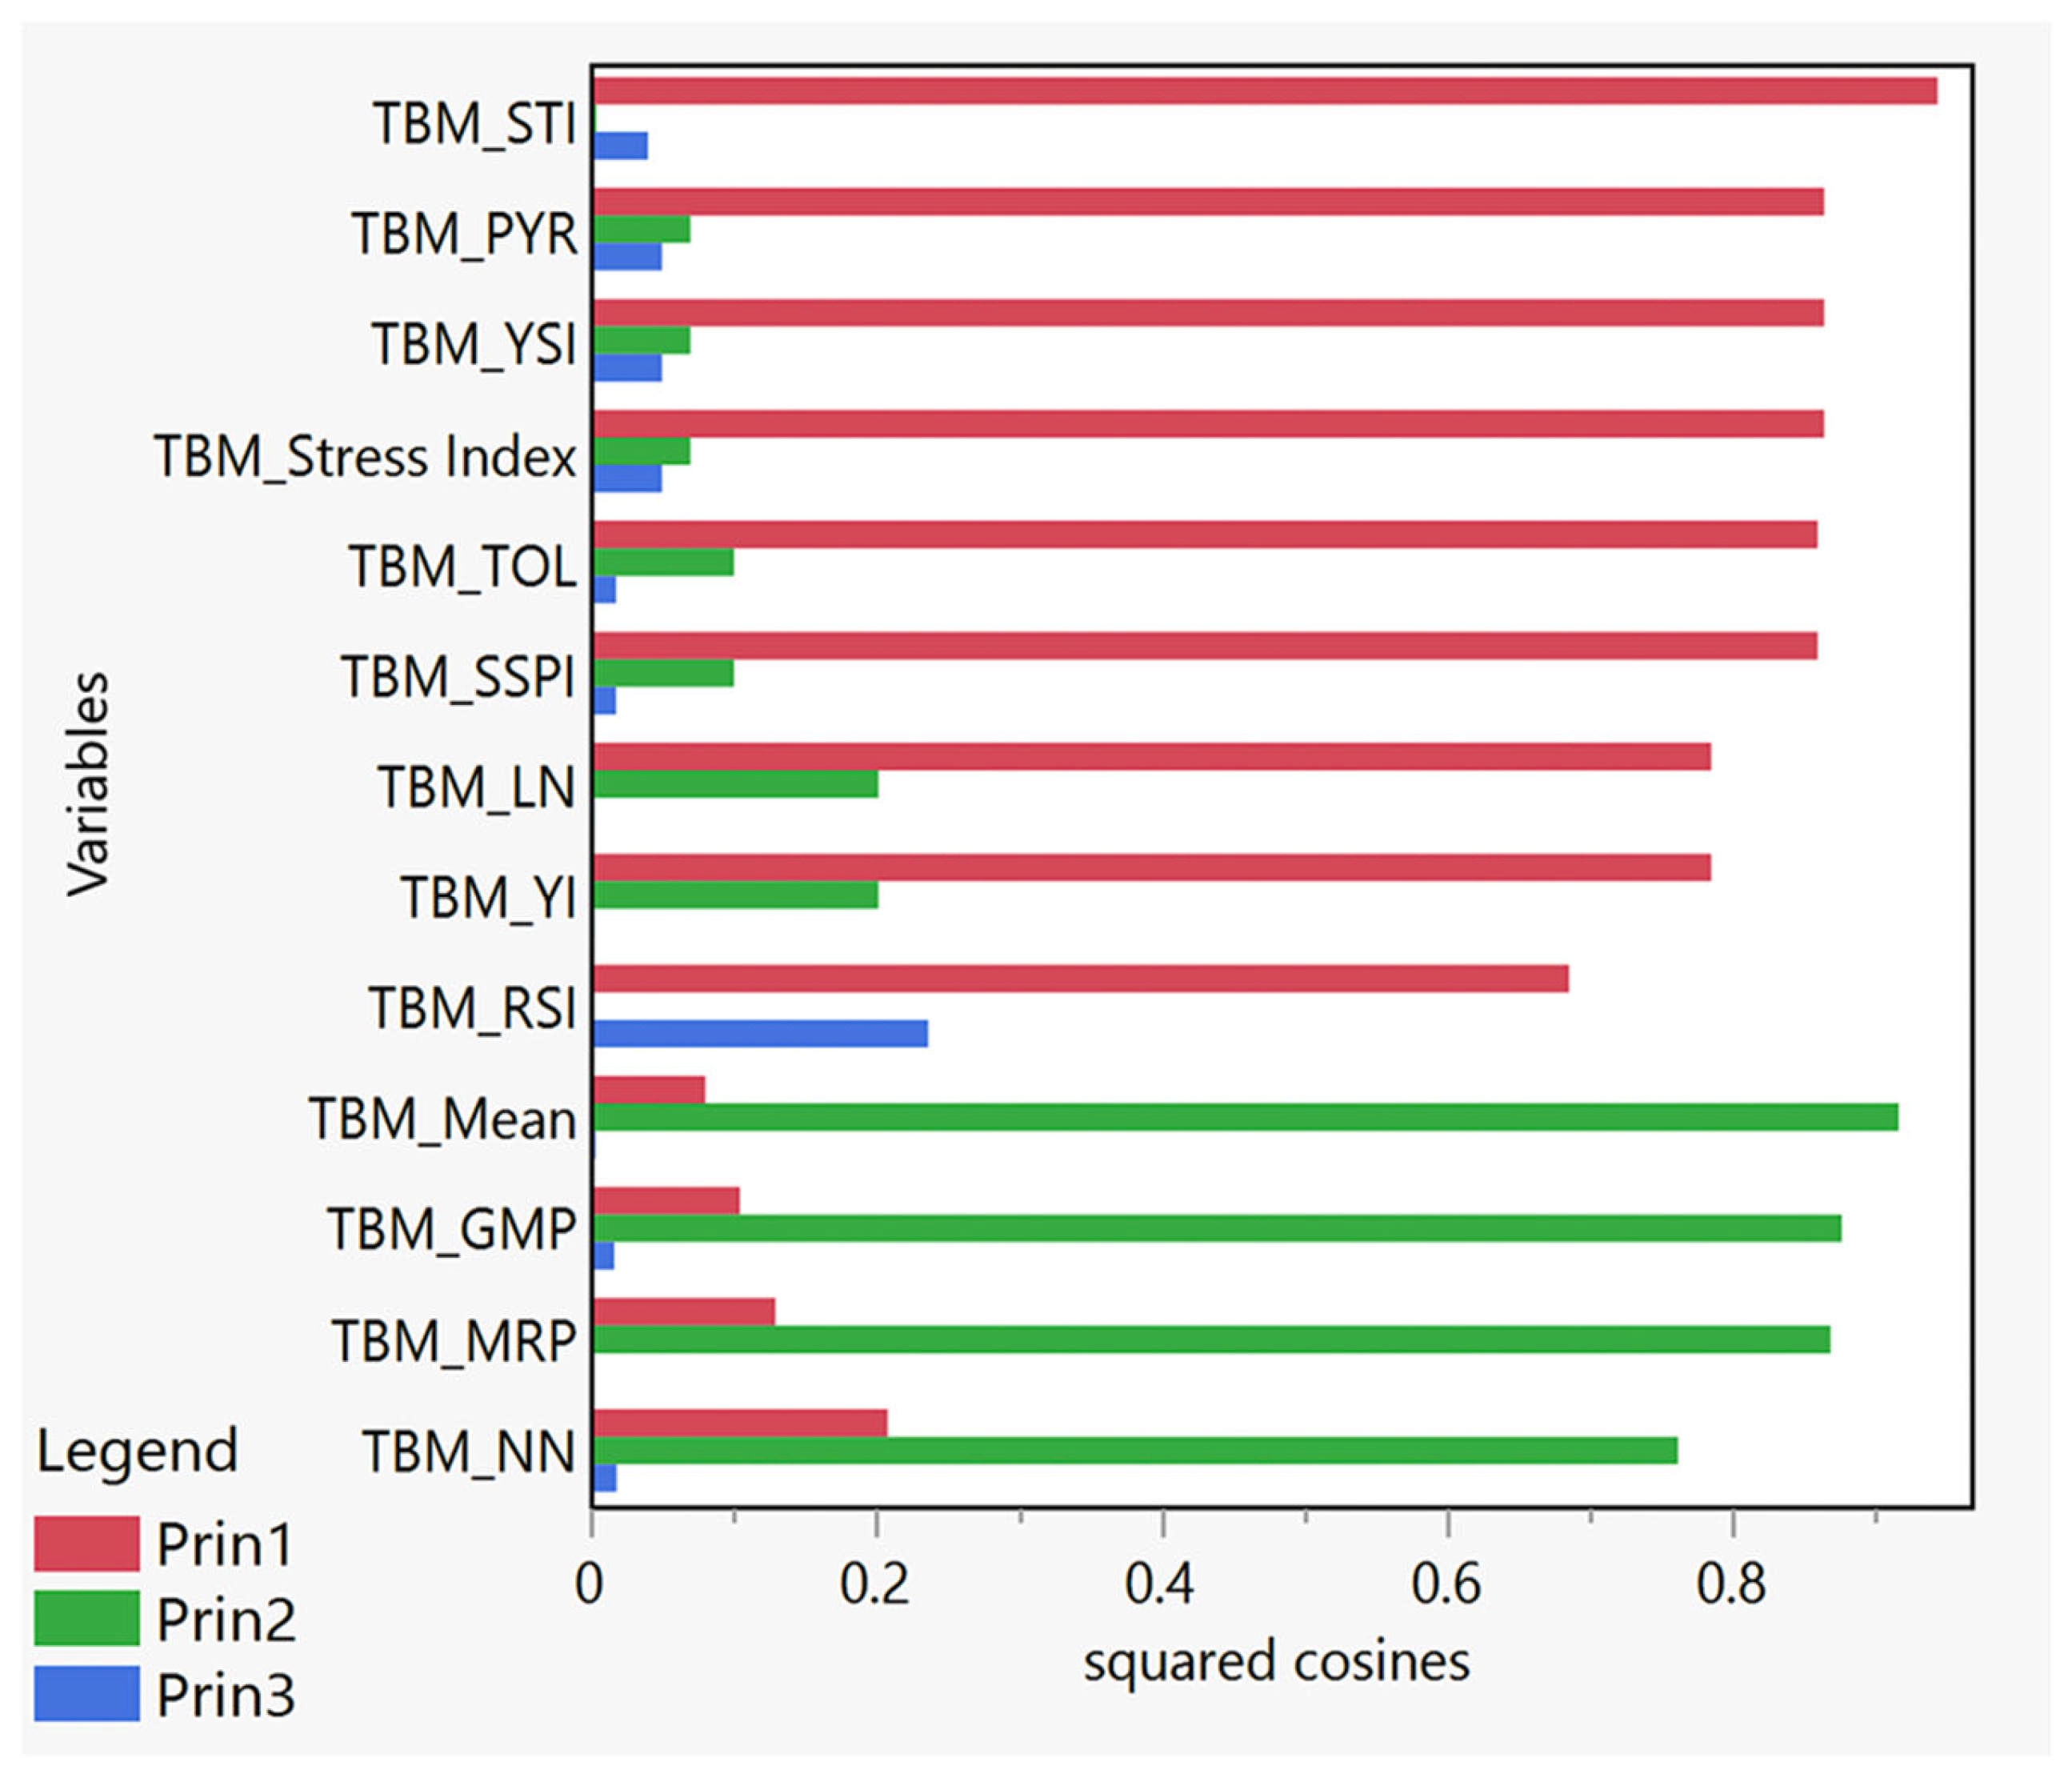
3.3. Squared Cosines Analysis

The squared cosines (cos2) of the variables, as presented in Figure 3, provide insights into the contribution of each variable to the principal components (Prin1, Prin2, and Prin3) in a PCA, where squared cosines indicate how well each variable is represented by the principal components, with values closer to 1 suggesting a strong representation. For Prin1, the STI has the highest squared cosine value (0.94248), indicating that it is the most strongly represented variable in this component, suggesting that Prin1 primarily captures variation related to stress tolerance. Other variables with high squared cosines in Prin1 include the stress index (0.86326), TOL (0.85869), SSPI (0.85869), and YSI (0.86326), which are also strongly associated with Prin1, further emphasizing that this component is closely related to stress-related indices, while LN and YI show moderate representation in Prin1, with squared cosines of 0.78418. For Prin2, the mean (mean performance) has the highest squared cosine value (0.91536), indicating that this component primarily captures variation related to overall mean performance, while the GMP and MRP also show strong representation in Prin2, with squared cosines of 0.87541 and 0.86767, respectively, suggesting that Prin2 is associated with productivity and performance metrics, and NN also has a relatively high squared cosine (0.76106) in Prin2, indicating its contribution to this component. For Prin3, the RSI has the highest squared cosine value (0.23648), although this value is relatively low compared to the other components, suggesting that Prin3 captures some variation related to relative stress, but its overall contribution is less significant, while other variables, such as the stress index (0.05046), YSI (0.05046), and PYR (0.05046), have minimal representation in Prin3, indicating that this component does not strongly capture stress-related variation.

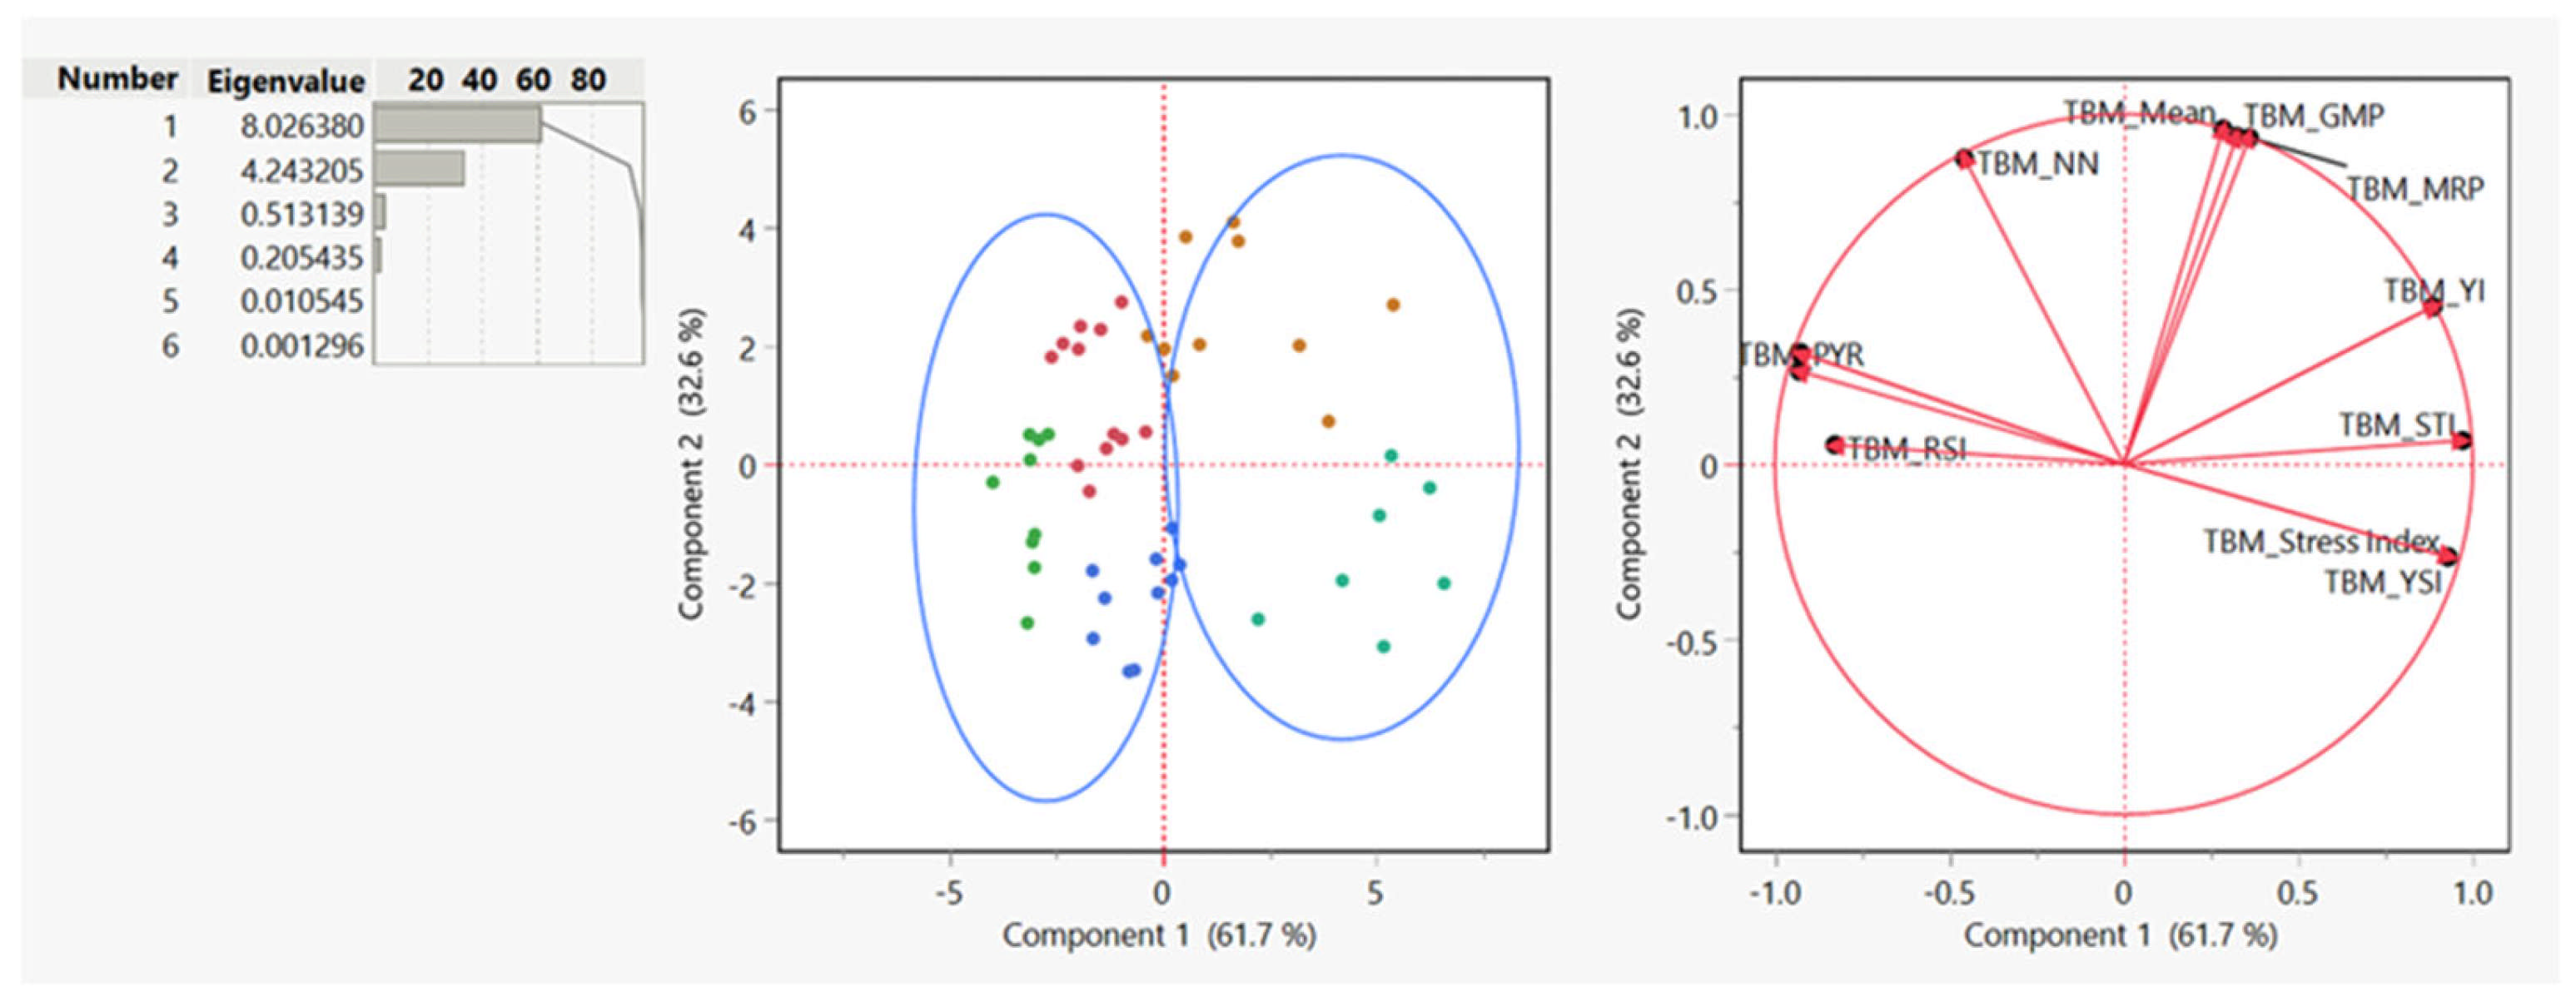
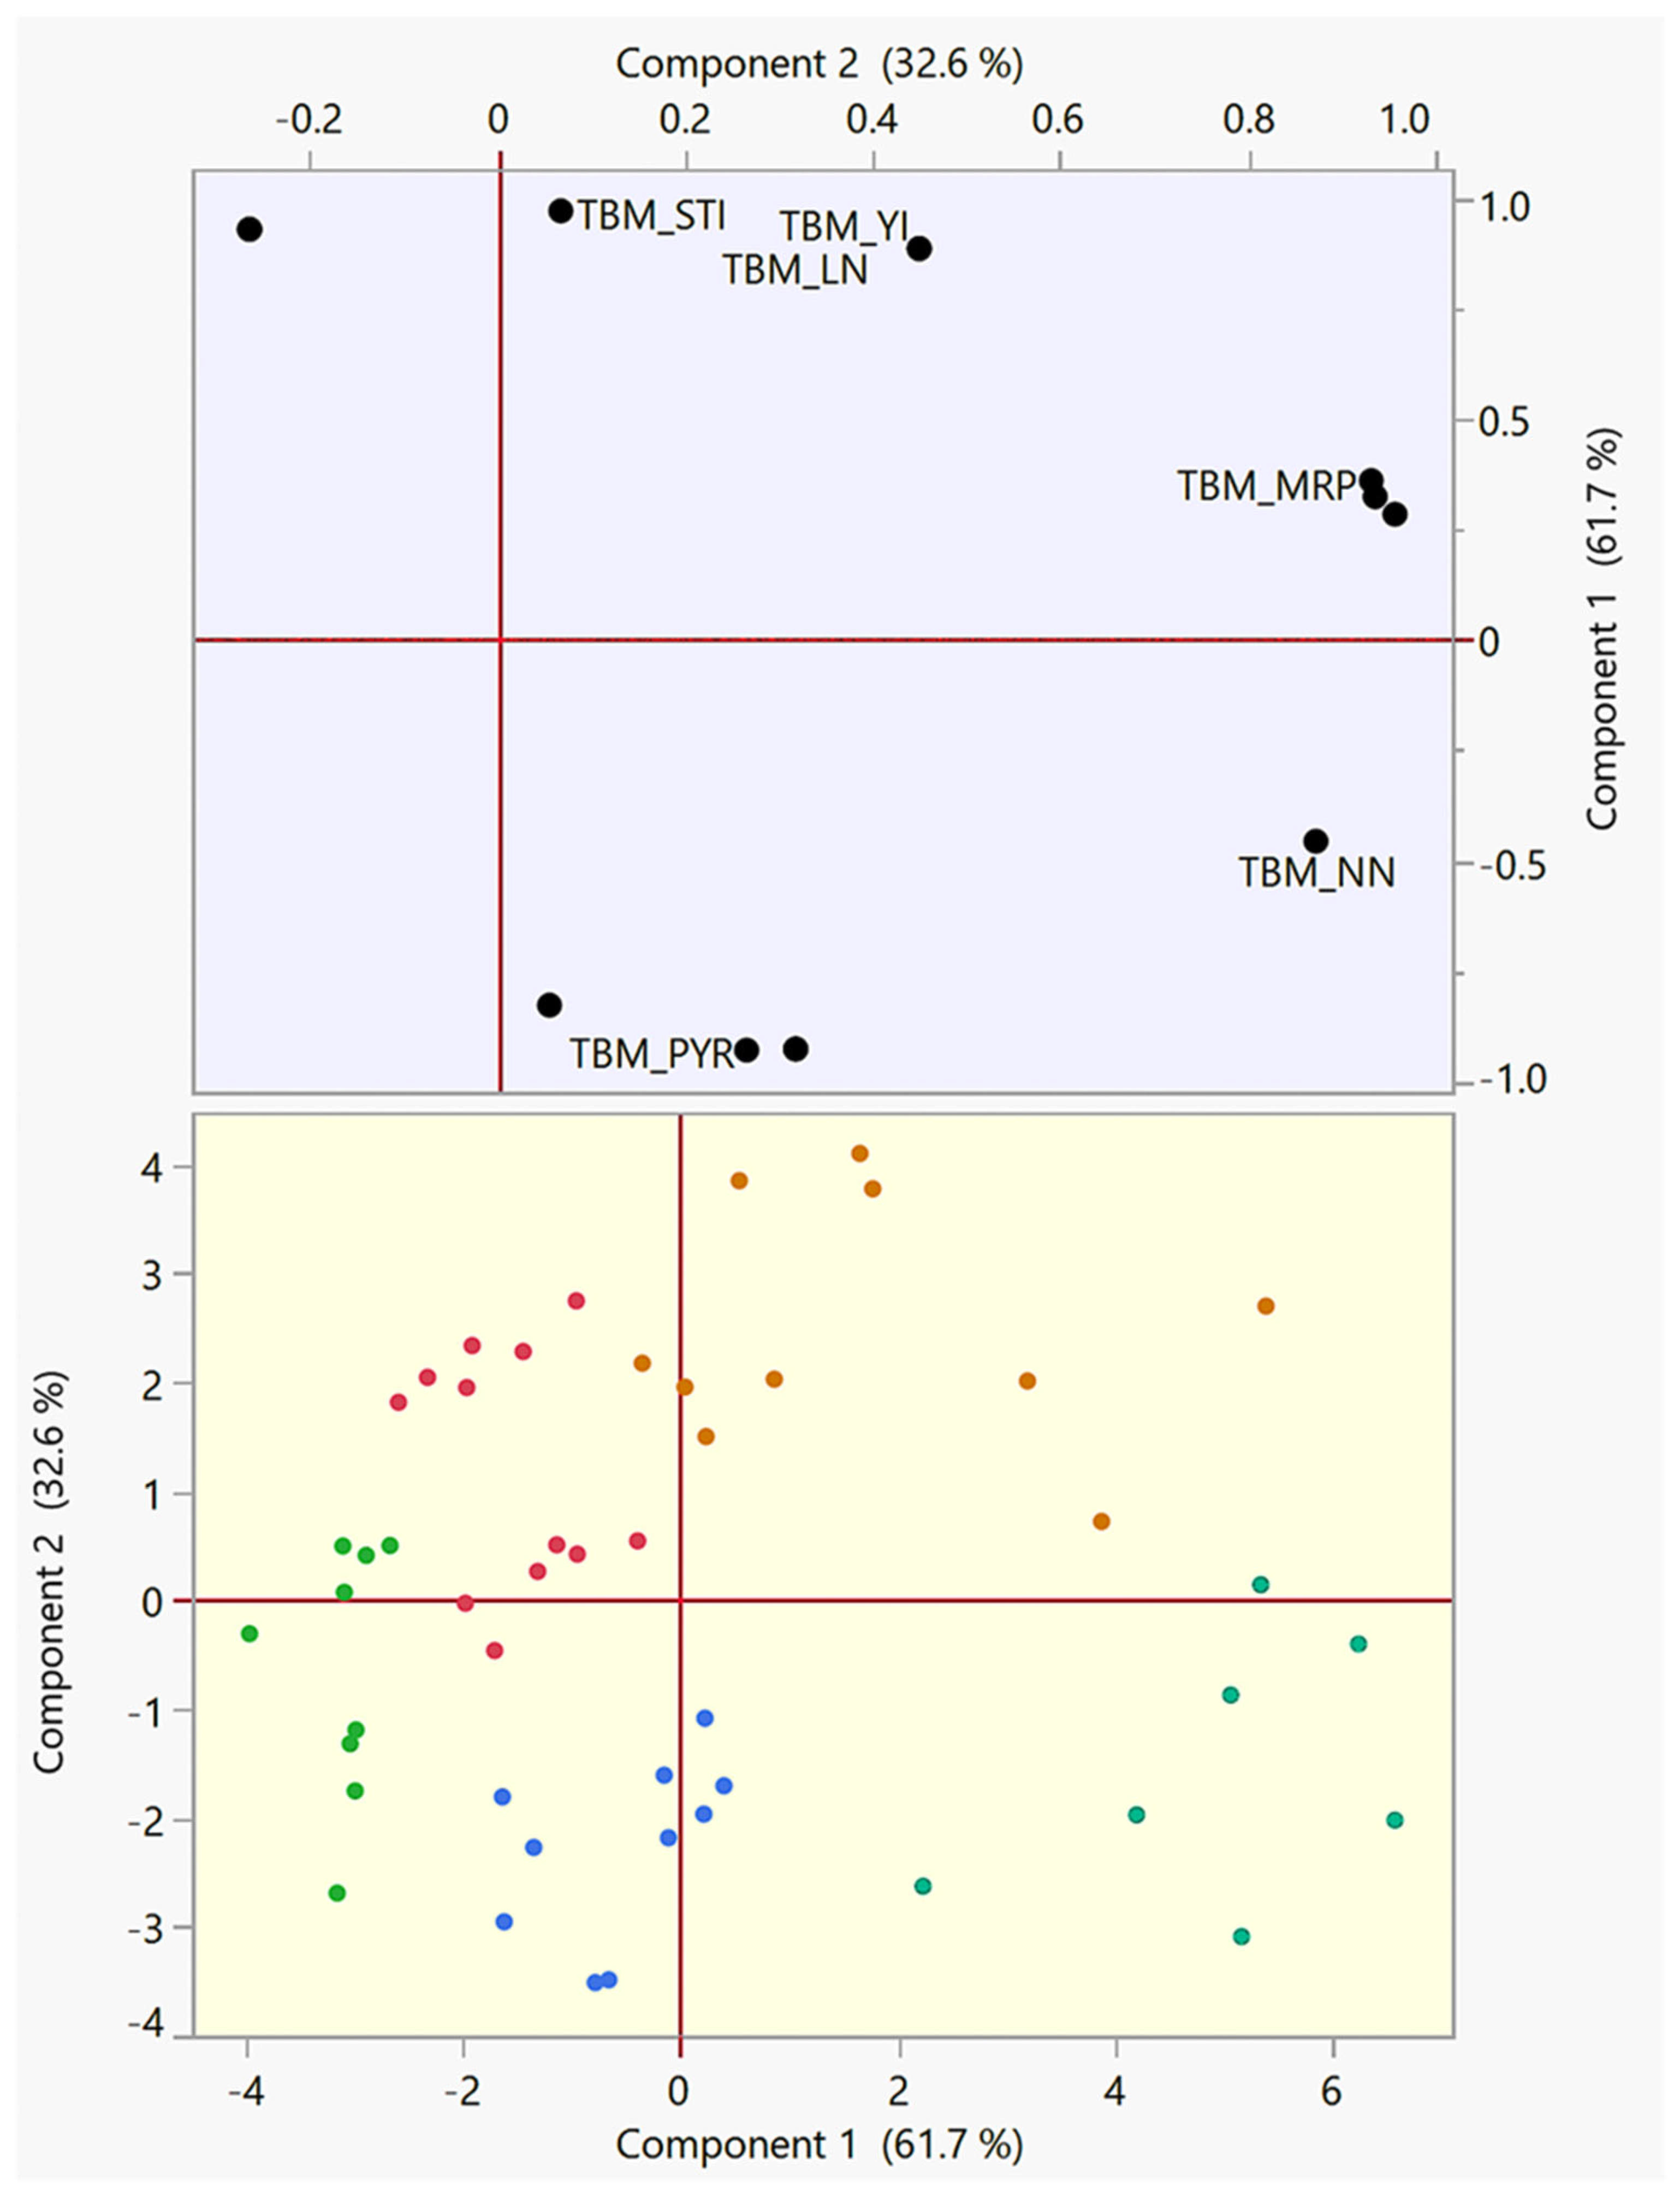
3.4. Principal Component Analysis (PCA)

Principal component analysis revealed that Prin1 (eigenvalue = 8.02638) explained 61.741% of the total variance (χ2 = 425.017, p < 0.0001), representing the dominant axis of variation in our dataset (Table 3). While this component showed strong visual associations with the mean and the GMP in the biplots (Figure 4 and Figure 5), its biological significance was most clearly linked to nitrogen stress tolerance, as evidenced by high factor loadings for the STI (0.92) and stress index (0.89). This apparent duality arises because the mean and the GMP inherently integrate stress-responsive traits, making them effective proxies for overall performance under nitrogen limitation. Prin2 accounted for an additional 32.64% variance but was not statistically significant (χ2 = 60.56, p = 0.9279), suggesting that it captured secondary patterns in productivity metrics. The remaining components (Prin3–Prin6) each contributed <5% cumulative variance (all p = 1), indicating negligible biological relevance. These results collectively confirm that nitrogen stress tolerance is the primary driver of phenotypic variation in our wheat landrace panel, with productivity traits serving as complementary indicators of this adaptive response.

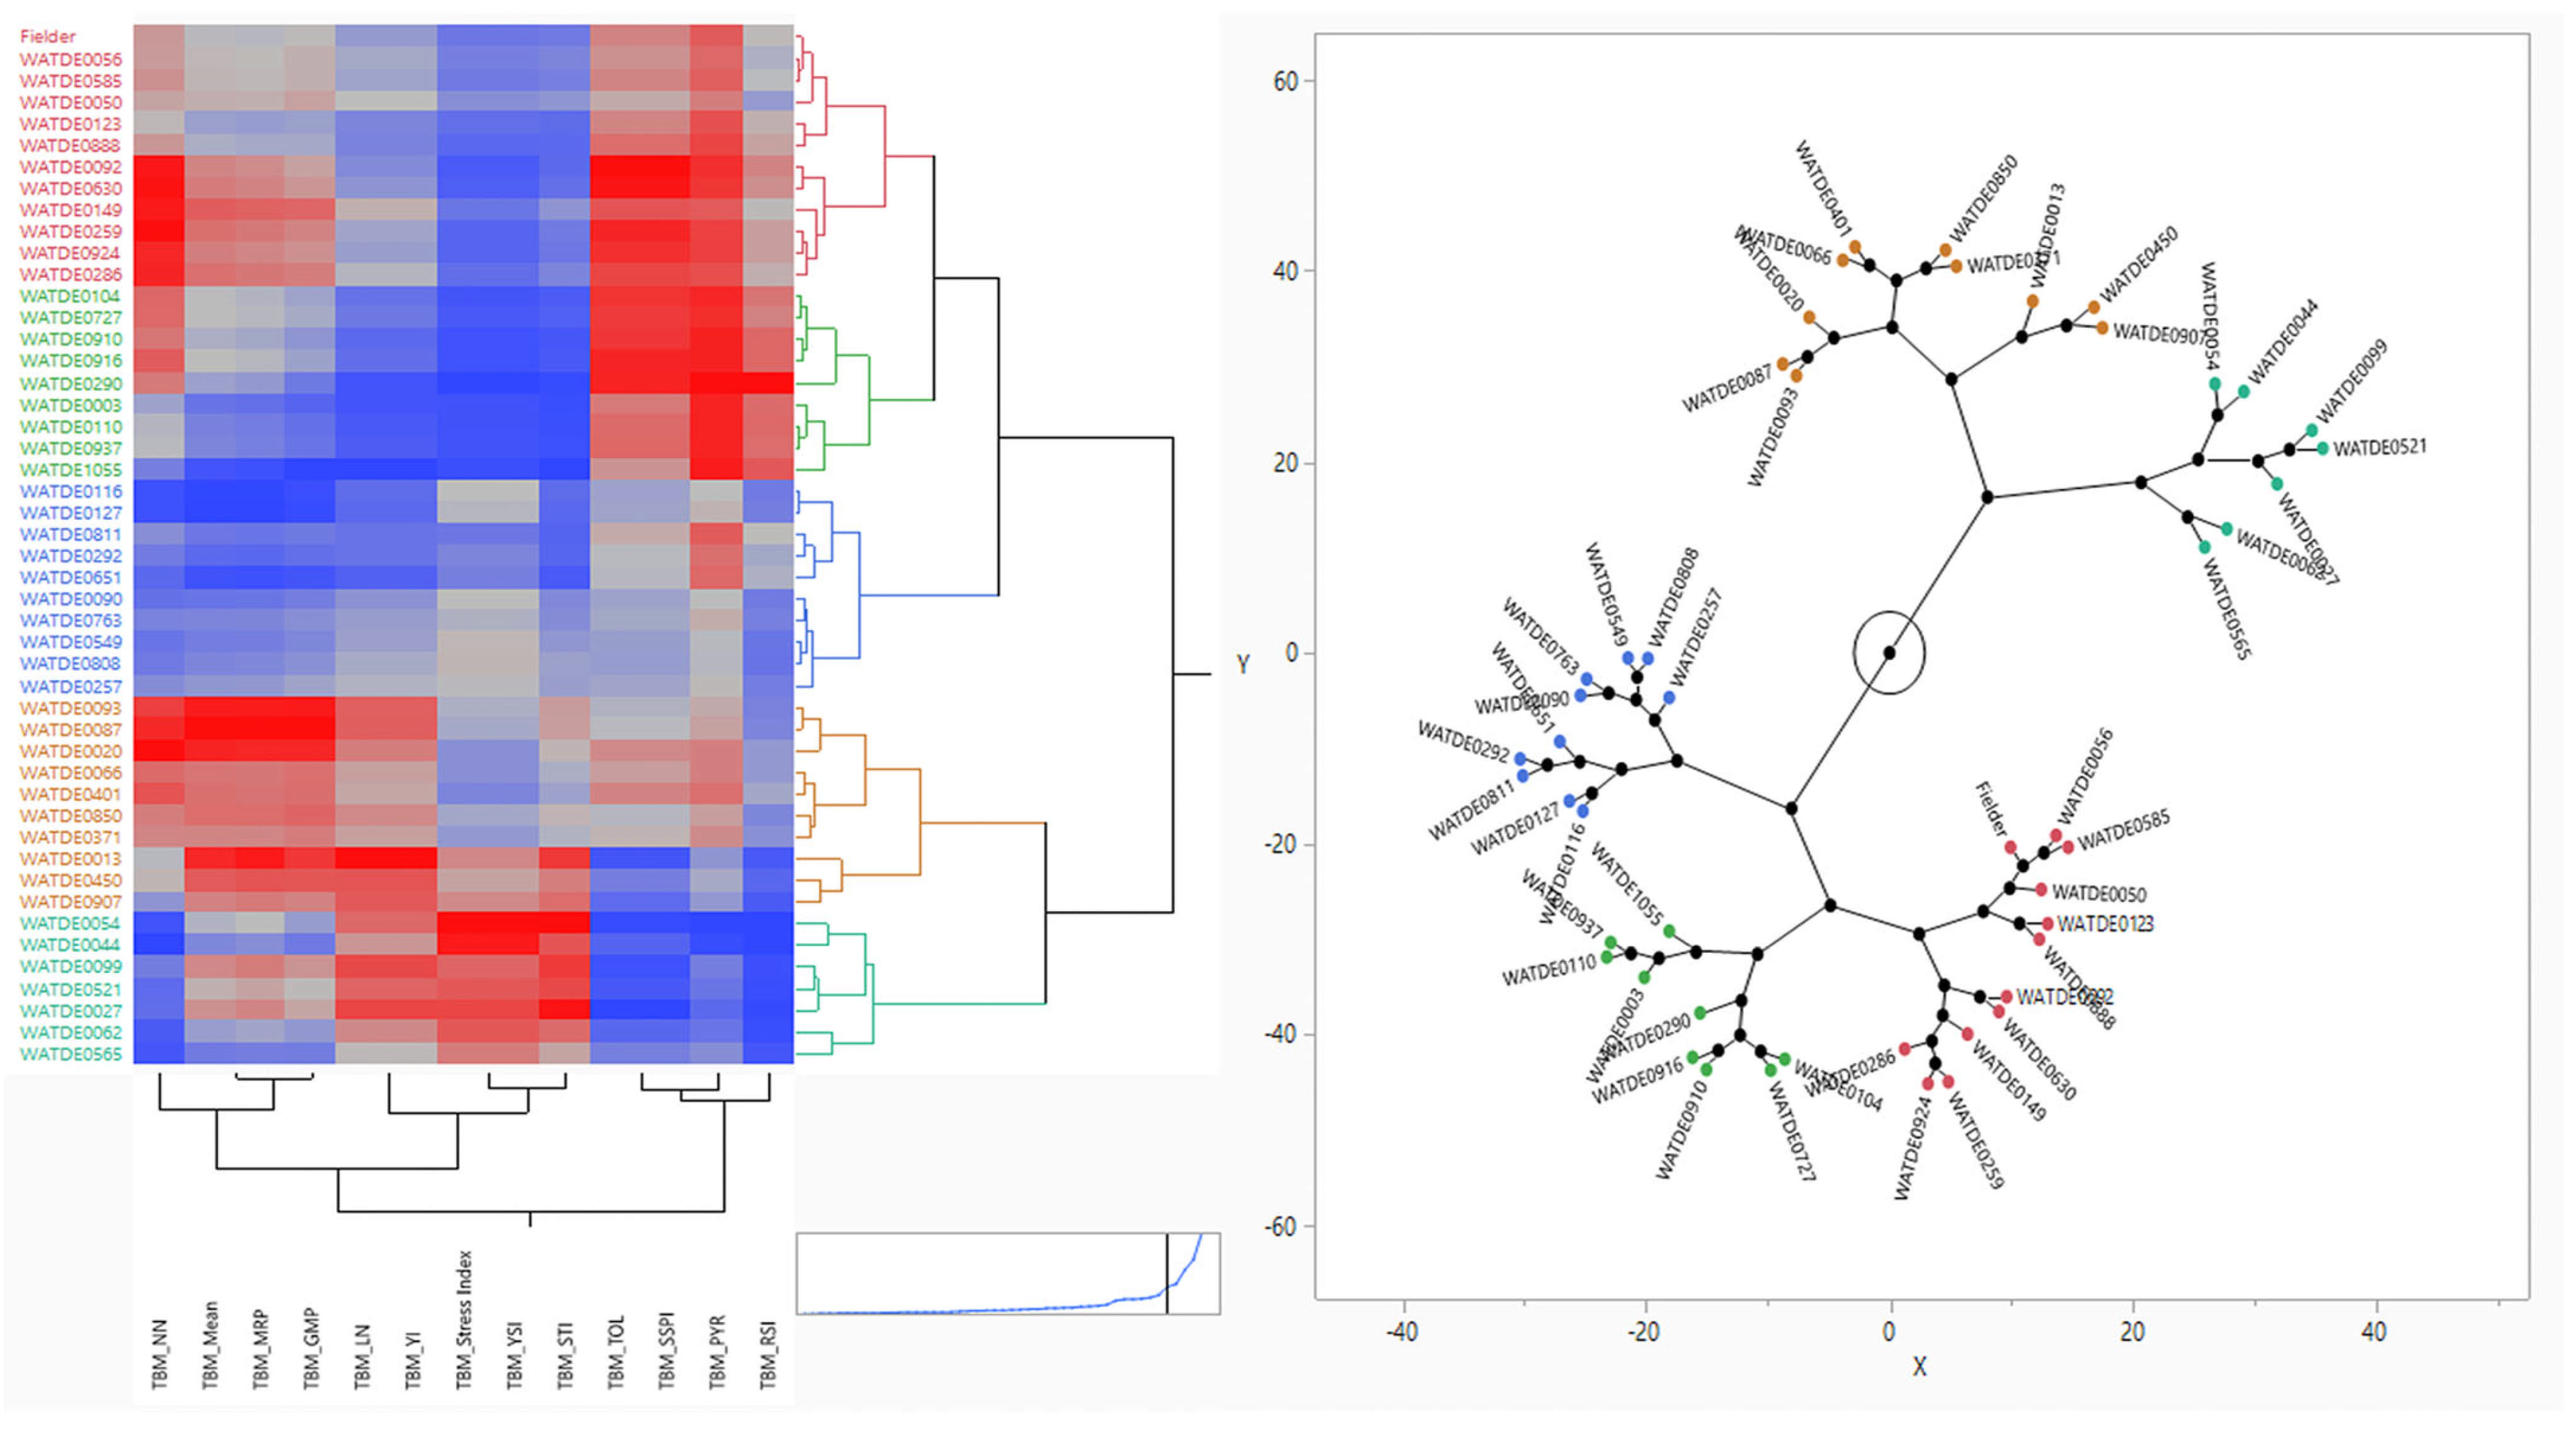
3.5. Hierarchical Clustering and Ranking Based on Stress Indices

The landraces were evaluated based on their average rank (AR) values, which provide a comprehensive measure of their overall performance across multiple parameters, including yield under non-stress (Yp) and stress conditions (Ys), as well as stress tolerance indices such as TOL, MP, GMP, HM, SSI, STI, YI, YSI, and RSI. Based on the AR values, the landraces were grouped into three categories: high-performing, medium-performing, and low-performing. This categorization helps in identifying landraces that are best suited for cultivation under varying stress conditions. The landraces in Table S4 can be divided into five groups based on their AR (rank mean) values, which reflect their stress resistance/tolerance levels. The first group, with AR values ranging from 6.64 to 11.91, includes highly stress-resistant/tolerant landraces such as WATDE0013, WATDE0450, WATDE0087, WATDE0093, WATDE0099, WATDE0907, WATDE0027, and WATDE0020, making them the top performers and ideal candidates for stress-prone environments. The second group, with AR values between 13.18 and 18.91, consists of moderately stress-resistant/tolerant landraces like WATDE0850, WATDE0521, WATDE0066, WATDE0371, WATDE0401, WATDE0054, WATDE0149, and WATDE0062, which show reasonable stress tolerance but may require further evaluation for specific environments. The third group, with AR values from 20.45 to 24.73, includes landraces such as WATDE0050, WATDE0286, WATDE0044, WATDE0257, WATDE0259, WATDE0808, WATDE0056, WATDE0565, WATDE0585, and WATDE0924, which exhibit intermediate stress resistance/tolerance and may need targeted breeding or management strategies to enhance their performance. The fourth group, with AR values ranging from 25.27 to 31.18, comprises landraces like WATDE0549, WATDE0630, WATDE0763, Fielder, WATDE0090, WATDE0092, WATDE0888, WATDE0123, and WATDE0727, which have lower stress resistance/tolerance and may struggle in stress-prone areas without additional support. Finally, the fifth group, with AR values from 33.09 to 44.27, includes landraces such as WATDE0104, WATDE0116, WATDE0811, WATDE0292, WATDE0127, WATDE0916, WATDE0910, WATDE0651, WATDE0937, WATDE0110, WATDE0290, WATDE0003, and WATDE1055, which are the least stress-tolerant and would require significant genetic improvement or management interventions to perform well in challenging environments. This grouping provides a clear framework for selecting landraces based on their stress resistance/tolerance levels, aiding in decision-making for breeding and cultivation strategies (Figure 6 and Figure 7).

4. Discussion

Understanding biomass allocation in wheat seedlings, especially under different nitrogen conditions, relies heavily on optimizing source–sink relationships [47,48,49]. Efficient partitioning of biomass between shoots and roots is essential for early plant development, especially under low nitrogen stress [50,51]. While numerous studies have explored plant growth responses to nitrogen, few have simultaneously evaluated source–sink dynamics at the seedling stage, particularly under contrasting nitrogen regimes [49,52]. A method developed by [53] provides a robust framework for quantifying source–sink biomass competition, focusing on shoot and root biomass during the early growth stages. This method relies on time-course data for dry mass of shoots and roots, with its advantages well documented [54,55]. At the molecular level, wheat adaptation to low-nitrogen stress involves a complex network of signaling pathways and transcriptional regulators. Calcium-mediated signaling and MAPK cascades rapidly transmit external N signals, influencing downstream effectors such as antioxidant enzymes and nutrient transporters [56]. Hormonal pathways, including those of abscisic acid (ABA) and brassinosteroids, interact with N-responsive transcription factors (e.g., bHLH, MYB, NAC) to reprogram metabolism, coordinating carbon and nitrogen assimilation under N limitation [57]. Additionally, microRNAs have been identified as important post-transcriptional regulators of root architecture and N-metabolism genes during nitrogen deprivation [58]. By incorporating stress indices, this approach has been applied to assess biomass competition under low and normal nitrogen conditions in several major crops; Maize [59], rice [60], sunflower [61], cotton [62] enabling the identification of genotypic and environmental factors influencing source–sink dynamics during seedling establishment under nitrogen stress.
Our study employed a diverse panel of 308 Watkins wheat landraces, representing a valuable genetic resource for understanding crop evolution and domestication. These landraces, collected from regions spanning Europe, Asia, and North Africa, exhibit significant variability in traits related to nitrogen use efficiency, biomass allocation, and source–sink dynamics. This diversity reflects their adaptation to historically low-input agricultural systems, where nutrient scavenging and stress tolerance are essential for survival. These historical adaptations are driven by allelic variation at key loci regulating nitrogen uptake, assimilation, and signaling [63]. Landraces, therefore, act as valuable reservoirs of beneficial alleles for N-stress resilience, which can be introgressed into elite germplasms through marker-assisted selection (MAS) or genomic selection (GS) [64]. For instance, QTLs linked to glutamine synthetase activity and root architectural traits under LN conditions have been successfully mapped and utilized in wheat breeding programs through MAS. By evaluating these landraces under low and normal nitrogen conditions, we provide insights into the evolutionary processes that shape their phenotypic and physiological traits.
The evaluation of 48 Watkins wheat landraces revealed significant variability in their performance under LN and NN conditions. Landraces such as WATDE0013 and WATDE0020 consistently emerged as top performers, exhibiting high yields under both stress Ys and Yp conditions. For instance, WATDE0013 achieved the highest yield under stress (11.21), while WATDE0020 demonstrated exceptional productivity under non-stress conditions (10.31). These landraces also showed minimal yield reduction RC and high STI, indicating their ability to maintain biomass allocation to sinks, even under nitrogen-limited environments [65]. The superior performance of these landraces likely reflects their evolutionary adaptation to nutrient-poor soils, a trait that has been largely lost in modern high-yielding cultivars. Conversely, landraces like WATDE1055 and WATDE0044 were highly susceptible to nitrogen stress, with significantly lower yields and poor stress tolerance indices. For example, WATDE1055 recorded the lowest yield under stress (0.825) and exhibited a high yield reduction (RC = 9.3830), reflecting its inability to sustain source–sink balance under adverse conditions. Despite their poor performance, these landraces may harbor unique alleles for other adaptive traits, underscoring the importance of conserving diverse genetic resources in gene banks for future breeding and crop improvement [66]. These indices provided a quantitative framework for assessing the ability of landraces to maintain biomass allocation to sinks under stress [67]. For instance, landraces with high STI values (e.g., WATDE0013, STI = 1.7913) demonstrated superior stress tolerance, while those with low STI values (e.g., WATDE1055, STI = 0.0847) were highly susceptible to stress. The stress susceptibility index (SSI) further highlighted the variability in stress responses among landraces [68]. Landraces with low SSI values (e.g., WATDE0013, SSI = −3.2647) exhibited minimal yield reduction under stress, whereas those with high SSI values (e.g., WATDE0090, SSI = 0.0171) experienced significant yield losses.
The superior performance of landraces such as WATDE0013 and WATDE0020 under nitrogen stress, as reflected in their high STI and low SSI values, can be attributed to morphological and molecular adaptations that optimize nitrogen use efficiency (NUE). In response, high-performing landraces are likely to exhibit enhanced root proliferation under low nitrogen (LN), enabling greater nitrogen scavenging. This aligns with studies showing that nitrogen-efficient wheat genotypes upregulate nitrate transporters (e.g., NRT1.1, NRT2.1) and develop deeper root systems under stress [29,69]. Moreover, the stability of YSI in genotypes like WATDE0013 may stem from sustained leaf area and chloroplast function under LN, mediated by nitrate reductase (NR) and glutamine synthetase (GS) activity, which are critical for maintaining photosynthetic output [6,70]. In addition, the observed biomass partitioning (e.g., higher root-to-shoot ratios in WATDE0020) suggests carbon reallocation to roots under stress, a trait linked to sucrose transporter (SUT) expression and trehalose-6-phosphate (T6P) signaling, which regulate sink strength [23,33]. The integration of multiple indices in this study provides a robust approach for identifying landraces with balanced source–sink dynamics under nitrogen stress [71].
The multivariate correlation analysis revealed several key relationships between stress tolerance and yield-related parameters, offering deeper insights into the mechanisms underlying source–sink competition [72,73]. For instance, the strong positive correlation between mean and GMP (r = 0.979) indicates that landraces with high mean performance also exhibit high productivity across stress and non-stress conditions. High MP/GMP may reflect allelic variation in TaNRT2.1 (high-affinity nitrate transporter) or GS2 (glutamine synthetase), which enhances N remobilization under stress [69]. Ongoing GWAS will test these hypotheses. Similarly, the strong negative correlation between stress index and tolerance index (TOL) (r = −0.8964) suggests that landraces with high stress indices are less tolerant to nitrogen stress, as reflected in their greater yield reduction under adverse conditions. This inverse relationship highlights the trade-off between stress tolerance and yield stability, a phenomenon that has been observed in other crops under abiotic stress [74]. These correlations provide valuable insights for breeding programs aimed at developing nitrogen-efficient wheat varieties [75]. The PCA results further elucidated the underlying structure of the dataset, with Prin1 explaining 61.741% of the total variance. Prin1 was strongly associated with stress tolerance indices such as the STI and stress index, indicating that it primarily captures variation related to nitrogen stress tolerance. This finding is consistent with previous studies that have used PCA to identify key traits associated with stress tolerance in crops [76,77,78]. Prin2, though not statistically significant, explained an additional 32.64% of the variance and was associated with productivity-related metrics such as GMP and mean performance. This suggests that Prin2 captures variations related to overall productivity, independent of stress conditions. The minimal contribution of subsequent components (Prin3 to Prin6) indicates that the primary dimensions of variation in the dataset are adequately captured by Prin1 and Prin2 [79].
The hierarchical clustering analysis categorized the Watkins wheat landraces into five distinct groups based on their average rank (AR) values, reflecting their stress tolerance levels [80]. The high-performing group (AR = 6.64–11.91), which included landraces such as WATDE0013 and WATDE0020, demonstrated exceptional stress tolerance and yield stability, making them ideal candidates for cultivation in nitrogen-stressed environments. In contrast, the low-performing group (AR = 33.09–44.27), which included landraces such as WATDE1055 and WATDE0044, exhibited poor stress tolerance and yield stability, underscoring the need for targeted breeding efforts to enhance their resilience. The intermediate groups (AR = 13.18–31.18) provided a valuable resource for further evaluation and improvement, particularly in regions with moderate nitrogen stress. This geographic clustering of resilient landraces (e.g., from marginal agroecosystems) hints at local adaptation driven by selection for nitrogen assimilation pathways: Landraces like WATDE0013 may harbor allelic variants in genes encoding GS/GOGAT cycle enzymes, enhancing ammonium assimilation under LN [81]. Abscisic acid (ABA) and brassinosteroid signaling likely modulate stomatal conductance and nitrogen remobilization in tolerant genotypes, as demonstrated in other cereals [58]. Stress-responsive miRNAs (e.g., miR169, miR398) could suppress root growth inhibitors under LN, explaining the robust root systems in high-performing landraces [56].
The identification of high-performing landraces such as WATDE0013 and WATDE0020 has significant implications for breeding programs aimed at improving nitrogen use efficiency and stress tolerance in wheat. These landraces can serve as genetic resources for developing nitrogen-efficient varieties, particularly in regions prone to nitrogen stress [82]. Additionally, medium- and low-performing landraces provide opportunities for targeted genetic improvement, either through traditional breeding or advanced biotechnological approaches [83,84]. Future research should focus on elucidating the molecular mechanisms underlying the superior performance of high-performing landraces, particularly in relation to source–sink dynamics and nitrogen metabolism. The integration of genomic tools such as genome-wide association studies (GWASs) could accelerate the development of nitrogen-efficient wheat varieties. Next, we will conduct transcriptome and metabolome profiling to identify candidate genes and regulatory modules associated with the source–sink balance under nitrogen stress. The identified loci will be converted into high-throughput markers for marker-assisted selection (MAS). Additionally, genomic selection models incorporating genome-wide marker effects will be trained on diverse populations derived from the Watkins collection to predict nitrogen-use efficiency in breeding lines. The integration of stress indices and multivariate statistical tools in this study offers a robust framework for evaluating source–sink dynamics under varying nitrogen regimes. By linking phenotypic evaluation with crop evolution and gene-bank relevance, this study provides a foundation for conserving and utilizing Watkins wheat landraces as genetic resources for sustainable agriculture.

5. Conclusions

The genetic diversity in source–sink dynamics among Watkins wheat landraces under nitrogen stress reflects evolutionarily conserved adaptations to nutrient-poor agroecosystems. High-performing genotypes, such as WATDE0013 and WATDE0020, likely owe their resilience to mechanisms that optimize nitrogen acquisition and remobilization, such as enhanced root proliferation mediated by NRT2.1 nitrate transporters and sustained photosynthetic efficiency via preferential nitrogen allocation to chloroplasts. Their low SSI values suggest minimal trade-offs between growth and stress tolerance, potentially linked to allelic variation in transcription factors, such as bHLH or NAC, that balance carbon–nitrogen metabolism under limitation. Conversely, the susceptibility of WATDE1055 may stem from dysregulated trehalose-6-phosphate (T6P) signaling, impairing sucrose partitioning to roots under sink-limited conditions, or deficits in glutamine synthetase (GS2) activity critical for ammonium assimilation. These findings illustrate how historical cultivation in marginal environments is selected for alleles that fine-tune source–sink coordination. For instance, the geographic clustering of resilient landraces in arid regions correlates with root-specific auxin transporters that enhance nitrogen foraging and miR169-mediated suppression of root growth inhibitors under stress. To advance this work, multi-omics approaches, such as transcriptomic profiling of NRTs and SUTs in contrasting genotypes, will help pinpoint the regulatory hubs governing nitrogen resilience. Genome-wide association studies (GWASs) targeting STI and YSI indices can identify candidate loci for marker-assisted selection. By linking phenotypic indices to molecular networks, this framework offers a roadmap to engineer nitrogen-efficient wheat tailored to climate-variable environments.

Supplementary Materials

The following supporting information can be downloaded at https://www.mdpi.com/article/10.3390/d17050359/s1: Table S1: Landrace details; Table S2: Hoagland solution; Table S3: Mean source; Table S4: Rank mean.

Author Contributions

Conceptualization, S.C. and B.S.; methodology, M.S.I., A.W. and Z.S.; validation, J.H., B.S., S.L. and Y.W.; investigation, A.W., M.S.I. and Z.S.; data curation, M.S.I. and Z.S.; writing—original draft preparation, A.W. and M.S.I.; writing—review and editing, A.W., B.S., S.L. and M.S.I.; visualization, B.S.; resources, S.C. and J.H.; supervision, S.C.; project funding acquisition, S.C.; software, M.S.I., S.L., Z.S. and Y.W. All authors have read and agreed to the published version of the manuscript.

Funding

This work was supported by the Program for Guangdong “ZhuJiang” Introducing Innovative and Entrepreneurial Teams (2019ZT08N628), the National Key Research and Development Program of China (2023YFF1000100 and 2023YFA0914600), the National Natural Science Foundation of China (32022006), the Agricultural Science and Technology Innovation Program (CAAS-ASTIP-2021-AGIS-ZDRW202101), the Shenzhen Science and Technology Program (AGIS-ZDKY202002), and projects subsidized by special funds for science and technology innovation and industrial development of Shenzhen Dapeng New District (PT202101-01) (to Shifeng Cheng).

Institutional Review Board Statement

Not applicable.

Data Availability Statement

The data generated and used to draw the conclusions are available in the manuscript and Supplementary Files.

Acknowledgments

This research paper is part of the PhD thesis of Abdul Waheed, focusing on identifying and leveraging genetic resources to address critical challenges in agricultural sustainability. We extend our gratitude to the Chinese Scholarship Council for providing essential funding and academic support, which has been pivotal in facilitating this research journey. Furthermore, we are deeply thankful to the Agricultural Genomics Institute at Shenzhen, Chinese Academy of Agricultural Sciences, for offering access to state-of-the-art research facilities and the invaluable Watkins wheat landrace populations. Their contributions to the preservation and sharing of genetic resources have been instrumental in advancing our understanding of crop improvement.

Conflicts of Interest

The authors declare no conflicts of interest.

References

  1. Hossain, A.; Skalicky, M.; Brestic, M.; Maitra, S.; Ashraful Alam, M.; Syed, M.A.; Hossain, J.; Sarkar, S.; Saha, S.; Bhadra, P. Consequences and mitigation strategies of abiotic stresses in wheat (Triticum aestivum L.) under the changing climate. Agronomy 2021, 11, 241. [Google Scholar] [CrossRef]
  2. Singh, S.; Kumar, S.; Kashyap, P.; Sendhil, R.; Gupta, O. Wheat. In Trajectory of 75 Years of Indian Agriculture After Independence; Springer: Singapore, 2023; pp. 137–162. [Google Scholar]
  3. Amirhajloo, S.; Gheysari, M.; Shayannejad, M.; Shirvani, M. Selection of the best nitrogen fertilizer management scenario in wheat based on Palmer drought severity index with an environmental perspective. Eur. J. Agron. 2023, 151, 126980. [Google Scholar] [CrossRef]
  4. Fischer, R.; Edmeades, G.O. Breeding and cereal yield progress. Crop Sci. 2010, 50, S-85–S-98. [Google Scholar] [CrossRef]
  5. Ali, N.; Akmal, M. Wheat growth, yield, and quality under water deficit and reduced nitrogen supply. A review. Gesunde Pflanz. 2022, 74, 371–383. [Google Scholar] [CrossRef]
  6. Wang, Q.; Li, S.; Li, J.; Huang, D. The utilization and roles of nitrogen in plants. Forests 2024, 15, 1191. [Google Scholar] [CrossRef]
  7. Javed, T.; I, I.; Singhal, R.K.; Shabbir, R.; Shah, A.N.; Kumar, P.; Jinger, D.; Dharmappa, P.M.; Shad, M.A.; Saha, D. Recent advances in agronomic and physio-molecular approaches for improving nitrogen use efficiency in crop plants. Front. Plant Sci. 2022, 13, 877544. [Google Scholar] [CrossRef]
  8. Broccanello, C.; Bellin, D.; DalCorso, G.; Furini, A.; Taranto, F. Genetic approaches to exploit landraces for improvement of Triticum turgidum ssp. durum in the age of climate change. Front. Plant Sci. 2023, 14, 1101271. [Google Scholar] [CrossRef]
  9. Wingen, L.U.; Orford, S.; Goram, R.; Leverington-Waite, M.; Bilham, L.; Patsiou, T.S.; Ambrose, M.; Dicks, J.; Griffiths, S. Establishing the AE Watkins landrace cultivar collection as a resource for systematic gene discovery in bread wheat. Theor. Appl. Genet. 2014, 127, 1831–1842. [Google Scholar] [CrossRef]
  10. King, J.; Dreisigacker, S.; Reynolds, M.; Bandyopadhyay, A.; Braun, H.J.; Crespo-Herrera, L.; Crossa, J.; Govindan, V.; Huerta, J.; Ibba, M.I. Wheat genetic resources have avoided disease pandemics, improved food security, and reduced environmental footprints: A review of historical impacts and future opportunities. Glob. Change Biol. 2024, 30, e17440. [Google Scholar] [CrossRef]
  11. Mefleh, M.; Conte, P.; Fadda, C.; Giunta, F.; Piga, A.; Hassoun, G.; Motzo, R. From ancient to old and modern durum wheat varieties: Interaction among cultivar traits, management, and technological quality. J. Sci. Food Agric. 2019, 99, 2059–2067. [Google Scholar] [CrossRef]
  12. Gaju, O.; DeSilva, J.; Carvalho, P.; Hawkesford, M.J.; Griffiths, S.; Greenland, A.; Foulkes, M.J. Leaf photosynthesis and associations with grain yield, biomass and nitrogen-use efficiency in landraces, synthetic-derived lines and cultivars in wheat. Field Crops Res. 2016, 193, 1–15. [Google Scholar] [CrossRef]
  13. Guo, J.; Jia, Y.; Chen, H.; Zhang, L.; Yang, J.; Zhang, J.; Hu, X.; Ye, X.; Li, Y.; Zhou, Y. Growth, photosynthesis, and nutrient uptake in wheat are affected by differences in nitrogen levels and forms and potassium supply. Sci. Rep. 2019, 9, 1248. [Google Scholar] [CrossRef] [PubMed]
  14. Edgerton, M.D. Increasing crop productivity to meet global needs for feed, food, and fuel. Plant Physiol. 2009, 149, 7–13. [Google Scholar] [CrossRef]
  15. Sabina, R.; Paul, J.; Sharma, S.; Hussain, N. Synthetic Nitrogen Fertilizer Pollution: Global Concerns and Sustainable Mitigating Approaches. In Agricultural Nutrient Pollution and Climate Change: Challenges and Opportunities; Springer: Cham, Switzerland, 2025; pp. 57–101. [Google Scholar]
  16. Zhang, X.; Sabo, R.; Rosa, L.; Niazi, H.; Kyle, P.; Byun, J.S.; Wang, Y.; Yan, X.; Gu, B.; Davidson, E.A. Nitrogen management during decarbonization. Nat. Rev. Earth Environ. 2024, 5, 717–731. [Google Scholar] [CrossRef]
  17. Tufail, M.A.; Ayyub, M.; Tariq, L.; Iltaf, J.; Asbat, A.; Bashir, I.; Umar, W. Nitrogen fertilizers and the future of sustainable agriculture: A deep dive into production, pollution, and mitigation measures. Soil Sci. Plant Nutr. 2024, 70, 457–477. [Google Scholar] [CrossRef]
  18. Ying, H.; Ye, Y.; Cui, Z.; Chen, X. Managing nitrogen for sustainable wheat production. J. Clean. Prod. 2017, 162, 1308–1316. [Google Scholar] [CrossRef]
  19. Link, J.; Batchelor, W.D.; Graeff, S.; Claupein, W. Evaluation of current and model-based site-specific nitrogen applications on wheat (Triticum aestivum L.) yield and environmental quality. Precis. Agric. 2008, 9, 251–267. [Google Scholar] [CrossRef]
  20. Argento, F.; Anken, T.; Abt, F.; Vogelsanger, E.; Walter, A.; Liebisch, F. Site-specific nitrogen management in winter wheat supported by low-altitude remote sensing and soil data. Precis. Agric. 2021, 22, 364–386. [Google Scholar] [CrossRef]
  21. Fernie, A.R.; Bachem, C.W.; Helariutta, Y.; Neuhaus, H.E.; Prat, S.; Ruan, Y.-L.; Stitt, M.; Sweetlove, L.J.; Tegeder, M.; Wahl, V. Synchronization of developmental, molecular and metabolic aspects of source–sink interactions. Nat. Plants 2020, 6, 55–66. [Google Scholar] [CrossRef]
  22. Tegeder, M.; Masclaux-Daubresse, C. Source and sink mechanisms of nitrogen transport and use. New Phytol. 2018, 217, 35–53. [Google Scholar] [CrossRef]
  23. Lawlor, D.W.; Paul, M.J. Source/sink interactions underpin crop yield: The case for trehalose 6-phosphate/SnRK1 in improvement of wheat. Front. Plant Sci. 2014, 5, 418. [Google Scholar] [CrossRef] [PubMed]
  24. Ely, K.S.; Burnett, A.C.; Lieberman-Cribbin, W.; Serbin, S.P.; Rogers, A. Spectroscopy can predict key leaf traits associated with source–sink balance and carbon–nitrogen status. J. Exp. Bot. 2019, 70, 1789–1799. [Google Scholar] [CrossRef] [PubMed]
  25. Lemoine, R.; Camera, S.L.; Atanassova, R.; Dédaldéchamp, F.; Allario, T.; Pourtau, N.; Bonnemain, J.-L.; Laloi, M.; Coutos-Thévenot, P.; Maurousset, L. Source-to-sink transport of sugar and regulation by environmental factors. Front. Plant Sci. 2013, 4, 272. [Google Scholar] [CrossRef]
  26. Miralles, D.J.; Slafer, G.A. Sink limitations to yield in wheat: How could it be reduced? J. Agric. Sci. 2007, 145, 139–149. [Google Scholar] [CrossRef]
  27. Asseng, S.; Cammarano, D.; Basso, B.; Chung, U.; Alderman, P.D.; Sonder, K.; Reynolds, M.; Lobell, D.B. Hot spots of wheat yield decline with rising temperatures. Glob. Change Biol. 2017, 23, 2464–2472. [Google Scholar] [CrossRef]
  28. Rivera-Amado, C.; Molero, G.; Trujillo-Negrellos, E.; Reynolds, M.; Foulkes, J. Estimating organ contribution to grain filling and potential for source upregulation in wheat cultivars with a contrasting source–sink balance. Agronomy 2020, 10, 1527. [Google Scholar] [CrossRef]
  29. Xu, G.; Fan, X.; Miller, A.J. Plant nitrogen assimilation and use efficiency. Annu. Rev. Plant Biol. 2012, 63, 153–182. [Google Scholar] [CrossRef]
  30. Duan, J.; Shao, Y.; He, L.; Li, X.; Hou, G.; Li, S.; Feng, W.; Zhu, Y.; Wang, Y.; Xie, Y. Optimizing nitrogen management to achieve high yield, high nitrogen efficiency and low nitrogen emission in winter wheat. Sci. Total Environ. 2019, 697, 134088. [Google Scholar] [CrossRef]
  31. Gonzalez-Dugo, V.; Durand, J.-L.; Gastal, F. Water deficit and nitrogen nutrition of crops. A review. Agron. Sustain. Dev. 2010, 30, 529–544. [Google Scholar] [CrossRef]
  32. Ning, P.; Yang, L.; Li, C.; Fritschi, F.B. Post-silking carbon partitioning under nitrogen deficiency revealed sink limitation of grain yield in maize. J. Exp. Bot. 2018, 69, 1707–1719. [Google Scholar] [CrossRef]
  33. Bihmidine, S.; Hunter III, C.T.; Johns, C.E.; Koch, K.E.; Braun, D.M. Regulation of assimilate import into sink organs: Update on molecular drivers of sink strength. Front. Plant Sci. 2013, 4, 177. [Google Scholar] [CrossRef] [PubMed]
  34. Madani, A.; Rad, A.S.; Pazoki, A.; Nourmohammadi, G.; Zarghami, R. Wheat (Triticum aestivum L.) grain filling and dry matter partitioning responses to source: Sink modifications under postanthesis water and nitrogen deficiency. Acta Sci. Agron. 2010, 32, 145–151. [Google Scholar] [CrossRef]
  35. Mohammadi, R.; Abdulahi, A. Evaluation of durum wheat genotypes based on drought tolerance indices under different levels of drought stress. J. Agric. Sci. 2017, 62, 1–14. [Google Scholar] [CrossRef]
  36. Zhu, M.; Shabala, S.; Shabala, L.; Fan, Y.; Zhou, M. Evaluating predictive values of various physiological indices for salinity stress tolerance in wheat. J. Agron. Crop Sci. 2016, 202, 115–124. [Google Scholar] [CrossRef]
  37. Abd El-Mohsen, A.A.; Abd El-Shafi, M.; Gheith, E.; Suleiman, H. Using different statistical procedures for evaluating drought tolerance indices of bread wheat genotypes. Adv. Agric. Biol. 2015, 4, 19–30. [Google Scholar]
  38. Rosielle, A.; Hamblin, J. Theoretical aspects of selection for yield in stress and non-stress environment. Crop Sci. 1981, 21, 943–946. [Google Scholar] [CrossRef]
  39. Raman, A.; Verulkar, S.; Mandal, N.; Variar, M.; Shukla, V.; Dwivedi, J.; Singh, B.; Singh, O.; Swain, P.; Mall, A. Drought yield index to select high yielding rice lines under different drought stress severities. Rice 2012, 5, 31. [Google Scholar] [CrossRef]
  40. Fernandez, G.C. Effective selection criteria for assessing plant stress tolerance. In Proceedings of the International Symposium on Adaptation of Food Crops to Temperature and Water Stress, Taiwan, China, 13–18 August 1992. [Google Scholar]
  41. Fischer, R.; Maurer, R. Drought resistance in spring wheat cultivars. I. Grain yield responses. Aust. J. Agric. Res. 1978, 29, 897–912. [Google Scholar] [CrossRef]
  42. Gavuzzi, P.; Rizza, F.; Palumbo, M.; Campanile, R.; Ricciardi, G.; Borghi, B. Evaluation of field and laboratory predictors of drought and heat tolerance in winter cereals. Can. J. Plant Sci. 1997, 77, 523–531. [Google Scholar] [CrossRef]
  43. Pour-Aboughadareh, A.; Yousefian, M.; Moradkhani, H.; Poczai, P.; Siddique, K.H. STABILITYSOFT: A new online program to calculate parametric and non-parametric stability statistics for crop traits. Appl. Plant Sci. 2019, 7, e01211. [Google Scholar] [CrossRef]
  44. Ketata, H.; Yau, S.; Nachit, M. Relative consistency performance across environments. In Proceedings of the International Symposium on Physiology and Breeding of Winter Cereals for Stressed Mediterranean Environments, Montpellier, France, 3–6 July 1989; pp. 391–400. [Google Scholar]
  45. Bidinger, F.; Mahalakshmi, V.; Rao, G.D.P. Assessment of drought resistance in pearl millet (Pennisetum americanum (L.) Leeke). II. Estimation of genotype response to stress. Aust. J. Agric. Res. 1987, 38, 49–59. [Google Scholar] [CrossRef]
  46. Bouslama, M.; Schapaugh, W., Jr. Stress tolerance in soybeans. I. Evaluation of three screening techniques for heat and drought tolerance 1. Crop Sci. 1984, 24, 933–937. [Google Scholar] [CrossRef]
  47. Smith, M.R.; Rao, I.M.; Merchant, A. Source-sink relationships in crop plants and their influence on yield development and nutritional quality. Front. Plant Sci. 2018, 9, 1889. [Google Scholar] [CrossRef]
  48. Serrago, R.A.; Alzueta, I.; Savin, R.; Slafer, G.A. Understanding grain yield responses to source–sink ratios during grain filling in wheat and barley under contrasting environments. Field Crops Res. 2013, 150, 42–51. [Google Scholar] [CrossRef]
  49. Martínez-Peña, R.; Schlereth, A.; Höhne, M.; Encke, B.; Morcuende, R.; Nieto-Taladriz, M.T.; Araus, J.L.; Aparicio, N.; Vicente, R. Source-sink dynamics in field-grown durum wheat under contrasting nitrogen supplies: Key role of non-foliar organs during grain filling. Front. Plant Sci. 2022, 13, 869680. [Google Scholar] [CrossRef]
  50. Wu, F.; Bao, W.; Li, F.; Wu, N. Effects of drought stress and N supply on the growth, biomass partitioning and water-use efficiency of Sophora davidii seedlings. Environ. Exp. Bot. 2008, 63, 248–255. [Google Scholar] [CrossRef]
  51. Kamiji, Y.; Pang, J.; Milroy, S.P.; Palta, J.A. Shoot biomass in wheat is the driver for nitrogen uptake under low nitrogen supply, but not under high nitrogen supply. Field Crops Res. 2014, 165, 92–98. [Google Scholar] [CrossRef]
  52. White, A.C.; Rogers, A.; Rees, M.; Osborne, C.P. How can we make plants grow faster? A source–sink perspective on growth rate. J. Exp. Bot. 2016, 67, 31–45. [Google Scholar] [CrossRef]
  53. Poorter, H.; Niklas, K.J.; Reich, P.B.; Oleksyn, J.; Poot, P.; Mommer, L. Biomass allocation to leaves, stems and roots: Meta-analyses of interspecific variation and environmental control. New Phytol. 2012, 193, 30–50. [Google Scholar] [CrossRef]
  54. Christina, M.; Laclau, J.-P.; Gonçalves, J.L.M.; Jourdan, C.; Nouvellon, Y.; Bouillet, J.-P. Almost symmetrical vertical growth rates above and below ground in one of the world’s most productive forests. Ecosphere 2011, 2, 1–10. [Google Scholar] [CrossRef]
  55. Li, Q.; Zhao, C.-Z.; Kang, M.-P.; Li, X.-Y. The relationship of the main root-shoot morphological characteristics and biomass allocation of Saussurea salsa under different habitat conditions in Sugan lake wetland on the northern margin of the Qinghai-Tibet Plateau. Ecol. Indic. 2021, 128, 107836. [Google Scholar] [CrossRef]
  56. Yan, H.; Shi, H.; Hu, C.; Luo, M.; Xu, C.; Wang, S.; Li, N.; Tang, W.; Zhou, Y.; Wang, C. Transcriptome differences in response mechanisms to low-nitrogen stress in two wheat varieties. Int. J. Mol. Sci. 2021, 22, 12278. [Google Scholar] [CrossRef]
  57. Pathak, R.R.; Mandal, V.K.; Jangam, A.P.; Sharma, N.; Madan, B.; Jaiswal, D.K.; Raghuram, N. Heterotrimeric G-protein α subunit (RGA1) regulates tiller development, yield, cell wall, nitrogen response and biotic stress in rice. Sci. Rep. 2021, 11, 2323. [Google Scholar] [CrossRef]
  58. Zuluaga, D.L.; Sonnante, G. The use of nitrogen and its regulation in cereals: Structural genes, transcription factors, and the role of miRNAs. Plants 2019, 8, 294. [Google Scholar] [CrossRef] [PubMed]
  59. Dodig, D.; Božinović, S.; Nikolić, A.; Zorić, M.; Vančetović, J.; Ignjatović-Micić, D.; Delić, N.; Weigelt-Fischer, K.; Junker, A.; Altmann, T. Image-derived traits related to mid-season growth performance of maize under nitrogen and water stress. Front. Plant Sci. 2019, 10, 814. [Google Scholar] [CrossRef]
  60. Shi, W.; Muthurajan, R.; Rahman, H.; Selvam, J.; Peng, S.; Zou, Y.; Jagadish, K.S. Source–sink dynamics and proteomic reprogramming under elevated night temperature and their impact on rice yield and grain quality. New Phytol. 2013, 197, 825–837. [Google Scholar] [CrossRef]
  61. Andrianasolo, F.N.; Champolivier, L.; Debaeke, P.; Maury, P. Source and sink indicators for determining nitrogen, plant density and genotype effects on oil and protein contents in sunflower achenes. Field Crops Res. 2016, 192, 33–41. [Google Scholar] [CrossRef]
  62. Mangi, N.; Nazir, M.F.; Wang, X.; Iqbal, M.S.; Sarfraz, Z.; Jatoi, G.H.; Mahmood, T.; Ma, Q.; Shuli, F. Dissecting source-sink relationship of subtending leaf for yield and fiber quality attributes in upland cotton (Gossypium hirsutum L.). Plants 2021, 10, 1147. [Google Scholar] [CrossRef]
  63. Liu, Y.; Wang, H.; Jiang, Z.; Wang, W.; Xu, R.; Wang, Q.; Zhang, Z.; Li, A.; Liang, Y.; Ou, S. Genomic basis of geographical adaptation to soil nitrogen in rice. Nature 2021, 590, 600–605. [Google Scholar] [CrossRef]
  64. Patil, B.S.; Bhat, J.S. Genomic Approaches for Achieving Higher Nutrient Use Efficiency. In Breeding Climate Resilient and Future Ready Oilseed Crops; Springer: Singapore, 2025; p. 163. [Google Scholar]
  65. Schillaci, C.; Perego, A.; Acutis, M.; Botta, M.; Tadiello, T.; Gabbrielli, M.; Barsali, T.; Tozzi, F.; Chiaramonti, D.; Jones, A. Assessing marginality of Camelina (C. sativa L. Crantz) in rotation with barley production in Southern Europe: A modelling approach. Agric. Ecosyst. Environ. 2023, 357, 108677. [Google Scholar] [CrossRef]
  66. Balmaceda, M.A.; Bainotti, C.; Gomez, D.; González, F.G.; Helguera, M.; Ruiz, M.B. Selection of wheat genotypes for water deficit tolerance using different drought tolerance indices. Cereal Res. Commun. 2024, 52, 1175–1185. [Google Scholar] [CrossRef]
  67. Zafar, M.M.; Iqbal, M.S.; Kamal, H.; Khan, A.I.; Sarfraz, Z.; Saeed, A.; Razzaq, A.; Shakeel, A. Advancing heat tolerance in cotton through integration of multiple stress tolerance indices and multivariate analyses. Int. J. Agric. Biosci. 2024, 13, 65–75. [Google Scholar]
  68. Kumar, Y.; Devi, S.; Phougat, D.; Chaurasia, H.; Choudhary, S. Assessment of Barley genotypes for salinity tolerance based on various indices under field condition. Assess. Curr. Agric. Res. J. 2024, 12, 586–598. [Google Scholar] [CrossRef]
  69. Liu, Z.; Hu, C.; Wang, Y.; Sha, Y.; Hao, Z.; Chen, F.; Yuan, L.; Mi, G. Nitrogen allocation and remobilization contributing to low-nitrogen tolerance in stay-green maize. Field Crops Res. 2021, 263, 108078. [Google Scholar] [CrossRef]
  70. Yan, Z.; Bin, C.; Zhengwen, S.; Zhengwen, L.; Yanru, C.; Ke, H.; Zhicheng, W.; Liqiang, W.; Guiyin, Z.; Wang, G.; et al. A large-scale genomic association analysis identifies a fragment in Dt11 chromosome conferring cotton Verticillium wilt resistance. Plant Biotechnol. J. 2021, 19, 2126–2138. [Google Scholar] [CrossRef]
  71. Cai, Z.; Xie, T.; Xu, J. Source–sink manipulations differentially affect carbon and nitrogen dynamics, fruit metabolites and yield of Sacha Inchi plants. BMC Plant Biol. 2021, 21, 160. [Google Scholar] [CrossRef]
  72. Burgess, A.J.; Masclaux-Daubresse, C.; Strittmatter, G.; Weber, A.P.; Taylor, S.H.; Harbinson, J.; Yin, X.; Long, S.; Paul, M.J.; Westhoff, P. Improving crop yield potential: Underlying biological processes and future prospects. Food Energy Secur. 2023, 12, e435. [Google Scholar] [CrossRef]
  73. Sarfraz, Z.; Shah, M.M.; Iqbal, M.S.; Nazir, M.F.; Al-Ashkar, I.; Rehmani, M.I.A.; Shahid Iqbal, M.; Ullah, N.; El Sabagh, A. Rendering multivariate statistical models for genetic diversity assessment in A-genome diploid wheat population. Agronomy 2021, 11, 2339. [Google Scholar] [CrossRef]
  74. Dwivedi, S.L.; Stoddard, F.L.; Ortiz, R. Genomic-based root plasticity to enhance abiotic stress adaptation and edible yield in grain crops. Plant Sci. 2020, 295, 110365. [Google Scholar] [CrossRef]
  75. Biradar, S.S.; Patil, M.K.; Desai, S.; Singh, S.K.; Naik, V.R.; Lamani, K.; Joshi, A.K. Nitrogen use efficiency in bread wheat: Genetic variation and prospects for improvement. PLoS ONE 2024, 19, e0294755. [Google Scholar] [CrossRef]
  76. Mubushar, M.; El-Hendawy, S.; Tahir, M.U.; Alotaibi, M.; Mohammed, N.; Refay, Y.; Tola, E. Assessing the suitability of multivariate analysis for stress tolerance indices, biomass, and grain yield for detecting salt tolerance in advanced spring wheat lines irrigated with saline water under field conditions. Agronomy 2022, 12, 3084. [Google Scholar] [CrossRef]
  77. Mohi-Ud-Din, M.; Hossain, M.A.; Rohman, M.M.; Uddin, M.N.; Haque, M.S.; Ahmed, J.U.; Hossain, A.; Hassan, M.M.; Mostofa, M.G. Multivariate analysis of morpho-physiological traits reveals differential drought tolerance potential of bread wheat genotypes at the seedling stage. Plants 2021, 10, 879. [Google Scholar] [CrossRef] [PubMed]
  78. Zafar, M.M.; Jia, X.; Shakeel, A.; Sarfraz, Z.; Manan, A.; Imran, A.; Mo, H.; Ali, A.; Youlu, Y.; Razzaq, A. Unraveling heat tolerance in upland cotton (Gossypium hirsutum L.) using univariate and multivariate analysis. Front. Plant Sci. 2022, 12, 727835. [Google Scholar] [CrossRef]
  79. Amara, V.; Samura, A.E.; Norman, P.E.; Kanu, S.A.; Karim, K.Y.; Tiendrebeogo, F.; Eni, A.O.; Pita, J.S. Characterization of the Cassava (Manihot esculenta) germplasm in Sierra Leone Based on agro-morphological and culinary traits. Horticulturae 2024, 10, 640. [Google Scholar] [CrossRef]
  80. Peng, Z.; Rehman, A.; Li, X.; Jiang, X.; Tian, C.; Wang, X.; Li, H.; Wang, Z.; He, S.; Du, X. Comprehensive evaluation and transcriptome analysis reveal the salt tolerance mechanism in semi-wild cotton (Gossypium purpurascens). Int. J. Mol. Sci. 2023, 24, 12853. [Google Scholar] [CrossRef]
  81. Konishi, M.; McLaren, D.G.; Engen, H.; Smallwood, J. Shaped by the past: The default mode network supports cognition that is independent of immediate perceptual input. PLoS ONE 2015, 10, e0132209. [Google Scholar] [CrossRef]
  82. Sandhu, N.; Sethi, M.; Kaur, H.; Dhillon, A.; Kumar, A.; Kaur, A.; Kaur, S.; Bentley, A.R.; Chhuneja, P. Mining natural genetic variations for nitrogen use efficiency utilizing nested synthetic hexaploid wheat introgression libraries. Environ. Exp. Bot. 2023, 212, 105394. [Google Scholar] [CrossRef]
  83. Joshi, D.C.; Sood, S.; Hosahatti, R.; Kant, L.; Pattanayak, A.; Kumar, A.; Yadav, D.; Stetter, M.G. From zero to hero: The past, present and future of grain amaranth breeding. Theor. Appl. Genet. 2018, 131, 1807–1823. [Google Scholar] [CrossRef]
  84. Vieira, R.A.; Nogueira, A.P.O.; Fritsche-Neto, R. Optimizing the selection of quantitative traits in plant breeding using simulation. Front. Plant Sci. 2025, 16, 1495662. [Google Scholar] [CrossRef]
Figure 1. Three-dimensional scatter plots illustrating source–sink traits under normal (Yp) and nitrogen stress (Ys) conditions. The plot includes indices such as TOL, MP, GMP, STI, SSI, RSI, HM, YSI, and YI. Landraces in Group A exhibited relatively stable performance under both low and normal nitrogen treatments. Group B comprised accessions that performed better under low nitrogen conditions, while Group C included landraces that excelled under normal nitrogen conditions. Group D consisted of landraces with lower performance under both treatments.
Diversity 17 00359 g001
Figure 2. Scatterplot matrix depicting pairwise relationships among source–sink-related traits. The upper triangle shows the correlations between the source–sink effects of the studied traits. Diagonal histograms represent the frequency distribution for each trait, while the lower triangle displays bivariate density distributions with ellipses for each trait pair. In the top right corner, a color gradient (ranging from red to blue) indicates the strength of the correlation, and circle size reflects the log p-value for significance thresholds.
Diversity 17 00359 g002
Figure 3. Squared cosines associated with the principal components for the studied traits and treatment effects.
Diversity 17 00359 g003
Figure 4. Summary plots: (left) biplot between PC1 and PC2 showing the distribution of upland landraces across treatment effects; (right) contribution of different traits to the variation in landraces and treatment effects.
Diversity 17 00359 g004
Figure 5. Scatterplot of PC1, PC2, and PC3 displaying the contributions of different traits.
Diversity 17 00359 g005
Figure 6. Dendrogram generated using agglomerative hierarchical clustering (AHC) with Ward’s method, illustrating the Euclidean distance matrix and grouping of landraces into five distinct clusters of Watkins wheat landraces for the source–sink traits across YP and YS conditions, along with the TOL, MP, GMP, STI, SSI, RSI, HM, YSI, and YI.
Diversity 17 00359 g006
Figure 7. Ranking of Watkins wheat landraces based on source–sink trait competition under stress conditions. The ranking is determined using stress indices (TOL, MP, GMP, STI, SSI, RSI, HM, YSI, and YI) to assess source–sink traits under both yield potential (Yp) and yield stress (Ys) conditions.
Diversity 17 00359 g007
Table 1. Different tolerance indices used for evaluation of 48 Watkins wheat landraces for source–sink biomass competition with formula and reference.
Stress IndexAbbreviationFormulaReference
Tolerance IndexTOLYp − Ys[38]
Mean Productivity MP ( Y p + Y s ) / 2 [38]
Geometric Mean GMP Y s × Y p [40]
Harmonic Mean HM 2 ( Y s × Y p ) / ( ( Y s + Y p ) ) [45]
Stress Susceptibility Index SSI ( 1 ( Y s / Y p ) ) / ( 1 ( y ¯ s / y ¯ p ) ) [41]
Stress Tolerance Index STI ( Y s × Y p ) / ( y ¯ p ) 2 [40]
Yield Index YI Y s y ¯ p [42]
Yield Stability Index YSI Y s Y p [46]
Relative Stress Index RSI ( ( Y s / Y p ) ) / ( ( y ¯ s / y ¯ p ) ) [41]
Yp: non-stressed yield; Ys: stressed yield; Ȳp: overall mean of non-stressed yield; and Ȳs: overall mean of stressed yield.
Table 2. Relationship of various physiological indicators with stress tolerance indices and validation of average ranking.
TraitNNLNMeanStress IndexTOLSTISSPIYIYSIRSIGMPMRPPYR
NN1−0.031 0.714 −0.611 0.735 −0.365 0.735 −0.031 −0.611 0.462 0.653 0.655 0.611
LN−0.031 10.677 0.678 −0.701 0.886 −0.701 10.678 −0.707 0.712 0.735 −0.678
Mean0.714 0.677 10.025 0.050 0.352 0.050 0.677 0.025 −0.155 0.979 0.997 −0.025
Stress Index−0.611 0.678 0.025 1−0.896 0.918 −0.896 0.678 1−0.708 0.027 0.098 −1
TOL0.735 −0.701 0.050 −0.896 1−0.861 1−0.701 −0.896 0.809 −0.018 −0.032 0.896
STI−0.365 0.886 0.352 0.918 −0.861 1−0.861 0.886 0.918 −0.683 0.347 0.423 −0.918
SSPI0.735 −0.701 0.050 −0.896 1−0.861 1−0.701 −0.896 0.809 −0.018 −0.032 0.896
YI−0.031 10.677 0.678 −0.701 0.886 −0.701 10.678 −0.707 0.712 0.735 −0.678
YSI−0.611 0.678 0.025 1−0.896 0.918 −0.896 0.678 1−0.708 0.027 0.098 −1
RSI0.462 −0.707 −0.155 −0.708 0.809 −0.683 0.809 −0.707 −0.708 1−0.285 −0.221 0.708
GMP0.653 0.712 0.979 0.027 −0.018 0.347 −0.018 0.712 0.027 −0.285 10.981 −0.027
MRP0.655 0.735 0.997 0.098 −0.032 0.423 −0.032 0.735 0.098 −0.221 0.981 1−0.098
PYR0.611 −0.678 −0.025 −10.896 −0.918 0.896 −0.678 −10.708 −0.027 −0.098 1
NN (Normal Nitrogen), LN (Low Nitrogen), and stress indices such as Tolerance Index (TOL), Stress Tolerance Index (STI), Stress Susceptibility Productivity Index (SSPI), Yield Index (YI), Yield Stability Index (YSI), Relative Stress Index (RSI), Geometric Mean Productivity (GMP), Mean Relative Performance (MRP), and Potential Yield Reduction (PYR).
Table 3. Eigenvalue for yield and different stress indices for the studied landraces.
NumberEigenvaluePercentCum PercentChiSquareDFProb > ChiSq
18.0263861.74161.741425.01776.727<0.0001 *
24.24320532.6494.38160.5677.980.9279
30.5131393.94798.329072.5841
40.2054351.5899.909061.1251
50.0105450.08199.99050.3211
60.0012960.01100040.4621
Eigenvalue (variance explained by the component), Percent (percentage of total variance explained by the component), Cum Percent (cumulative percentage of variance explained up to that component), ChiSquare (chi-square statistic for the component), DF (degrees of freedom), and Prob > ChiSq (probability value associated with the chi-square statistic) * significant at p < 0.05.
Disclaimer/Publisher’s Note: The statements, opinions and data contained in all publications are solely those of the individual author(s) and contributor(s) and not of MDPI and/or the editor(s). MDPI and/or the editor(s) disclaim responsibility for any injury to people or property resulting from any ideas, methods, instructions or products referred to in the content.

