1. Introduction
Specimens of eastern Hermann’s tortoises (
Testudo hermanni boettgeri) were used for research. This species is found in Mediterranean Europe, from the coast of northeastern Spain to southeastern France, as well as Mallorca (Spain), Menorca (Spain), Corsica (France), Sardinia (including Asinara Island), and Italy. It also inhabits the Croatian coasts, Bosnia and Herzegovina, Montenegro, central and southern Serbia, inland and southwestern Romania, most of Bulgaria, Macedonia, almost all of Albania, mainland Greece, and the European part of Türkiye [
1].
Testudo hermanni hermanni and
Testudo hermanni boettgeri (including
Testudo hermanni hercegovinensis) are known subspecies [
1].
T. h. hermanni is found in northeastern Spain, southeastern France, the Balearic Islands (Spain), Corsica (France), and Sardinia (Italy);
Testudo hermanni boettgeri is found mainly in the Balkan region [
1]. Although this species prefers Mediterranean oak forests, it can also inhabit maquis, seagrass meadows, agricultural areas, and railway sides [
1].
The skull of this tortoise species articulates with the atlas through a single occipital condyle, as in other turtles. This species can retract its head into the shell through two strong muscles: m. retrahens capiti collique and m. carapacocervicocapitis medialis [
2]. The carapace is a dermal bone structure covered with keratinized epithelium. The shell consists of a dorsal part, called the carapace, and a ventral part, flatter than the dorsal part, called the plastron. The shell comprises dermal bone, ribs, and thoracic and lumbar vertebrae [
3]. The carapace has 5 vertebral scutes in the midline, 4 pleural scutes more laterally on each side, and 12 marginal scutes surrounding the first. In the plastron, the scutes are arranged to start from the cranial end: intergular, entoplastron, epiplastron, gular, humeral, pectoral, abdominal, femoral, and anal [
4].
Geometric morphometrics methods as morphological methods have recently been preferred in anatomy and biology [
5,
6,
7,
8]. One of the reasons why such methods are preferred is that they can be used to explain differences regarding the averages of samples collected from one or more groups [
9,
10]. The differences and averages obtained from the samples can be interpreted functionally for studies. Geometric morphometric methods compare the crucial points determined during the survey by analyzing their spatial relationships through coordinate-based measurements. This contributes to seeing and interpreting the results individually and as a group [
11,
12].
In this study, a geometric morphometric method is used to place landmark points on the anatomical structures of specimens. These points are transferred to a coordinate system, forming a shape representation of the samples. The resulting shape is then analyzed in terms of distances, angles, centroid size, and asymmetry [
13]. Since the shape is constructed by superimposing images of the samples in the coordinate plane, potential visual errors are minimized. This method allows for identifying shape differences and asymmetry levels between adults and juveniles [
14].
Symmetry and asymmetry studies can provide fundamental insights into shape variations based on developmental, genetic, and environmental factors. These studies help to explain patterns of developmental stability and morphological integration. In short, they examine the quantitative characterization of the specimens used in these studies. As a result of these examinations, they support geometric morphometric arguments and improve the disciplines involved in these fields, such as biology and anatomy [
15]. For this purpose, asymmetry can be analyzed in three categories: directional asymmetry, fluctuating asymmetry, and antisymmetry [
16]. Directional asymmetry explains the stable differences shaped by the analyzed structures [
17]. It reveals prominent characteristics [
16]. Fluctuating asymmetry is used to find random differences [
17] and may be attributed to environmental and developmental factors [
16,
18]. Antisymmetry is used to explain phenotypic differences [
19]. However, antisymmetry is challenging to analyze when the number of samples is insufficient [
17].
This study aimed to investigate the asymmetric factors between adult and juvenile turtle shells. Accordingly, the fluctuating and directional asymmetry between adult and juvenile turtle shells was investigated. In addition, by comparing the shells of adult and juvenile turtles, we tried to interpret the effect of environmental factors on the asymmetry in the shells by their habitat. Statistical information obtained from the geometric morphometric method was analyzed to determine the types of asymmetry in the shells.
3. Results
The degree to which the first five principal components explain the total variation is given in
Table 1 for the carapace and
Table 2 for the plastron. However, PC1 is considered in the figures and results (
Figure 1 and
Figure 2). PC1 explained the highest percentage of shape variance in the carapace and plastron among the principal components (
Table 1 and
Table 2).
3.1. Carapace
Twenty-four landmarks were superimposed on the images taken from the turtles’ shells. All landmarks were paired with each other. This ensured that no error was made in the symmetry of the selected points (landmarks) after the program transferred them to the coordinate plane.
The ANOVA test results showed that the size and shape variation were statistically significant (
p < 0.0001;
Table 3 and
Table 4). Whether individual variation was significantly greater than error was determined by ANOVA analysis [
29]. According to the ANOVA analysis results, the error value was low. As a result, for both the carapace and the plastron, the study was significant.
The difference between averages was also analyzed in this study. According to these results, the Procrustes distance was 0.06. Also, the T-square results, obtained to measure the difference between averages, were statistically significant (p < 0.0001).
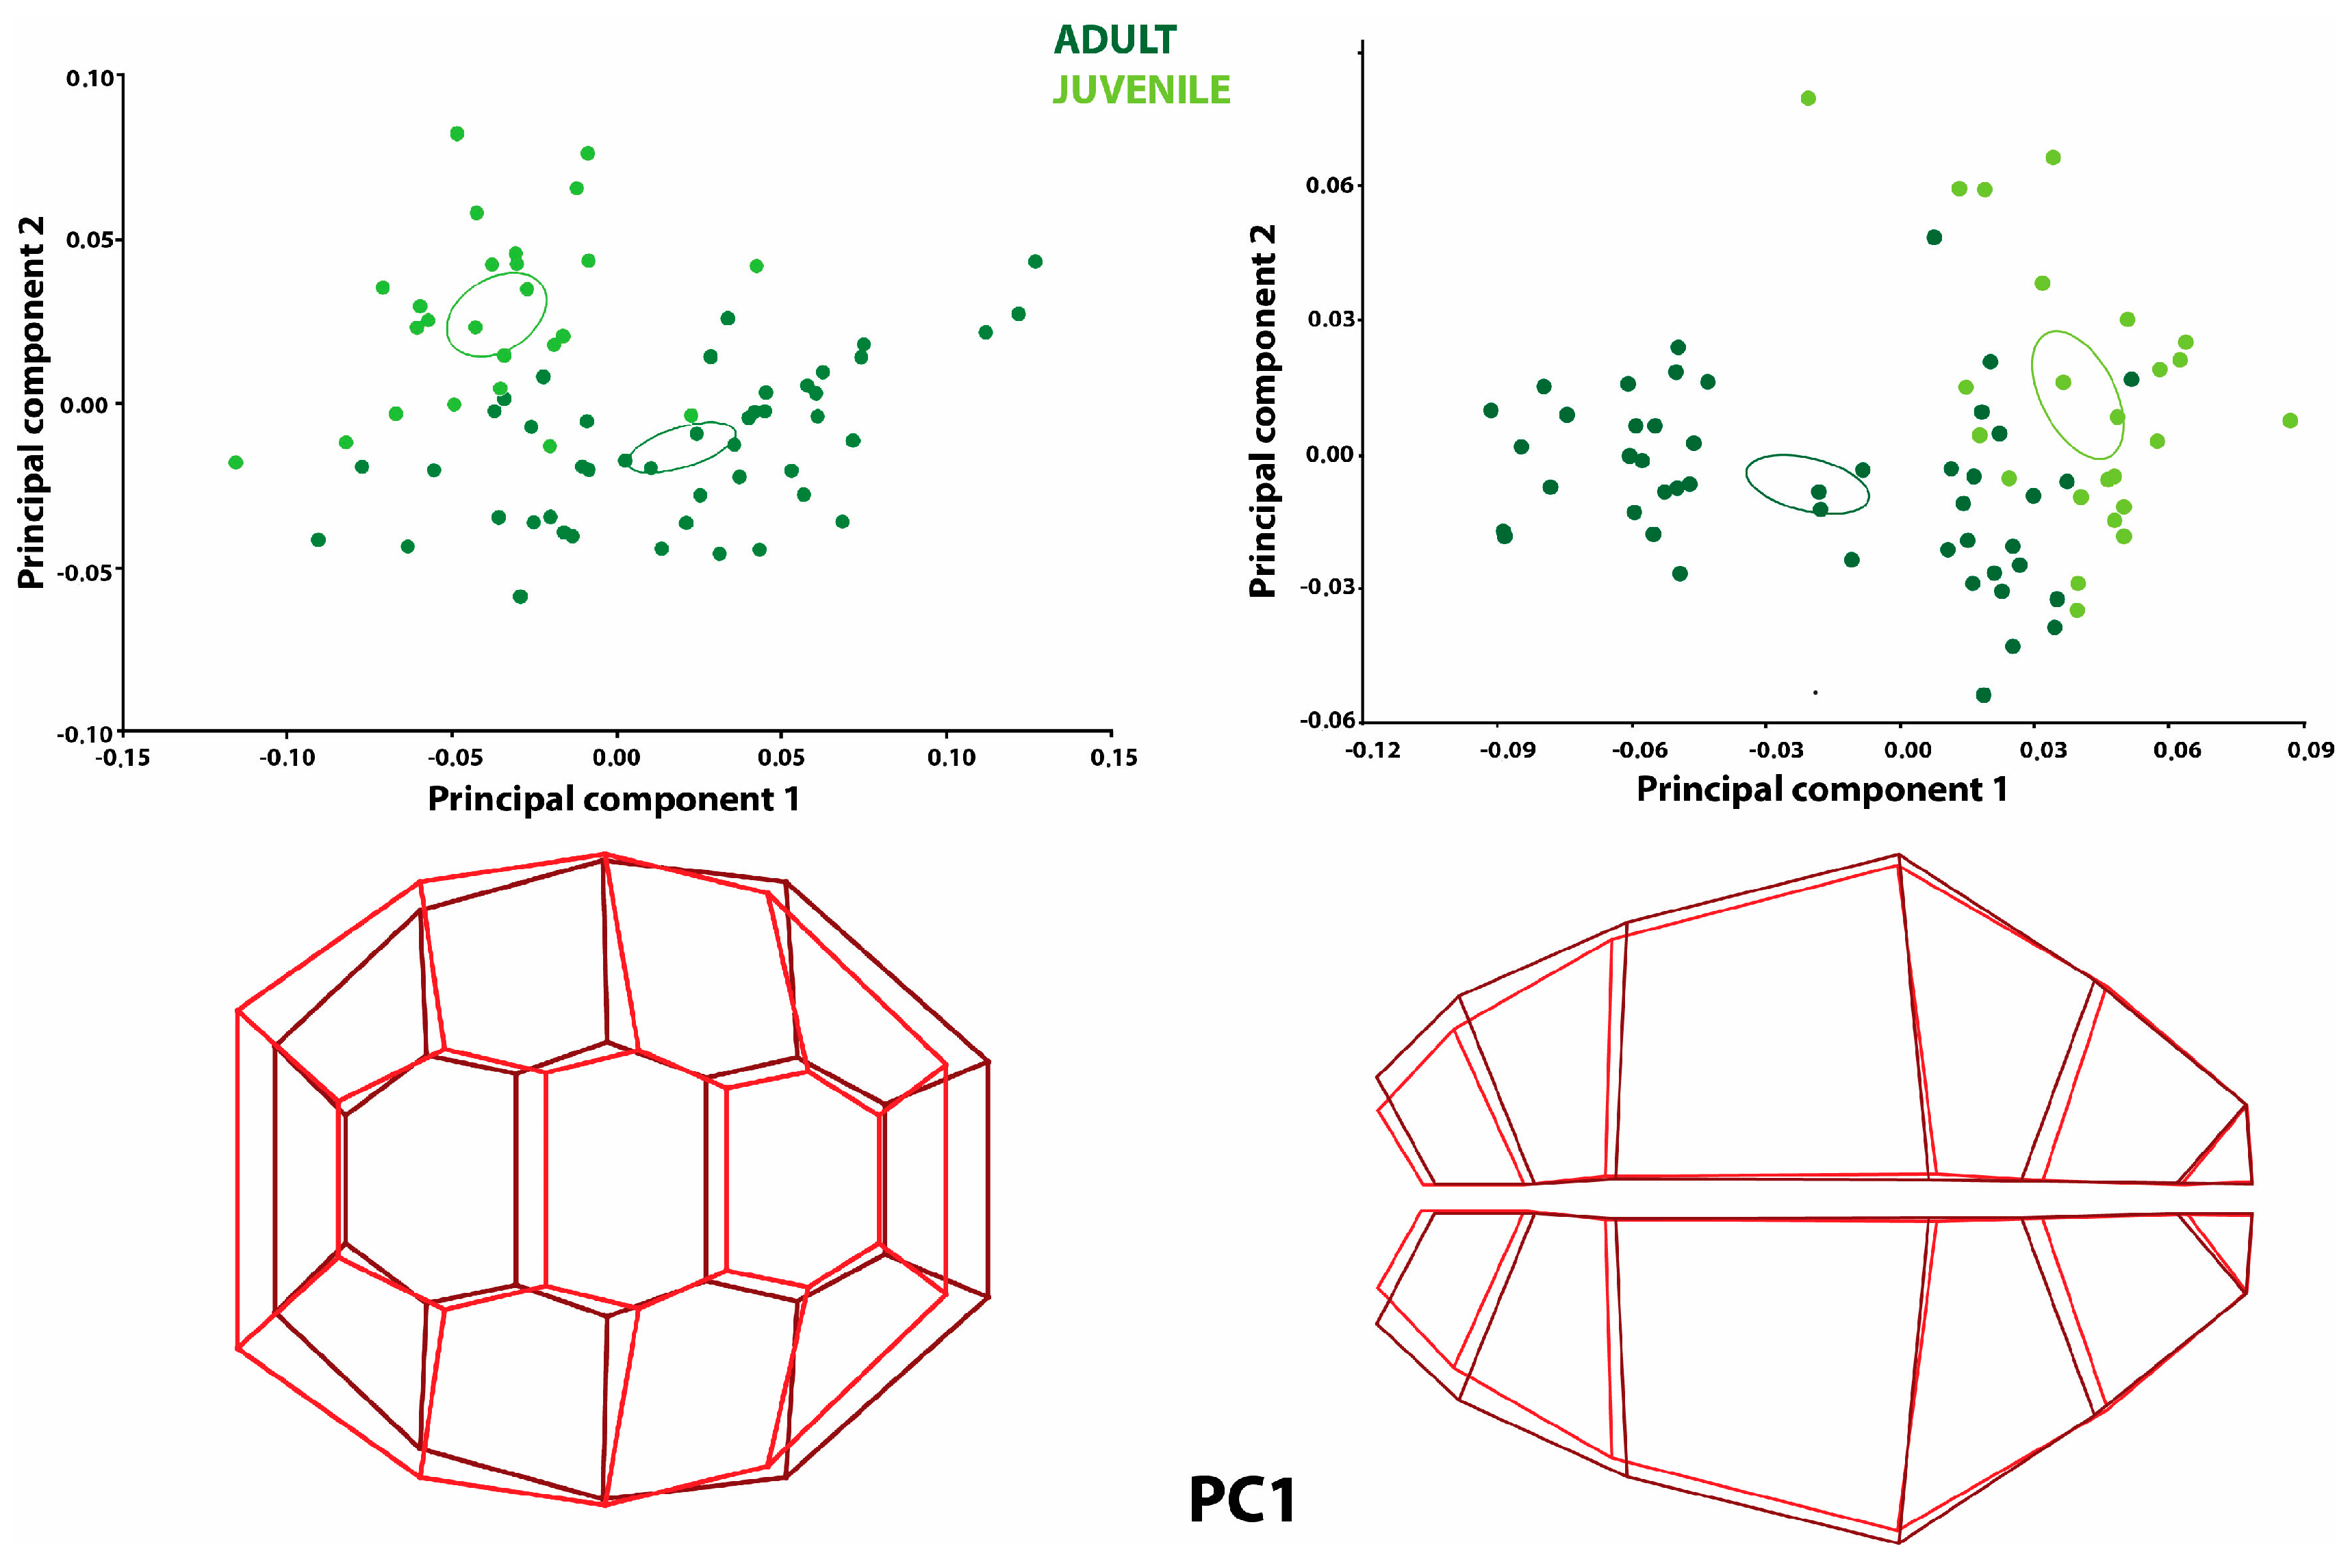
The principal component analysis (PCA) results for the directional asymmetry of the carapace revealed that 50.9% of the total variation was explained by PC1 and 18.3% was explained by PC2 (
Table 1). It was observed that the individuals representing the positive limit in PC1 were mostly adult turtles (
Figure 1). The shape variation at the positive limit for PC1 was more significant than the mean shape configuration of the caudal side of the dorsal carapace. The cranial side of the carapace was wider than the mean shape configuration but narrowed as it progressed to the center of the carapace compared to the mean shape configuration. The mid-shell was more expansive than the average shape configuration, similar to the cranial and caudal sides.
Differences were also observed in the plates of the carapace for directional asymmetry. The first neural and nuchal plates showed a narrower shape variation in the area compared to the mean shape configuration. The second neural plate was narrower compared to the mean shape configuration. The fourth neural plate was more expansive than the average shape configuration. Therefore, the third neural plate was displaced cranially, although it did not show a different shape variation. The first costal plate was narrower in area compared to the average shape configuration. The second and third costal plates were shorter in width but longer in length. It was observed that these plates extended towards the second and third neural plates (
Figure 1).
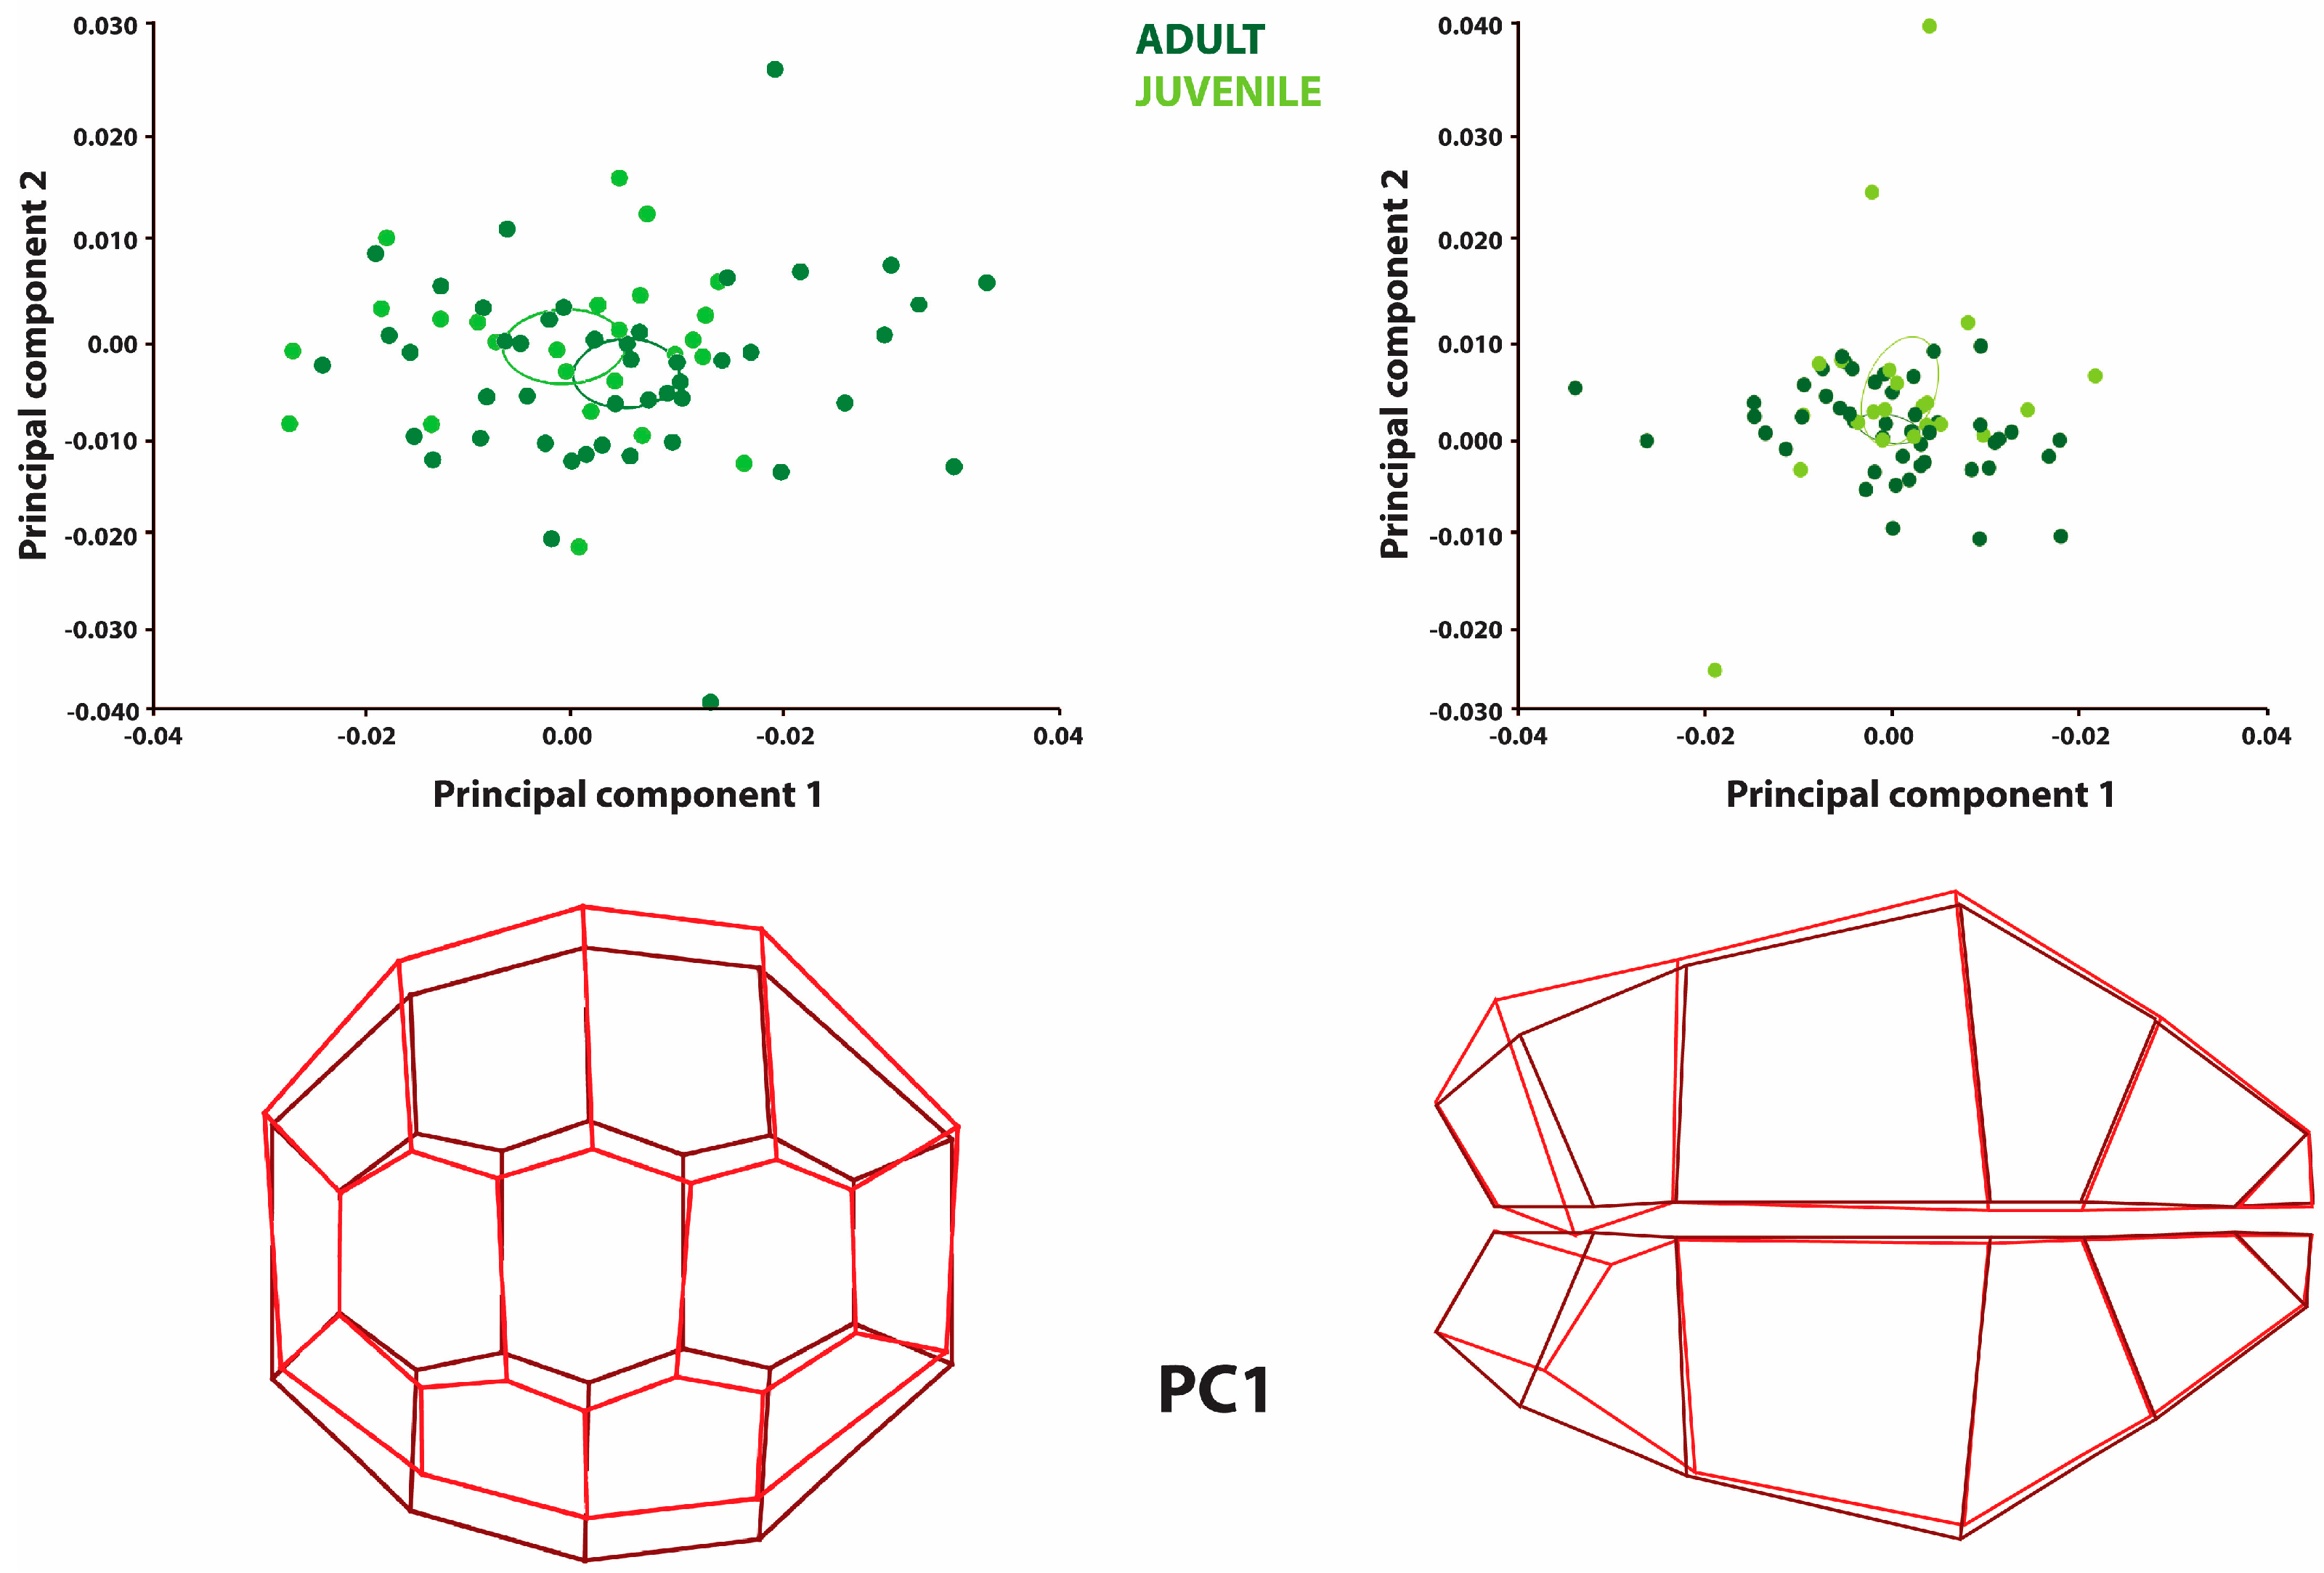
The principal component analysis (PCA) results for fluctuating asymmetry showed no difference between the groups (
Figure 2). Also, the results were not statistically significant (
Table 3). Nevertheless, PC1 explained 26.8% of the total variation, and PC2 explained 10.8% (
Table 1). In the shape variation of fluctuating asymmetry in the PC1 graph, the shape variation shown by the costal plates located in the sinister was more expansive than the average shape configuration. As the positive PC1 value increased, the costal plates situated on the dexter became narrower. The landmarks on the neural plates were located at different points compared to the mean shape configuration (
Figure 2).
In the MANOVA analysis of the carapace, the individual value for the symmetrical component was statistically significant (p < 0.0001). This supported the study’s other findings because directional asymmetry (DA) was statistically significant in different analyses.
As a result of the regression analyses for DA, the centroid size explained 5.97% of the shape variation (R2 = 0.0597). This relation was statistically significant (p = 0.0452). Although an effect of centroid size on the shape variation of the carapace was observed, this effect was not strong. The analysis for FA showed that size explained 3.99% of the shape variation (R2 = 0.0399). The result was not statistically significant (p > 0.05). As a result, the FA analysis revealed that centroid size has no significant effect on the shape variation of the carapace.
3.2. Plastron
Twenty-six landmarks were superimposed on the images taken from the plastron of the turtles. All the marks were paired with each other. This ensured that no error was made in the symmetry of the selected points (landmarks) after the program transferred them to the coordinate plane.
The results of the ANOVA revealed that the centroid size and shape variation were statistically significant (
Table 5 and
Table 6;
p < 0.0001). The difference between the averages was also analyzed in this study. According to these results, the Procrustes distance was 0.06. In addition, the T-square results, obtained to measure the difference between the means, were statistically significant (
p < 0.0001).
Principal component analysis (PCA) was applied to the samples. According to the results of this analysis, conclusions were made about the directional asymmetry and fluctuating asymmetry. When the directional asymmetry data in the plastron region were analyzed, PC1 explained 55.53% of the total variation, and PC2 explained 16.10% (
Table 2).
Figure 1 shows a significant narrowing in the caudal part of the plastron region for PC1. This was explained by the mean directional asymmetry of all offspring samples, which was higher than zero (
Figure 1; graphical plot). The directional asymmetry (DA) was also statistically significant according to the analysis (
Table 6).
According to the fluctuating asymmetry analysis, 30.60% of the total variation for the plastron was explained by PC1 and 14.88% was explained by PC2 (
Table 2). In the PC1 plot, the most prominent feature observed is the expansion of the left side and the narrowing of the right side in the caudal region of the animals. A constriction was observed on the right side of the animals. On the left side, an expansion proportional to the constriction was found. For both PC1 and PC2, adult and juvenile turtles showed a similar distribution (
Figure 2). The Side effect of directional asymmetry (DA) was statistically significant (
p < 0.0001;
Table 6). This indicates that deviations from symmetry and shape variation on both sides reflect directional asymmetry. In other words, shape differences between the right and left sides can be considered an indicator of directional asymmetry. The Side effect denotes directional asymmetry, and the Individual ∗ Side effect denotes fluctuating asymmetry. This result means that directional asymmetry is independent of individual differences and is only associated with a shape variation between both sides of symmetry. However, the Ind ∗ Side interaction was not statistically significant (
p = 0.9979;
Table 6). As a result, no statistically significant difference was observed for fluctuating asymmetry.
The results of the MANOVA analysis for the plastron revealed that the individual value of the symmetrical component was statistically significant (p < 0.0001), which is similar to the findings for the carapace. This supports the results of other analyses. Directional asymmetry (DA) was also found to be significant according to the results of different studies.
According to the results of the regression analysis for DA, the centroid size explained 19.10% of the shape variation (R2 = 0.190954). This relation was statistically significant (p = 0.0001). The findings showed that plastron shape variation was significantly affected by centroid size. Accordingly, it can be considered that centroid size contributes to changes in plastron morphology during the transition to adulthood. In the analysis for FA, size explained 5.07% of the shape variation (R2 = 0.0507), and this relation was statistically significant (p = 0.0188). The effect of centroid size on FA was not as strong as for DA, but its impact was still observed.
3.3. Sex-Based Fluctuating Asymmetry
Sex-based fluctuating asymmetry among adult specimens was also analyzed to elucidate the differences between the adult and juvenile individuals examined in this study. For this purpose, principal component analysis was applied to the samples (
Figure 3,
Table 7).
The PCA results indicated that PC1 accounted for 30% of the total variation in the carapace and 34% of the variation in the plastron. The individuals exhibited similar distribution patterns. The carapace’s left side was wider in male specimens, while the right side was narrower. A comparable pattern of shape variation was also noted in the plastron, where the right side exhibited more significant asymmetry, whereas the left side displayed more constrained variation.
Among adult individuals, the carapace asymmetry aligned with the shape variations observed when juvenile specimens were included. However, in the plastron, the asymmetry further supported the previously identified shape variation between adult and juvenile individuals, particularly in the caudal and epiplastron regions.
4. Discussion
This study used size and shape analyses to compare adult and juvenile groups regarding directional asymmetry and fluctuating asymmetry. Geometric morphometric methods are preferred in this respect [
31,
32]. These methods are particularly advantageous for quantifying morphological variations and have broad applications in evolutionary and developmental studies. Moreover, this developmental investigation demonstrates that they facilitate the assessment of how environmental factors influence asymmetry [
33,
34].
Fluctuating asymmetry refers to deviations from perfect bilateral symmetry and is often used to indicate developmental instability [
31,
35,
36]. It is influenced by genetic and environmental factors, making it a valuable tool for interpreting developmental imbalances [
34]. Statistically, FA encompasses all heterogeneous factors affecting symmetry [
35]. In contrast, directional asymmetry represents consistent, non-random differences between sides, eliminating inter-individual heterogeneity in FA through techniques such as mixture analysis [
37,
38].
The DA value for the carapace was statistically significant (
Table 4), indicating that as turtles mature, the dorsal carapace undergoes notable shape changes. Specifically, the carapace enlarges as turtles grow from juveniles to adults, consistent with findings from Ewing [
39]. This enlargement is likely linked to age-related developmental processes, reflecting stable directional trends.
Similarly, the DA value for the plastron was statistically significant, as revealed by ANOVA (
Table 6). This finding may be attributed to the unique developmental processes of the plastron. Earlier studies suggested the presence of cartilaginous tissue in the plastron, but recent histological analyses confirmed that its ossification occurs intramembranously, classifying it as a dermal, integumental, or exoskeletal structure [
40,
41,
42]. Periodic and seasonal factors, rather than age alone, may contribute to FA in such exoskeletal structures. Supporting this hypothesis, Kotegov demonstrated that FA in fish exoskeletons varied periodically with seasonal changes [
43].
The consistent detection of directional asymmetry (DA) in both the carapace (Side: SS = 0.002, F = 2.61,
p = 0.0143;
Table 4) and plastron (Side: SS = 0.002, F = 4.10,
p = 0.0005;
Table 6) underscores a systematic left–right shape divergence that transcends individual variation, as evidenced by its statistical significance across multiple analyses (e.g., MANOVA,
p < 0.0001). This DA, explaining 50.9% of carapace variation (PC1,
Table 1) and 55.53% of plastron variation (PC1,
Table 2), manifests as distinct morphological shifts—such as the wider cranial and mid-shell regions of the carapace and the narrowed caudal region of the plastron—suggesting an adaptive or developmental response to external pressures. The regression analyses further revealed that centroid size significantly influences DA, particularly in the plastron (R
2 = 0.190954,
p = 0.0001), where it accounts for 19.10% of the shape variation, compared to a weaker effect in the carapace (R
2 = 0.0597,
p = 0.0452). This disparity implies that size-related growth dynamics may have a more pronounced role in driving plastron asymmetry, potentially linked to ontogenetic transitions from juvenile to adult stages, as visualized in the PCA scatterplots (
Figure 1). These findings suggest that DA could serve as a reliable morphological marker for investigating biomechanical or ecological influences on turtle shell development, warranting further exploration into its functional consequences.
Anatomical analysis revealed that the cranial regions of animals with DA were more prominent, correlating with growth. Triangulation points in the cranial part of the plastron, located in the epiplastron region, showed significant developmental changes [
23]. The epiplastron region showed significant juvenile enlargement, likely linked to developmental growth during early stages. This finding is consistent with previous studies, where the broader epiplastron in juvenile turtles was attributed to growth toward peripheral ossification centers during juvenile development [
44].
The observed enlargement of the caudal region in adults compared to juveniles is likely associated with the onset of sexual maturity and growth patterns. This region remains smaller in juveniles, reflecting the developmental stages before sexual maturation [
45].
In contrast, the persistent absence of significant fluctuating asymmetry (FA) in both structures (carapace: Ind × Side, F = 0.41,
p = 0.9935; plastron: Ind × Side, F = 0.37,
p = 0.9979) highlights a high degree of developmental stability, despite PC1 explaining 26.8% and 30.6% of FA variation in the carapace and plastron, respectively (
Table 1 and
Table 2). The lack of statistical significance, even with the sex-based analysis showing subtle differences (e.g., wider left carapace in males,
Table 7), suggests that random deviations in symmetry are either biologically minimal or obscured by measurement error (Residual: carapace MS = 0.0001; plastron MS = 0.00007). This stability is notable given the significant individual variation (carapace: F = 881.6,
p < 0.0001; plastron: F = 98.64,
p < 0.0001), which dominates shape differences (97.05% and 97.47% of variance, respectively). The low error values from the ANOVA (
Table 3,
Table 4,
Table 5 and
Table 6) indicate methodological reliability, but the subtle FA signal (e.g., SS = 0.009 for carapace) remained below the detection threshold, possibly due to insufficient sample power or landmark resolution. These results contrast with the robustness of DA and suggest that while systematic asymmetry reflects consistent external or intrinsic drivers, random asymmetry may require enhanced precision—such as additional replicates or landmarks—to uncover potential stress-related signatures in this population.


 ,
, 

