Abstract
Butterflies are important biological indicators for assessing the environment and habitat quality. Dulongjiang in Yunnan, China, a global biodiversity hotspot, has undergone recent socioeconomic development, yet the impact of resultant land-use changes on its butterfly fauna remains poorly understood. This study conducted a systematic survey across three land-use types (forest, cropland, and construction land) over four months in 2024, employing area-time counts at 12 observatory sites. A total of 4805 individual specimens from 142 species, 88 genera, and 6 families were recorded. Nymphalidae dominated in species richness, while Pieridae was most abundant. Species rarefication curves indicated well-represented sampling. Diversity was significantly different between the four months, with a peak in June, when environment conditions are favourable. The forest harboured the least butterfly richness but higher evenness, while construction land showed the highest richness and lower evenness. Butterfly communities in three land-use types showed no significant differences, attributed to the fragmented topography in the area, which facilitates butterfly dispersal. Our findings reveal that butterfly diversity in Dulongjiang is influenced by a combination of seasonal climatic variations and land use.
1. Introduction
Butterflies are a commonly used insect group in biodiversity monitoring, and their diversity can reflect the insect diversity of specific regions [1,2]. Butterflies exhibit high sensitivity to changes in habitat vegetation and micro-environment, with species assemblage and population size responding rapidly to variations in habitat quality. Hence, they play a significant role in monitoring environmental change [3]. In the 1950s, a few European countries began using butterflies for environmental monitoring, assessing habitat quality based on their population dynamics [4]. To date, butterfly monitoring remains an important approach in research involving global environmental change [5,6,7,8,9].
Dulongjiang is located in northwestern Yunnan and forms a key part of the northern section of the Gaoligongshan Nature Reserve, situated in the heart of the Hengduan Mountains. Owing to its unique geographical location and climatic conditions, Dulongjiang supports a rich and diverse assemblage of flora and fauna, forming a biodiversity pattern characterised by the “convergence of northern and southern species with transitions from east to west” [10,11,12]. This area is recognised as one of the global biodiversity hotspots [13,14].
In recent years, socioeconomic development in Dulongjiang has accelerated [15,16]. However, accompanying land-use expansion and resource exploitation have posed disturbances and threats to local biodiversity. Although several studies have surveyed and analysed butterflies in Dulongjiang as well as other parts of the Nujiang prefecture [11,17,18,19,20,21], most have focused on taxonomy and species assemblage, without exploring the relationship between butterfly diversity and land use. Although a national butterfly monitoring scheme was launched in China in 2016, covering 128 counties and municipalities [22], systematic butterfly monitoring has not yet been conducted in Dulongjiang due to its remote location and limited transportation accessibility.
To address this gap, this study conducted fixed-point butterfly monitoring over four consecutive months to investigate butterfly community biodiversity across different land-use types in the valley part of Dulongjiang. The study aims to elucidate the relationship between different types of land use and butterfly diversity. The findings can reveal the impact of different types of land use on butterfly diversity and provide a scientific basis for environmental conservation and biodiversity protection.
2. Materials and Methods
2.1. Study Area
The valley part of Dulongjiang extends in a north–south orientation, running longitudinally between the Gaoligong Mountains and the Dandanglika Mountains, forming a topographically enclosed area known as “two parallel mountain ranges with one river running through”. The terrain slopes from north to south, with elevations ranging from 1127 to 2100 m [23]. Influenced by moisture monsoon inputs from the Indian Ocean and the geographical barrier of the Tibetan Plateau, the area exhibits a distinct maritime climate with a mean annual temperature of ~23 °C. Precipitation is abundant, with average annual rainfall ranging from 3200 to 4800 mm [24,25,26]. Six administrative villages, including Maku, Bapo, Kongdang, Xianjiudang, Dizhengdang, and Longyuan, are distributed along the valley (Figure 1). Owing to the relatively level topography and favourable climatic conditions, the valley part has become the core zone for agriculture, settlement, and transportation within the area. Consequently, it is more affected by human activities compared to other parts of the area [27,28].
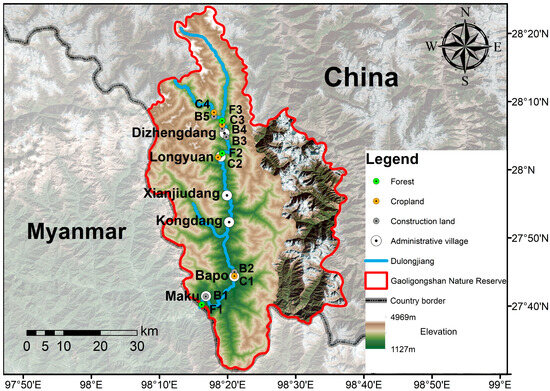
Figure 1.
Topology and distribution of observatory sites in the valley part of Dulongjiang; the land-use type of each site is marked by different colours.
2.2. Observatory Site Selection
This study investigated the land use in the valley part of Dulongjiang based on 10-metre resolution remote sensing images from 2023 and the “Current Land Use Classification” (GB/T 21010—2017) [29]. The results shows that the area is dominated by forest and water bodies, with grassland having been converted to cropland. Considering topographic constraints and the influence of human activities, and in accordance with the principles of representativeness and accessibility, three types of land use—forest (F), cropland (C), and construction land (B)—were selected in this study. Three to five representative observatory sites were established for each type, covering environmental factors such as vegetation type, elevational gradient, and degree of anthropogenic disturbance [30].
A total of 12 observatory sites were established in this study (Figure 1 and Figure 2; Table 1), with elevations ranging from 1141 to 2015 m, encompassing different habitats, from valley lowlands to medium-mountain areas. The lowest site is Hapang Waterfall (98.27° E, 27.67° N), and the highest site is Kelaoluo (98.30° E, 28.14° N). Due to the extreme safety risks posed by the cliffside canyon topography, the section between Bapo and Longyuan was deemed unsuitable for observation. Similarly, the villages of Kongdang and Xianjiudang were excluded owing to intense anthropogenic disturbance and topographic constraints. The distance between the two sites in the same administrative village ranged from 1.1 to 2.4 km.
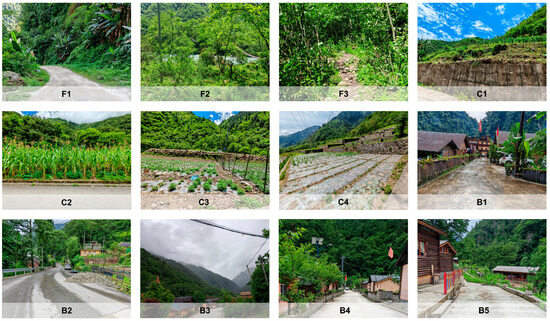
Figure 2.
Habitat photographs of all observatory sites: F1 to F3 are forest, C1 to C4 are cropland, and B1 to B5 are construction land. Detailed information of these observatory sites is listed in Table 1.

Table 1.
Information of the observatory sites in this study.
2.3. Field Observation and Species Identification
Owing to the fragmented land use in the valley, this study employed the area-time counts method to conduct butterfly diversity monitoring [31,32]. This approach is more suitable than traditional transect methods (Pollard walk) for fragmented habitats and effectively improves the coverage and data accuracy of butterfly diversity surveys.
The monitoring protocol was developed from the “Technical Guidelines for Biodiversity Monitoring—Butterflies” (HJ 710.9—2014) [33] and adapted to the habitat conditions of the valley. Taking into account the topography of the 12 sample points, an observation area with an 80 m radius centred on each site was defined. The code of each observatory site and land use were recorded, with its coordinates determined using a GPS device.
The monitoring was conducted from May to August, when butterfly richness is highest, on clear (≥13 °C) or partly cloudy (≥17 °C) days, avoiding rainy periods and high temperatures over 35 °C. Due to the frequent rain and rapid temperature increases in the valley, monitoring on clear days was conducted from 9:00 to 13:00 (GMT +0800), and extended until 17:00 (GMT +0800) on partly cloudy days. Each site was monitored for 3 h per day, with all 12 observatory sites monitored monthly. Two rounds of monitoring were conducted approximately 25 d apart, resulting in a total of four rounds.
Observers moved slowly and circuitously within the site range, recording all butterfly individual specimens observed. To avoid double-counting, wing marking and spatial location recording were applied. Captured butterflies were marked with a Sharpie oil marker pen, and the precise location and behaviour of each individual at first sighting were documented in detail. When large numbers of individual specimens were encountered, estimated counts with photographic assistance were adopted. Butterflies were primarily identified in the field and immediately released, while individual specimens that could not be identified on site were collected and identified in the laboratory.
Butterflies were classified according to the latest seven-family classification system (family Hedylidae is endemic to South America, and there are six families in China) [34], with reference to “An Illustrated Checklist of Butterflies of Yunnan” [35], “The Life History of Chinese Butterflies” [36], and “Butterflies of China” [37] for identification. For specimens with identification difficulties, the inventory of butterflies in the Dulongjiang area published by Huang [11] was referenced.
2.4. Data Analysis
2.4.1. Sampling Completeness Assessment
The sampling completeness is an important criterion in ecological research, used to characterise the dynamic relationship between sample size and species richness. Species accumulation curves and the Hill numbers are two commonly used methods to evaluate the rate of new species appearance during continuous sampling and extrapolate from sample data to predict species richness and abundance [38,39]; they are widely adopted in studies on butterfly diversity [40,41,42,43].
In this study, the sampling completeness was assessed using the Hill numbers (q). When q = 0, it focuses only on the presence of species, counting species equally without considering their abundance [44]. The result was visualised into rarefication curves for butterfly families, months, and land-use types, with 200 bootstrap replications and 95% confidence intervals (CIs), using the package iNEXT [45] in R 4.5.1 (accessed 15 October 2025).
2.4.2. Diversity Indices
Community diversity reflects significant differences in the composition, structure, function, and dynamics of biological communities. The study incorporates five core diversity indices [46,47,48], namely (1) species abundance, (2) the Shannon diversity Index (H′) and the subsequent taxon diversity indices [49], (3) the Pielou evenness Index (J’) [50], (4) the Simpson dominance index (D) [51], and (5) the Margalef species richness index (R) [52], to measure the diversity of butterflies. Calculations of the above-mentioned indices were performed in Microsoft Office Excel and PAST 4.17 [53]. For the Shannon diversity index and the Simpson dominance index between four months and three types of land use, the Hills numbers (q = 1 and 2, respectively) were also applied for testing and were visualised into rarefication curves with 200 bootstrap replications and 95% confidence intervals (CIs) using the package iNEXT [45] in R 4.5.1 (accessed 15 October 2025).
Community similarity reflects the degree of structural resemblance between different biological communities, typically quantified using a coefficient of similarity [54]. The Jaccard similarity coefficient (I) [55,56,57] was employed to evaluate the similarity among butterfly communities between different months and types of land use. In practice, a value of I between 0 and 0.25 indicates dissimilarity; values between 0.25 and 0.50 indicate moderate dissimilarity; values between 0.50 and 0.75 indicate moderate similarity; and values between 0.75 and 1.00 indicate high similarity [58,59]. The heatmaps were generated using the pheatmap 1.0.12 package [60] in R 4.5.1 (accessed 15 October 2025) to show similarity coefficients, and Venn diagrams were generated with a web-based tool (https://www.bioinformatics.com.cn/; accessed 15 October 2025) to show the number and percentage of distinct and shared species between different months and types of land use.
To test statistical differences between butterfly assemblages between different months and types of land use, the present study applied the Analysis of Variance (ANOVA) in Microsoft Office Excel to evaluate the difference between butterfly communities recorded from four observation months and three types of land use in the valley part of Dulongjiang. In addition, the ANOSIM and PERMANOVA analyses were further applied to detect the statistical differences between butterfly communities between the four survey months and three types of land use in PAST 4.17.
3. Results
3.1. Sampling Effort
The species rarefication curves generated from our observatory data from all three types of land use indicate that the curves approach the asymptote (Figure 3). The actual species richness for forest, cropland, and construction land was 97, 95, and 109, while that for all three types of land use was 142. The estimated species richness for forest, cropland, and construction land was 102.1, 107.0, and 123.6, respectively, while that for all three types of land use was 156.3.
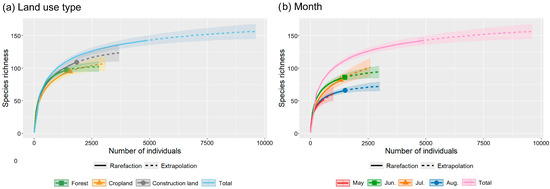
Figure 3.
Estimated species richness in the valley part of Dulongjiang in different land-use types (a) and months (b) through a sparse (solid curve), extrapolated (dashed curve) and corresponding 95% confidence interval (shaded area) analysis based on the integrity of sample collection coverage.
In terms of sampling effort, the actual number of total observed species richness (142) consists of 90.9% of the total estimated species richness, while that in each type of land use consists of 95.0%, 88.9%, and 88.2% of the estimated species richness. This extent of coverage indicates that the observed data from the selected observatory sites adequately represent the current butterfly species in the area.
3.2. Species Assemblage and Diversity
A total of 4805 butterfly specimens were recorded from all sites in the valley part of Dulongjiang, representing 142 species from 88 genera and 6 families (Table S1). The community was dominated by Nymphalidae, which accounted for 50.0% of species (71 species from 40 genera) and 31.6% of total abundance. Lycaenidae were represented by 20 species (14.1% of species) from 16 genera, followed by Papilionidae with 18 species (8.5%) across 7 genera. Hesperiidae included 15 species (10.6%) from 14 genera, while Pieridae comprised 14 species (9.9%) within 9 genera. Riodinidae constituted the smallest proportion, with only four species (2.8%) belonging to two genera (Figure 4).

Figure 4.
The number of butterfly genera and species (a) and the number of individual specimens (b) in the valley part of Dulongjiang.
At the genus level, Nymphalidae showed the highest diversity (45.5% of all genera), followed by Lycaenidae (18.2%), Hesperiidae (15.9%), Pieridae (10.2%), Papilionidae (8.0%), and Riodinidae (2.3%). The most species-rich genera were Neptis (8 species), Papilio (7), Lethe (5), and Parantica (5). Genera such as Byasa, Pieris, Neope, Athyma, and Parasarpa contained four species each, while Delias, Calinaga, Dodona, and Heliophorus were represented by three species. Ten genera contained two species, and 65 were monotypic, reflecting relatively low genus-level diversity but high species-level diversity.
Four species were particularly abundant, each represented by more than 240 individual specimens: Pieris canidia (624), P. erutae (683), Parantica sita (240), and Heliophorus eventa (488). Together, these four species accounted for only 4.8% of the total species richness but 42.4% of total abundance. Pieridae was the most abundant family (34.2% of individual specimens), followed by Nymphalidae (31.6%), Lycaenidae (21.3%), Papilionidae (9.2%), Hesperiidae (3.9%), and Riodinidae (0.4%). Beyond the dominant species, 16 were classified as common (relative abundance 1–5%), including Ochlodes subhyalina, Papilio helenus, and P. bianor; 17 as less common (0.5–1%), such as Sovia fangi, Byasa polyeuctes, and B. latreillei; and 105 as rare (<0.5%), including Lobocla bifasciata, L. liliana, and Celaenorrhinus tibetana.
The overall genus-species ratio was 0.62. Lower ratios were observed in Papilionidae (0.39), Nymphalidae (0.56), and Riodinidae (0.50), indicating higher species richness per genus, while higher ratios in Hesperiidae (0.93), Pieridae (0.64), and Lycaenidae (0.8000) suggested more complex generic structures (Figure 4a).
The family Nymphalidae demonstrated a remarkable diversity (Shannon diversity and Margalef richness) among butterfly taxa, ranking the highest across all metrics examined (Figure 5a,d). In contrast, the Simpson dominance index was lowest in Nymphalidae (Figure 5c), reflecting a relatively even distribution of species within the family. Population sizes across species were comparatively balanced. This stands in sharp contrast to Pieridae, which showed the highest Simpson dominance index (Figure 5c), largely due to the overwhelming abundance of two dominant species, P. canidia and P. erutae. The highest Pielou evenness index was observed in Riodinidae (Figure 5b), which can be attributed to the relatively low number of species and individual specimens recorded within the study area, coupled with their uniform distribution.
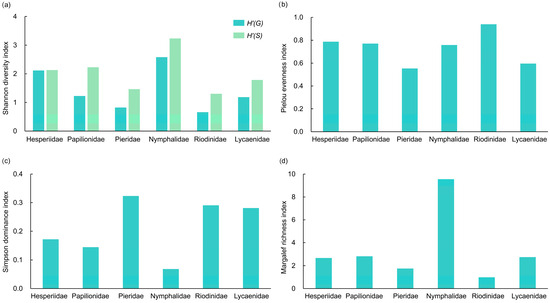
Figure 5.
Diversity indices of different butterfly families in the valley part of Dulongjiang; (a) Shannon diversity index, where H’(G) denotes genus level and H’(S) denotes species level; (b) Pielou evenness index; (c) Simpson dominance index; and (d) Margalef richness index.
3.3. Variation with Months
Our analysis revealed a clear monthly shift in family dominance from all sites, with Nymphalidae comprising the largest proportion of individual specimens in May, while Pieridae dominated in subsequent months. Dominant species also varied temporally: in May, Pieris canidia, Calinaga buddha, Parantica sita, Heliophorus androcles, and H. eventa collectively represented over 5% of total abundance; in June, Delias belladonna, P. canidia, P. erutae, P. sita, and Lampides boeticus were predominant; in July, the dominant species were P. canidia, P. erutae, Parantica swinhoei, and H. eventa; and in August, they were P. canidia, P. erutae, Ypthima confusa, and H. eventa. Together, Nymphalidae and Pieridae constituted a substantial portion of the butterfly community throughout the study period (Figure 6).
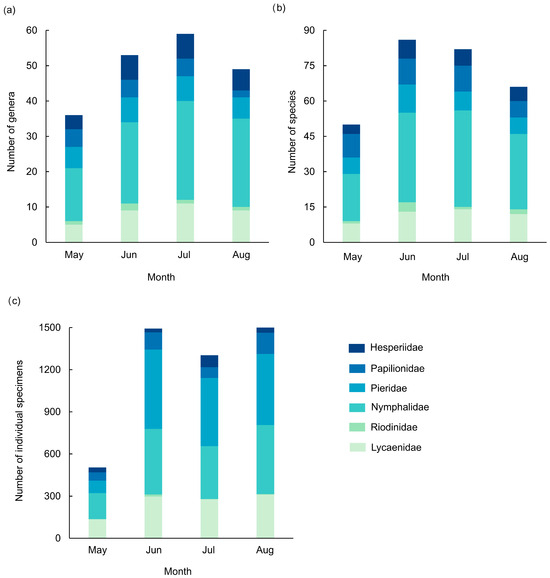
Figure 6.
Species assemblage of butterfly communities in different months in the valley part of Dulongjiang; (a) the number of genera, (b) the number of species, and (c) the number of individual specimens.
Taxonomic richness across all six families followed a unimodal pattern, peaking at 59 genera in July and 86 species in June. Total abundance increased steadily, reaching a maximum of 1505 individual specimens in August. Among the families, Hesperiidae showed an initial increase followed by a decline in genera and species, with the abundance highest in July. Papilionidae maintained stable genus and species counts from May to July but declined markedly in August. Pieridae exhibited consistent genus and species distribution across months, though abundance fluctuated significantly due to population outbreaks of P. canidia and P. erutae after May; these two species accounted for 69.0%, 78.4%, and 91.7% of Pieridae abundance in June, July, and August, respectively. Nymphalidae displayed notable spatiotemporal variation, likely attributable to their high species richness and ecological adaptability. Riodinidae consistently had the lowest genus count, species richness, and abundance, never exceeding 1% of monthly totals and peaking in June. Lycaenidae and Hesperiidae exhibited similar monthly trends, with genera and species peaking in July (11 genera and 14 species) and abundance highest in August. H. androcles and H. eventa remained abundant throughout all months.
The Shannon diversity indices were highest in June at the family, genus, and species levels (Figure 7a and Figure 8). The Pielou evenness remained stable across months (0.734–0.794) (Figure 7b and Figure 8), indicating consistent species distribution uniformity, while low Simpson dominance values (0.056–0.087) reflected the absence of strongly dominant species (Figure 7c and Figure 8). The Margalef richness ranged from 7.875 to 11.630, also peaking in June (Figure 7d and Figure 8).
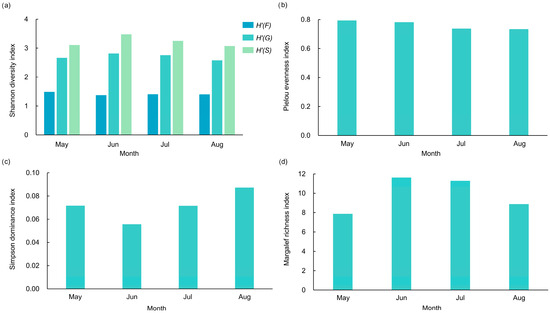
Figure 7.
Diversity indices of butterfly communities in different months in the valley part of Dulongjiang; (a) Shannon diversity index, where H’(F) denotes family level, H’(G) denotes genus level, and H’(S) denotes species level; (b) Pielou evenness index; (c) Simpson dominance index; and (d) Margalef richness index.
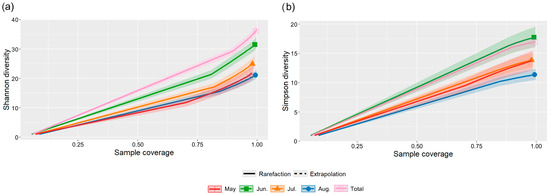
Figure 8.
Rarefication curves of (a) Shannon diversity index and (b) Simpson diversity index of butterfly communities in different months in the valley part of Dulongjiang, through a sparse (solid curve), extrapolated (dashed curve), and corresponding 95% confidence interval (shaded area) analysis based on the integrity of sample collection coverage.
Inter-month similarity was moderate, with the similarity coefficient ranging between 0.294 and 0.451 and the number of shared species ranging between 29 and 46 (Figure 9). The highest similarity was observed between July and August and the lowest between May and July. Although the ANOVA did not detect significant difference between butterfly communities over these four months (Table 2), the ANOSIM and PERMANOVA analyses flagged significant difference between butterfly communities over the four months (Table 3). These results showed that butterfly assemblages are influenced by month.
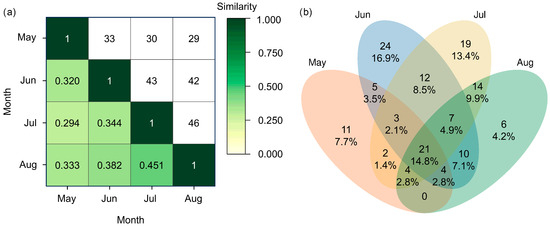
Figure 9.
Similarity of butterfly communities under different months in the valley part of Dulongjiang. (a) Heatmap of similarity: the values below the diagonal are the Jaccard similarity index between different types of land use, while those above the diagonal are the number of shared species between different months. (b) Venn diagram showing the number and percentage of distinct and shared species.

Table 2.
The ANOVA analysis of difference in butterfly assemblages for four observatory months in the valley part of Dulongjiang.

Table 3.
The ANOSIM and PERMANOVA analyses of difference in butterfly assemblages for four survey months in the valley part of Dulongjiang.
3.4. Variation with Land Use
Butterfly assemblages across three land use types—forest, cropland, and construction land—exhibited distinct yet overlapping characteristics. A total of 1411 individual specimens (97 species, 63 genera, 6 families) were recorded in forest land, 1550 individual specimens (95 species, 67 genera, 6 families) in cropland, and 1844 individual specimens (109 species, 71 genera, 6 families) in construction land. Nymphalidae consistently showed the highest genus and species richness across all habitats, though abundance was highest in forests (37.9%). Pieridae dominated in cropland (39.0%) and construction land (37.5%). Lycaenidae consistently ranked second in taxonomic richness. The overall family-level richness decreased in all land-use types following the order Pieridae > Nymphalidae > Lycaenidae > Papilionidae > Hesperiidae > Riodinidae (Figure 10).
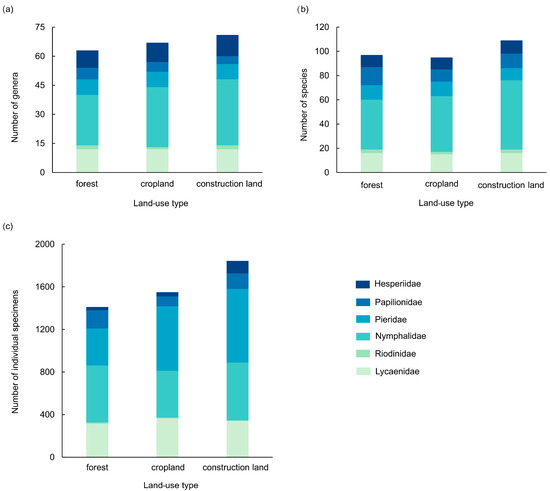
Figure 10.
Species assemblage of butterfly communities under different type of land use in the valley part of Dulongjiang; (a) the number of genera, (b) the number of species, and (c) the number of individual specimens.
The Shannon diversity indices further illustrated these patterns: forest land scored highest in species diversity (3.604) and the Pielou evenness (0.788), while construction land showed the highest genus diversity (2.942) and Margalef richness (14.360). Cropland had the highest Simpson dominance value (0.072), indicating less even species distribution (Figure 11 and Figure 12).
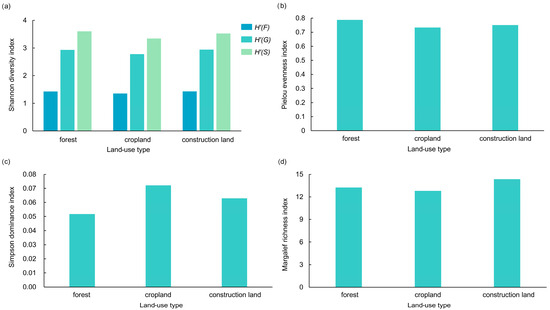
Figure 11.
Diversity of butterfly communities under different types of land use in the valley part of Dulongjiang; (a) Shannon diversity index, where H’(F) denotes family level, H’(G) denotes genus level, and H’(S) denotes species level; (b) Pielou evenness index; (c) Simpson dominance index; and (d) Margalef richness index.
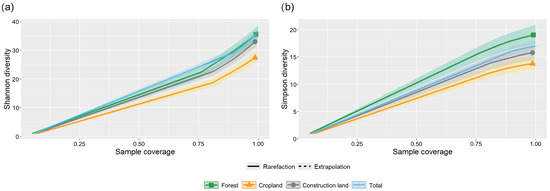
Figure 12.
Rarefication curves of (a) Shannon diversity index and (b) Simpson diversity index of butterfly communities in different types of land use in the valley part of Dulongjiang, through a sparse (solid curve), extrapolated (dashed curve), and corresponding 95% confidence interval (shaded area) analysis based on the integrity of sample collection coverage.
Community similarity between the three types of land use was moderate, with similarity coefficients ranging between 0.524 and 0.609 and the number of shared species ranging between 66 and 78 (Figure 13), with the highest similarity observed between forest and construction land and the lowest between forest and cropland. The ANOVA did not detect significant difference between butterfly communities under the three types of land use (Table 4). Both the ANOSIM and PERMANOVA analyses did not detect significant difference between butterfly communities under the three types of land use (Table 5). These results suggest that although butterfly assemblages are influenced by land use, the difference between the three types of land use is still insignificant in a statistical view.
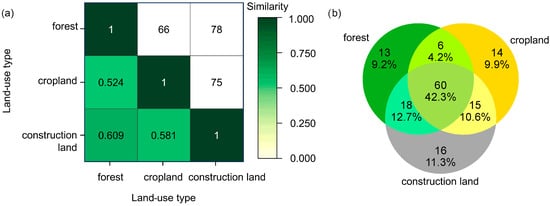
Figure 13.
Similarity of butterfly communities under different types of land use in the valley part of Dulongjiang: (a) the heatmap of similarity—the values below the diagonal are the Jaccard similarity index between different types of land use, while those above the diagonal are the number of shared species between different types of land use; (b) the Venn diagram showing the number and percentage of distinct and shared species.

Table 4.
The ANOVA analysis of difference in butterfly assemblages for the three types of land use in the valley part of Dulongjiang.

Table 5.
The ANOSIM and PERMANOVA analyses of difference in butterfly assemblages for the three types of land use in the valley part of Dulongjiang.
4. Discussion
4.1. Species Assemblage and Diversity
Species rarefication curves (Figure 3) indicate that although the current survey captured a relatively comprehensive record of species, none of the land-use types reached saturation, suggesting the presence of additional undocumented species. Forest land exhibited the highest potential for species discovery, followed by construction land and cropland. Future studies could increase sampling efforts to obtain a more complete inventory of butterfly species in the valley.
This study compared existing records of butterfly species in the Gaoligong Mountains, documenting 516 species from previous research [11,17,18,19,20,21,37,61,62]. Combined with field surveys, 43 species were newly recorded, increasing the total known butterfly species in Gaoligongshan Nature Reserve to 559, belonging to 202 genera across 6 families (Table S1).
Nymphalidae dominated the butterfly community in the valley, due to their large number of species, broad host plant range, strong dispersal capacity, and high ecological adaptability [36,63,64,65]. Notably, although Nymphalidae ranked highest in genus- and species-level diversity, as well as richness indices, they exhibited the lowest dominance index, indicating a balanced distribution among species without monopolisation by any single taxon. In contrast, Pieridae showed the highest dominance index, largely due to the overwhelming abundance of Pieris canidia and P. erutae (Figure 4 and Figure 5). The highest evenness was observed in Riodinidae, likely due to their low richness in the Oriental Region [66,67] and relatively uniform distribution across the valley.
In the meantime, it must be noted that the survey method used in this study cannot effectively sample the canopy dwellers in the forests; species in tribe Theclini (Lycaenidae) and genera Limenitis and Apatura (family Nymphalidae) are representatives of the forest canopy in Dulongjiang. Future study must investigate this part of species richness using more sophisticated methods.
4.2. Diversity Variation with Months and Land Use
Butterfly community structure stabilised beginning in June (Figure 6 and Figure 7). Relatively low temperatures, limited floral resources, and nectar availability in May likely extended overwintering periods for many species, resulting in low diversity in that period. With warming temperatures and increased resource availability in June, conditions became more favourable, supporting a noticeable rise in both species richness and abundance.
Monthly variations in community structure were likely influenced by climatic factors affecting vegetation composition and resource availability. Differences between months were statistically significant (Figure 8 and Figure 9; Table 3), with species richness peaking in June. Suitable temperatures, abundant rainfall, and flourishing vegetation in June provide ample nectar and host resources, supporting higher butterfly activity. Yi et al. [21] reported the highest richness and diversity of butterflies in autumn in the southern section of the Gaoligong Mountains. Due to latitudinal and topological differences between the northern (Dulongjiang) and southern sections of this mountain range, our results are not comparable with those in this previous study.
Forest land supporting the highest butterfly richness is a phenomenon reported from studies across the tropics [68,69,70,71,72]. However, our study showed a contrasting result, with forests harbouring the least richness and higher evenness, without strongly dominant species (Figure 10 and Figure 11), mainly due to the vertical stratification of diversity in the forest ecosystem [73,74], where canopy dwellers are rarely sampled using the adopted method. Research has revealed that this diversity pattern does not change much over time and is able to withstand small-scale disturbance [75]. Construction land showed the highest richness but lower evenness and dominance (Figure 10 and Figure 11), possibly due to its proximity to forest habitats and strong dispersal ability of butterflies in the valley area. Cropland had medium richness, the lowest evenness, and the highest dominance among the three types of land use (Figure 10 and Figure 11), mostly due to its attraction to certain species of butterflies affiliated to the host and nectar-source plants (Table 1).
High similarity in species composition across land-use types—as indicated by similarity analysis (Figure 13; Table 4 and Table 5)—may be attributed to distinct mountain-valley topography plus fragmented habitat distribution. Much of the cropland and construction land is adjacent to forest patches, facilitating cross-habitat movement by butterflies. This finding aligns with that reported from forestland, tea horticulture, and vegetable gardens by Peng et al. [76] and Iserhard et al. [77] but contrasts with that of Yang et al. [78] and Cai et al. [79]. Butterflies also possess an ability to compensate for certain habitat disturbances in the tropics, such as canopy opening [80]. The extent of habitat fragmentation in the valley part of Dulongjiang might enhance connectivity between different types of land use, leading to homogeneous community structures across the landscape, which could facilitate the movement of butterflies across habitats. This does not necessarily mean that habitat fragmentation can be interpreted as a beneficial factor in this region, especially when quantification research across the region is still absent.
5. Conclusions
This study provides a comprehensive analysis of butterfly diversity in the valley area of Dulongjiang, highlighting the relationships among land-use type, seasonal variation, and butterfly community structure. The valley harbours a rich butterfly assemblage, with Nymphalidae and Pieridae being the predominant families. Forest land supported the lowest levels of species richness but higher evenness, while construction land contributed significantly to species richness, likely due to its proximity to natural forest patches and the high mobility of butterflies. Temporal dynamics showed a clear peak in diversity and abundance in June, driven by favourable climatic conditions and resource availability. The similar species composition across different land-use types suggests that the mosaic of habitats within the valley maintains provide functional connectivity for butterfly populations.
Supplementary Materials
The following supporting information can be downloaded at: https://www.mdpi.com/article/10.3390/d17110771/s1, The species inventory data are openly available in Table S1.
Author Contributions
Conceptualization, S.-J.H., W.-L.W., and Y.-T.L.; methodology, S.-J.H. and Y.-T.L.; formal analysis, Y.-T.L., Y.P., Y.-F.W., Y.-W.S., B.-B.X., and H.-L.T.; investigation, Y.-T.L., Y.P., Y.-F.W., Y.-W.S., B.-B.X., and H.-L.T.; resources, S.-J.H. and W.-L.W.; data curation, Y.-T.L., Y.P., Y.-F.W., Y.-W.S., B.-B.X., and H.-L.T.; writing—original draft preparation, Y.-T.L. and S.-J.H.; writing—review and editing, S.-J.H. and W.-L.W.; visualization, Y.-T.L., Y.P., Y.-F.W., Y.-W.S., B.-B.X., and H.-L.T.; supervision, S.-J.H. and W.-L.W.; project administration, S.-J.H. and W.-L.W.; funding acquisition, S.-J.H. and W.-L.W. All authors have read and agreed to the published version of the manuscript.
Funding
This research was funded by the Academician (Expert) Working Station of the Yunnan Province Science and Technology Department (202305AF150037), the Postgraduate Joint Training Base Project for the Integration of Industry and Education of Yunnan University, and the Biodiversity Conservation Programme of the Ministry of Ecology and Environment, China (China-BON Butterflies) (SDZXWJZ01013).
Institutional Review Board Statement
Ethical review and approval were waived for this study as the limited number of butterfly species collected are not protected by Wildlife Laws in China or by CITES.
Data Availability Statement
Species inventory data are openly available in the Supplementary Materials.
Acknowledgments
The authors also thank Adam M. Cotton (Chiang Mai, Thailand) for improving earlier drafts of this article.
Conflicts of Interest
The authors declare no conflicts of interest.
References
- Kremen, C. Assessing the indicator properties of species assemblages for natural areas monitoring. Ecol. Appl. 1992, 2, 203–217. [Google Scholar] [CrossRef]
- Wang, W.L.; Suman, D.O.; Zhang, H.H.; Xu, Z.B.; Ma, F.Z.; Hu, S.J. Butterfly conservation in China: From science to action. Insects 2020, 11, 661. [Google Scholar] [CrossRef]
- Fang, L.J.; Guan, J.L. Progress in the studies of butterflies in responding to global climate change. J. Environ. Entomol. 2010, 32, 399–406. [Google Scholar] [CrossRef]
- Pollard, E.; Yates, T.J. Monitoring Butterflies for Ecology and Conservation: The British Butterfly Monitoring Scheme; Chapman & Hall: London, UK, 1993; p. 248. [Google Scholar]
- Singer, M.C.; Thomas, C. Evolutionary responses of a butterfly metapopulation to human- and climate-caused environmental variation. Am. Nat. 1996, 148, S9–S39. [Google Scholar] [CrossRef]
- Parmesan, C.; Ryrholm, N.; Stefanescu, C.; Hill, J.K.; Thomas, C.D.; Descimon, H.; Huntley, B.; Kaila, L.; Jaakko, K.; Tammaru, T.; et al. Poleward shifts in geographical ranges of butterfly species associated with regional warming. Nature 1999, 399, 579–583. [Google Scholar] [CrossRef]
- Kerr, J.T. Butterfly species richness patterns in Canada: Energy, heterogeneity, and the potential consequences of climate change. Conserv. Ecol. 2001, 5, 131–147. [Google Scholar] [CrossRef]
- Parmesan, C. Ecological and evolutionary responses to recent climate change. Annu. Rev. Ecol. Evol. Syst. 2006, 37, 637–669. [Google Scholar] [CrossRef]
- Settele, J.; Kudrna, O.; Harpke, A.; Kühn, I.; van Swaay, C.; Verovnik, R.; Warren, M.; Wiemers, M.; Hanspach, J.; Hickler, T.; et al. Climatic Risk Atlas of European Butterflies; Pensoft Publishers: Sofia, Bulgaria, 2008; p. 710. [Google Scholar]
- He, C.T. Geographic distribution of the genus Anopheles in Dulongjiang. Chin. J. Zool. 1999, 33, 8–9. [Google Scholar] [CrossRef]
- Huang, H. A list of butterflies collected from Nujiang (Lou Tse Kiang) and Dulongjiang, China with descriptions of new species, new subspecies and revisional notes (Lepidoptera, Rhopalocera). Neue Entomol. Nachrichten 2003, 55, 3–114. [Google Scholar]
- Wang, C.Y.; He, Z.R.; Peng, M.C. Vegetation and Plant Research in Dulongjiang River (Upper Irrawaddy River) Watershed and Adjacent Area; Science Press: Beijing, China, 2013; p. 360. [Google Scholar]
- Myers, N.; Mittermeier, R.A.; Mittermeier, C.G.; da Fonseca, G.B.A.; Kent, J. Biodiversity hotspots for conservation priorities. Nature 2000, 403, 853–858. [Google Scholar] [CrossRef]
- Mittermeier, R.A.; Turner, W.R.; Larsen, F.W.; Brooks, T.M.; Gascon, C. Global biodiversity conservation: The critical role of hotspots. In Biodiversity Hotspots; Zachos, F., Habel, J., Eds.; Springer: Berlin, Germany, 2011; pp. 3–22. [Google Scholar]
- Chen, W.X. Impacts on Farmers’ Livelihoods by the Changes of Energy Consumption Structure in the Dulong Watershed; Yunnan University: Kunming, China, 2022. [Google Scholar]
- Ding, N. Research on the Intergenerational Difference of Dulong’s Local Ecological Knowledge. Yunnan University: Kunming, China, 2024. [Google Scholar]
- Dong, D.Z.; Kavanauph, D.; Li, H. Butterfly resource of Nujiang Canyon in Yunnan. J. Southwest Agric. Univ. 2002, 24, 289–292. [Google Scholar] [CrossRef]
- Ou, X.H.; Yang, C.Q.; Song, J.X.; Xiong, J. Survey and analysis of butterfly diversity in Gaoligongshan National Nature Reserve. In Proceedings of the 6th National Symposium on Biodiversity Conservation and Sustainable Utilisation, Lijiang, China, 11–18 May 2004; pp. 178–187. [Google Scholar]
- Liu, L.; Gao, H.P. Preliminary investigation of butterfly species in Gaoligong Shan Nature Reserve. J. Baoshan Coll. 2014, 33, 10–13+17. [Google Scholar]
- Liu, L. Investigation of species of Pieridae insects and population dynamics of dominant species in Baihualing area of Gaoligong mountain. J. Baoshan Coll. 2016, 35, 11–13. [Google Scholar]
- Yi, L.; Dong, Y.K.; Miao, B.G.; Peng, Y.Q. Diversity of butterfly communities in Gaoligong region of Yunnan. Biodivers. Sci. 2021, 29, 950–959. [Google Scholar] [CrossRef]
- Ma, F.Z.; Xu, H.G.; Chen, M.M.; Tong, W.J.; Wang, C.B.; Cai, L. Progress in construction of China Butterfly Diversity Observation Network (China BON-Butterflies). J. Ecol. Rural Environ. 2018, 34, 27–36. [Google Scholar] [CrossRef]
- Li, X.Z. Landforms in Drung River basin. Yunnan Geogr. Environ. Res. 1996, 59–72. [Google Scholar]
- Tian, H. The soil type and distribution regular of Drung River basin. Yunnan Geogr. Environ. Res. 1994, 17–26. [Google Scholar]
- He, J.H. Study on current situation of water environmental protection countermeasures of the Dulong River basin in Yunnan. Environ. Sci. Surv. 2019, 38, 14–18. [Google Scholar] [CrossRef]
- Ao, S.C.; Hu, J.C.; Li, X.F.; Tan, L.; Ye, L.; Cai, Q.H. River ecosystem health assessment of the Dulong River. Chin. J. Ecol. 2020, 39, 1281–1287. [Google Scholar] [CrossRef]
- Cun, J.P. The Countermeasures of Dulong River Gorge Eco-Tourism Development. Hebei Normal University: Shijiazhuang, China, 2009. [Google Scholar]
- Sun, J.; Dai, L.J.; Wang, H.H.; Xiong, Y.; Huang, Z.P.; Xiao, W.; Li, Y.P. Evaluation of planting under forest via sustainable development: A case study on Amomum tsao-ko planting along Dulong River. J. Dali Univ. 2021, 6, 55–59. [Google Scholar] [CrossRef]
- GB/T 21010—2017; Ministry of Natural Resources of the PRC. Current Land Use Classification (GB/T 21010—2017). General Administration of Quality Supervision, Inspection and Quarantine of the PRC, Standardization Administration of the PRC: Beijing, China, 2017. [Google Scholar]
- Lu, Q.B.; You, W.Y.; Zhao, C.J.; Wang, X.W.; Meng, X.X. Effects of tourism disturbance on plant diversity in Qingshan Lake scenic area of Zhejiang Province. Chin. J. Appl. Ecol. 2011, 22, 295–302. [Google Scholar] [CrossRef]
- Kadlec, T.; Tropek, R.; Konvicka, M. Timed surveys and transect walks as comparable methods for monitoring butterflies in small plots. J. Insect Conserv. 2012, 16, 275–280. [Google Scholar] [CrossRef]
- Barkmann, F.; Huemer, P.; Tappeiner, U.; Tasser, E.; Rüdisser, J. Standardized butterfly surveys: Comparing transect counts and area-time counts in insect monitoring. Biodivers. Conserv. 2023, 32, 987–1004. [Google Scholar] [CrossRef]
- HJ 710.9—2014; Ministry of Environment Protection of the PRC. Technical Guidelines for Biodiversity Monitoring—Butterflies (HJ 710.9—2014). Ministry of Environment Protection of the PRC: Beijing, China, 2014. [Google Scholar]
- Kawahara, A.Y.; Plotkin, D.; Espeland, E.; Meusemann, K.; Toussaint, E.F.A.; Donath, A.; Gimnich, F.; Frandsen, P.B.; Zwick, A.; dos Reis, M.; et al. Phylogenomics reveals the evolutionary timing and pattern of butterflies and moths. Proc. Natl. Acad. Sci. USA 2019, 116, 22657–22663. [Google Scholar] [CrossRef]
- Hu, S.J.; Cotton, A.M.; Duan, K.; Zhang, X. An Illustrated Checklist of Butterflies of Yunnan. Vol. 1. Papilionidae; Science Press: Beijing, China, 2024; p. 429. [Google Scholar]
- Zhu, J.Q.; Gu, Y.; Chen, Z.B.; Chen, J.L. Life History of Chinese Butterflies; Chongqing University Press: Chongqing, China, 2018; p. 598. [Google Scholar]
- Wu, C.S.; Hsu, Y.F. Butterflies of China; The Strait Publishing House: Fuzhou, China, 2017; p. 2036. [Google Scholar]
- Moreno, C.; Halffter, G. On the measure of sampling effort used in species accumulation curves. J. Appl. Ecol. 2001, 38, 487–490. [Google Scholar] [CrossRef]
- Ugland, K.I.; Gray, J.S.; Ellingsen, K.E. The species-accumulation curve and estimation of species richness. J. Anim. Ecol. 2003, 72, 888–897. [Google Scholar] [CrossRef]
- Zeng, H.C. Astudy on the Differences and Influencing Factors of Butterfly Species and Functional Diversity in Urban Green Spaces. Anhui Agricultural University: Hefei, China, 2023. [Google Scholar]
- Fang, S.Q.; Li, Y.P.; Pan, Y.; Wang, C.Y.; Peng, M.C.; Hu, S.J. Butterfly diversity in a rapidly developing urban area: A case study on a university campus. Diversity 2024, 16, 4. [Google Scholar] [CrossRef]
- Christianus, I.; Ismail, M.N.; Amir, A.; Kedri, F.K.; Sukri, N.S. Species diversity and abundance of butterflies (Lepidoptera: Rhopalocera) in Lata Hokkaido, Jeli, Kelantan. BIO Web Conf. 2024, 131, 01011. [Google Scholar] [CrossRef]
- Carreira, J.Y.O.; Brown, K.S., Jr.; Freitas, A.V.L. Species list and temporal trends of a butterfly community in an urban remnant in the Atlantic forest. Diversity 2025, 17, 604. [Google Scholar] [CrossRef]
- Chao, A.; Kubota, Y.; Zelený, D.; Chiu, C.H.; Li, C.F.; Kusumoto, B.; Yasuhara, M.; Thorn, S.; Wei, C.L.; Costello, M.J.; et al. Quantifying sample completeness and comparing diversities among assemblages. Ecol. Res. 2020, 35, 292–314. [Google Scholar] [CrossRef]
- Hsieh, T.C.; Ma, K.H.; Chao, A. iNEXT: An R package for rarefaction and extrapolation of species diversity (Hill numbers). Methods Ecol. Evol. 2016, 7, 1451–1456. [Google Scholar] [CrossRef]
- Jin, C.X.; Wu, Y. A study on the measurement of community diversity and their application. Acta Entomol. Sin. 1981, 24, 28–33. [Google Scholar] [CrossRef]
- Ma, K.P. On the measurement of community diversity (I): The α diversity (Part 1). Chin. Biodivers. 1994, 2, 162–168. [Google Scholar]
- Ma, K.P.; Liu, Y.M. On the measurement of community diversity (I): The α diversity (Part 2). Chin. Biodivers. 1994, 2, 231–239. [Google Scholar]
- Shannon, C.E. A mathematical theory of communication. Bell Syst. Tech. J. 1948, 27, 379–423. [Google Scholar] [CrossRef]
- Pielou, E.C. The measurement of diversity in different types of biological collection. J. Theor. Biol. 1966, 13, 131–144. [Google Scholar] [CrossRef]
- Simpson, E.H. Measurement of diversity. Nature 1949, 163, 688. [Google Scholar] [CrossRef]
- Margalef, R. Information theory in ecology. Gen. Syst. 1958, 3, 36–71. [Google Scholar]
- Hammer, Ø.; Harper, D.A.T.; Ryan, P.D. Past: Paleontological statistics software package for education and data analysis. Palaeontol. Electron. 2001, 4, art4. [Google Scholar]
- Chen, S.L.; Jia, M.R.; Wang, Y.; Xue, G.; Dai, Y. Study on the community of Fritillaria cirrhosa by the percentage of similarity. Res. Pract. Chin. Med. 2003, 17, 9–12. [Google Scholar] [CrossRef]
- Jaccard, P. Étude comparative de la distribution florale dans une portion des Alpes et des Jura. Bull. Société Vaudoise Des. Sci. Nat. 1901, 37, 547–579. [Google Scholar]
- Jaccard, P. The distribution of the flora in the Alpine zone. New Phytol. 1912, 11, 37–50. [Google Scholar] [CrossRef]
- Tanimoto, T.T. An Elementary Mathematical theory of Classification and Prediction; International Business Machines Corporation: New York, NY, USA, 1958; pp. 1–10. [Google Scholar]
- Chen, Z.N.; Zeng, Y. The butterfly diversity of different habitat types in Qilian, Qinghai Province. Biodivers. Sci. 2001, 9, 109–114. [Google Scholar] [CrossRef]
- Zuo, Z.T.; Yuan, X.Z.; Liu, H.; Li, X. Butterfly diversity in different types of habitat in Chongqing urban area. Chin. J. Ecol. 2008, 27, 946–950. [Google Scholar] [CrossRef]
- Kolde, R. Package Pheatmap, 1.0.12. Available online: https://cran.r-project.org/web/packages/pheatmap/index.html (accessed on 1 May 2025).
- Zhang, P.Y. Ecological Atlas of Insects in the Gaoligong Mountains; Northeast Forestry University Press: Harbin, China, 2011; p. 530. [Google Scholar]
- Zhang, H.H.; Wang, W.L.; Yu, Q.; Xing, D.H.; Xu, Z.B.; Duan, K.; Zhu, J.Q.; Zhang, X.; Li, Y.P.; Hu, S.J. Spatial distribution of pollinating butterflies in Yunnan Province, Southwest China with resource conservation implications. Insects 2020, 11, 525. [Google Scholar] [CrossRef]
- Nylin, S.; Slove, J.; Janz, N. Hostplant utilization, host range oscillations and diversification in Nymphalid butterflies: A phylogenetic investigation. Evolution 2014, 68, 105–124. [Google Scholar] [CrossRef]
- Peña, C.; Espeland, M. Diversity dynamics in Nymphalidae butterflies: Effect of phylogenetic uncertainty on diversification rate shift estimates. PLoS ONE 2015, 10, e0120928. [Google Scholar] [CrossRef] [PubMed][Green Version]
- Chazot, N.; Condamine, F.L.; Dudas, G.; Peña, C.; Kodandaramaiah, U.; Matos-Maraví, P.; Aduse-Poku, K.; Elias, M.; Warren, A.D.; Lohman, D.J.; et al. Conserved ancestral tropical niche but different continental histories explain the latitudinal diversity gradient in brush-footed butterflies. Nat. Commun. 2021, 12, 5717. [Google Scholar] [CrossRef] [PubMed]
- Espeland, M.; Hall, J.P.W.; DeVries, P.J.; Lees, D.C.; Cornwall, M.; Hsu, Y.F.; Wu, L.W.; Campbell, D.L.; Talavera, G.; Vila, R.; et al. Ancient Neotropical origin and recent recolonisation: Phylogeny, biogeography and diversification of the Riodinidae (Lepidoptera: Papilionoidea). Mol. Phylogenetics Evol. 2015, 93, 296–306. [Google Scholar] [CrossRef] [PubMed]
- Seraphim, N.; Kaminski, L.A.; Devries, P.J.; Penz, C.; Callaghan, C.; Wahlberg, N.; Silva-Brandão, K.L.; Freitas, A.V.L. Molecular phylogeny and higher systematics of the metalmark butterflies (Lepidoptera: Riodinidae). Syst. Entomol. 2018, 43, 407–425. [Google Scholar] [CrossRef]
- Onyenweaku, L.N.; Nwankwo, E.C.; Ezealor, A.U. Inter-habitat community variation of butterflies in an Afrotropical region. Afr. J. Ecol. 2024, 62, e13193. [Google Scholar] [CrossRef]
- Alvarez, Y.; Corso, A.J. Diversity of Butterfly Assemblages Within Disturbed Habitats of Jardines de Hershey, Mayabeque, Cuba. Caribb. J. Sci. 2020, 50, 139–158. [Google Scholar] [CrossRef]
- Dickens, J.K.; McMahon, L.; Binnie, S.E. The butterflies of a Cerrado-Atlantic Forest ecotone at Laguna Blanca reveal underestimation of Paraguayan butterfly diversity and need for conservation. J. Insect Conserv. 2019, 23, 707–728. [Google Scholar] [CrossRef]
- Graça, M.B.; Pequeno, P.A.C.L.; Franklin, E.; Souza, J.L.P.; Morais, J.W. Taxonomic, functional, and phylogenetic perspectives on butterfly spatial assembly in northern Amazonia. Ecol. Entomol. 2017, 42, 816–826. [Google Scholar] [CrossRef]
- Vu, L.V. Diversity and similarity of butterfly communities in five different habitat types at Tam Dao National Park, Vietnam. J. Zool. 2008, 277, 15–22. [Google Scholar] [CrossRef]
- Ruchin, A.B. Seasonal dynamics and spatial distribution of lepidopterans in selected locations in Mordovia, Russia. Biodiversitas 2021, 22, 2569–2575. [Google Scholar] [CrossRef]
- Ruchin, A.B. Spatial distribution of Lepidoptera in forest ecosystems of Central European Russia: Studies using beer traps. Forests 2023, 14, 680. [Google Scholar] [CrossRef]
- Walla, T.R.; Engen, S.; DeVries, P.J.; Lande, R. Modeling vertical beta-diversity in tropical butterfly communities. Oikos 2004, 107, 610–618. [Google Scholar] [CrossRef]
- Peng, Z.Q.; Yin, M.M.; Shen, M.M.; Sun, C.H.; Wang, B.X. A Comparison of butterfly species and functional diversity among three land use types of forest, tea garden and vegetable garden. Environ. Monit. Forewarning 2022, 14, 11–18+30. [Google Scholar] [CrossRef]
- Iserhard, C.A.; Duarte, L.; Seraphim, N.; Freitas, A.V.L. How urbanization affects multiple dimensions of biodiversity in tropical butterfly assemblages. Biodivers. Conserv. 2019, 28, 621–638. [Google Scholar] [CrossRef]
- Yang, H.Y.; Liu, Y.M.; Sang, J.P. The impact of habitat fragmentation on butterfly species diversity in the Gansu Xiaolongshan Forest Area. For. Sci. Technol. 2016, 5, 3–7. [Google Scholar] [CrossRef]
- Cai, Y.H.; Long, Z.B.; Lin, D.; Chen, J.X.; Chen, M.H.; Bi, Q.Q.; Li, X.K.; Qing, N. Influence of habitat fragmentation on butterfly diversity in Dinghu Mountain Nature Reserve. J. South China Norm. Univ. (Nat. Sci.) 2015, 47, 88–93. [Google Scholar] [CrossRef]
- Cheng, W.D.; Luk, C.-L.; Benedick, Z.; Nakamura, A.; Basset, Y.; Bonebrake, T.C.; Scheffers, B.R.; Ashton, L.A.; Xing, S. Butterflies respond to habitat disturbance in tropical forests through activity shifts. J. Anim. Ecol. 2025, 94, 1361–1371. [Google Scholar] [CrossRef] [PubMed]
Disclaimer/Publisher’s Note: The statements, opinions and data contained in all publications are solely those of the individual author(s) and contributor(s) and not of MDPI and/or the editor(s). MDPI and/or the editor(s) disclaim responsibility for any injury to people or property resulting from any ideas, methods, instructions or products referred to in the content. |
© 2025 by the authors. Licensee MDPI, Basel, Switzerland. This article is an open access article distributed under the terms and conditions of the Creative Commons Attribution (CC BY) license (https://creativecommons.org/licenses/by/4.0/).