Article

On the Spatial Distribution of Eagle Carcasses Around Wind Turbines: Implications for Collision Mortality Estimation

by
K. Shawn Smallwood
1,* and
Douglas A. Bell
2
1
Smallwood Ecology, 3108 Finch Street, Davis, CA 95616, USA
2
East Bay Regional Park District, 2950 Peralta Oaks Court, Oakland, CA 94605, USA
*
Author to whom correspondence should be addressed.
Diversity 2025, 17(10), 686; https://doi.org/10.3390/d17100686
Submission received: 25 August 2025 / Revised: 25 September 2025 / Accepted: 28 September 2025 / Published: 30 September 2025

Abstract

With worldwide development of wind energy, birds have grown increasingly vulnerable to collisions with wind turbines. For several species of eagles, which in many countries are accorded special protection due to a host of anthropogenic threats, accurate estimates of collision mortality are needed to assess impacts and to formulate appropriate mitigation strategies. Unfortunately, estimates of wind turbine collision mortality are often biased low by failing to account for carcasses that fall beyond the fatality search area boundary, B. In some instances, carcass density is modeled across the fatality search area to adjust for these undetected fatalities. Yet for more accurate fatality estimates, it is important to determine B ^ , the search area boundary within which all carcasses could be found. We used eagle carcass data from multi-year fatality studies conducted at the Island of Smøla, Norway, and the Altamont Pass Wind Resource Area, California, USA, to assess carcass density (i) as a contributor to mortality estimation (ii) as a predictor variable of B, and (iii) to test whether the cumulative carcass counts with increasing distance from the wind turbine can predict B ^ . We found that carcass counts within 5 m annuli change little with increasing distance from modern wind turbines, and that carcass density is largely a function of the area calculated. Characterization of the spatial distribution of carcasses within the search area varies with the search radius that determines B. However, this may not represent the true spatial distribution of carcasses, including those found beyond B. We assert that the available data are unsuitable for predicting the number of eagle carcasses within and beyond a given search area, nor for determining B ^ , but they do indicate that B ^ lies much farther from wind turbines than previously assumed. Ultimately, modeling available carcass distribution data cannot replace the need for searching farther from wind turbines to account for the true number of eagle collision victims at any given wind project.

1. Introduction

Utility-scale renewable energy generated from wind, solar, geothermal, and tidal sources can offset demand for energy otherwise generated from fossil fuels, but not without costs to biota including raptors. This is especially true in light of the effects of wind energy production on several species of eagles, which in many countries are accorded special protection due to multiple anthropogenic threats. Accurate estimates of collision mortality are needed to assess impacts and to formulate appropriate mitigation strategies. To improve collision mortality estimates, we analyze here the spatial distribution of carcass data from multi-year fatality studies conducted on the White-tailed Eagle (Haliaeetus albicilla) at the Island of Smøla, Norway (Smøla) and the Golden Eagle (Aquila chrysaetos) and the Bald Eagle (Haliaeetus leucocephalus) at the Altamont Pass Wind Resource Area, California, USA (APWRA).
To understand levels of collision mortality caused by wind turbines, it has been common practice to search for evidence of fatalities in areas around either a sample of wind turbines or all the turbines of a wind energy project. Ideally, the entire area of a wind project would be searched to find evidence of all collision fatalities in support of the most accurate mortality estimate. However, many studies establish fatality search boundaries, B, based on limited budgets and assume certain carcass deposition patterns or patterns that are predicted ballistically [1]. Boundaries of fatality search areas are usually implemented based on guidelines [2,3,4] or set by wind companies or Technical Advisory Committees acting on industry precedent.
There is a need to standardize the establishment of B that is appropriate to the rotor diameter and height of the turbine, particularly as new wind projects are installing ever larger turbines, and ideally the search area boundary that contains all the fatalities, B ^ . This includes estimating the proportions of collision victims that deposit within B (d in [5]) and outside B (1 − d) (Figure 1). The latter proportion, if unaccounted for, contributes to a search radius bias that results in a mortality estimate that is lower than true mortality [5,6].
Two major sources of bias in mortality estimates are searcher error and carcass persistence. These are typically estimated through trials in which carcasses are placed to quantify the proportion of carcasses found by searchers and the proportion of carcasses remaining by the time of the next fatality search. No trials, however, have been implemented to estimate the proportion of carcasses falling undetected beyond B. Instead, carcass density (Y) has been linearly regressed on 5 m distance increments from the turbine to identify the maximum distance of carcass deposition as the point on the X-axis where Y = 0 [7]. Carcass density has been used to estimate the number of undetected fatalities located beyond B [8], and it has been adopted for use in the GenEst mortality estimator [9]. In a recent study, investigators used the eagle carcass data from Smøla to calculate carcass density and predict the number of carcasses located within and beyond B [10], but unlike [7], they fit generalized linear models to the change in carcass density with increasing distance from the turbine. In contrast, we have used carcass data from many avian species and nonlinear regression models fit to the cumulative counts of fatalities with increasing distance from the turbine [11,12], to predict the asymptote of the cumulative fatality count and the distance from the turbine, B ^ , at which the asymptote would be reached.
It has been posited that “An important feature of the spatial distribution of carcasses near turbines is that the density of carcasses changes with distance from the turbine” [10]. However, it is essential to understand how and why carcass density changes with increasing distance from the turbine, and whether a model fit to densities can accurately predict carcass density beyond the data range used to fit the model. Whether density is the appropriate metric warrants examination. For example, if two eagle carcasses are found on an annulus bound by 10–15 m from a turbine, and two are found on an annulus bound by 95–100 m from a turbine, then the density of eagle carcasses within the nearer annulus would be measured as 7.8-fold higher, because the areas of the respective annuli differed 7.8-fold (Figure 1). The difference in density in this example would have had nothing to do with the wind turbines’ production of eagle carcasses. The wind turbines produced four eagle carcasses between the two annuli compared regardless of where the eagles were found. If these carcasses were found closer to or farther from the turbines, they would have been assigned to different search annuli resulting in different carcass densities.
Fatality searches at the Altamont Pass Wind Resource Area (APWRA) have provided useful data to assess search radius bias in mortality estimates, including for the Golden Eagle (Aquila chrysaetos). The APWRA’s repowering to modern, next-generation wind turbines began in 2004 and continues through the time of this writing. All first-generation wind turbines were shut down by the end of 2014, and only modern wind turbines have since operated in the APWRA. With the variation in wind turbine sizes, the funding of primary research, and the recommendations of the Alameda County Scientific Review Committee and two Technical Advisory Committees, fatality search methods have varied in search interval and searchers. Fatality searches have been performed by biologists (“humans”), or by biologists who handle scent-detection dogs (“dogs”), or by a combination of both. Whereas trained dogs are more capable at finding animal carcasses [13,14,15], dog handlers have applied the same standards as human searchers to determine which detected evidence qualified as a fatality.
We report here on five objectives to accomplish the following: (i) explore whether carcass density is the appropriate metric for predicting the number of fatalities within or beyond the search boundary; (ii) compare the spatial distribution of carcasses found at Smøla to that found at similar-sized turbines and search areas within the APWRA; (iii) explore the patterns of carcass distribution at other shorter wind turbines at APWRA with smaller search boundaries but hundreds of eagle fatalities; (iv) examine differences in eagle carcass distributions arising from dog versus human searchers and from search interval to assess the choice of survey method on mortality estimation compared to an alternative approach that focuses on statistical error associated with model selection [10]; and (v) assess whether search areas could be tailored to detect enough fatalities to accurately estimate eagle mortality. These objectives are important because they contribute to the accuracy of eagle mortality estimates. Accurate characterizations of impacts on eagles are more comparable and therefore more likely to support the formulation of effective management strategies.

2. Materials and Methods

2.1. Study Areas

Our study involves comparisons of data from two study sites, one on Norway’s Island of Smøla, and the other in the APWRA, California. Whereas Smøla is relatively flat, the APWRA is composed of hills and ridges ranging from small and low elevation on the east side to larger and higher elevations toward the west side. Like at Smøla, the APWRA’s vegetation is relatively short stature, though grasses can reach 1 m tall in spring, falling over in mats by late May to early June. The APWRA’s climate is mediterranean. Prevailing wind directions are from the south-southwest, with secondary directions from the northwest and tertiary directions from the northeast.
The 2 and 2.3 MW wind turbines on Smøla were installed on 70 m towers, which were 10 m shorter than towers used on wind turbines of similar capacities in the APWRA (Table 1). The turbines in the APWRA that were searched to 105 m, which was the closest maximum search radius to that used at Smøla, were mounted on 80 m towers, and the blade tips of some of these turbines reached 24 m higher than did the blades of the largest turbines at Smøla (Table 1). The most recently installed wind turbines in the APWRA were on 90 m towers, but these were searched for fatalities to 122 m from the turbines (Table 1). From roughly 1980 to 2005, the pre-powered APWRA included >5000 smaller, first-generation wind turbines, most of which were searched to only 50 m from the turbines, but these were searched for many more years and accumulated many more eagle fatalities than did searches conducted at modern wind turbines to date (Table 1).
We have records of 710 dead or injured Golden Eagles and 1 Bald Eagle fatality in the APWRA through February 2023. Of these, 510 and 200 Golden Eagles were recorded at old generation and modern wind turbines, respectively. Most of our eagle carcass data from the APWRA include distance to turbine. Of the 108 dead or injured White-tailed Eagles found at Smøla between August 2005 and April 2020, only 72 had associated distance to turbine information [10].

2.2. Comparison of Fatality Search and Estimation Methods

We present here a critique of fatality methods employed at both Smøla and the APWRA. Typically, remains of eagle carcasses were recorded when found by designated fatality searchers or when found by anyone incidental to routine fatality searches. Off-leash scent-detection dogs were used in all the routine fatality searches at Smøla [10], and in many of the fatality searches in the APWRA since 2016 [16,17,18,19], but humans also performed searches at modern wind turbines since 2016 and at all turbines searched prior to 2016 [20,21]. Periodic fatality search intervals (days) varied, and this variation could have affected the spatial distribution of eagle carcass remains that were discovered and recorded, as could have the use of dogs versus humans as searchers. With longer search intervals, more feathers can be blown farther from wind turbines, and with dogs, smaller carcass remains can be discovered closer to wind turbines.
Whereas fatality counts at Smøla were converted to densities [10], we converted ours to cumulative counts within sequential distance increments from the wind turbine to model the spatial distribution of fatality remains [5,11,12,22]. Found carcasses of eagle fatalities represent independent observations, but they lose their independence when converted to carcass densities or cumulative carcass counts. In the case of carcass density, the denominator of the density ratio—annulus area—is inter-related to other annulus areas by a geometric function. In the case of cumulative carcass counts, each count is related to counts in annuli closer to the turbine. For either metric, the sacrifice of independence of observations should be of less concern than whether model predictions are accurate. To estimate the number of fatalities that deposited beyond B, we assert that models fit to carcass density cannot identify B ^ or F ^ , the latter value being the predicted total number of eagle fatalities. However, a logistic model fit to data from within B can theoretically predict F ^ which can be used to identify B ^ . An earlier study found that predictions of F ^ vary by area searched [12]. For this reason, we do not rely on the cumulative carcass count metric to estimate mortality within B, but only as an interim metric for the purpose of predicting the undetected number of carcasses beyond B.
Another difference between the two studies was the distance interval to which distance data were aggregated. Distances at Smøla were aggregated to 1 m intervals in support of modeling densities [10], whereas we aggregated distance data to 5 m intervals to minimize false precision, which we discuss in the Discussion section. We suspect that eagle carcasses at modern wind turbines at both study sites numbered too few to sufficiently overcome the effects of errors in assigning carcasses to 1 m distance annuli.
We used Statistica v. 10 to fit separate least-squares nonlinear regression models to carcass densities per 5 m annulus across area searched to B = 100 m at Smøla and to B = 105 m in the APWRA. To these data we fit the following model form:
D ^ = X a b X + c X 2   ,
where D ^ was the predicted carcass density (fatality count per annulus area) found X m from the turbine (expressed as the outer value of the inclusive 5 m interval), and a, b, and c were least-squares fitted parameter values. To converge on least-squares fits, we used a combination of Simplex and Quasi-Newton estimation methods. We assessed model fit by the proportion of variance accounted for, and by a visual inspection of the data relative to the model to ensure the variance was homogenous.
We fit separate models to the cumulative counts of fatalities with increasing 5 m distance increments from the turbines that were searched to B = 100 m at Smøla and to B = 50 m, B = 75 m, and B = 105 m in the APWRA. Due to insufficient numbers of fatalities, we did not attempt to fit models to fatality data collected from turbines where fatality searches extended to B = 60 m and B = 122 m. We fit nonlinear logistic models of the following form:
F ^ = 1 1 a + b X + 1 c   , or   alternatively:   F ^ = a X + 1 c X + 1 c + b   ,
where F ^ was the predicted number of fatalities found X m from the turbine (expressed as the outer value of the inclusive 5 m interval), a was the predicted asymptote of fatalities, and b and c were additional least-squares fitted parameter values. For some comparisons, we also normalized the number of model-predicted fatalities to a common scale between 0 (relative to the minimum value) and 1.0 (relative to the maximum value).

2.3. Changes in Model Predictions with Changes in B

A model fit to the spatial pattern of fatalities should change as the spatial pattern of fatalities changes relative to changes in B. One cannot add undetected fatalities that might be detected with an increase in B, but one can omit fatalities from truncated search areas, hereafter indicated by B−. We therefore fit models to the cumulative number of carcasses with increasing distance increments to various degrees of truncated search areas as a means to assess validity shrinkage of the original model fit to the actual implemented B, and as a means to assess the distance from the turbine at and beyond which model predictions of the maximum number of fatalities (the model asymptote) stabilized.

3. Results

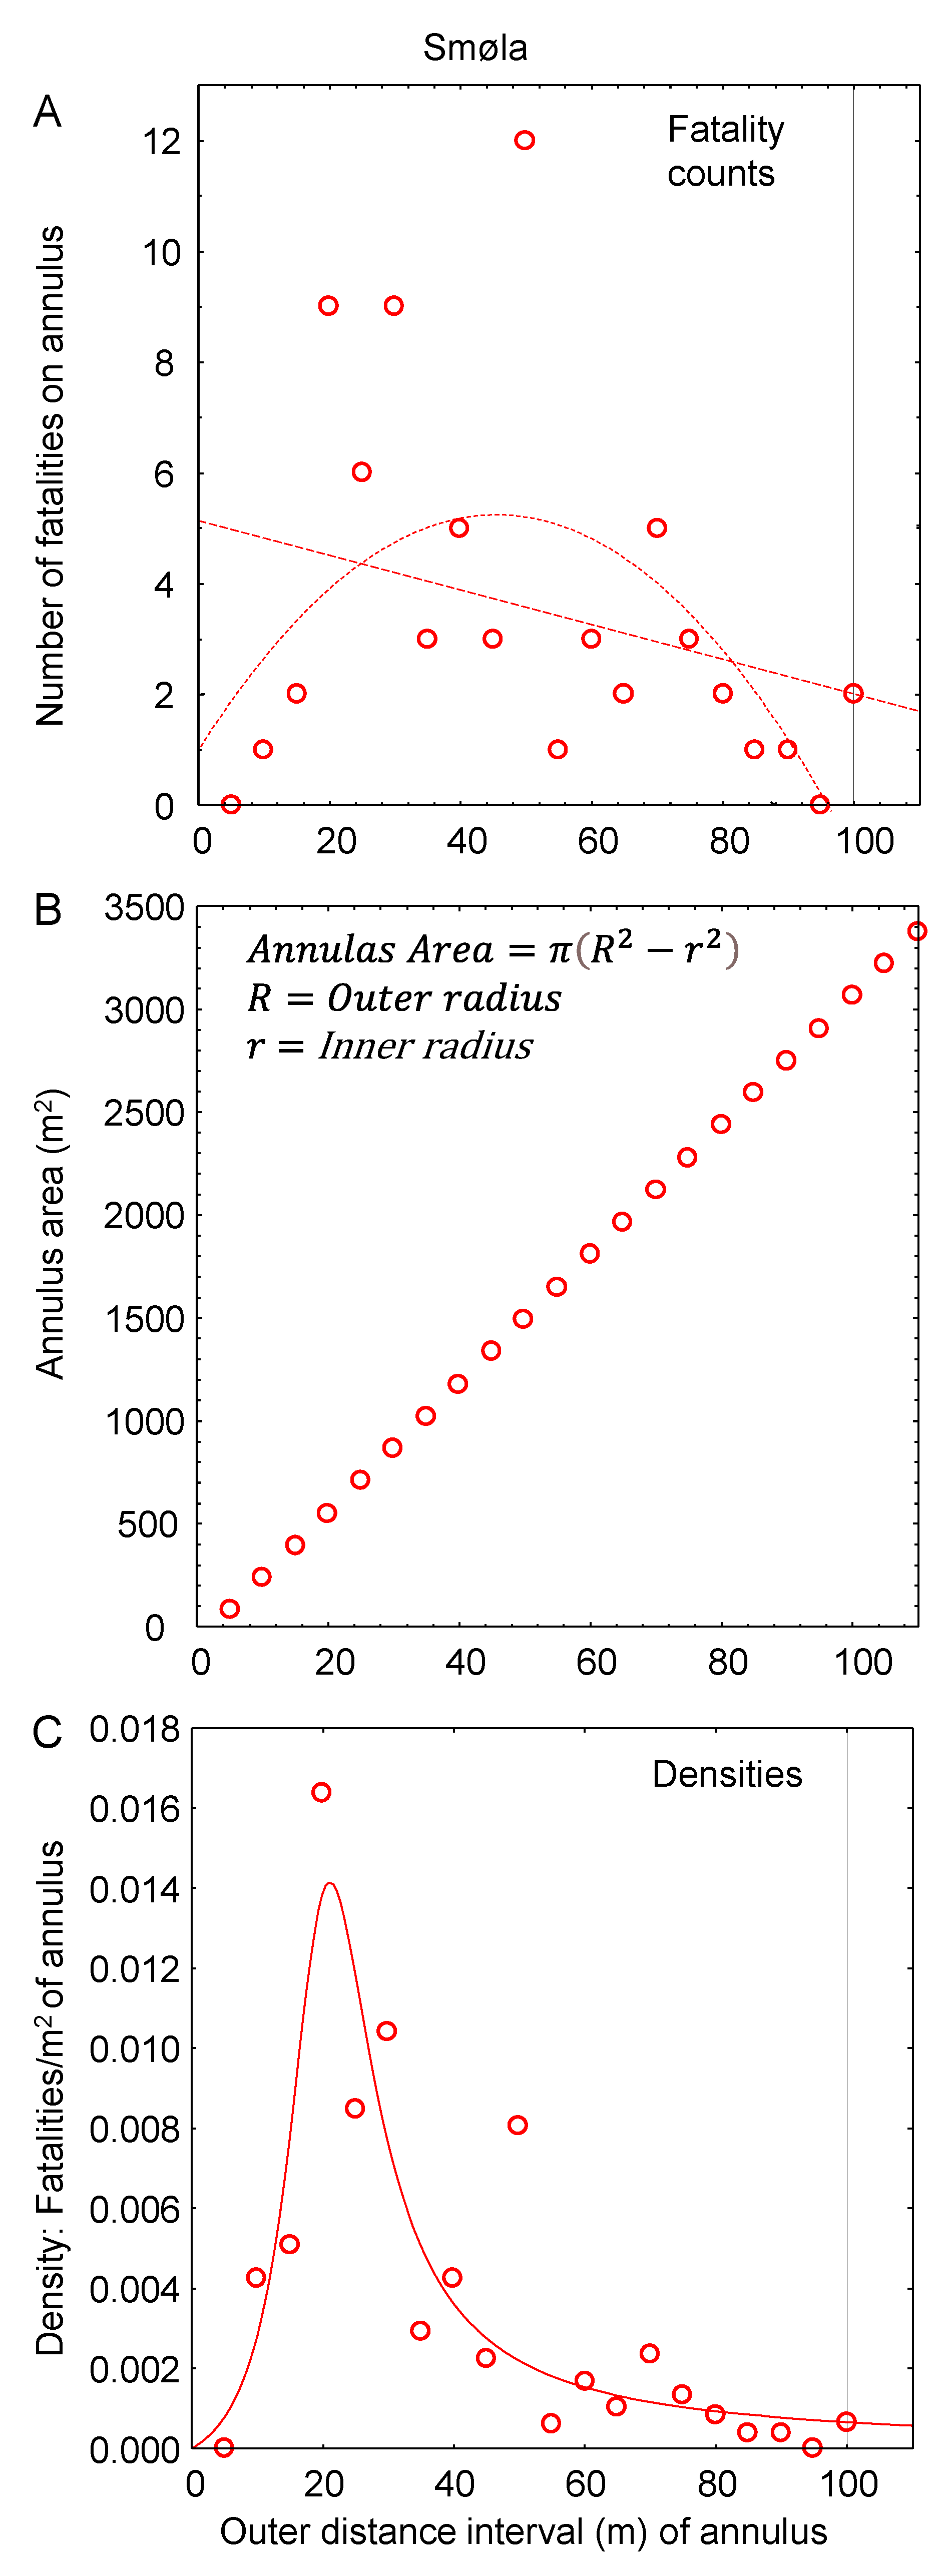
The carcass density relationship characterized by [10] originated less from variation in carcass counts as the numerator (Figure 2A) than from variation in annulus area as the denominator (Figure 2B) of the density metric (r2 = 0.77, Loss = 0.000079, Y = X 10,253.259 900.7245 X + 23.01 X 2 ;   Figure 2C). The number of carcasses per 5 m annulus, Y, did not respond significantly to increasing 5 m distance increments from the turbine, X (r2 = 0.03, SE = 3.22, p = 0.2266; Y = 5.1421 − 0.0313 X; Figure 2A). A quadratic model better fit the data, but it unrealistically predicted −1.3 White-tailed Eagle fatalities within the 95–100 m annulus (r2 = 0.28, p = 0.0332; Y = 0.1204 + 0.1857 X − 0.0021 X2; Figure 2A). The area per 5 m annulus increased with increasing 5 m distance increments from the turbine according to the formula A = π R 2 r 2 , where R is the outer radius of the annulus and r is the inner radius of the annulus (Figure 2B). The density of carcasses within 5 m distance annuli is a ratio composed of a relatively constant numerator represented by fatalities and a continuously varying denominator represented by the area of each annulus. Essentially, the resulting pattern of densities can be complex, but it was mostly influenced by the artefact of the geometric relationship between the area of a circle and the circle’s radius (Figure 2C).
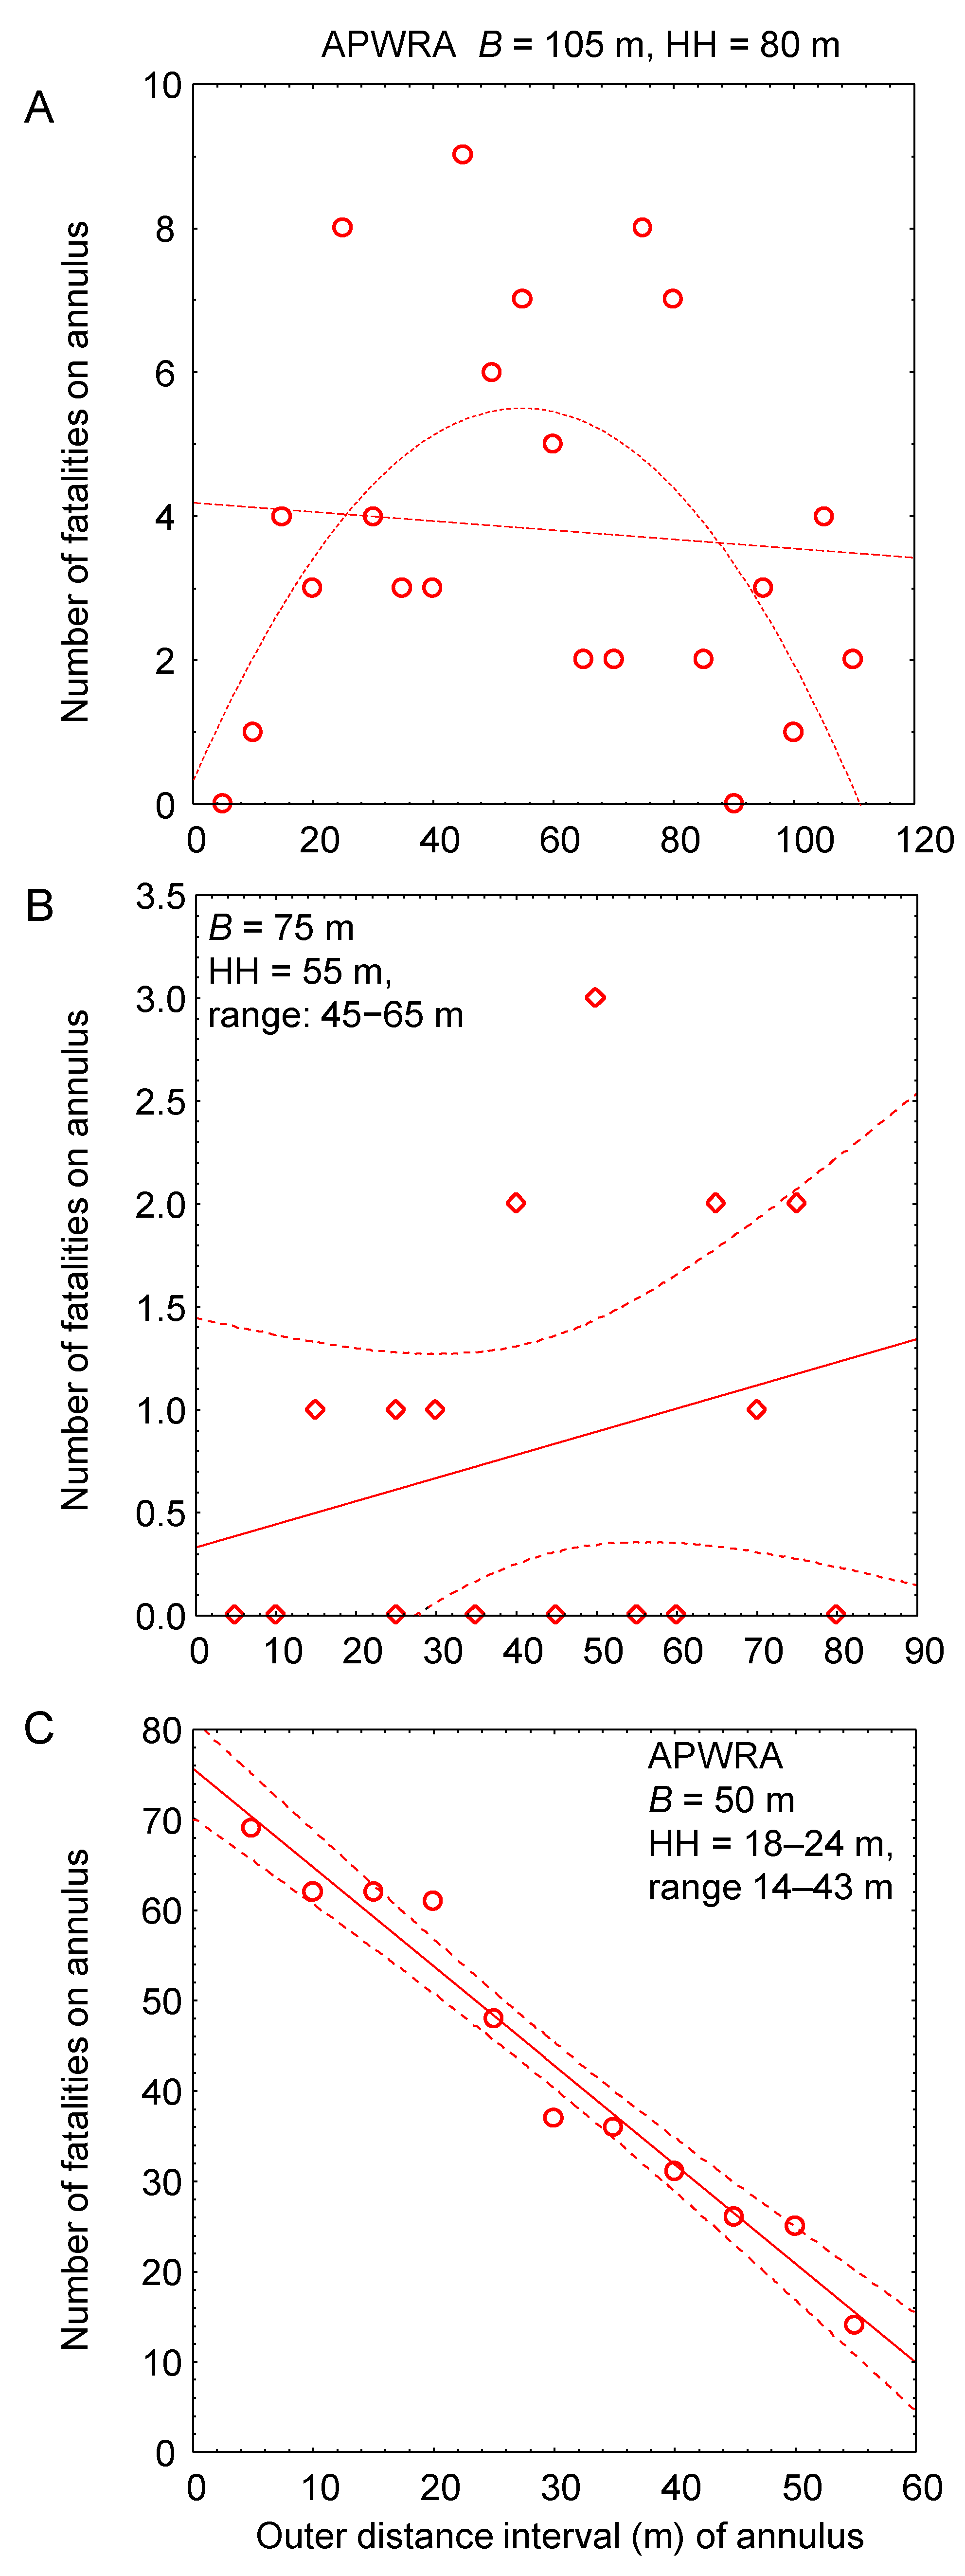
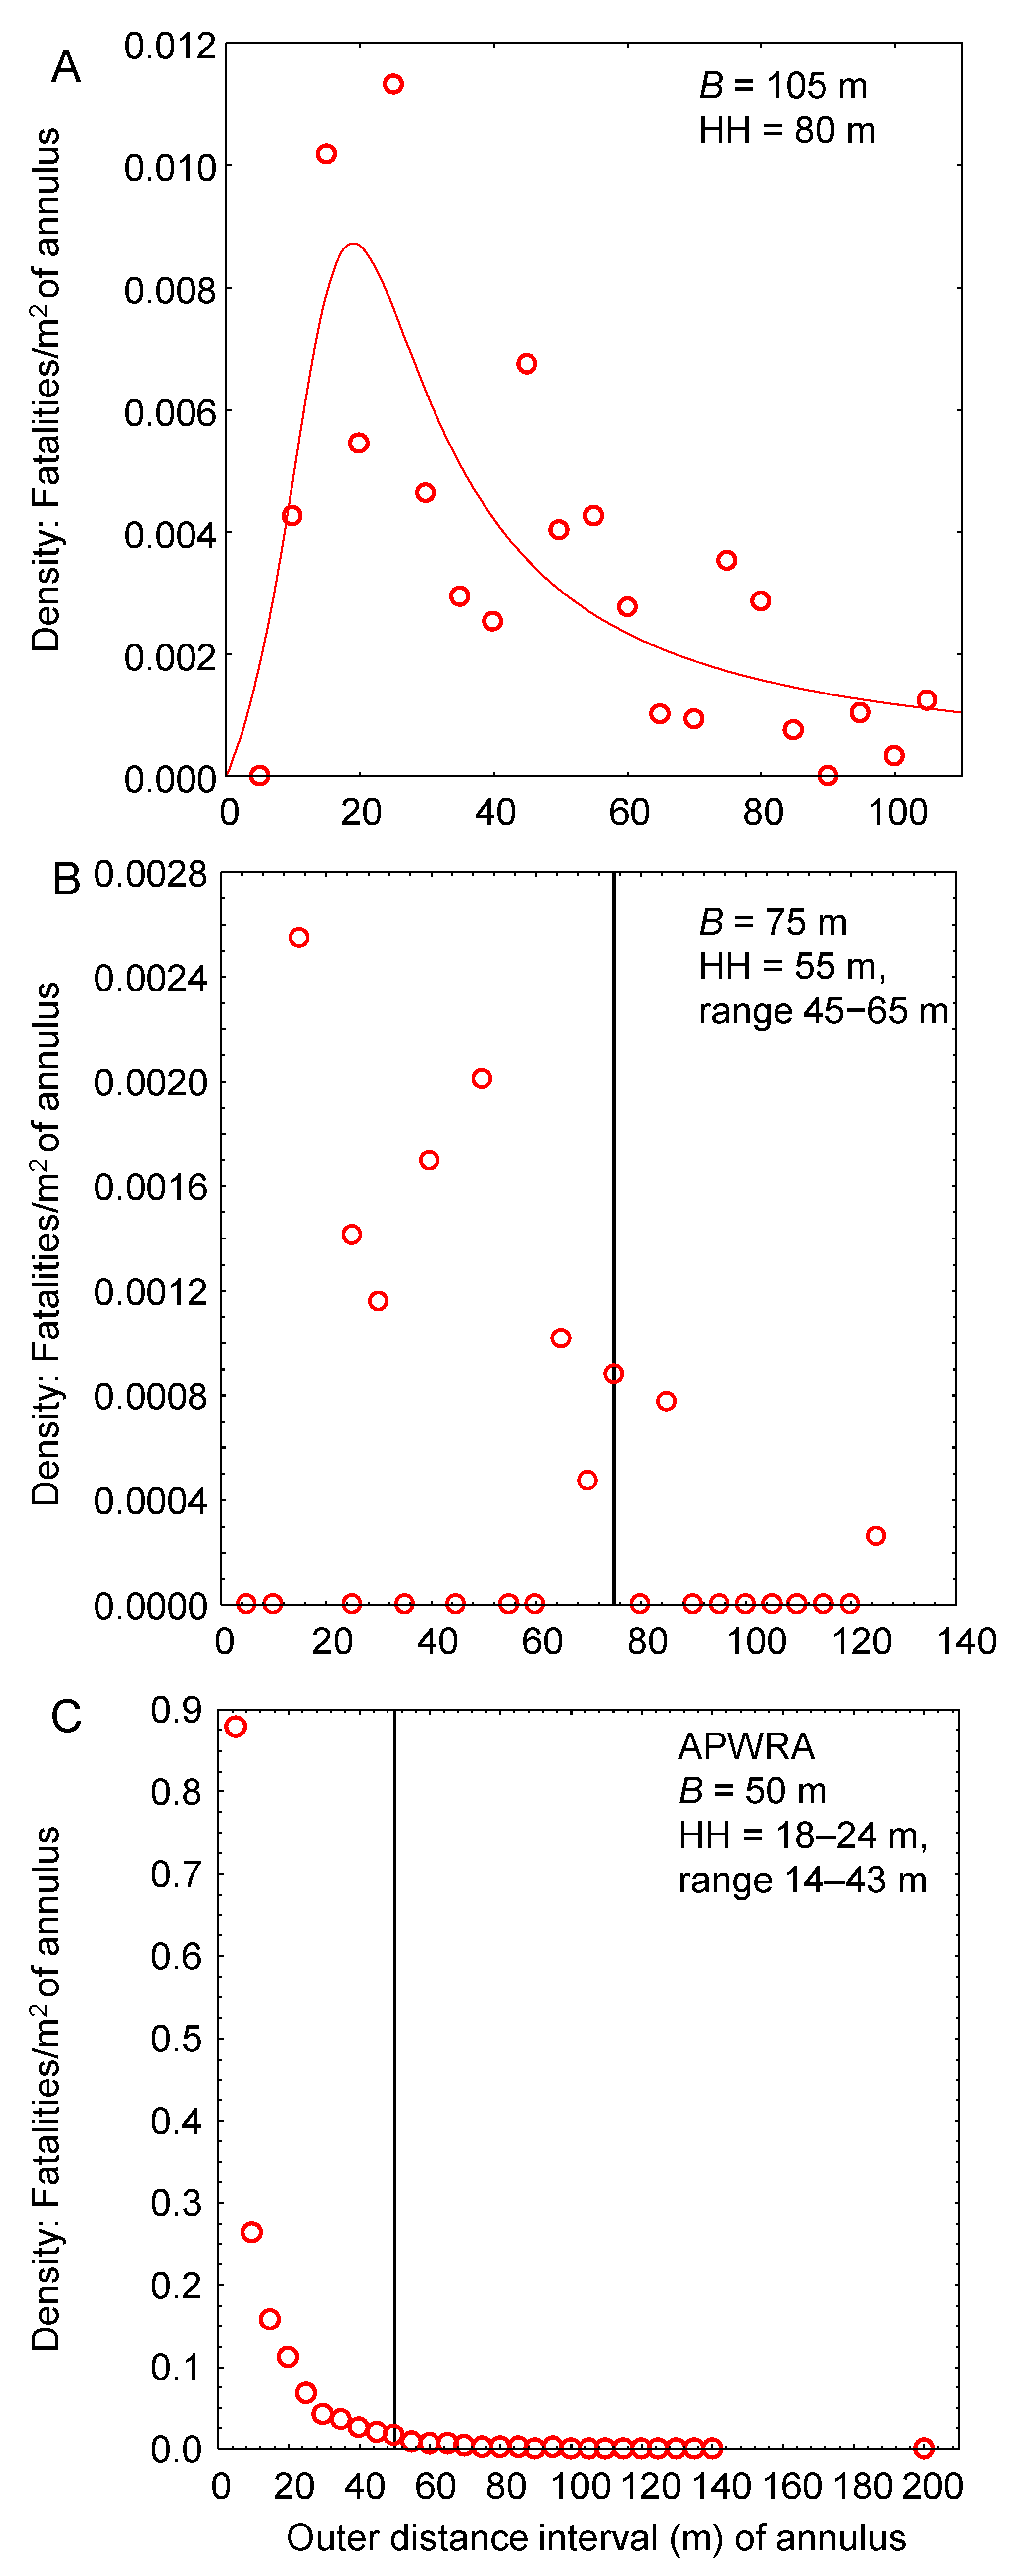
The same lack of response of carcass counts per annulus with increasing distance from the turbine applied to studies of modern wind turbines in the APWRA searched to B = 105 m (r2 = 0.00, SE = 33.17, p = 0.7334; Y = 4.1818 − 0.0063 X; Figure 3A) and B = 75 m (r2 = 0.01, SE = 23.44, p = 0.1285; Y = 0.3304 − 0.0113 X; Figure 3B). Like with the Smøla data, a quadratic model better fit the data, but it explained little of the variation (r2 = 0.27, p = 0.0157; Y = 0.3344 + 0.1892 X − 0.0017 X2; Figure 3A), and was unrealistic because fatalities were found as far as 200 m beyond the turbines (not shown in Figure 3A). However, from old-generation turbines searched to B = 50 m, carcass counts per annulus declined linearly with increasing distance from the turbine (r2 = 0.96, SE = 3.71, p = 0.0000; Y = 75.7091 − 1.0964 X; Figure 3C). These patterns dictated the declining responses of carcass density with increasing annulus area to B = 105 m (r2 = 0.65, Loss = 0.000067, Y = X 4045.9356 310.6788 X + 11.173 X 2 ;   Figure 4A), B = 75 m (Figure 4B), and B = 50 m (Figure 4C). Note that many carcass densities on 5 m annuli were 0 around wind turbines where B = 75 m, resulting from smaller search areas, a smaller number of searches, and a lower number of years of fatality monitoring (Figure 4B, Table 1).
Whereas Smøla yielded 72 eagle carcasses with information on nearest distances to the turbine, the APWRA yielded 649 (Table 2). Another 35 Smøla eagle fatalities lacked data on distance to the turbine, whereas 102 eagle fatalities in the APWRA lacked distance data, but most of the fatalities (91) lacking distance data in the APWRA had been found at first-generation wind turbines. Too few fatalities were available from fatality searches to B = 60 m and B = 122 m due to less search effort. The most comparable APWRA eagle carcasses to Smøla were those found at B = 105 m at modern wind turbines, where 93 carcasses had been found through February 2023, 90 of which included data on carcass distance to the nearest turbine (Table 2).
Within B = 100 m (Smøla) and B = 105 m (APWRA), detected eagle carcasses accumulated at the same rates with increasing distance from the turbine through about 75 m (Figure 5A, Table 3). Farther than 75 m, detected eagle carcasses in the APWRA accumulated at faster rates than at Smøla, and carcasses continued to accumulate even beyond B, but the cumulative counts of carcasses found far beyond B unsurprisingly numbered fewer than predicted by the model fit to the data at 5 m distance intervals through B (Figure 5A, Table 3). Similarly, the cumulative counts of carcasses found beyond B at smaller first-generation wind turbines numbered fewer than predicted by their respective best-fit models to fatality counts found within B = 75 m and B = 50 m (Figure 5B,C, Table 3). At Smøla, model-predicted asymptotes of cumulative carcass counts numbered 1.14 times more than the observed counts, and in the APWRA, it numbered 1.51 times more within B = 105 m, 2.85 times more within B = 75 m, and 1.71 times more within B = 50 m. Beyond B, observed fatality counts as percentages of model-predicted fatality counts were 20% at Smøla (two found beyond B ÷ (80 predicted − 70 observed within B)), and 19% at B = 105 m, 12.5% at B = 75 m, and 25.4% at B = 50 m in the APWRA. Model-predicted asymptotes of cumulative carcass counts would require B ^ > 250 m based on data from Smøla and all three sets of data (categories of tower heights) from the APWRA (Table 2).
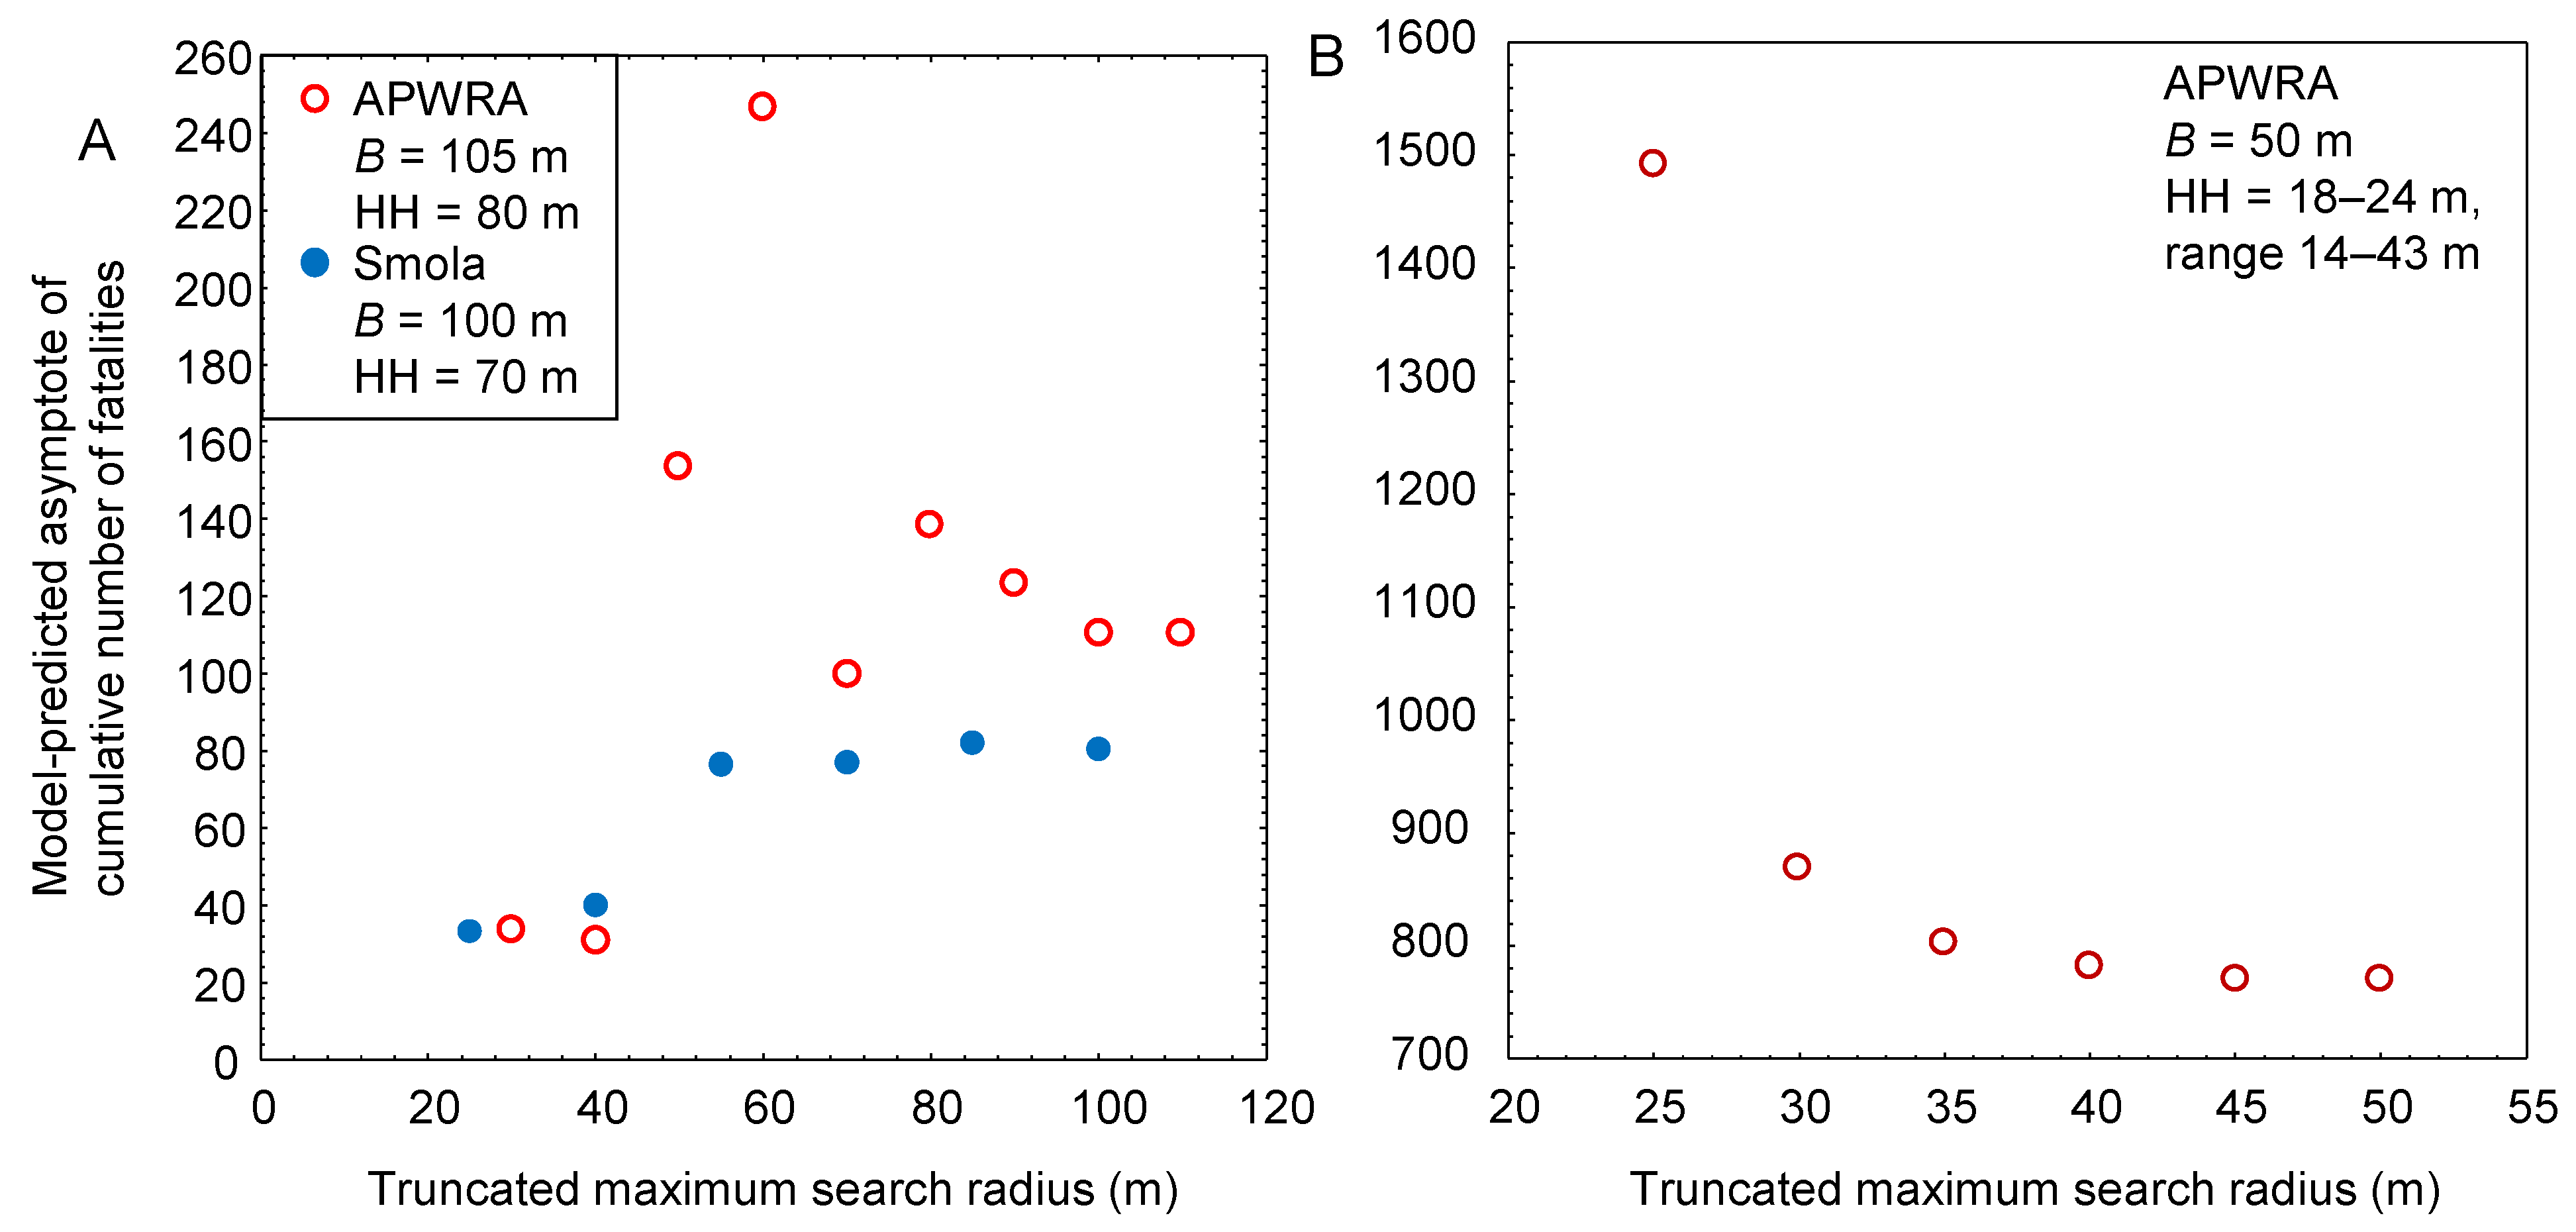
Model-predicted cumulative carcass counts normalized to a common scale between 0 (relative to the minimum value) and 1.0 (relative to the maximum value) revealed the Smøla carcass distribution as the quickest to approach 1.0 (Figure 6). Except for distances of <50 m from turbines, not even at first-generation APWRA turbines searched to 50 m did this proportion so quickly approach 1.0 (Figure 6). However, carcass distributions changed when we truncated the search areas, B−, and omitted fatalities located beyond B−. Models fit to cumulative carcass counts generated unrealistic predictions of F ^ within B− < 55 m at Smøla, within B− < 70 m at modern wind turbines in the APWRA (Figure 7A), and within B− < 35 m at first-generation wind turbines in the APWRA (Figure 7B). The choice of maximum search radius imparts a 2.5-fold range of F ^ at Smøla, a 3.3-fold range of F ^ at modern wind turbine in the APWRA, and a 1.9-fold range of F ^ at first-generation wind turbines in the APWRA, all of which are of much greater consequence than the 1.05-fold difference between the high and low proportions of eagle carcasses that Huso et al. [10] predicted to be available within 100 m based on theoretical distributions assumed in the models.
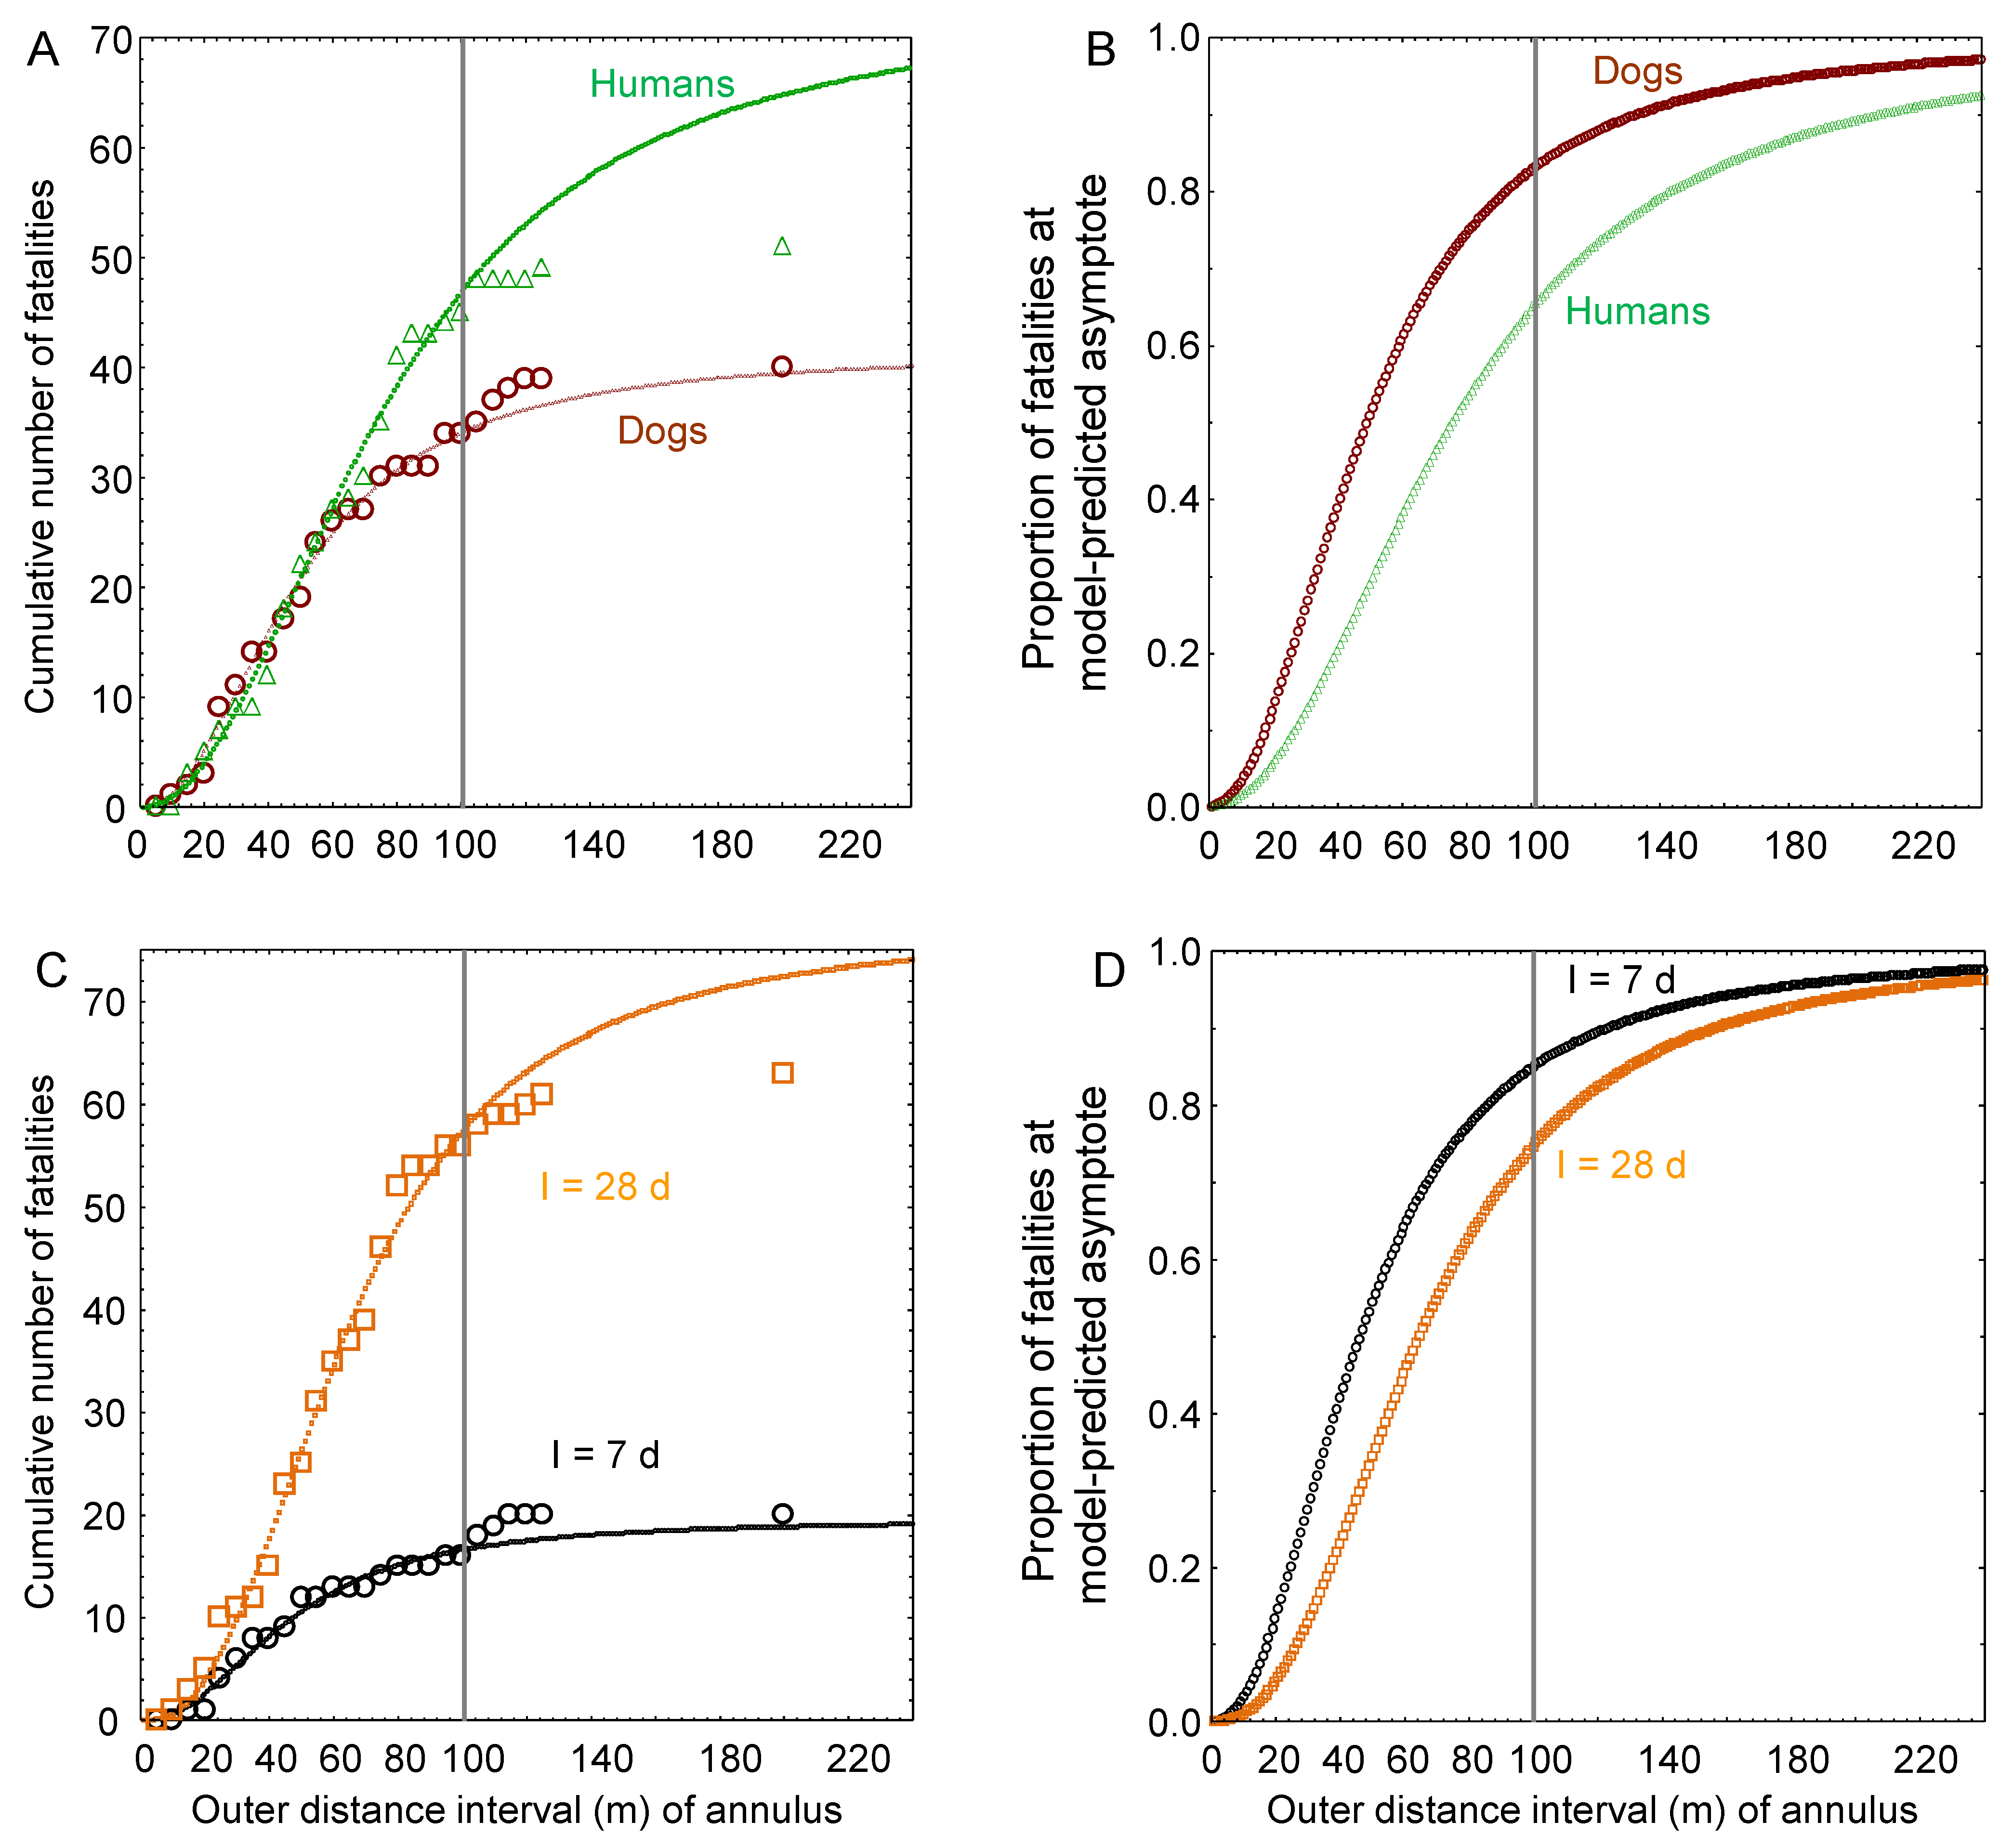
Among the APWRA’s modern wind turbines searched to 105 m, human searchers found more eagle carcasses than did dog searchers because human searchers were deployed in more of the searches (Figure 8A, Table 3). Normalized to a common scale to account for differences in model-predicted total fatalities, dogs more quickly approached F ^ (Figure 8B). At these same turbines, searches by humans at 28-day intervals found three times the number of eagle carcasses as did searches at 7-day intervals by both humans and dogs because there were about three times the searches at 28-day intervals (Figure 8C, Table 3). Normalized to a common scale, the 7-day-search intervals appeared to more rapidly approach F ^ (Figure 8D). Searched to the 105 m boundary, unleashed dogs found 1.22 times the number of eagle carcasses, and 7-day search intervals found 1.13 times the number of eagle carcasses. The range of outcomes based on statistical considerations (1.05-fold, reported above) was smaller than the range of outcomes based on choice of fatality searcher or search interval.
Around the APWRA’s modern wind turbines, Golden Eagle carcass remains that were nearest the turbine were distributed throughout the 105 m search radius and beyond (Figure 9), thus confirming the need for searchers to search the entirety of the searchable area within the established search boundary. However, the nearest carcass remains to the turbine were located 1.34 times other than expected within bearing vectors of 330° and 150° from the turbine, 1.57 times other than expected within bearing vectors of 355° and 120° from the turbine, and 2.00 times other than expected within bearing vectors of 30° and 60° from the turbine. Golden Eagles killed or injured by wind turbines were disproportionately deposited downwind of the turbine in the direction of the prevailing south-southwest winds, and secondarily downwind of the turbine in the direction of northwest winds.

Prediction Accuracy and Robustness to Misassignment of a Carcass Location

Compared to the carcass density models, the cumulative count models more accurately predicted the true fatality counts within B at both Smøla and at modern wind turbines in the APWRA (Table 4). Based on fatalities found by searches within B, prediction errors of the cumulative count models were 0.29% at Smøla and 0.12% in the APWRA, whereas prediction errors of the carcass density models were −3.29% at Smøla and 0.37% in the APWRA, or eleven-fold and three-fold larger, respectively. Unknown, however, is which metric can be modeled to more accurately predict F ^ within search areas extended to B ^ . Carcass density models predicted more carcasses within B ^ = 250 m at Smøla and B ^ = 255 m in the APWRA than did cumulative count models because the carcass density models continue adding more carcasses with every incremental increase in search radius, whereas the cumulative count models estimate an asymptote of carcasses. Measuring against the numbers of carcasses found within B, and assuming B ^   = 250 m at Smøla and B ^ = 255 m in the APWRA, the carcass density models increased F ^ 1.69-fold at Smøla and 2.16-fold in the APWRA, and assuming searches proceeded to B ^ , the cumulative count models increased F ^ 1.14-fold at Smøla and 1.33-fold in the APWRA.
Reallocating one fatality found within the 10–15 m search annulus to the outer annulus to simulate the remains of one eagle having been missed closer to the turbine but found farther away resulted in revised best-fit models of carcass spatial distribution. The revised cumulative count models reduced F ^ by 3.47 eagles (3%) at Smøla and by 0.5 eagles (0.45%) in the APWRA (second and fourth models shaded gray in Table 3). The new carcass density models were as follows: Y = X 12,660.2658 1096.114 X + 26.9014 X 2 ) (r2 = 0.72, Loss = 0.000096) at Smøla, and Y = X 4757.8516 333.3045 X + 11.0992 X 2 ) (r2 = 0.64, Loss = 0.000069) at modern wind turbines in the APWRA. The revised carcass density models reduced F ^ by 11.7 eagles (9.9%) at Smøla and increased F ^ by 2.6 eagles (1.5%) in the APWRA (Table 4). Except for the revised carcass density model applied to data from Smøla, the revised models based on the hypothetical reallocation of one eagle carcass to a farther location from the turbine demonstrated robustness. The revised carcass density model fit to the Smøla data resulted in a −9.9% prediction error within B and a commensurate reduction in F ^ (Table 4).

4. Discussion

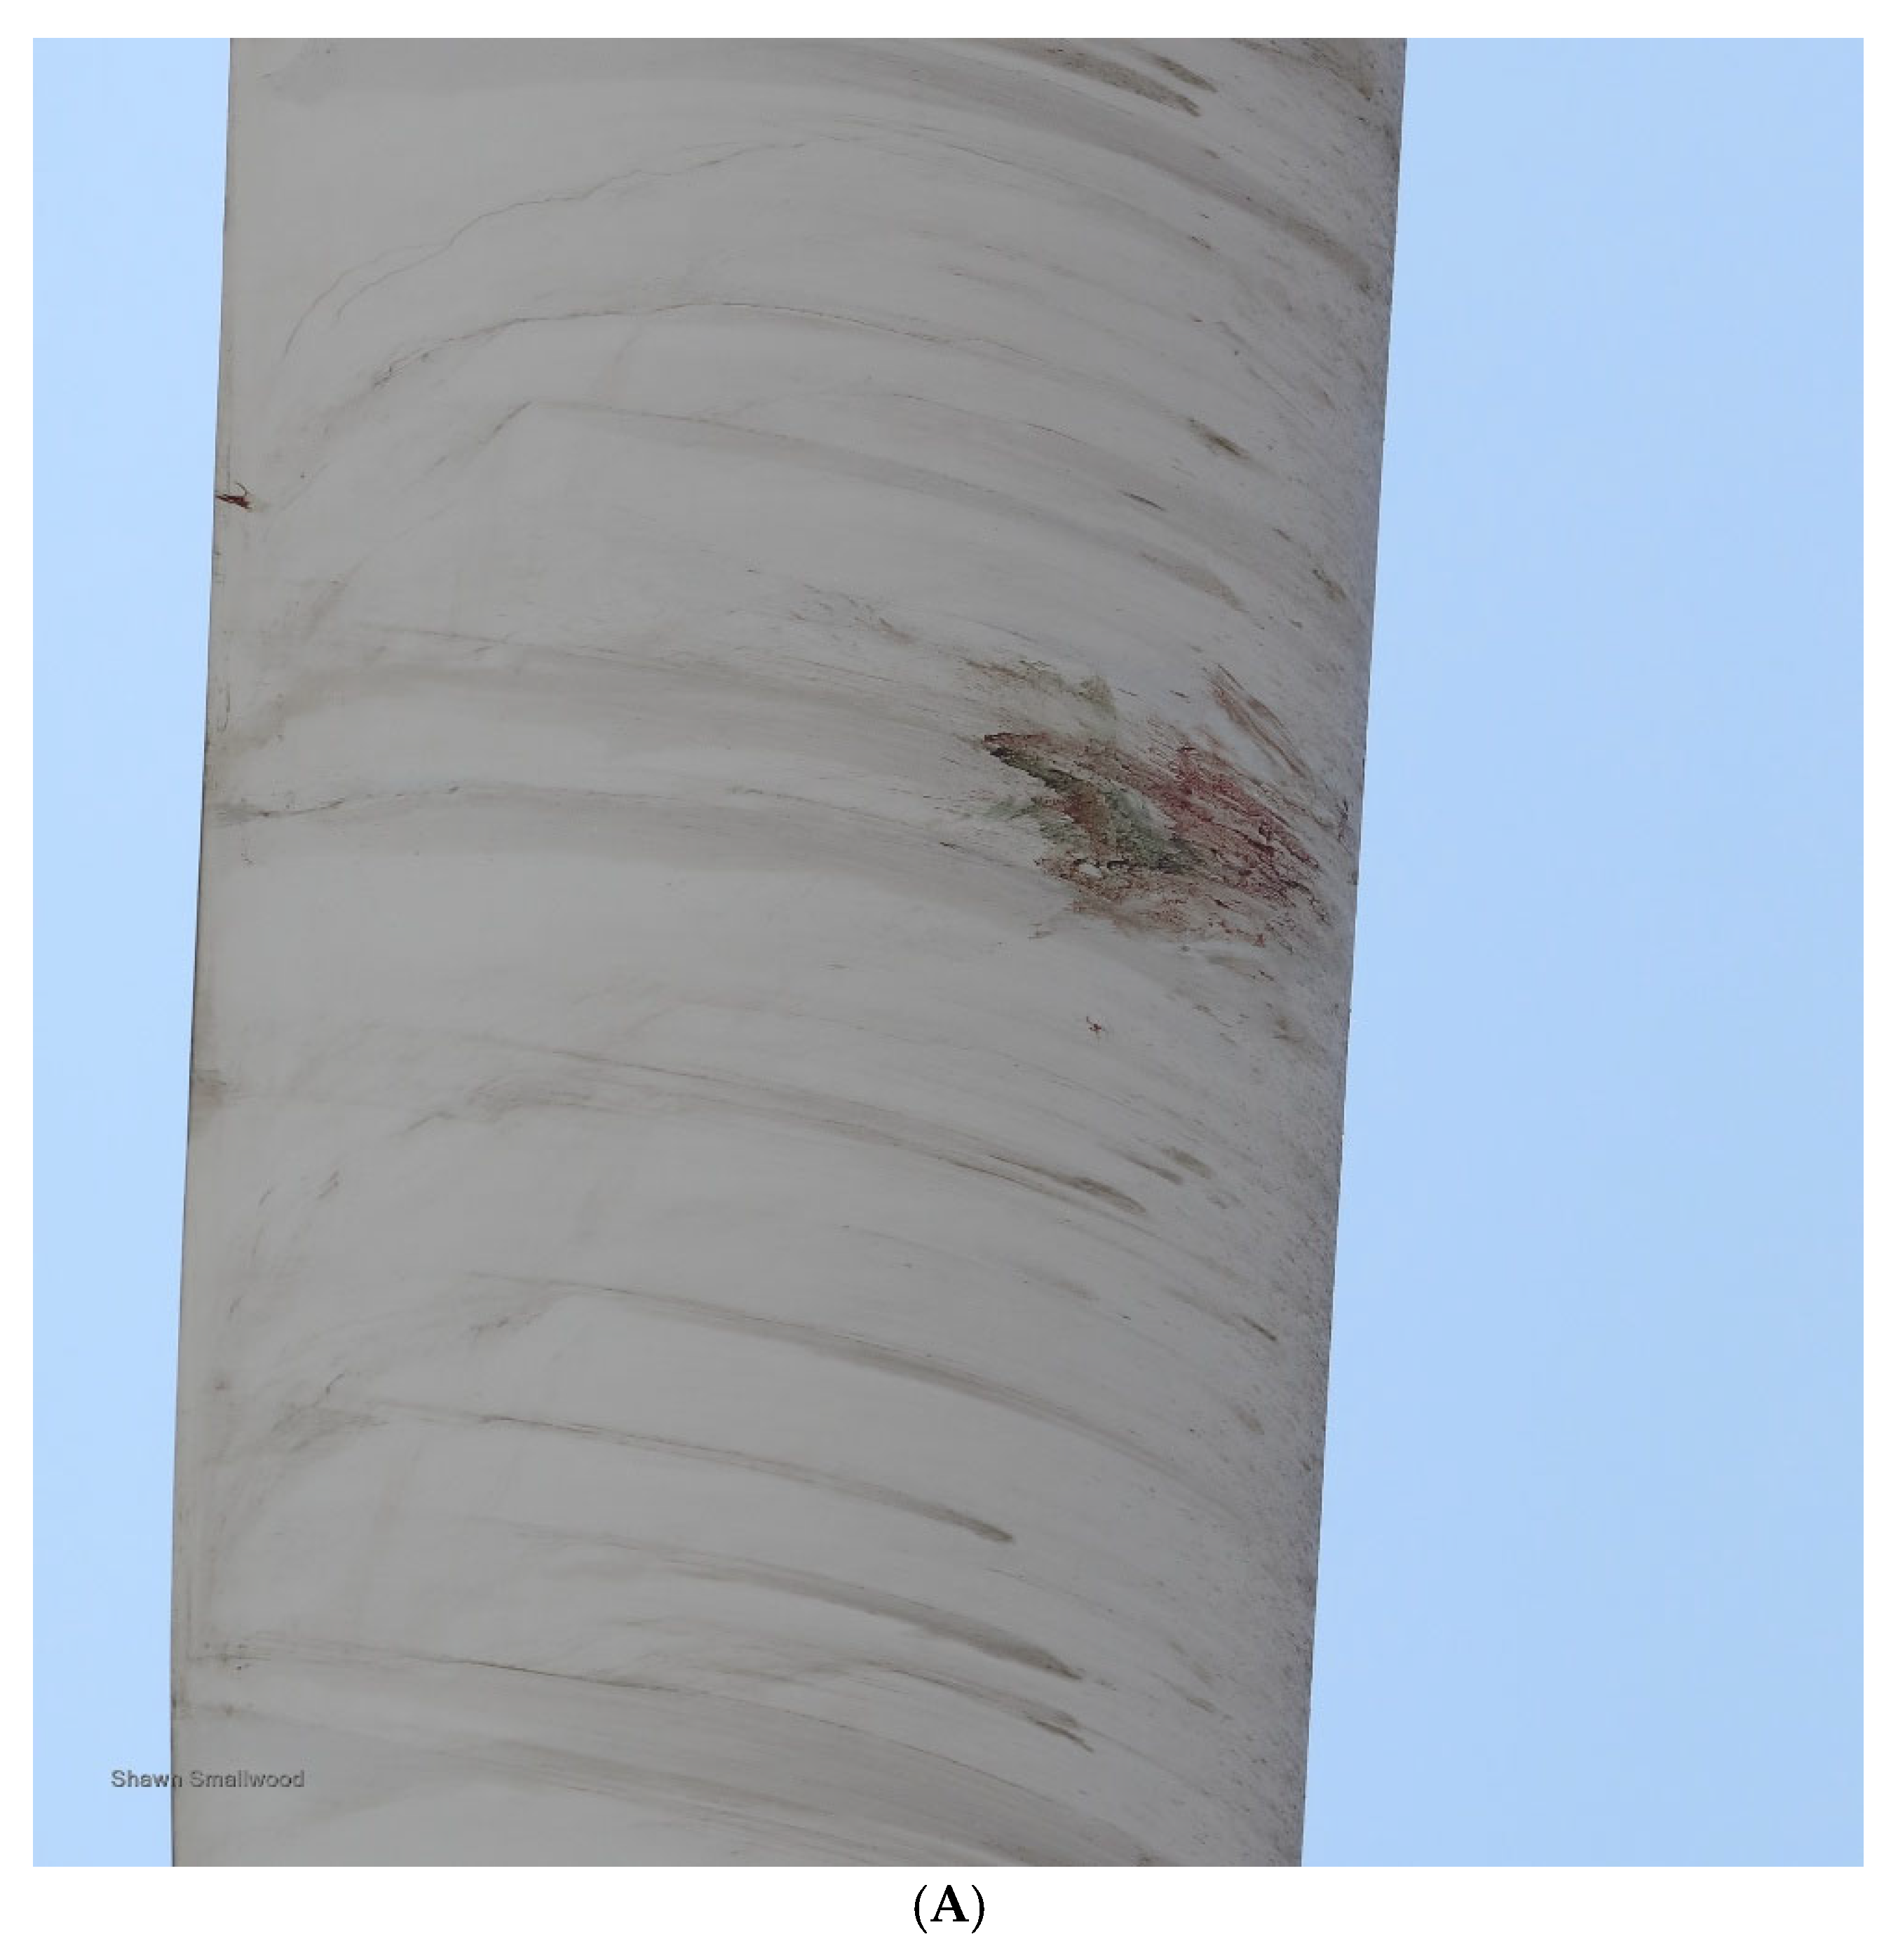
Wind turbines are point sources of collision mortality, but direct evidence of a collision is rarely detectable at the point source because the momentum of a collision victim often carries it beyond the point of impact, and a turbine’s moving blade can boost the carcass even farther. Evidence might remain on the blade, but this evidence is difficult to detect while the blades are moving. Once, when a wind turbine had just been shut down for maintenance and where one of us (KSS) had just found a Golden Eagle carcass that was so recently killed that it was warm and pliable and its blood had not yet congealed, we obtained direct evidence of a collision on a turbine blade (Figure 10A). Documenting the blood smear became possible only because KSS was able to examine the stilled blade. As a thought experiment, assigning the blood smear on the blade as the nearest remains to the turbine would have resulted in a measured distance of 0 m from the turbine. Had KSS not noticed the blood smear on the blade, the nearest carcass remains—the thorax, wings, and head—were located 20 m north of the turbine (Figure 10B), and had this portion of the carcass gone missing before the next fatality search, the nearest remains would have been the eagle’s legs located 130 m north (127 m laterally based on GPS, but 3 m added to account for the slope), or 25 m beyond the fatality search boundary. This fatality exemplifies the complexity of assigning a distance between an offending turbine and the nearest carcass remains to the turbine, and how the distance assignment might have changed as time passed before the next fatality search. Assuming that some portion of the remains would have been found upon the next search, regardless of whether the remains would have been found and measured at 0 m, 20 m, or 130 m from the turbine, the ultimate significance is that a fatality occurred.
All carcasses of eagle collision fatalities come to rest at some distance from wind turbines, but multiple factors determine where carcass remains deposit to the ground and whether and where they are found by searchers. Where an eagle carcass will deposit first depends on the angle of approach to the turbine rotor, where along the blade the collision occurs, and whether and how a blade strikes the eagle or the eagle collides with the blade, nacelle, or tower. A blade strike on the down-sweep can force carcass remains straight to the ground or nearer to the turbine’s tower base (see example above). A blade strike on the up-sweep can fling carcass remains far from the turbine. A collision can force an eagle to crash-land downslope or across a canyon hundreds of meters from the turbine, or a glancing blow can delay mortality until the eagle is far from the wind project. Wind force can mitigate carcass disposition by carrying a carcass farther or by spreading loosened feathers. A carcass landing on a steep slope can spread feathers as the carcass rolls downhill. Carcasses landing in dense vegetation can escape searcher detection. Eagle carcasses are not uniform in their detection probability, yet the distance between the turbine and nearest carcass remains is necessarily applied solely to the remains that were detected by searchers, be they human or dog, which may not reflect the original point of carcass deposition.
Absent fatality searches to B ^ , modeling the carcass distribution within B remains the only option to predict the number of undetected carcasses beyond B for a more accurate mortality estimate. However, carcass density is not the best metric for this purpose because, except for the eagle carcasses found during searches within 50 m of the APWRA’s first-generation wind turbines, carcass counts among sequentially larger annuli of the search area contributed little to declining carcass density as distances from the turbine approached B. In fact, Figure 5A reveals that eagle carcasses accumulated more rapidly at distances >75 m from turbines in the APWRA as compared to Smøla. Essentially, carcass densities are artefactual products of a relatively constant numerator divided by a geometrically varying denominator. Densities tend to hide the fact that the numbers of fatalities among sequentially larger annuli differ less in magnitude than do the increases in annulus areas, thereby giving the potentially false impression that few eagle carcasses occur beyond B.
Using our models fit to cumulative carcass counts with increasing distance from wind turbines to predict the numbers of fatalities beyond B, the percentage increase in carcasses was 20% at Smøla, 19% at similar-sized turbines in the APWRA, and >25% at first-generation turbines. Including these carcasses would obviously increase eagle mortality estimates at these wind projects. However, estimates of carcasses beyond B are typically omitted in favor of arguments for standardization among fatality search methods. Yet, fatality search methods generally lack standardization and many estimates available in reports are already incomparable due to variations in B and multiple other study attributes. Furthermore, B is often constrained by costs of fatality searches. If accuracy was the primary objective, fatality searches would be extended incrementally farther from the turbine until no more fatalities could be detected, and all carcasses, regardless of how far from wind turbines they were measured, were included in the mortality estimate, and leashed scent-detection dogs would be used in all fatality searches.
We suggest that the approach of weighting densities to estimate the numbers of eagle carcasses within specific distance domains from the turbine [9] is misdirected. A weighting of carcass distribution to improve the accuracy of mortality estimation might be better directed to bearing vectors than to distances. However, not even bearing-directed weightings would alleviate the need to search the entirety of the areas within B. Weightings by bearing vector could be best applied to the randomization of trial carcass placements to more accurately estimate searcher error and carcass persistence rates, as practiced by [12]. They could also be applied to searches beyond B for the purposes of estimating B ^ and the numbers of carcasses deposited between B and B ^ .
That humans found more eagle carcasses than did off-leash dogs at distances >65 m from APWRA turbines was consistent with what we noticed about detections of bat fatalities at such distances between off-leash and on-leash scent-detection dogs (unpublished data) during a study that used leashed dogs at the same turbines later searched by off-leash dogs [12]. We found that on steep slopes and at greater distances from turbines, off-leash dogs found fewer bats than did leashed dogs, suggesting that off-leash dogs were less likely to search farther from wind turbines, possibly due to handler influence or where terrain became difficult to traverse or vegetation grew taller and denser. In fact, KSS witnessed off-leash dogs break off their searches well short of B when slopes steepened or vegetation thickened and their handlers remained far away. At these locations, and where terrain and vegetation are challenging, dogs should be guided by leash.

4.1. Statistical Error Versus Measurement Error in the Field

Much of the Smøla study was focused on statistical error associated with model-fits to the change in carcass density with increasing distance from the turbine [10]. Neglected was the more substantial error that comes from field observations [11]. For example, misassignment of eagle carcasses to the wrong turbine was deemed negligible at Smøla because the turbines were spaced >228 m apart [10]. However, the approximately 100 m maximum search radius of two turbines separated by 228 m leaves only 28 m of separation between the search areas, and it leaves open the possibility that an eagle fatality assigned to one turbine was in fact killed by the other turbine. An assignment of an eagle carcass to the wrong wind turbine would likely also assign the eagle to the wrong distance annulus. In addition, at Smøla, two eagle carcasses found outside the maximum search radius of 100 m were excluded from mortality estimation. We would not have excluded the eagle carcass found at 103 m from the nearest turbine, and we suggest that doing so might have contributed to biased model-fits to carcass density.
Carcass location error also applies to the effects of crippling bias, which is the proportion of fatalities composed of severely injured eagles that depart the search areas of the offending turbines without leaving any trace of evidence that the collision occurred at those turbines [6,24]. Five (4.6%) eagles were reported as seriously injured at Smøla, one of which was found 850 m outside the wind project. The mobility of the five injured eagles was not reported, but the one found 850 m from the wind project was obviously mobile. Unknown were how many more mortally injured eagles left the fatality search areas without leaving any trace of their injuries to be found by dogs. Based on what we have observed and quantified in the APWRA, we suggest that crippling bias likely played a more significant role in the spatial distribution of eagle carcasses at Smøla.
It was assumed at Smøla that negligible error was generated by counts of eagle carcasses within 1 m distance annuli from the wind turbine, and it was further assumed that the dogs would have found all available carcasses, including those detected in later searches if not initially detected during the first search [9]. Although dogs do not find all carcasses in the search area [11], we concur that dogs find most of them. Scent-detection dogs managed off-leash, as was the case at Smøla, typically achieve carcass detection rates of about 50% to 70% [16,17,18], well short of the detection rates of leashed dogs. No carcass detection trials were performed at (T. Nygård, pers. comm., 2016). It is unlikely that unleashed dogs would have found all available carcasses.
To the assumption that eagle carcasses persist for long periods and would eventually be found even if initially missed, it was pointed out that the Island of Smøla lacks mammalian carnivores, which were implied to be the principal removers of eagle carcasses from mainland settings [10]. However, mammalian carnivores are not alone in the habit of removing carcasses, nor are they typically the first type of animal to scavenge carcasses. In the APWRA, the most common first scavenger was the common raven (Corvus corax), and raptors often also removed carcasses [25], including one as large as a great horned owl [26]. Eagle carcasses dismembered by wind turbine strikes can be more readily removed by scavengers other than mammalian carnivores. The remains left by avian scavengers can be easier or more difficult to detect, depending on terrain, vegetation, and the disposition of remains, e.g., relocated or spread out from the original location. In fact, it is unknown which types of animals serve as the principal scavengers of eagle carcasses at wind projects. The influence of human interference is also unknown, but in the APWRA we suspect human involvement in the removal of a fresh Golden Eagle carcass without a trace before it could be recovered. In the USA, the US Fish and Wildlife Service does not allow investigators to leave eagle carcasses in the field for more than 48 h after discovery, nor can investigators place eagle carcasses in carcass persistence trials. In APWRA studies, bird carcass detection trial outcomes were logit-regressed on body mass, which was intentionally varied widely for a robust model to predict the overall detection probability of eagle carcasses [11,21]. Golden Eagle detection probability was estimated to be 0.958 at a 7-day search interval, and 0.849 at a 28-day search interval [21]. Whereas we agree that many eagle carcasses would persist through the next search, we disagree that the error of measured carcass persistence is negligible, because eagle carcass persistence has not been directly measured at wind projects.
Potential measurement error also derives from the searcher’s decision about what evidence constitutes a fatality and where to assign the carcass’s nearest location to the turbine. Searchers in the APWRA were instructed to record the nearest distance of carcass remains to the wind turbine, which to some searchers could mean a body part or a flight feather, but to others it might mean contour feathers or a bone fragment. By the time they were detected, eagle carcasses of which carcass condition was recorded were often dismembered by the blade strike or by scavenging (25%), or feathers were dislodged (62%), but otherwise intact carcasses (28.2%) could roll upon impact with the ground, leaving feathers in the carcasses’ wakes. Eagle carcasses are often found by following a feather trail to the carcass. Feather trails can be long, and determinations of where that trail approaches nearest the turbine can vary among fatality searchers. In the Smøla study, there was no report of a standard of decision over the location of an eagle carcass.
At Smøla, it was not reported how the distances between eagle carcasses and wind turbines were measured, but in our experience these measurements can include substantial error and potential bias. A carcass’s distance from the turbine can be measured by use of GPS, a rangefinder aimed at the wind turbine from the location of the carcass, or by tape-measure strung from the turbine to the carcass. Another common method has been to count paces from the turbine to the carcass, especially to carcasses located relatively close to the turbine. Pacing or best guesses are also used in situations where line-of-sight views from the carcass to the base of the wind turbine’s tower are obscured by the slope of a hill, another terrain feature, or tall vegetation. Error in GPS mapping of carcass locations varies based on the quality of the GPS or rangefinder used. GPS accuracy in the APWRA’s Vasco Winds project was about 0.3 m [21], whereas it was 4 m at the Summit Winds project [19], the latter being four times the 1 m distance intervals in which eagle fatalities were tallied at Smøla [10]. We found five Golden Eagle carcasses or carcass parts for which two parties independently measured distance to the wind turbine on different days (four involving KSS finding the remains prior to the fatality searchers and one involving two teams of searchers who overlapped in their searches of the same wind turbines). Differences in measured distances were 0, 2, 3, 3, and either 2 or 18 m depending on whether the blood smear on a wind turbine blade is counted as the nearest remains to the turbine. The Golden Eagle depicted in Figure 10 was measured 18 m from the turbine by the fatality searchers one day after KSS measured the same body/head remains 20 m from the turbine but also recorded blood and gore on the turbine blade, 0 m from the turbine. The average difference in nearest distances to turbines between reporting parities was 2 m, but counting the blood smear on a blade as the nearest evidence would shift the mean difference to 5.2 m.
As discussed above, time since death or time to detection could affect distances assigned to eagle carcasses based on the remains nearest a wind turbine. This possible bias at Smøla was dismissed because eagle carcass persistence was assumed to be sufficiently long [10]. However, the converse is possible in that older carcasses increase the likelihood that remains that had been deposited much closer to the turbine at the time of the collision would have disappeared by the time the older carcass was detected. Taking this argument to the extreme, it is likely that almost every eagle collision initially leaves some evidence of it on a blade of the turbine, but this evidence is likely the quickest to disappear and is basically never documented during fatality searches. We suggest that on average, the distances resulting from assigning the remains of an eagle carcass to the nearest wind turbine are biased too far from the turbine, and thus prone to large measurement error. These types of error and bias could lessen the accuracy of density calculations, but they are less consequential to cumulative carcass counts related to increasing distance from the turbine so long as the fatality searches extended sufficiently far from the turbines (see Figure 7). A carcass inaccurately assigned to the 95–100 m annulus when it should have been assigned to the 10–15 m annulus would have different consequences depending on the metric used. In the case of carcass density as the metric, this reassignment at Smøla would introduce a prediction error of −9.9%, whereas in the case of the cumulative count of carcasses as the metric, it would introduce a prediction error of −3%. Converting the numbers of carcasses found to a carcass density metric can substantially changes the nature and potential magnitude of errors made in the field.
B has been chosen arbitrarily in wind project mortality studies; it has never been based on data collected from search areas consistent with the reality of carcass depositions. The densities and distributions of carcasses within search areas depend on the extent of B [12]. By fitting models to the spatial patterns of carcasses within distances from the turbine short of B, the F ^ and B ^ are revealed to generally increase with increasing B [12]. Based on the use of leashed dogs as fatality searchers within 105 m of the APWRA’s modern wind turbines, a model fit to the bird carcass locations within 50 m of the turbine predicted B ^ = 106 m, whereas a model fit to the bird carcass locations within the study’s actual B of 105 m predicted B ^ = 180 m (Figure 4 in [12]). At no wind project of which we are aware has a fatality search team searched far enough from wind turbines to definitively establish the means to identify B ^ . The finding at Smøla that 50% of the eagle carcasses were deposited to the ground within 42 m of the turbines was conditioned by their searches to B = 100 m. Searched to B = 50 m or to B = 120 m, the percentages of carcasses within 42 m would likely have differed. Assuming our cumulative count model applied to the Smøla data accurately predicted F ^ = 80 (Table 4), then <44% of the eagle carcasses were deposited to the ground within 42 m of the turbines.
Whereas much of the Smøla study was focused on model-selection to predict carcass distributions based on measured carcass density, the effects of model-selection are small relative to the effects of study design decisions and choice of field methods. Model selection was predicted to impart a 1.05-fold range of low to high proportions of eagle carcasses available within 100 m from the turbines [10]. In comparison, the decision to search weekly or every 28 days yields a 1.13-fold range of fatality predictions at B = 105 m. The decision to search with unleased dogs or humans yields a 1.22-fold range of fatality predictions at B = 105 m. Weighting the spatial distribution of carcasses by bearing vectors varies two-fold. Truncating the search area to model the pattern of fatalities found within the boundaries’ truncated areas yields fatality predictions that vary nearly eight-fold. The contribution of the denominator to the density metric of number of fatalities/annulus area ranges geometrically 39-fold from the 0–5 m annulus to the 95–100 m annulus.
Like many other decisions in study designs intended for mortality estimation at wind projects, the decision regarding the distance from the turbine that will serve as the fatality search boundary lacks specific guidance from the available fatality estimators. The same is true of transect spacing, choice of searcher, and standards of evidence used to determine that a fatality occurred. Fatality search efforts must be increased to find more of the available carcasses and injured eagles, such as by guiding scent-detection dogs by leash or, in the case of off-leash dogs, by greater handler control, searching around turbines to greater distances and visually scanning larger areas using binoculars. Additional approaches include photographing crippled eagles to document rates of major injury, install accelerometers to remotely detect collisions hence prompting searcher visits to the turbine, and inspection of blades for evidence of collision.

4.2. Management Implications

Eagles, such as the White-Tailed Eagle and the Golden Eagle, are faced with increasing threats to local and regional populations from wind energy projects [27,28,29]. It is of critical importance to accurately measure the impacts of wind turbines on eagles. Fatality estimates are needed to measure impacts and the efficacy of mitigation measures. However, a major contribution to the uncertainty around eagle mortality estimates are the numbers of eagles falling dead beyond the search area boundaries that have been in use, F>B. The approaches to predict F>B, whether based on modeling cumulative counts with increasing distance increments from the turbine or on modeling carcass density, are expedient but unsatisfactory because model predictions change substantially with changes in B within which the carcass distributions are measured, and based on whether humans or dogs are used as searchers or searches are completed at 7-day or 28-day intervals (and presumably based on other intervals). The only way to know how many eagle carcasses are present beyond the fatality search boundary is to search for carcasses beyond the fatality search boundary. However, even this extra step would not account for the number of eagles actually or effectively killed due to crippling bias.
Studies of bird and bat collision fatalities often justify the fatality search boundaries that are used by citing others who reported finding high percentages of carcasses within certain distances from the turbines—distances equal to or shorter than the boundaries chosen. These percentages would have differed had they been calculated from carcass counts over larger search areas. The true percentage of carcasses available to be found within any given distance from wind turbines remains unknown. Management decisions directed to wind energy impacts on eagles are better served by striving harder to find evidence of all fatalities. Searching farther from wind turbines to find more eagle carcasses is more costly, but doing so would reduce errors associated with misassigning carcasses to the wrong distances from the turbine and even to the wrong turbine, and it would reduce the magnitude of the number of eagles estimated to have not been found. Searching farther is also more likely to generate accurate estimates of eagle mortality than is modeling the spatial distribution of carcasses.

Author Contributions

Conceptualization, K.S.S.; methodology, K.S.S. and D.A.B.; formal analysis, K.S.S.; data curation, K.S.S. and D.A.B.; writing—original draft preparation, K.S.S.; writing—review and editing, K.S.S. and D.A.B. All authors have read and agreed to the published version of the manuscript.

Funding

This research received no external funding.

Data Availability Statement

The original contributions presented in this study are included in the article. Further inquiries can be directed to the corresponding author(s).

Acknowledgments

For the funding that supported many thousands of fatality searches around the APWRA’s wind turbines and this research, we thank the National Renewable Energy Lab, California Energy Commission, the wind companies of the APWRA, the East Contra Costa County Habitat Conservancy, the Contra Costa County Department of Conservation and Development, and the East Bay Regional Park District. We thank the wind companies for granting fatality searchers access to their wind leases, and we thank the landowners for access to their lands. For access, we thank East Bay Regional Park District. We thank all the fatality searchers and the companies they worked for, including BioResource Consultants, WEST, Inc., UC Santa Cruz’s Predatory Bird Research Group, Insignia Environmental, ICF International, H. T. Harvey and Associates, and Great Basin Bird Observatory. For logistical support, we thank the Counties of Alameda and Contra Costa, and for guidance on fatality search protocols and reporting, we thank the Alameda County Scientific Review Committee and Alameda County and Contra Costa County Technical Advisory Committees for wind energy development. No institutional reviews were required for searchers to search for eagle carcasses nor to use data on eagle carcass locations.

Conflicts of Interest

The authors declare no conflict of interest.

References

  1. Hull, C.L.; Muir, S. Search areas for monitoring bird and bat carcasses at wind farms using a Monte-Carlo model. Aust. J. Environ. Manag. 2010, 17, 77–87. [Google Scholar] [CrossRef]
  2. California Energy Commission and California Department of Fish and Game (CEC&CDFG). California Guidelines for Reducing Impacts to Birds and Bats from Wind Energy Development; Draft Staff Report CEC-700-2007-008-SD; California Energy Commission and California Department of Fish and Game (CEC & CDFG): Sacramento, CA, USA, 2007.
  3. Ontario Ministry of Natural Resources. Birds and Bird Habitats: Guidelines for Wind Power Projects; Ontario Ministry of Natural Resources: Peterborough, ON, Canada, 2011.
  4. U.S. Fish and Wildlife Service. U.S. Fish and Wildlife Service Land-Based Wind Energy Guidelines; OMB Control No, 1018-0148; U.S. Fish and Wildlife Service: Arlington, VA, USA, 2012.
  5. Smallwood, K.S. Comparing bird and bat fatality-rate estimates among North American wind-energy projects. Wildl. Soc. Bull. 2013, 37, 19–33. [Google Scholar] [CrossRef]
  6. Smallwood, K.S. Estimating wind turbine-caused bird mortality. J. Wildl. Manag. 2007, 71, 2781–2791. [Google Scholar] [CrossRef]
  7. Fiedler, J.K.; Henry, T.H.; Tankersley, R.D.; Nicholson, C.P. Results of Bat and Bird Mortality Monitoring at the Expanded Buffalo Mountain Windfarm, 2005; Tennessee Valley Authority: Knoxville, TN, USA, 2007.
  8. Huso, M.; Dalthorp, D. Accounting for unsearched areas in estimating wind turbine-caused fatality. J. Wildl. Manag. 2014, 78, 347–358. [Google Scholar] [CrossRef]
  9. Dalthorp, D.; Madsen, L.; Huso, M.; Rabie, P.; Wolpert, R.; Studyvin, J.; Simonis, J.; Mintz, J. GenEst Statistical Models—A Generalized Estimator of Mortality. In Techniques and Methods; U.S. Geological Survey: Reston, VA, USA, 2018; Volume 7, Chapter A2; 13p. [Google Scholar] [CrossRef]
  10. Huso, M.; Dalthorp, D.; Mintz, J.; Nygard, T.; May, R. Modeling the spatial distribution of carcasses of eagles killed by wind turbines. J. Raptor Res. 2023, 57, 456–467. [Google Scholar] [CrossRef]
  11. Smallwood, K.S.; Bell, D.A.; Walther, E.L.; Leyvas, E.; Standish, S.; Mount, J.; Karas, B. Estimating wind turbine fatalities using integrated detection trials. J. Wildl. Manag. 2018, 82, 1169–1184. [Google Scholar] [CrossRef]
  12. Smallwood, K.S.; Bell, D.A.; Standish, S. Dogs detect larger wind energy impacts on bats and birds. J. Wildl. Manag. 2020, 84, 852–864. [Google Scholar] [CrossRef]
  13. Arnett, E. A Preliminary Evaluation on the use of dogs to recover bat fatalities at wind energy facilities. Wildl. Soc. Bull. 2006, 34, 1440–1445. [Google Scholar] [CrossRef]
  14. Mathews, F.; Swindells, M.; Goodhead, R.; August, T.A.; Hardman, P.; Linton, D.M.; Hosken, D.J. Effectiveness of search dogs compared with human observers in locating bat carcasses at wind-turbine sites: A blinded randomized trial. Wildl. Soc. Bull. 2013, 37, 34–40. [Google Scholar] [CrossRef]
  15. Reyes, G.A.; Rodriguez, M.J.; Lindke, K.T.; Ayres, K.L.; Halterman, M.D.; Boroski, B.R.; Johnston, D.S. Searcher efficiency and survey coverage affect precision of fatality estimates. J. Wildl. Manag. 2016, 80, 1488–1496. [Google Scholar] [CrossRef]
  16. H.T. Harvey and Associates. Golden Hills Wind Energy Center Post-Construction Fatality Monitoring Report: Final 3-Year Report; H.T. Harvey and Associates: Los Gatos, CA, USA, 2020. [Google Scholar]
  17. Great Basin Bird Observatory; H. T. Harvey and Associates. Golden Hills North Wind Energy Center Postconstruction Fatality Monitoring Final 3-Year Report; H.T. Harvey and Associates: Los Gatos, CA, USA, 2022. [Google Scholar]
  18. H.T. Harvey and Associates. Golden Hills Wind Energy Center Golden Eagle Adaptive Management Monitoring Project: Final 3-Year Report; H.T. Harvey and Associates: Los Gatos, CA, USA, 2023. [Google Scholar]
  19. WEST, Inc. Post-Construction Fatality Monitoring at the Summit Wind Repower Project Alameda County, California, September 2, 2022 to September 1, 2023; WEST, Inc.: Calgary, AB, Canada, 2023. [Google Scholar]
  20. Insignia Environmental. Final Report for the Buena Vista Avian and Bat Monitoring Project February 2008 to January 2011; Insignia Environmental: Palo Alto, CA, USA, 2012. [Google Scholar]
  21. Brown, K.; Smallwood, K.S.; Szewczak, J.; Karas, B. Final 2012–2015 Report Avian and Bat Monitoring Project Vasco Winds, LLC.; NextEra Energy Resources: Livermore, CA, USA, 2016. [Google Scholar]
  22. Loss, S.R.; Will, T.; Marra, P.P. Estimates of bird collision mortality at wind facilities in the contiguous United States. Biol. Conserv. 2013, 168, 201–209. [Google Scholar] [CrossRef]
  23. ICF International. Final Report Altamont Pass Wind Resource Area Bird Fatality Study, Monitoring Years 2005–2013; ICF International: Reston, VA, USA, 2016. [Google Scholar]
  24. Gauthreaux, S.A. Suggested practices for monitoring bird populations, movements and mortality in wind resource areas. In Proceedings of the National Avian-Wind Power Planning Meeting II, Palm Springs, CA, USA, 20–22 September 1995; Prepared for the Avian Subcommittee of the National Wind Coordination Committee. RESOLVE Inc.: Washington, DC, USA; LGL Ltd.: King City, ON, Canada; 152p. [Google Scholar]
  25. Smallwood, K.S.; Bell, D.A.; Snyder, S.A.; DiDonato, J.E. Novel scavenger removal trials increase estimates of wind turbine-caused avian fatality rates. J. Wildl. Manag. 2010, 74, 1089–1097. [Google Scholar] [CrossRef]
  26. Bell, D.A.; Snyder, S.A.; DiDonato, J.E.; Smallwood, K.S. Conspecific carcass removal from a wind project study plot by a great horned owl (Bubo virginanus). J. Raptor Res. 2023, 57, 489–492. [Google Scholar] [CrossRef]
  27. Dahl, E.L.; Bevanger, K.; Nygärd, T.; Røskaft, E.; Stokke, B.G. Reduced breeding success in White-tailed Eagles at Smøla windfarm, western Norway, is caused by mortality and displacement. Biol. Conserv. 2012, 145, 79–85. [Google Scholar] [CrossRef]
  28. Hunt, G.W.; Wiens, J.D.; Law, P.R.; Fuller, M.R.; Hunt, T.L.; Driscoll, D.E.; Jackman, R.E. Quantifying the demographic cost of human-related mortality to a raptor population. PLoS ONE 2017, 12, e0172232. [Google Scholar] [CrossRef]
  29. Gedir, J.V.; Gould, M.J.; Millsap, B.A.; Howell, P.E.; Zimmerman, G.S.; Bjerre, E.; White, H.M. Estimated golden eagle mortality from wind turbines in the western United States. Biol. Conserv. 2025, 302, 110961. [Google Scholar] [CrossRef]
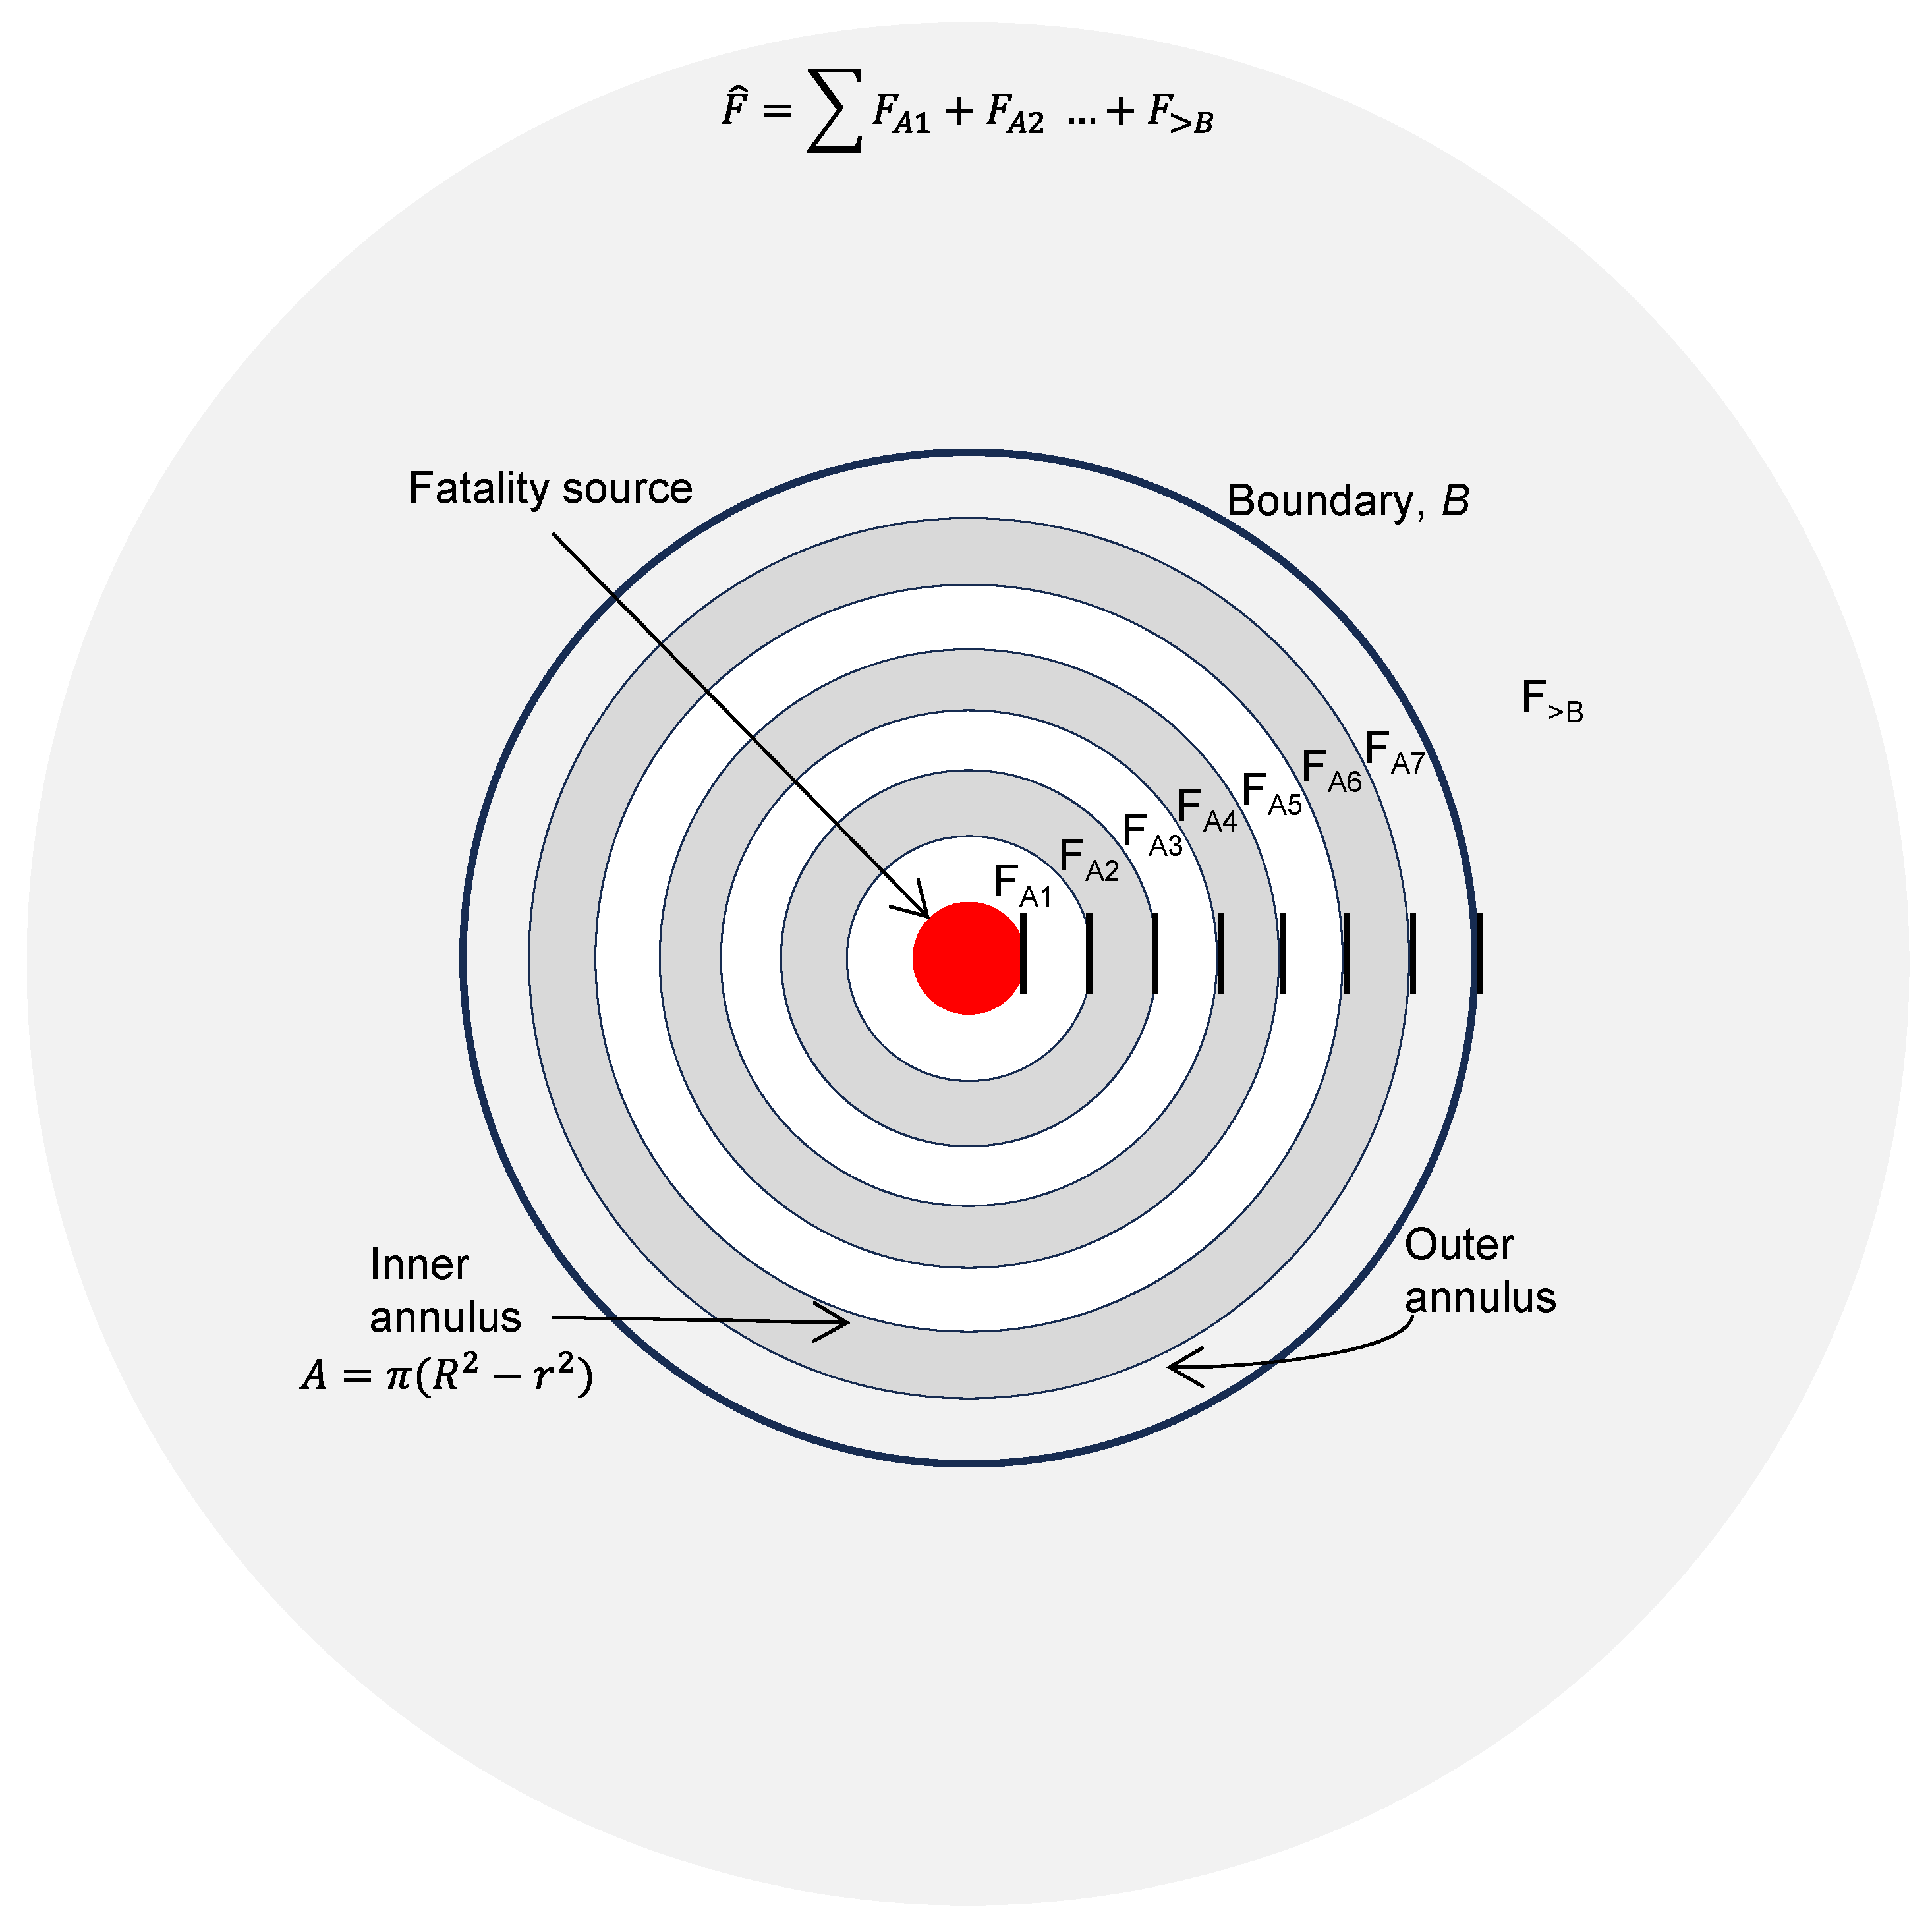
Figure 1. Generalized (not to scale) depiction of a source of collision fatalities, which is the darkened circle representing a wind turbine, and sequentially larger annuli (gray/white rings) bounded by regular distance increments (vertical lines) extending to the fatality search area boundary (dark outer circle) beyond which is the region (gray) in which carcasses can deposit without detection. FA1 to F>B denote numbers of fatalities represented by nearest carcass remains to the turbine, all of which should sum to the total cumulative number of fatalities not including those undetected due to searcher error, insufficient carcass persistence, and crippling bias—the number of mortally injured animals that left the search area without leaving a trace of evidence to be found.
Diversity 17 00686 g001
Figure 2. Within sequentially larger annuli between Smøla Windmark wind turbines and an approximately 100 m fatality search boundary, the number of eagle fatalities within each annulus (red circles) did not change significantly with increasing 5 m distance increments from the turbine when measured linearly (dashed line) though it did so weakly when measured quadratically (solid line) (A), whereas the area of each annulus increased linearly with increasing 5 m distance increments from the turbine (B), and the ratio of the former to the latter yielded a complex pattern of carcass densities mostly influenced by annulus area (C). Vertical lines represent search area boundaries.
Diversity 17 00686 g002
Figure 3. Within the Altamont Pass Wind Resource Area, California, the number of eagle fatalities per annulus (red circles) did not change significantly with increasing 5 m distance increments from the turbines around which the fatality search area boundary was 105 m when measured linearly (dashed line) or quadratically (solid line) (A) or 75 m (B), but they declined significantly with increasing 5 m distance increments from first-generation wind turbines around which the fatality search area boundary was 50 m (C), where B = search area boundary defined by maximum search radius, HH = wind turbine hub height (m), range refers to the hub heights of the few wind turbines at the extremes, and solid lines represent least-square regression model fits an dashed lines represent 95% confidence intervals.
Diversity 17 00686 g003
Figure 4. Within the Altamont Pass Wind Resource Area, California, the density of eagle carcasses per annulus (red circles) related complexly with increasing 5 m distance increments from the turbines around which the fatality search area boundary was 105 m (A) or 75 m (B), due mostly to the effect of annulus area, but it declined significantly with increasing 5 m distance increments from the turbines around which the fatality search area boundary was 50 m (C). Vertical lines represent search area boundaries, beyond which no fatality searches were performed and data shown beyond the boundary were detected from within the boundary or found incidentally. The distance increment of 200 represents all distances beyond the search area boundary >125 m (>140 m in C), where B = search area boundary defined by maximum search radius, HH = wind turbine hub height (m), range refers to the hub heights of the few wind turbines at the extremes and the red line in A represents the nonlinear least-squares regression model fit to the data.
Diversity 17 00686 g004
Figure 5. Cumulative number of fatalities increased with 5 m distance increments from the turbine at nearly identical rates between the 100 m search area boundary at Smolen and the 105 m search area boundary in the APWRA until 75 m, beyond which eagle carcasses were found at a faster rate (A), and at these turbines and other APWRA turbines searched to 75 m and 50 m boundaries, models fit to the data within B predicted many more eagle carcasses far beyond the boundaries (B,C). Vertical lines represent search area boundaries, beyond which no fatality searches were performed and data shown beyond the boundary were detected from within the boundary or found incidentally. The distance increment of 200 represents all distances beyond the search area boundary >150 m. And B = search area boundary defined by maximum search radius, HH = wind turbine hub height (m), and range refers to the hub heights of the few wind turbines at the extremes.
Diversity 17 00686 g005
Figure 6. Normalized to a common scale of 0 (minimum number of carcasses) and 1 (maximum number of carcasses), the cumulative number of carcasses increased with 5 m distance increments from the turbine at the fastest rate at Smøla, likely because the model asymptote at Smøla was relatively smaller than it was for the search areas in the APWRA. Vertical lines represent the search area boundaries, beyond which no fatality searches were performed.
Diversity 17 00686 g006
Figure 7. Model-predicted asymptotes of cumulative fatalities were themselves a function of search area boundaries truncated at 10 m distance intervals from the turbines at Smøla, but they were more erratic when truncated at 15 m distance intervals at APWRA turbines searched to 105 m boundaries (A), and inversely related to 5 m distance truncated intervals at APWRA turbines searched to 50 m boundaries (B), where B = search area boundary defined by maximum search radius, HH = wind turbine hub height (m), and range refers to the hub heights of the few wind turbines at the extremes.
Diversity 17 00686 g007
Figure 8. Human searchers found more eagle carcasses than did dog searchers at APWRA turbines searched to 105 m, and the number of eagle carcasses accumulated faster with increasing distance from the turbine at distances >65 m (A), but normalized to a common scale to account for differences in model-predicted total fatalities, dogs appeared to be on a quicker pace to reach their predicted total number of carcasses (B). At these same turbines, searches at 28-day intervals found 3 times the number of eagle carcasses as did searches at 7-day intervals (C), but normalized to a common scale, the 7-day-search intervals appeared to more rapidly approach the model-predicted total number of carcasses (D). Vertical lines represent the search area boundary, beyond which no fatality searches were performed and data shown beyond the boundary were detected from within the boundary or found incidentally. The distance increment of 200 represents all distances beyond the search area boundary >125 m. Only data to the left of the vertical line were used to fit the models.
Diversity 17 00686 g008
Figure 9. Golden Hills wind turbine 59, representing a generalized turbine location in the APWRA, with the locations of nearest remains of 90 Golden Eagle carcasses, actual and superimposed, indicated by pins, within and beyond the 105 m search area boundary. The circled pins identify 5 eagle carcasses that were actually deposited by turbine 59, whereas the uncircled pins identify Golden Eagle carcass remains found at their respective locations at other modern turbines in the APWRA. The arrows indicate prevailing wind directions, their widths indicative of relative prevalence based on wind measurements recorded during 16,061 use and behavior sessions at 377 stations across 11 studies and 26 years. Although eagle carcasses were found throughout the search area and beyond, they were concentrated downwind of the prevailing wind direction. Carcasses shown beyond the 105 m search area boundary were detected incidentally or from within the search boundary during fatality searches, and are necessarily an underrepresentation of the actual number deposited.
Diversity 17 00686 g009
Figure 10. Golden Eagle blood smear located 4 m from the tip of a blade of Golden Hills wind turbine 15 in the Altamont Pass Wind Resource Area on 30 July 2019 (A); and the torso, head, and wings located 20 m north of the turbine’s tower (B).
Diversity 17 00686 g010aDiversity 17 00686 g010b
Table 1. Summary of wind turbine and fatality search attributes relevant to the spatial distribution of carcasses around wind turbines resulting from collision mortality at the Smøla Vindpark, Island of Smøla, Norway, and the Altamont Pass Wind Resource Area, California, USA. Fatality search efforts highlighted in light gray were withheld from most hypothesis tests herein due to inadequate sample size of eagle carcasses.
SiteProject NameB aModelMWNo. of TurbinesHub Height (m)Blade Length (m)Period of Fatality FindsYears of Scientific Searches
SmølaSmøla Vindpark100Bonus22070392005–2020≥5 b
SmølaSmøla Vindpark100Siemens2.34870412005–2020≥5
APWRAVasco Winds105Siemens2.3348046.52012–20234
APWRAGolden Hills105GE1.794880502015–20236
APWRAGolden Hills North105GE2.32080552017–20213
APWRASummit Winds122GE2.72390582021–20232
APWRABuena Vista75Mitsubishi13845–6030.72008–20234
APWRADiablo Winds75Vestas0.663150–5523.52005–20196
APWRATres Vaqueros60Howden0.338525.215.72005–20083
APWRAKenetech60KVS-330.44124.616.62002–201111.5
APWRAOlder projects50Varied c0.04–0.25 d4400 d14–43 d6.67–12.6 d1991–201413.5
a B = outer boundary of search area. b The duration of scientific fatality searches was not reported [10]. c Enertech, Vestas, KCS-56, Bonus, Nordtank, Polenko, Windmatic, Windmaster, Micon, Danwin, Flowind, W.E.G. d About 4400 turbines were searched over various study periods; the number surveyed and the years of duration of searches varied among studies.
Table 2. The number of fatalities in the table resulted largely from search effort, which varied in maximum fatality search radius, B, number of searches, and number of years of fatality searching; they do not represent mortality estimates. Note that no predictions of total fatalities based on carcass density are presented because no such predictions can be made without specifying the fatality search radius. Data were from Smøla [10] and from the APWRA [16,17,18,19,20,21,23].
SiteB (m)SearcherNumber of Dead or Injured Eagles a Found Relative to BMissing Distance DataNumber Found Injured and Alive Relative to BTotal Fatalities
Predicted by Spatial Pattern of Those Found
B Predicted to Include 99% of Predicted Total Fatalities
WithinBeyondWithinBeyond
Smøla100Dogs70 b2354180>250 m
APWRA105Dogs34500041>250 m
APWRA105Humans48331273>250 m
APWRA105Dogs, humans828312109>250 m
APWRA75Humans13322937>250 m
APWRA60Humans52610----
APWRA50Humans4518191113770>250 m
APWRA122Dogs, humans31000----
a Eagle fatalities for which distances between the turbines and nearest remains were recorded. b Omitted 1 eagle for having fallen into a pond and was unrecoverable, and 2 eagles for having been found outside the maximum search radius [10].
Table 3. Within actual and truncated fatality search boundaries, coefficients and model performance diagnostics (coefficient of determination and loss) of best-fit nonlinear models of the form F ^ = 1 1 a + b X + 1   c , where F ^ was the predicted number of eagle fatalities found X m from the turbine (expressed in 5 m intervals), a was the predicted asymptote of fatalities, and b and c were additional least-squares fitted parameter values. B was the actual search area boundary, and B− represented the truncated search area boundary. Gray-shaded entries are models best-fit to hypothetical reallocations of one fatality from the 10–15 m annulus to the farthest 5 m annulus within the search area.
SiteB (m)B− (m)SearcherSearch Interval (Days)r2LossBest-Fit Model Coefficient
abc
Smøla100 Dogs140.99559.679.88656291.900454−2.363510
Smøla100 Dogs140.990147.777.416820124.663951−2.44090
APWRA105 Both7/280.99770.2108.95111291.163916−2.212563
APWRA105 Both7/280.99669.34108.452852112.099593−2.253900
APWRA105 Dogs7/280.99223.641.354492148.352762−2.226929
APWRA105 Humans7/280.99147.372.814355178.752156−2.181351
APWRA75 Humans140.9805.137.050833414.919661−1.207624
APWRA50 Humans391.00060.6770.1982140.097667−1.200675
Smøla10085Dogs140.99457.282.09528075.939015−2.303190
Smøla10070Dogs140.99153.977.025654106.924085−2.414876
Smøla10055Dogs140.98650.675.735805120.658744−2.453624
Smøla10040Dogs140.9966.340.35991810,950.091478−3.999281
Smøla10025Dogs140.9973.133.11622912,169.987229−4.074688
APWRA105110Both7/280.99670.5110.15513267.617923−2.146074
APWRA105100Both7/280.99670.5110.61282066.242457−2.139995
APWRA10590Both7/280.99562.1123.12451044.368496−2.018889
APWRA10580Both7/280.99454.6138.20156732.812300−1.925618
APWRA10570Both7/280.99341.099.51855173.102395−2.180825
APWRA10560Both7/280.99325.4246.38291823.377978−1.800482
APWRA10550Both7/280.98723.9153.37322029.813167−1.889620
APWRA10540Both7/280.9963.630.8765273206.361800−3.559384
APWRA10530Both7/280.9993.233.6448292284.736900−3.420503
APWRA5045Humans390.99960.5769.5135300.097643−1.200765
APWRA5040Humans390.99969.0782.3441630.096261−1.192976
APWRA5035Humans390.99857.9803.3702340.094283−1.181454
APWRA5030Humans390.99953.2870.0624240.089872−1.153420
APWRA5025Humans390.99919.41492.1410110.076352−1.046971
APWRA105 Both70.98015.519.600750274.133735−2.240290
APWRA105 Both280.99271.176.879764422.339737−2.489426
Table 4. Comparison of observed and predicted eagle fatality counts within the established search areas, B, of 100 m at Smola and 105 m at modern wind turbines in the Altamont Pass Wind Resource Area (APWRA), and of predicted total fatalities within the maximum search radius, B ^ , predicted by the cumulative carcass count model to include all fatalities, or in the case of the carcass density model, arbitrarily established at 250 m. Also compared are model predictions based on the reallocation of one carcass from the 10–15 m search annulus to the outer search annulus.
Method of PredictionFatalities Within B Fatalities   Within   B ^
(≥250 m from Turbine)
SmølaAPWRASmølaAPWRA
Found by searching and used for prediction70.082.0
Carcass density model66.782.3118.5177.0
Cumulative count model70.281.680.0109.0
After 1 carcass reallocated to outer search annulus:
Carcass density model62.083.0106.8179.6
Cumulative count model68.981.577.4108.5
Disclaimer/Publisher’s Note: The statements, opinions and data contained in all publications are solely those of the individual author(s) and contributor(s) and not of MDPI and/or the editor(s). MDPI and/or the editor(s) disclaim responsibility for any injury to people or property resulting from any ideas, methods, instructions or products referred to in the content.