
Impacts of El Niño–Southern Oscillation (ENSO) Events on Trophodynamic Structure and Function in Taiwan Bank Marine Ecosystem

 , ,
, ,
Abstract
1. Introduction
2. Materials and Methods
2.1. The Study Area
2.2. Data Collection and EwE Modeling
2.3. Ecosystem Attributes

| Groups | Common Name | P/B | Q/B | DC | |
|---|---|---|---|---|---|
| Predator fish | Thunnus albacares | Yellow fin tuna | Fishbase | Fishbase | Fishbase, SeaLife Base, The Fish Database of Taiwan |
| Katsuwonus pelamis | Skipjack tuna | Fishbase | Fishbase | ||
| Coryphaena hippurus | Dolphinfish | Fishbase | Fishbase | ||
| Scomberomorus commerson | Spanish mackerel | Fishbase | Fishbase | ||
| Pelagic fish | Scomber australasicus | Spotted mackerel | Duan [52] | Fishbase | |
| Scomber japonicus | Chub mackerel | Duan [52] | Fishbase | ||
| Trachurus japonicus | Japanese jack mackerel | Duan [52] | Fishbase | ||
| other mackerels | other mackerels | Duan [52] | Fishbase | ||
| Auxis rochei rochei | Bullet tuna | Duan [52] | Fishbase | ||
| Small pelagic fish | Etrumeus micropus | Pacific round herring | Duan [52] | Fishbase | |
| Sardinella spp. | Sardinella spp. | Duan [52] | Fishbase | ||
| Decapterus maruadsi | Round scad | Lin [53] | Fishbase | ||
| Benthic and Reef fish | Seriola dumerili | Amberjack | Lin [53] | SeaLife Base | |
| Mene maculata | Moonfish | Lin [53] | Fishbase | ||
| Decapterus kurroides | Mackerel scad | SeaLife Base | Fishbase | ||
| Polydactylus sextarius | Polynemid fish | Duan [52] | SeaLife Base | ||
| Cephalopod | Uroteuthis chinensis | Mitre squid | Lin [53] | Lin [53] | |
| Loliginidae | Squids | Lin [53] | Lin [53] | ||
| Crustaceans | Portunus sanguinolentus | Portunus sanguinolentus | Lin [53] | Lin [53] | |
| Penaeus japonicus | Penaeus japonicus | Wang [54] | Wang [55] | ||
| Penaeus penicillatus | Penaeus penicillatus | Wang [54] | Wang [55] | ||
| Metapenaeopsis barbata | Metapenaeopsis barbata | Wang [54] | Wang [55] | ||
| Metanephrops thomsoni | Metanephrops thomsoni | Wang [54] | Wang [55] | ||
| Zooplankton | Zooplankton_P | Zooplankton_Pelagic | Lin [53] | Lin [53] | |
| Zooplankton_B | Zooplankton_Benthic | Lin [53] | Lin [53] | ||
| Phytoplankton | Phytoplankton_P | Phytoplankton_Pelagic | Lin [53] | ||
| Phytoplankton_B | Phytoplankton_Benthic | Lin [53] | |||
| Detritus | Detritus | Detritus |
| No. | Group Name | Group Name | El Niño Biomass (t/km2) | La Niña Biomass (t/km2) | Normal Biomass (t/km2) | El Niño Landing (t/Year) | La Niña Landing (t/Year) | Normal Landing (t/Year) | P/B (/Year) | Q/B (/Year) | P/Q (/Year) | |
|---|---|---|---|---|---|---|---|---|---|---|---|---|
| Predator fish | 1 | Thunnus albacares | Yellow fin tuna | 0.822 | 1.019 | 0.704 | 0.287 | 0.494 | 0.449 | 2.65 | 11.64 | 0.228 |
| 2 | Katsuwonus pelamis | Skipjack tuna | 0.455 | 0.518 | 0.380 | 0.158 | 0.280 | 0.294 | 2.62 | 12.53 | 0.209 | |
| 3 | Coryphaena hippurus | Dolphinfish | 1.366 | 0.046 | 0.248 | 0.114 | 0.001 | 0.211 | 3.71 | 8.48 | 0.438 | |
| 4 | Scomberomorus commerson | Spanish mackerel | 0.212 | 0.615 | 0.598 | 0.796 | 0.005 | 0.861 | 4.5 | 11.4 | 0.395 | |
| Pelagic fish | 5 | Scomber australasicus | Spotted mackerel | 3.519 | 4.187 | 2.136 | 1.470 | 1.613 | 1.358 | 4.3 | 8.8 | 0.489 |
| 6 | Scomber japonicus | Chub mackerel | 2.275 | 0.980 | 2.423 | 0.167 | 0.156 | 0.066 | 4.8 | 11.7 | 0.410 | |
| 7 | Trachurus japonicus | Japanese jack mackerel | 1.240 | 0.684 | 0.607 | 1.494 | 1.037 | 1.247 | 4.11 | 10 | 0.411 | |
| 8 | other mackerels | other mackerels TD | 4.724 | 18.574 | 0.052 | 0.062 | 0.111 | 0.002 | 2.22 | 9.6 | 0.231 | |
| 9 | Auxis rochei rochei | Bullet tuna | 1.302 | 1.269 | 0.568 | 0.065 | 0.151 | 0.201 | 4.8 | 10.6 | 0.453 | |
| Small pelagic fish | 10 | Etrumeus micropus | Pacific round herring | 2.898 | 1.910 | 3.778 | 0.366 | 0.125 | 0.610 | 4.2 | 14.04 | 0.299 |
| 11 | Sardinella spp. | Sardinella spp. | 3.699 | 19.140 | 2.149 | 0.605 | 0.100 | 0.457 | 5.1 | 11.6 | 0.440 | |
| 12 | Decapterus maruadsi | Round scad | 8.381 | 10.317 | 1.239 | 0.823 | 0.072 | 0.104 | 3.1 | 9.08 | 0.341 | |
| Benthic and Reef fish | 13 | Seriola dumerili | Amberjack | 2.177 | 3.188 | 1.946 | 0.219 | 0.023 | 0.280 | 1.2 | 3.3 | 0.364 |
| 14 | Mene maculata | Moonfish | 8.099 | 5.739 | 2.188 | 4.574 | 0.472 | 2.965 | 2.64 | 6.7 | 0.394 | |
| 15 | Decapterus kurroides | Mackerel scad | 5.306 | 1.967 | 2.004 | 0.369 | 0.078 | 0.112 | 1.97 | 7.1 | 0.277 | |
| 16 | Polydactylus sextarius | Polynemid fish | 0.444 | 0.368 | 0.718 | 0.117 | 0.052 | 0.025 | 2.34 | 11.1 | 0.211 | |
| Cephalopod | 17 | Uroteuthis chinensis | Mitre squid | 1.248 | 1.872 | 1.322 | 0.207 | 0.207 | 0.328 | 4.7 | 11.64 | 0.404 |
| 18 | Loliginidae | Squids | 0.355 | 0.202 | 1.279 | 0.123 | 0.007 | 0.422 | 4.7 | 11.64 | 0.404 | |
| Crustaceans | 19 | Portunus sanguinolentus | Portunus sanguinolentus | 0.127 | 0.051 | 0.038 | 0.040 | 0.050 | 0.072 | 4.93 | 14.5 | 0.340 |
| 20 | Penaeus japonicus | Penaeus japonicus | 0.046 | 0.038 | 0.033 | 0.045 | 0.066 | 0.065 | 8.6 | 15.6 | 0.551 | |
| 21 | Penaeus penicillatus | Penaeus penicillatus | 0.158 | 0.086 | 0.097 | 0.008 | 0.094 | 0.058 | 8.6 | 15.6 | 0.551 | |
| 22 | Metapenaeopsis barbata | Metapenaeopsis barbata | 0.269 | 0.184 | 0.159 | 0.316 | 0.115 | 0.131 | 7.6 | 12.22 | 0.622 | |
| 23 | Metanephrops thomsoni | Metanephrops thomsoni | 0.597 | 0.323 | 0.293 | 0.001 | 0.163 | 0.250 | 5.65 | 14.2 | 0.398 | |
| Zooplankton | 24 | Zooplankton_P | Zooplankton_P | 10 | 10 | 10 | 0 | 0 | 0 | 25 | 180 | 0.139 |
| 25 | Zooplankton_B | Zooplankton_B | 10 | 10 | 10 | 0 | 0 | 0 | 25 | 180 | 0.139 | |
| Phytoplankton | 26 | Phytoplankton_P | Phytoplankton_P | 22.1 | 22 | 21.5 | 0 | 0 | 0 | 106.52 | ||
| 27 | Phytoplankton_B | Phytoplankton_B | 22.1 | 22 | 21.5 | 0 | 0 | 0 | 106.52 | |||
| Detritus | 28 | Detritus | Detritus | 163.5 | 163.5 | 163.5 | 0 | 0 | 0 | |||
| Sum | 277.418 | 300.78 | 251.458 | 12.425 | 5.473 | 10.569 |
2.4. Model Balancing and Verification
2.5. Ecosystem Assessment and Statistical Analysis
2.5.1. Basic Ecosystem Indices
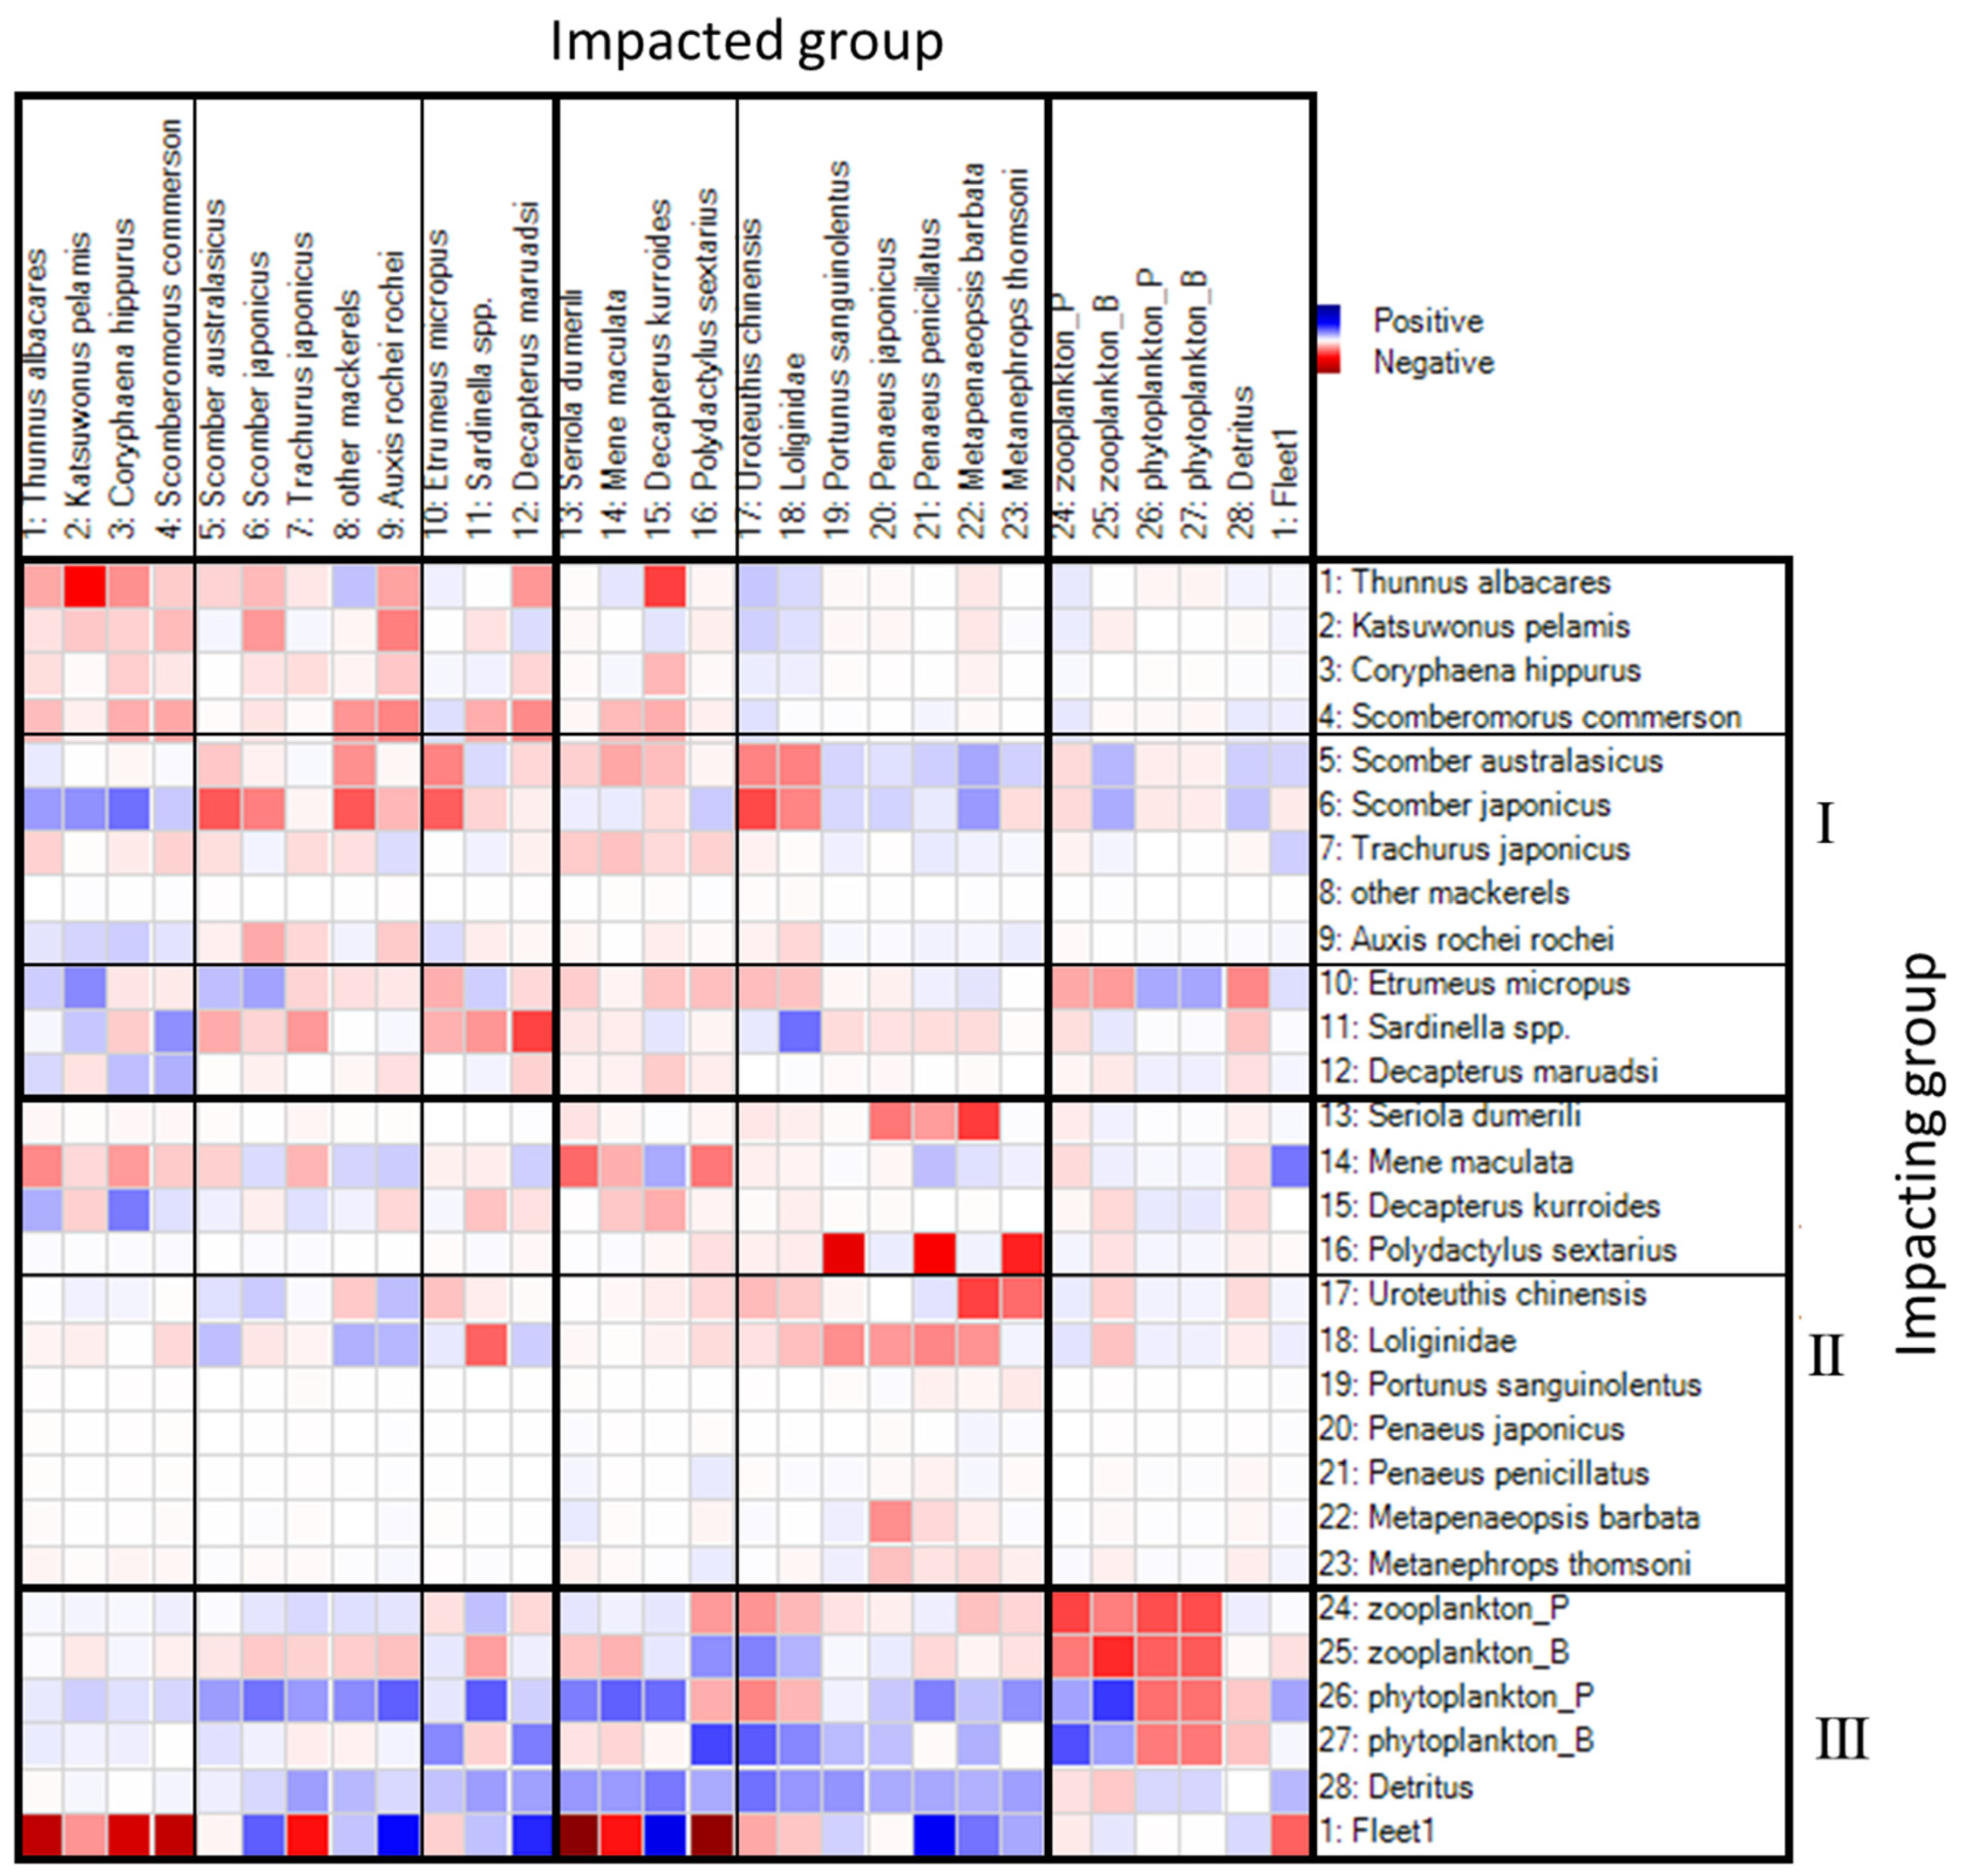
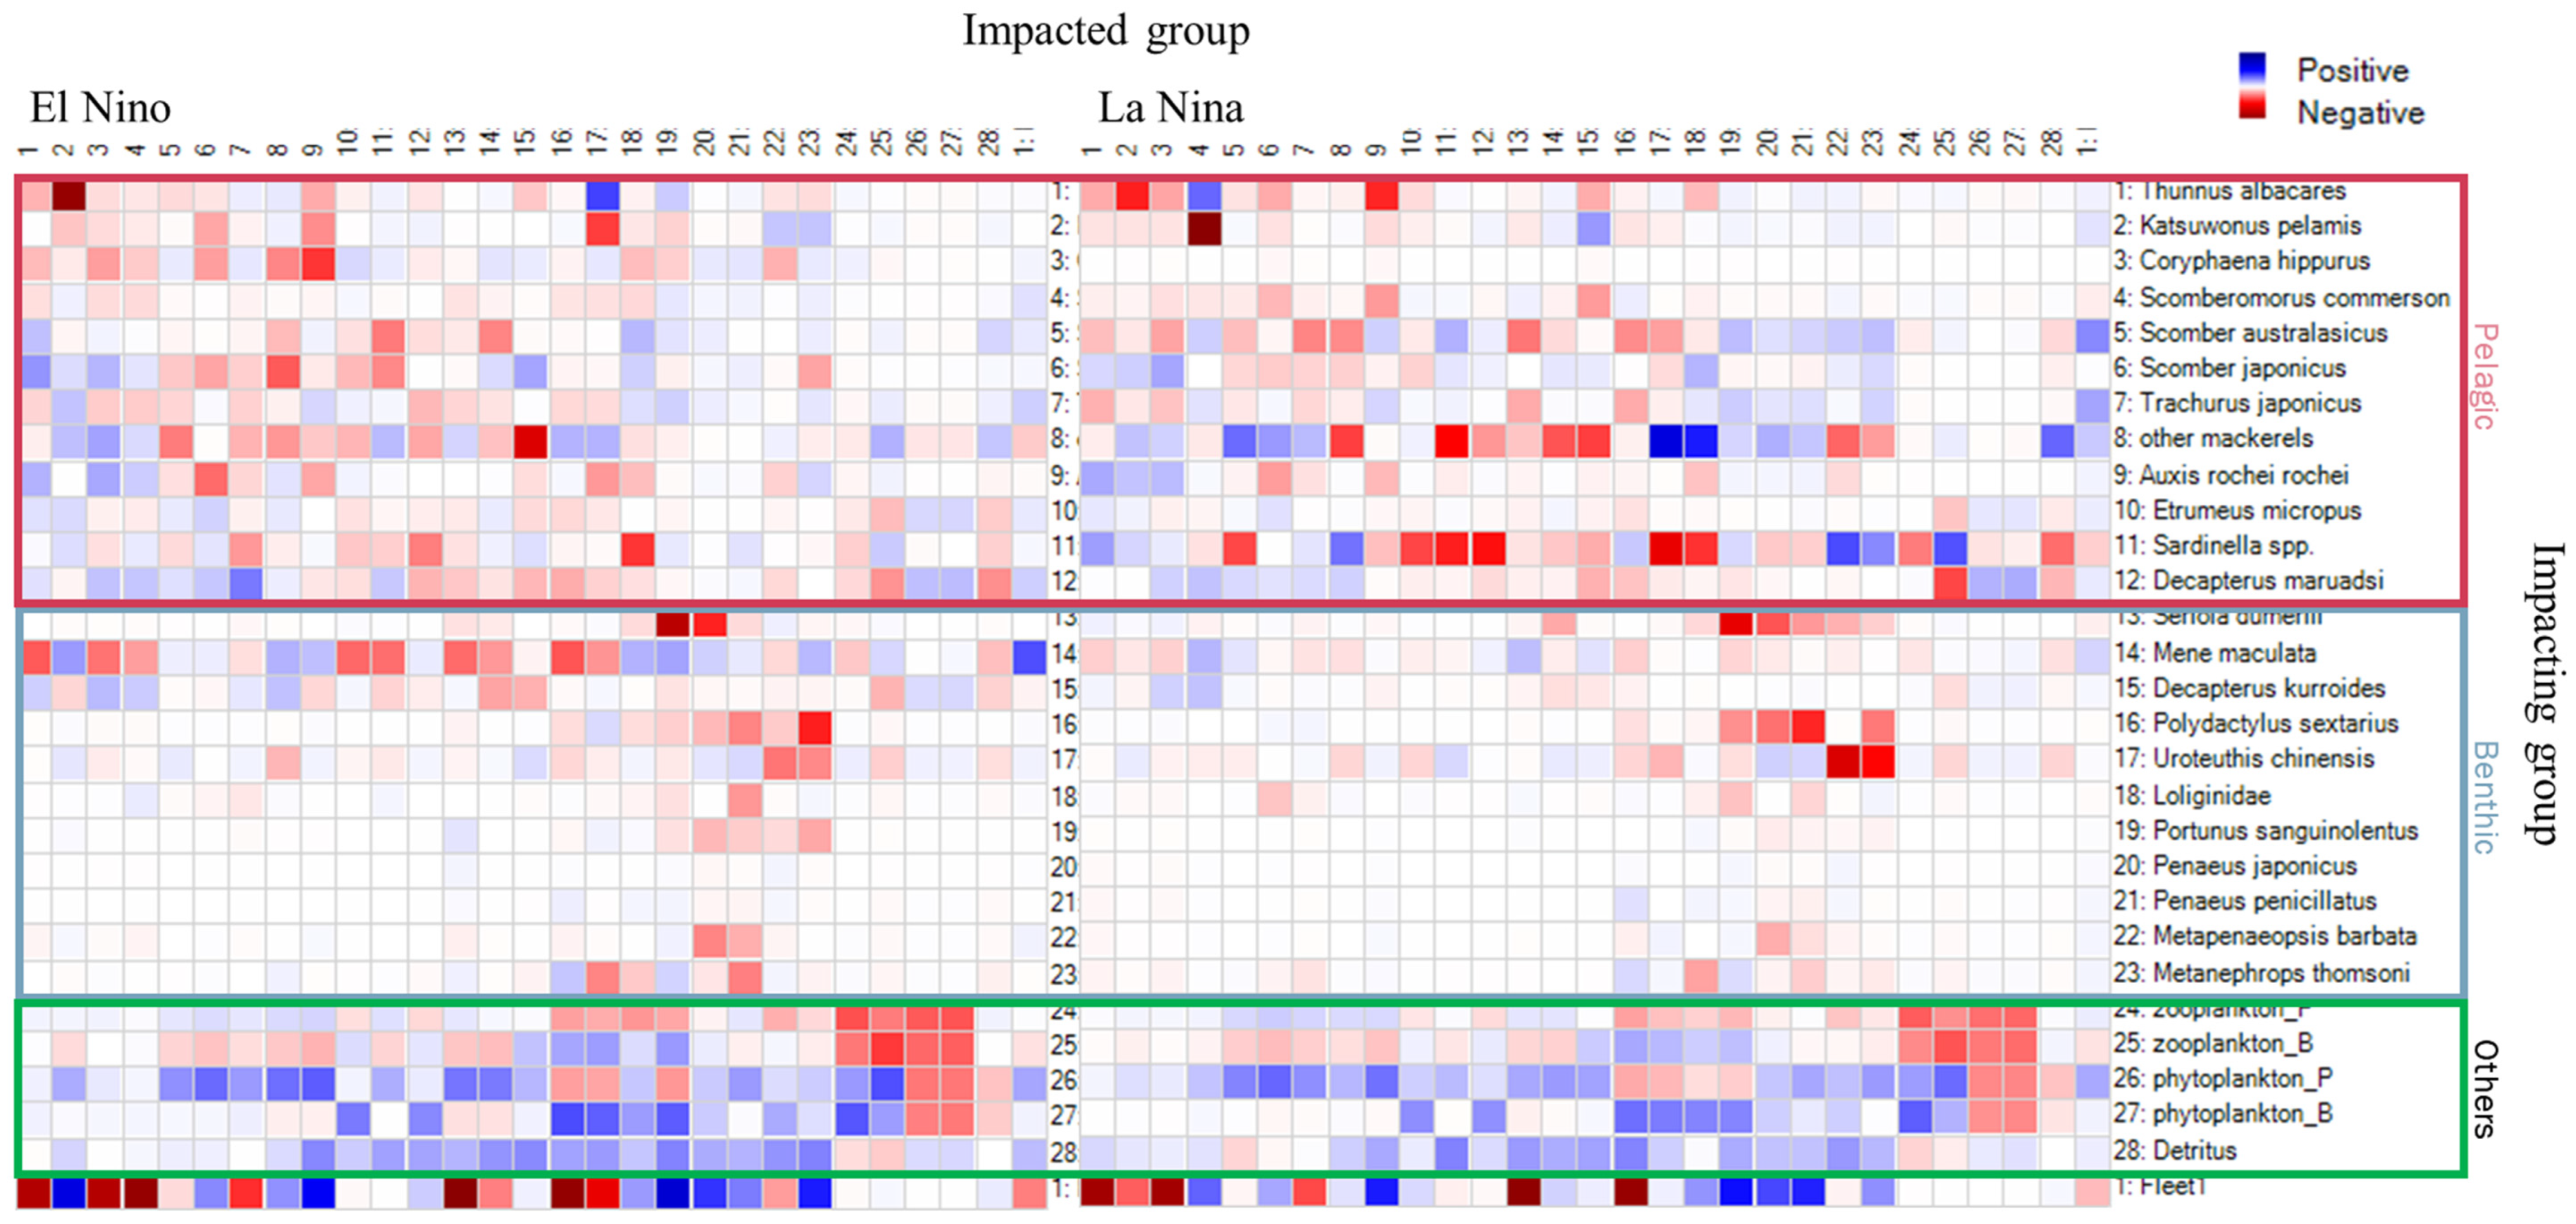
2.5.2. Mixed Trophic Impact Analysis
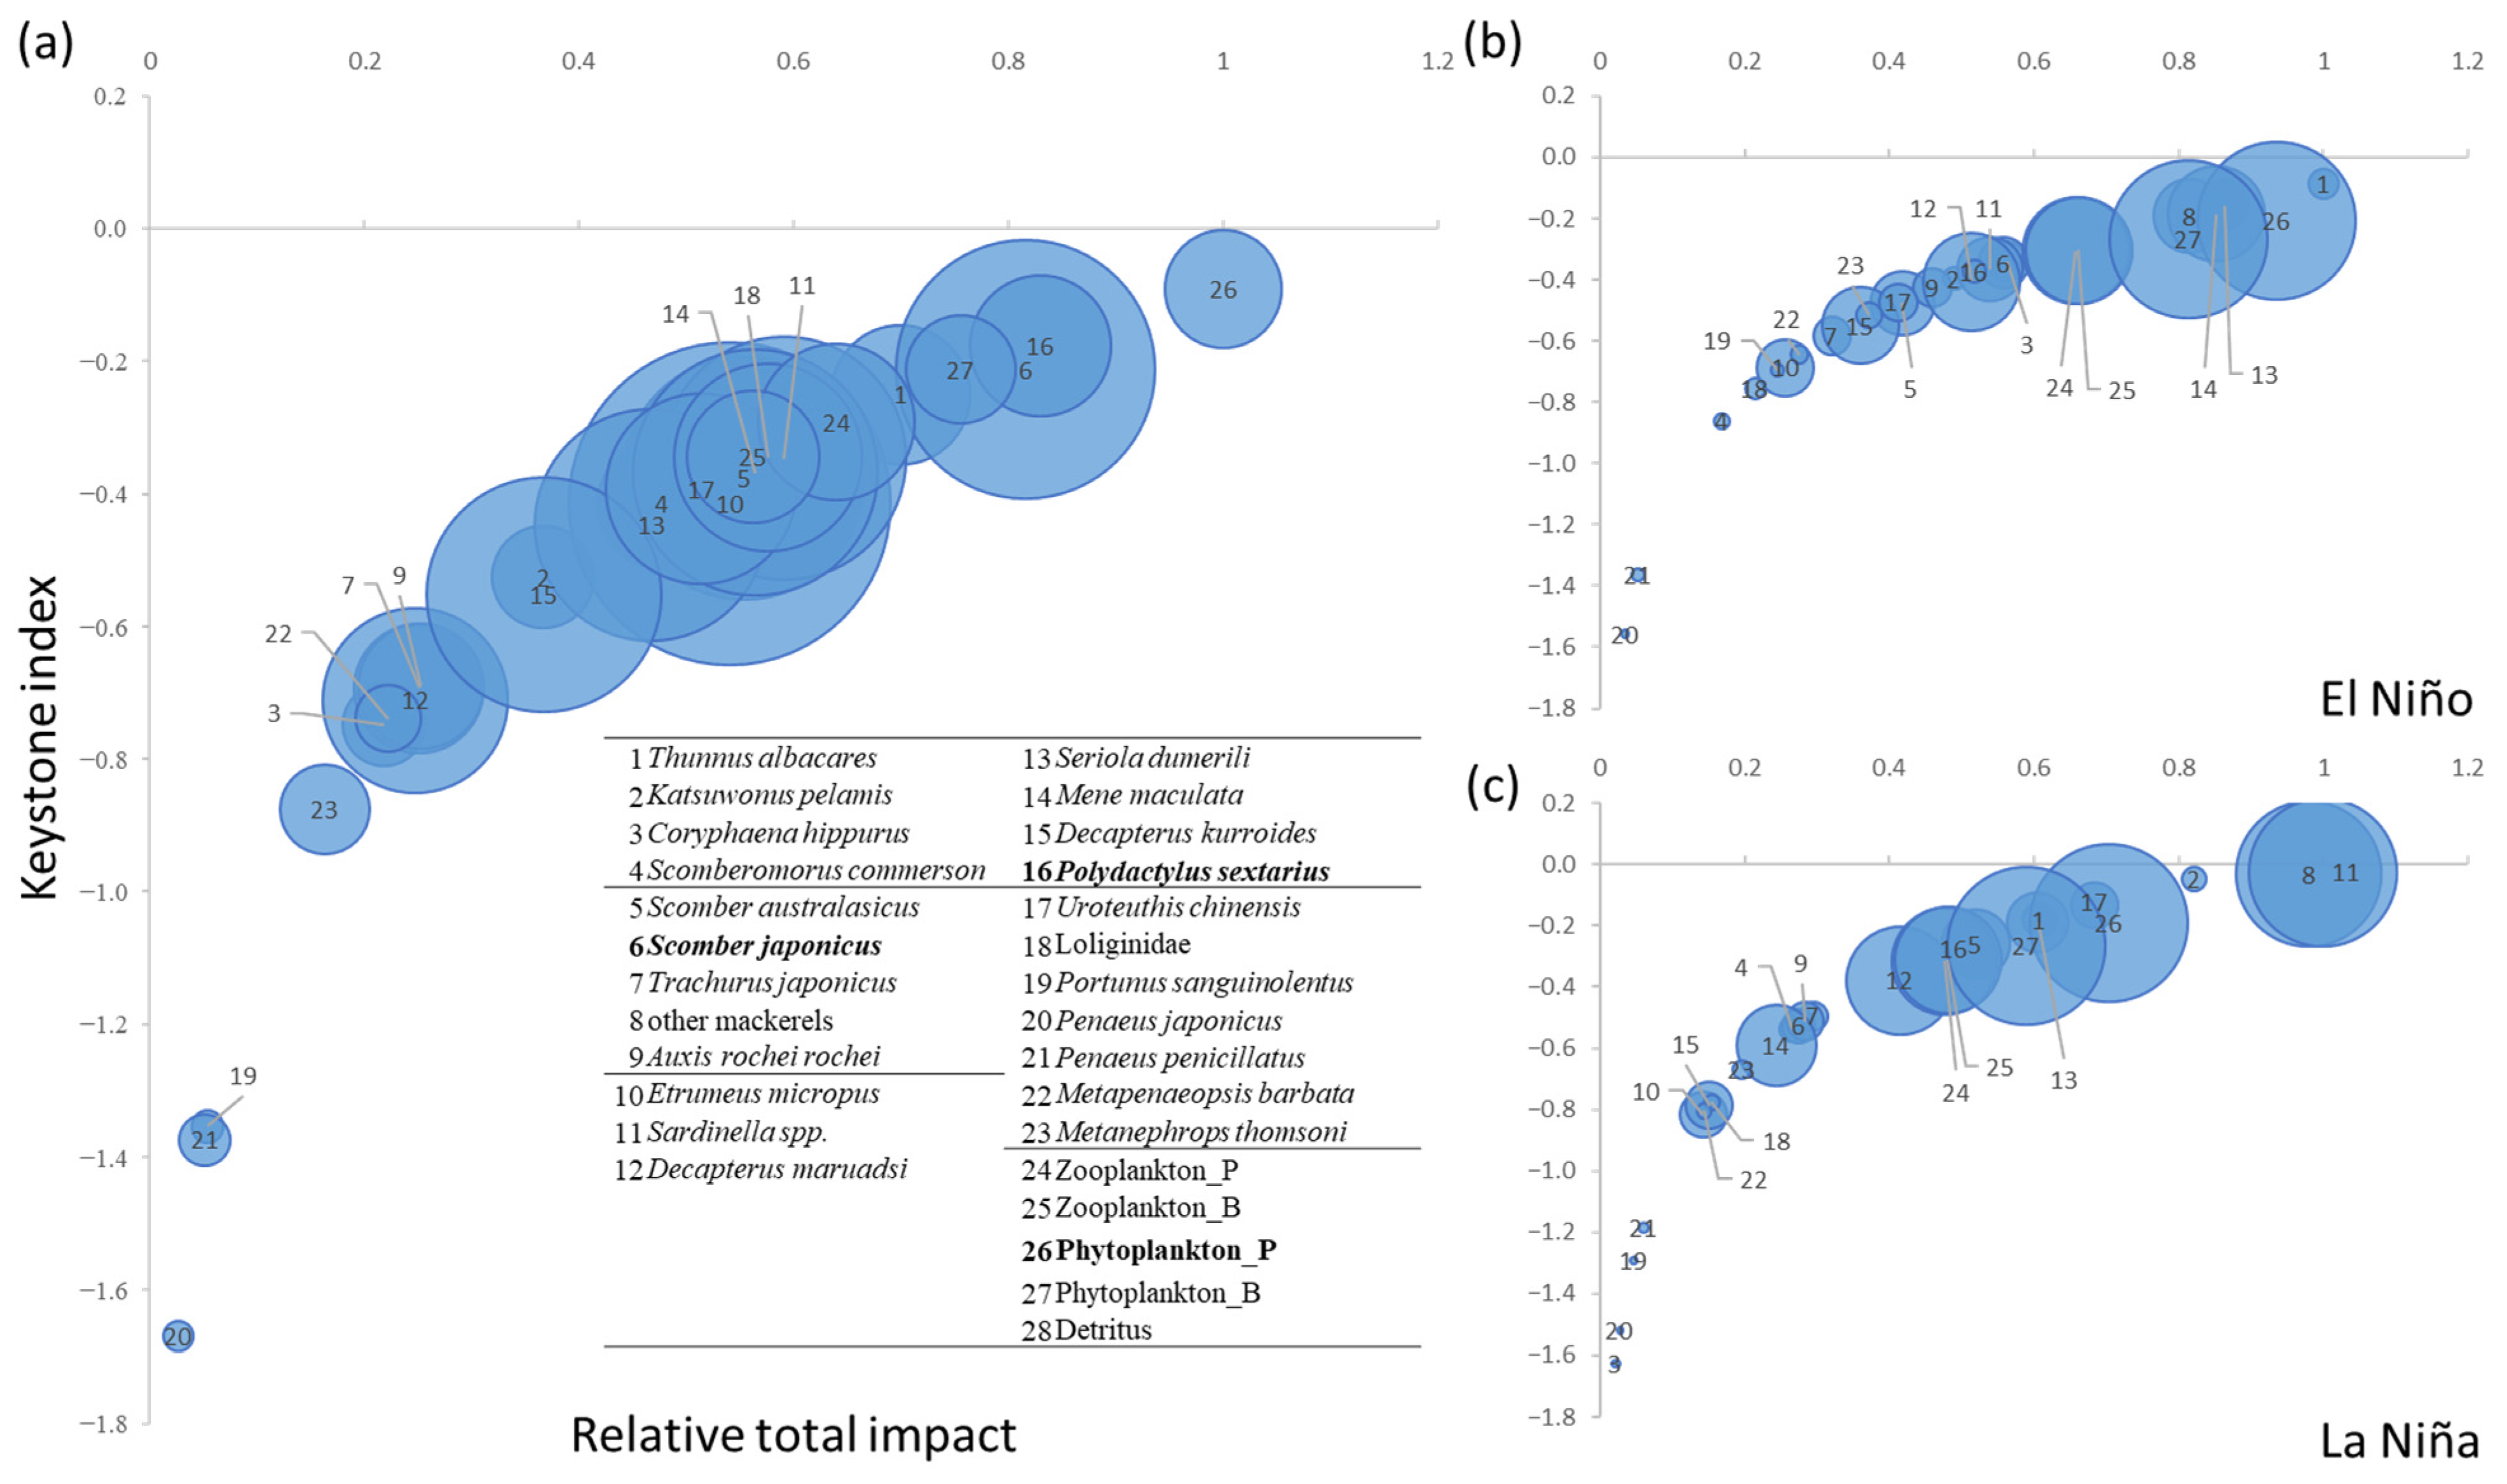
2.5.3. Keystoneness Index
2.5.4. Top–Down and Bottom–Up Effects
3. Results
3.1. TB Marine Ecosystem
3.2. Interspecies Relationships
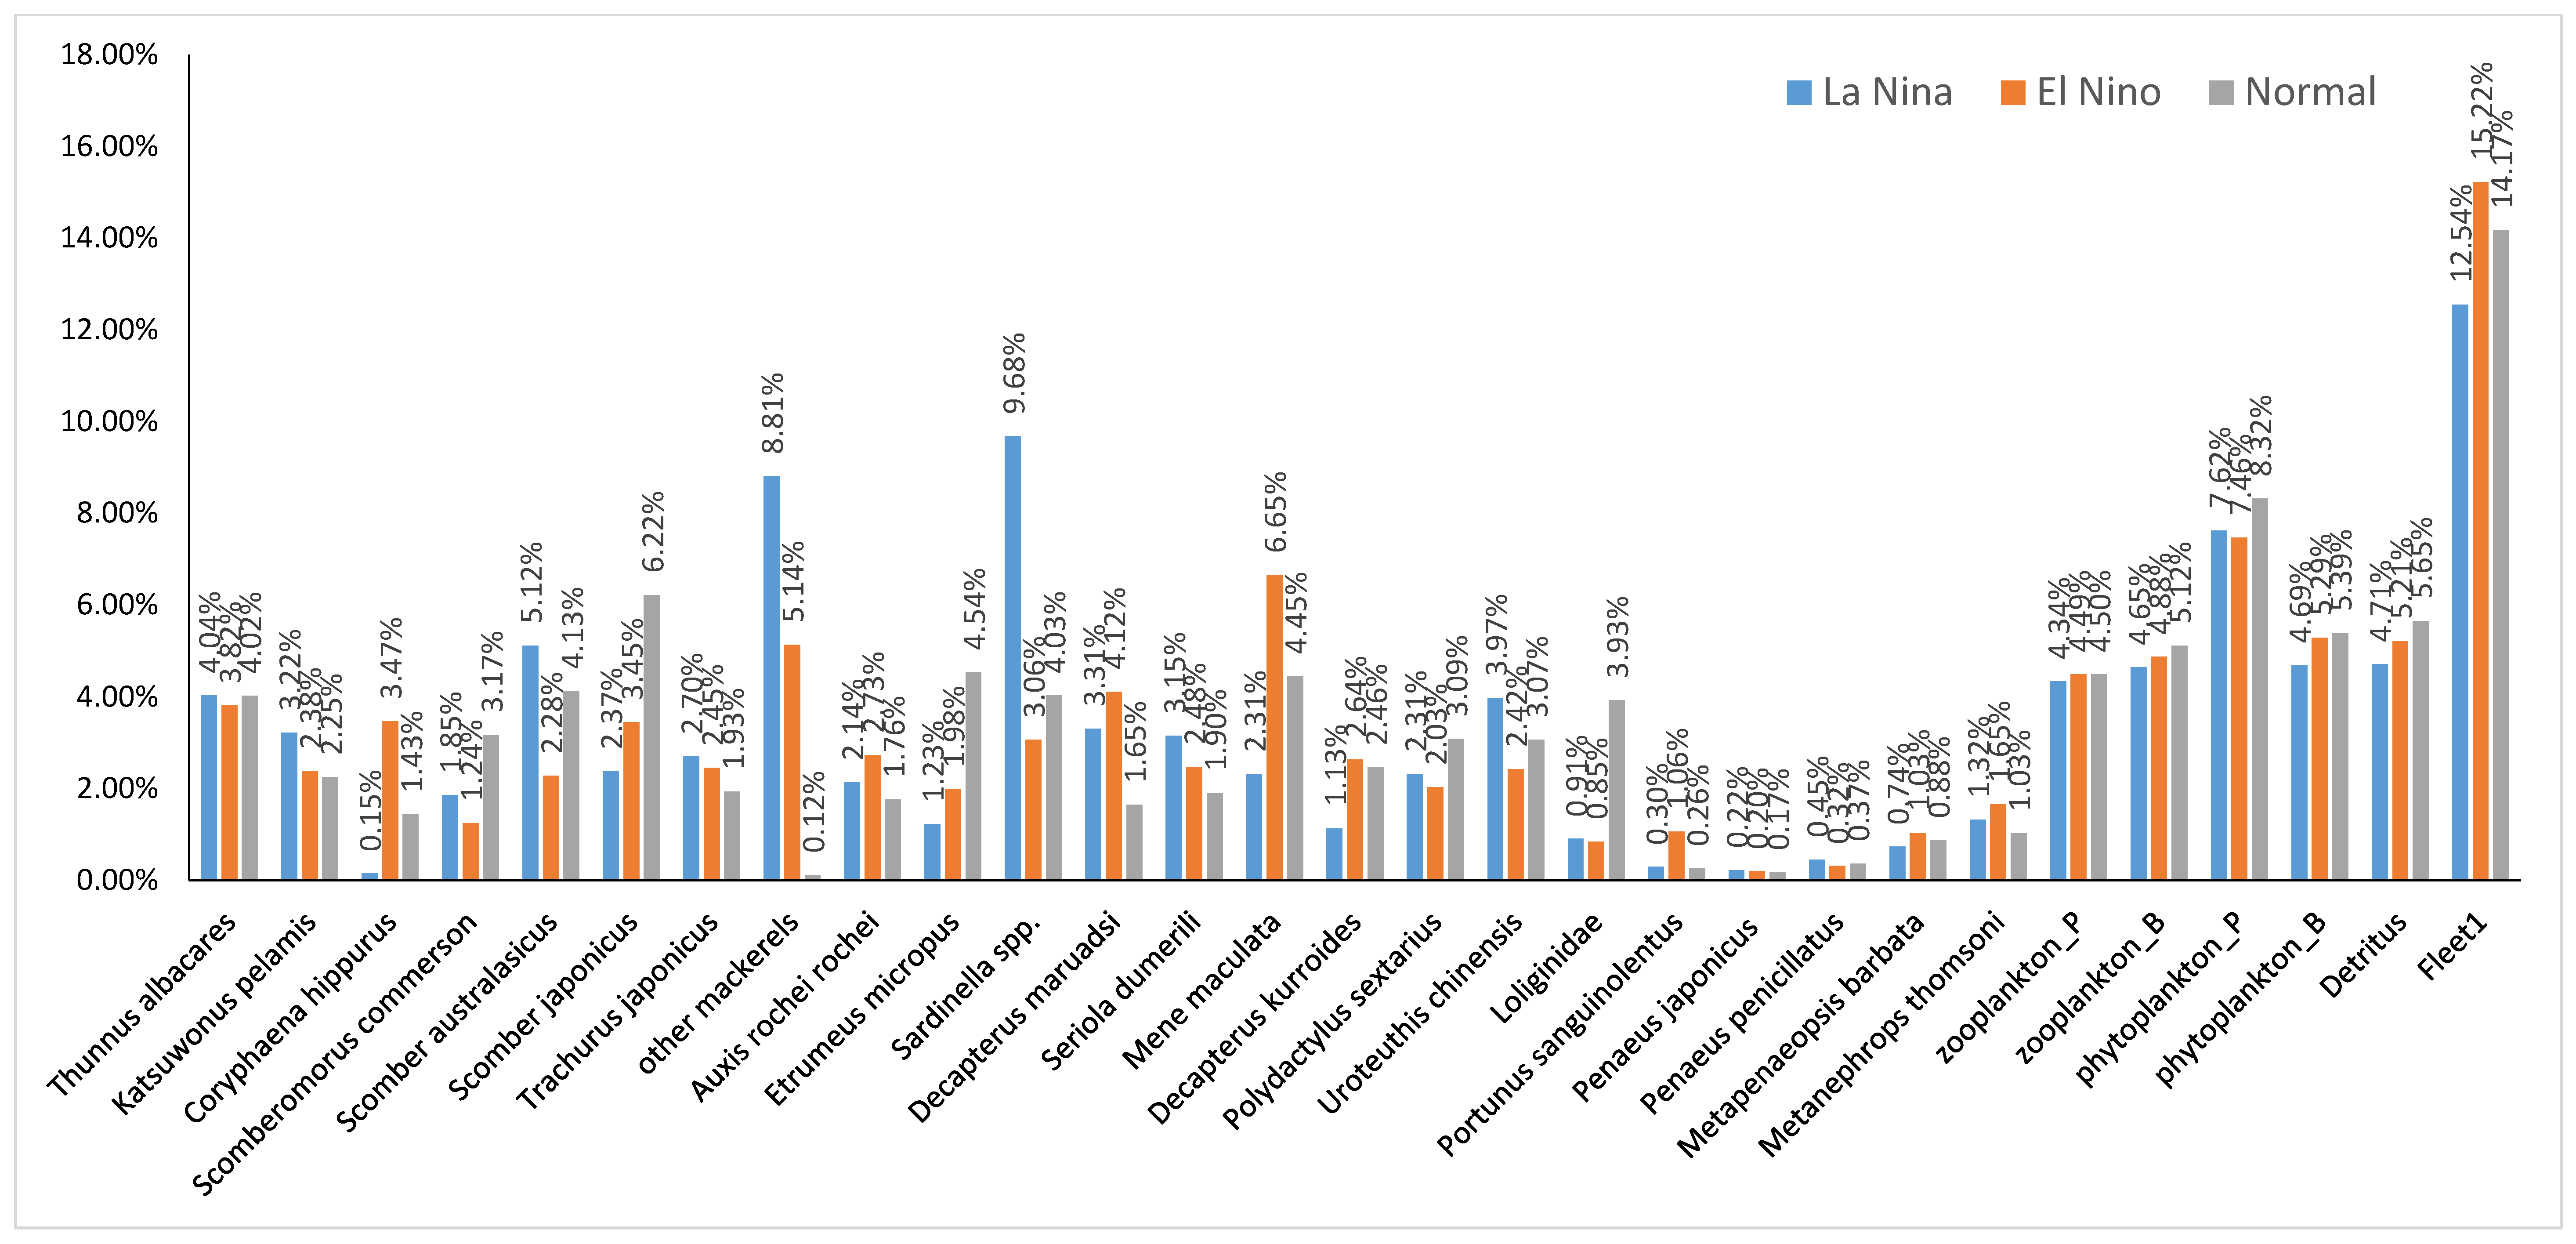
3.3. Climate-Induced Species Variation in TB Ecosystem
4. Discussion
4.1. TB Ecosystem Structure
4.2. Trophic Interactions in TB Ecosystem
4.3. Climate Impact on TB Ecosystem
5. Conclusions
Author Contributions
Funding
Institutional Review Board Statement
Informed Consent Statement
Data Availability Statement
Conflicts of Interest
Appendix A


| Prey\Predator | 1 | 2 | 3 | 4 | 5 | 6 | 7 | 8 | 9 | 10 | 11 | 12 | 13 | 14 | 15 | 16 | 17 | 18 | 19 | 20 | 21 | 22 | 23 | 24 | 25 | |
|---|---|---|---|---|---|---|---|---|---|---|---|---|---|---|---|---|---|---|---|---|---|---|---|---|---|---|
| 1 | Yellow fin tuna | 0 | 0 | 0 | 0 | 0 | 0 | 0 | 0 | 0 | 0 | 0 | 0 | 0 | 0 | 0 | 0 | 0 | 0 | 0 | 0 | 0 | 0 | 0 | 0 | 0 |
| 2 | Skipjack tuna | 0.02 | 0 | 0 | 0 | 0 | 0 | 0 | 0 | 0 | 0 | 0 | 0 | 0 | 0 | 0 | 0 | 0 | 0 | 0 | 0 | 0 | 0 | 0 | 0 | 0 |
| 3 | Dolphinfish | 0 | 0 | 0 | 0 | 0 | 0 | 0 | 0 | 0 | 0 | 0 | 0 | 0 | 0 | 0 | 0 | 0 | 0 | 0 | 0 | 0 | 0 | 0 | 0 | 0 |
| 4 | Spanish mackerel | 0 | 0.01 | 0 | 0 | 0 | 0 | 0 | 0 | 0 | 0 | 0 | 0 | 0 | 0 | 0 | 0 | 0 | 0 | 0 | 0 | 0 | 0 | 0 | 0 | 0 |
| 5 | Spotted mackerel | 0.15 | 0.1 | 0.1 | 0.1 | 0 | 0.05 | 0.07 | 0.04 | 0.06 | 0 | 0.05 | 0 | 0 | 0.07 | 0 | 0 | 0 | 0.02 | 0 | 0 | 0 | 0 | 0 | 0 | 0 |
| 6 | Chub mackerel | 0.25 | 0.363 | 0.292 | 0.147 | 0 | 0 | 0 | 0 | 0.133 | 0 | 0 | 0 | 0 | 0 | 0 | 0 | 0 | 0.073 | 0 | 0 | 0 | 0 | 0.055 | 0 | 0 |
| 7 | Japanese jack mackerel | 0.01 | 0.005 | 0.05 | 0.01 | 0.001 | 0.001 | 0 | 0.005 | 0.02 | 0 | 0.01 | 0 | 0 | 0.01 | 0 | 0 | 0 | 0.01 | 0.02 | 0 | 0 | 0 | 0 | 0 | 0 |
| 8 | other mackerels | 0 | 0.002 | 0.002 | 0.003 | 0.001 | 0.001 | 0.001 | 0 | 0 | 0 | 0 | 0 | 0 | 0 | 0 | 0 | 0.001 | 0 | 0 | 0 | 0 | 0 | 0 | 0 | 0 |
| 9 | Bullet tuna | 0.1 | 0.14 | 0.15 | 0.1 | 0 | 0 | 0 | 0 | 0 | 0 | 0 | 0 | 0 | 0 | 0 | 0 | 0 | 0 | 0 | 0 | 0 | 0 | 0 | 0 | 0 |
| 10 | Pacific round herring | 0.1 | 0.19 | 0 | 0 | 0.168 | 0.197 | 0 | 0.03 | 0 | 0 | 0.1 | 0 | 0 | 0.02 | 0 | 0 | 0.048 | 0 | 0 | 0 | 0 | 0 | 0 | 0 | 0 |
| 11 | Sardinella spp. | 0.1 | 0.17 | 0 | 0.28 | 0.02 | 0.03 | 0 | 0 | 0.086 | 0 | 0 | 0 | 0 | 0.01 | 0.07 | 0 | 0.03 | 0.2 | 0 | 0 | 0 | 0 | 0 | 0 | 0 |
| 12 | Round scad | 0.1 | 0 | 0.15 | 0.15 | 0.01 | 0 | 0.032 | 0.01 | 0 | 0 | 0.04 | 0 | 0 | 0 | 0 | 0 | 0 | 0 | 0 | 0 | 0 | 0 | 0 | 0 | 0 |
| 13 | Amberjack | 0 | 0 | 0 | 0 | 0 | 0 | 0 | 0 | 0 | 0 | 0 | 0 | 0 | 0 | 0 | 0 | 0 | 0 | 0 | 0 | 0 | 0 | 0 | 0 | 0 |
| 14 | Moonfish | 0 | 0 | 0 | 0.1 | 0.05 | 0 | 0.07 | 0.055 | 0 | 0 | 0 | 0 | 0 | 0 | 0.03 | 0 | 0 | 0 | 0 | 0 | 0 | 0 | 0 | 0 | 0 |
| 15 | Mackerel scad | 0.16 | 0 | 0.243 | 0.1 | 0.02 | 0 | 0.057 | 0.04 | 0 | 0 | 0 | 0 | 0 | 0 | 0 | 0 | 0 | 0 | 0 | 0 | 0 | 0 | 0 | 0 | 0 |
| 16 | Polynemid fish | 0 | 0 | 0 | 0 | 0 | 0 | 0 | 0 | 0 | 0 | 0 | 0 | 0 | 0 | 0 | 0 | 0 | 0 | 0 | 0 | 0 | 0 | 0 | 0 | 0 |
| 17 | Mitre squid | 0 | 0.01 | 0 | 0 | 0.08 | 0.1 | 0.02 | 0.1 | 0.1 | 0 | 0.01 | 0 | 0.03 | 0 | 0 | 0 | 0 | 0 | 0 | 0 | 0 | 0 | 0.006 | 0 | 0 |
| 18 | Squids | 0.01 | 0.01 | 0.01 | 0.01 | 0.08 | 0.08 | 0.02 | 0.1 | 0.1 | 0 | 0 | 0 | 0.02 | 0 | 0 | 0.01 | 0 | 0 | 0 | 0 | 0 | 0 | 0.005 | 0 | 0 |
| 19 | Portunus sanguinolentus | 0 | 0 | 0 | 0 | 0 | 0 | 0 | 0 | 0 | 0 | 0 | 0 | 0 | 0 | 0 | 0.01 | 0 | 0.002 | 0 | 0 | 0 | 0 | 0.001 | 0 | 0 |
| 20 | Penaeus japonicus | 0 | 0 | 0 | 0 | 0 | 0 | 0 | 0 | 0 | 0 | 0 | 0 | 0.01 | 0 | 0 | 0 | 0.001 | 0.003 | 0 | 0 | 0 | 0.02 | 0.006 | 0 | 0 |
| 21 | Penaeus penicillatus | 0 | 0 | 0 | 0 | 0 | 0 | 0 | 0 | 0 | 0 | 0 | 0 | 0.02 | 0 | 0 | 0.04 | 0 | 0.011 | 0.03 | 0 | 0 | 0.02 | 0.005 | 0 | 0 |
| 22 | Metapenaeopsis barbata | 0 | 0 | 0.003 | 0 | 0 | 0 | 0 | 0 | 0.001 | 0 | 0 | 0 | 0.047 | 0 | 0 | 0 | 0.02 | 0.011 | 0.03 | 0 | 0 | 0 | 0.012 | 0 | 0 |
| 23 | Metanephrops thomsoni | 0 | 0 | 0 | 0 | 0 | 0.01 | 0 | 0 | 0 | 0 | 0 | 0 | 0 | 0 | 0 | 0.06 | 0.02 | 0 | 0.08 | 0 | 0 | 0 | 0 | 0 | 0 |
| 24 | Zooplankton_P | 0 | 0 | 0 | 0 | 0.2 | 0.2 | 0.2 | 0.2 | 0.2 | 0.18 | 0.22 | 0.17 | 0.214 | 0.2 | 0.2 | 0 | 0 | 0 | 0 | 0.1 | 0.1 | 0 | 0 | 0 | 0 |
| 25 | Zooplankton_B | 0 | 0 | 0 | 0 | 0 | 0 | 0 | 0 | 0 | 0.18 | 0 | 0.17 | 0 | 0 | 0.2 | 0.3 | 0.28 | 0.22 | 0.24 | 0.2 | 0.2 | 0.2 | 0.2 | 0 | 0 |
| 26 | Phytoplankton_P | 0 | 0 | 0 | 0 | 0.33 | 0.3 | 0.3 | 0.3 | 0.3 | 0.23 | 0.33 | 0.22 | 0.4 | 0.44 | 0.25 | 0 | 0 | 0 | 0 | 0.2 | 0.2 | 0.16 | 0.19 | 0.5 | 0.5 |
| 27 | Phytoplankton_B | 0 | 0 | 0 | 0 | 0 | 0 | 0 | 0 | 0 | 0.23 | 0 | 0.22 | 0 | 0 | 0 | 0.33 | 0.3 | 0.25 | 0.3 | 0.2 | 0.2 | 0.3 | 0.23 | 0.5 | 0.5 |
| 28 | Detritus | 0 | 0 | 0 | 0 | 0.04 | 0.031 | 0.23 | 0.12 | 0 | 0.18 | 0.24 | 0.22 | 0.259 | 0.25 | 0.25 | 0.25 | 0.3 | 0.2 | 0.3 | 0.3 | 0.3 | 0.3 | 0.29 | 0 | 0 |
| Import | 0 | 0 | 0 | 0 | 0 | 0 | 0 | 0 | 0 | 0 | 0 | 0 | 0 | 0 | 0 | 0 | 0 | 0 | 0 | 0 | 0 | 0 | 0 | 0 | 0 | |
| Sum | 1 | 1 | 1 | 1 | 1 | 1 | 1 | 1 | 1 | 1 | 1 | 1 | 1 | 1 | 1 | 1 | 1 | 1 | 1 | 1 | 1 | 1 | 1 | 1 | 1 |
| Prey\Predator | 1 | 2 | 3 | 4 | 5 | 6 | 7 | 8 | 9 | 10 | 11 | 12 | 13 | 14 | 15 | 16 | 17 | 18 | 19 | 20 | 21 | 22 | 23 | 24 | 25 | |
|---|---|---|---|---|---|---|---|---|---|---|---|---|---|---|---|---|---|---|---|---|---|---|---|---|---|---|
| 1 | Yellow fin tuna | 0 | 0 | 0 | 0 | 0 | 0 | 0 | 0 | 0 | 0 | 0 | 0 | 0 | 0 | 0 | 0 | 0 | 0 | 0 | 0 | 0 | 0 | 0 | 0 | 0 |
| 2 | Skipjack tuna | 0.07 | 0 | 0 | 0 | 0 | 0 | 0 | 0 | 0 | 0 | 0 | 0 | 0 | 0 | 0 | 0 | 0 | 0 | 0 | 0 | 0 | 0 | 0 | 0 | 0 |
| 3 | Dolphinfish | 0 | 0 | 0 | 0 | 0 | 0 | 0 | 0 | 0 | 0 | 0 | 0 | 0 | 0 | 0 | 0 | 0 | 0 | 0 | 0 | 0 | 0 | 0 | 0 | 0 |
| 4 | Spanish mackerel | 0 | 0 | 0 | 0 | 0 | 0 | 0 | 0 | 0 | 0 | 0 | 0 | 0 | 0 | 0 | 0 | 0 | 0 | 0 | 0 | 0 | 0 | 0 | 0 | 0 |
| 5 | Spotted mackerel | 0.15 | 0.1 | 0.08 | 0.1 | 0 | 0.07 | 0.07 | 0.07 | 0.06 | 0 | 0.052 | 0 | 0 | 0.01 | 0 | 0 | 0 | 0.04 | 0 | 0 | 0 | 0 | 0 | 0 | 0 |
| 6 | Chub mackerel | 0.225 | 0.3 | 0.2 | 0.1 | 0 | 0 | 0 | 0 | 0.11 | 0 | 0 | 0 | 0 | 0 | 0 | 0 | 0 | 0.04 | 0 | 0 | 0 | 0 | 0.01 | 0 | 0 |
| 7 | Japanese jack mackerel | 0.01 | 0.05 | 0.01 | 0.02 | 0.01 | 0.02 | 0 | 0.01 | 0.03 | 0 | 0.01 | 0 | 0.01 | 0.001 | 0 | 0 | 0 | 0.04 | 0.02 | 0 | 0 | 0 | 0 | 0 | 0 |
| 8 | other mackerels | 0 | 0.12 | 0.2 | 0.1 | 0.04 | 0.09 | 0.03 | 0 | 0 | 0 | 0 | 0 | 0 | 0 | 0 | 0 | 0.08 | 0 | 0 | 0 | 0 | 0 | 0 | 0 | 0 |
| 9 | Bullet tuna | 0.2 | 0.2 | 0.2 | 0.12 | 0 | 0 | 0 | 0 | 0 | 0 | 0 | 0 | 0 | 0 | 0 | 0 | 0 | 0 | 0 | 0 | 0 | 0 | 0 | 0 | 0 |
| 10 | Pacific round herring | 0.07 | 0.08 | 0 | 0 | 0.05 | 0.08 | 0 | 0.05 | 0.015 | 0 | 0.02 | 0 | 0 | 0.05 | 0 | 0 | 0.02 | 0 | 0 | 0 | 0 | 0 | 0 | 0 | 0 |
| 11 | Sardinella spp. | 0.05 | 0.08 | 0 | 0.1 | 0.13 | 0.1 | 0 | 0 | 0.05 | 0 | 0 | 0 | 0 | 0.049 | 0.04 | 0 | 0.02 | 0 | 0 | 0 | 0 | 0 | 0 | 0 | 0 |
| 12 | Round scad | 0.125 | 0 | 0.18 | 0.18 | 0.1 | 0.1 | 0.27 | 0.1 | 0.015 | 0 | 0.128 | 0 | 0 | 0 | 0 | 0 | 0 | 0 | 0 | 0 | 0 | 0 | 0 | 0 | 0 |
| 13 | Amberjack | 0 | 0 | 0 | 0 | 0 | 0 | 0 | 0 | 0 | 0 | 0 | 0 | 0 | 0 | 0 | 0 | 0 | 0 | 0 | 0 | 0 | 0 | 0 | 0 | 0 |
| 14 | Moonfish | 0 | 0 | 0 | 0.13 | 0.12 | 0 | 0.07 | 0.1 | 0 | 0 | 0 | 0 | 0.08 | 0 | 0.06 | 0 | 0 | 0 | 0 | 0 | 0 | 0 | 0 | 0 | 0 |
| 15 | Mackerel scad | 0.09 | 0 | 0.1 | 0.1 | 0.02 | 0 | 0.03 | 0.14 | 0 | 0 | 0 | 0 | 0 | 0 | 0 | 0 | 0 | 0 | 0 | 0 | 0 | 0 | 0 | 0 | 0 |
| 16 | Polynemid fish | 0 | 0 | 0 | 0 | 0 | 0 | 0 | 0 | 0 | 0 | 0 | 0 | 0 | 0 | 0 | 0 | 0 | 0 | 0 | 0 | 0 | 0 | 0 | 0 | 0 |
| 17 | Mitre squid | 0 | 0.05 | 0 | 0.01 | 0 | 0 | 0 | 0 | 0.01 | 0 | 0 | 0 | 0 | 0 | 0 | 0 | 0 | 0 | 0 | 0 | 0 | 0 | 0.02 | 0 | 0 |
| 18 | Squids | 0.01 | 0.01 | 0.015 | 0.04 | 0 | 0 | 0 | 0 | 0.005 | 0 | 0.01 | 0 | 0.01 | 0 | 0 | 0.02 | 0 | 0 | 0 | 0 | 0 | 0 | 0.01 | 0 | 0 |
| 19 | Portunus sanguinolentus | 0 | 0.01 | 0.005 | 0 | 0 | 0 | 0 | 0 | 0 | 0 | 0 | 0 | 0.05 | 0 | 0 | 0.005 | 0 | 0.005 | 0 | 0 | 0 | 0 | 0 | 0 | 0 |
| 20 | Penaeus japonicus | 0 | 0 | 0 | 0 | 0 | 0 | 0 | 0 | 0 | 0 | 0 | 0 | 0.02 | 0 | 0 | 0.01 | 0 | 0 | 0.02 | 0 | 0 | 0.02 | 0 | 0 | 0 |
| 21 | Penaeus penicillatus | 0 | 0 | 0 | 0 | 0 | 0 | 0 | 0 | 0 | 0 | 0 | 0 | 0.01 | 0 | 0 | 0.03 | 0 | 0.02 | 0.03 | 0 | 0 | 0.02 | 0.01 | 0 | 0 |
| 22 | Metapenaeopsis barbata | 0 | 0 | 0.01 | 0 | 0 | 0 | 0 | 0 | 0.005 | 0 | 0 | 0 | 0 | 0 | 0 | 0.01 | 0.01 | 0 | 0.02 | 0 | 0 | 0 | 0 | 0 | 0 |
| 23 | Metanephrops thomsoni | 0 | 0 | 0 | 0 | 0 | 0.01 | 0 | 0 | 0 | 0 | 0 | 0 | 0.02 | 0 | 0 | 0.1 | 0.02 | 0 | 0.1 | 0 | 0 | 0 | 0 | 0 | 0 |
| 24 | Zooplankton_P | 0 | 0 | 0 | 0 | 0.2 | 0.2 | 0.2 | 0.2 | 0.2 | 0.18 | 0.22 | 0.17 | 0.2 | 0.2 | 0.2 | 0 | 0 | 0 | 0 | 0.1 | 0.1 | 0 | 0 | 0 | 0 |
| 25 | Zooplankton_B | 0 | 0 | 0 | 0 | 0 | 0 | 0 | 0 | 0 | 0.18 | 0 | 0.17 | 0 | 0 | 0.2 | 0.245 | 0.25 | 0.2 | 0.24 | 0.2 | 0.2 | 0.2 | 0.2 | 0 | 0 |
| 26 | Phytoplankton_P | 0 | 0 | 0 | 0 | 0.3 | 0.3 | 0.3 | 0.3 | 0.3 | 0.23 | 0.33 | 0.22 | 0.4 | 0.44 | 0.25 | 0 | 0 | 0.205 | 0 | 0.2 | 0.2 | 0.16 | 0.1 | 0.5 | 0.5 |
| 27 | Phytoplankton_B | 0 | 0 | 0 | 0 | 0 | 0 | 0 | 0 | 0 | 0.23 | 0 | 0.22 | 0 | 0 | 0 | 0.33 | 0.3 | 0.25 | 0.27 | 0.2 | 0.2 | 0.3 | 0.3 | 0.5 | 0.5 |
| 28 | Detritus | 0 | 0 | 0 | 0 | 0.03 | 0.03 | 0.03 | 0.03 | 0.2 | 0.18 | 0.23 | 0.22 | 0.2 | 0.25 | 0.25 | 0.25 | 0.3 | 0.2 | 0.3 | 0.3 | 0.3 | 0.3 | 0.35 | 0 | 0 |
| Import | 0 | 0 | 0 | 0 | 0 | 0 | 0 | 0 | 0 | 0 | 0 | 0 | 0 | 0 | 0 | 0 | 0 | 0 | 0 | 0 | 0 | 0 | 0 | 0 | 0 | |
| Sum | 1 | 1 | 1 | 1 | 1 | 1 | 1 | 1 | 1 | 1 | 1 | 1 | 1 | 1 | 1 | 1 | 1 | 1 | 1 | 1 | 1 | 1 | 1 | 1 | 1 |
| Prey\Predator | 1 | 2 | 3 | 4 | 5 | 6 | 7 | 8 | 9 | 10 | 11 | 12 | 13 | 14 | 15 | 16 | 17 | 18 | 19 | 20 | 21 | 22 | 23 | 24 | 25 | |
|---|---|---|---|---|---|---|---|---|---|---|---|---|---|---|---|---|---|---|---|---|---|---|---|---|---|---|
| 1 | Yellow fin tuna | 0 | 0 | 0 | 0 | 0 | 0 | 0 | 0 | 0 | 0 | 0 | 0 | 0 | 0 | 0 | 0 | 0 | 0 | 0 | 0 | 0 | 0 | 0 | 0 | 0 |
| 2 | Skipjack tuna | 0.01 | 0 | 0 | 0 | 0 | 0 | 0 | 0 | 0 | 0 | 0 | 0 | 0 | 0 | 0 | 0 | 0 | 0 | 0 | 0 | 0 | 0 | 0 | 0 | 0 |
| 3 | Dolphinfish | 0 | 0 | 0 | 0 | 0 | 0 | 0 | 0 | 0 | 0 | 0 | 0 | 0 | 0 | 0 | 0 | 0 | 0 | 0 | 0 | 0 | 0 | 0 | 0 | 0 |
| 4 | Spanish mackerel | 0 | 0.01 | 0 | 0 | 0 | 0 | 0 | 0 | 0 | 0 | 0 | 0 | 0 | 0 | 0 | 0 | 0 | 0 | 0 | 0 | 0 | 0 | 0 | 0 | 0 |
| 5 | Spotted mackerel | 0.1 | 0.1 | 0.1 | 0.1 | 0 | 0.05 | 0.07 | 0.01 | 0.04 | 0 | 0.04 | 0 | 0 | 0.01 | 0 | 0 | 0 | 0.04 | 0 | 0 | 0 | 0 | 0 | 0 | 0 |
| 6 | Chub mackerel | 0.1 | 0.15 | 0.2 | 0.1 | 0 | 0 | 0 | 0 | 0.04 | 0 | 0 | 0 | 0 | 0 | 0 | 0 | 0 | 0.2 | 0 | 0 | 0 | 0 | 0.05 | 0 | 0 |
| 7 | Japanese jack mackerel | 0.01 | 0.02 | 0.05 | 0.02 | 0.01 | 0.01 | 0 | 0 | 0.01 | 0 | 0 | 0 | 0.01 | 0.004 | 0 | 0 | 0 | 0.04 | 0.02 | 0 | 0 | 0 | 0.03 | 0 | 0 |
| 8 | other mackerels | 0.19 | 0.228 | 0.237 | 0.22 | 0.26 | 0.329 | 0.29 | 0 | 0 | 0 | 0.012 | 0 | 0 | 0.06 | 0 | 0 | 0.165 | 0.04 | 0 | 0 | 0 | 0 | 0 | 0 | 0 |
| 9 | Bullet tuna | 0.22 | 0.22 | 0.2 | 0.15 | 0 | 0 | 0 | 0 | 0 | 0 | 0 | 0 | 0 | 0 | 0 | 0 | 0 | 0 | 0 | 0 | 0 | 0 | 0 | 0 | 0 |
| 10 | Pacific round herring | 0.07 | 0.05 | 0 | 0 | 0.01 | 0.05 | 0 | 0.01 | 0 | 0 | 0.014 | 0 | 0 | 0.01 | 0 | 0 | 0.02 | 0 | 0 | 0 | 0 | 0 | 0 | 0 | 0 |
| 11 | Sardinella spp. | 0.22 | 0.17 | 0 | 0.109 | 0.09 | 0.04 | 0 | 0.41 | 0.18 | 0 | 0 | 0 | 0 | 0.096 | 0.04 | 0 | 0 | 0 | 0 | 0 | 0 | 0 | 0 | 0 | 0 |
| 12 | Round scad | 0.03 | 0 | 0.1 | 0.1 | 0.02 | 0 | 0.03 | 0.1 | 0 | 0 | 0.05 | 0 | 0 | 0 | 0 | 0 | 0 | 0 | 0 | 0 | 0 | 0 | 0 | 0 | 0 |
| 13 | Amberjack | 0 | 0 | 0 | 0 | 0 | 0 | 0 | 0 | 0 | 0 | 0 | 0 | 0 | 0 | 0 | 0 | 0 | 0 | 0 | 0 | 0 | 0 | 0 | 0 | 0 |
| 14 | Moonfish | 0 | 0 | 0 | 0.1 | 0.08 | 0 | 0.07 | 0.04 | 0 | 0 | 0 | 0 | 0.21 | 0 | 0.06 | 0 | 0 | 0 | 0 | 0 | 0 | 0 | 0 | 0 | 0 |
| 15 | Mackerel scad | 0.04 | 0 | 0.1 | 0.1 | 0.01 | 0 | 0.01 | 0.01 | 0 | 0 | 0 | 0 | 0 | 0 | 0 | 0 | 0 | 0 | 0 | 0 | 0 | 0 | 0 | 0 | 0 |
| 16 | Polynemid fish | 0 | 0 | 0 | 0 | 0 | 0 | 0 | 0 | 0 | 0 | 0 | 0 | 0 | 0 | 0 | 0 | 0 | 0 | 0 | 0 | 0 | 0 | 0 | 0 | 0 |
| 17 | Mitre squid | 0 | 0.05 | 0 | 0 | 0 | 0 | 0 | 0 | 0.02 | 0 | 0.032 | 0 | 0.01 | 0 | 0 | 0 | 0 | 0 | 0 | 0 | 0 | 0 | 0.04 | 0 | 0 |
| 18 | Squids | 0.01 | 0.001 | 0.001 | 0.001 | 0 | 0 | 0 | 0 | 0.005 | 0 | 0.002 | 0 | 0.006 | 0 | 0 | 0.01 | 0 | 0 | 0 | 0 | 0 | 0 | 0.03 | 0 | 0 |
| 19 | Portunus sanguinolentus | 0 | 0 | 0.001 | 0 | 0 | 0 | 0 | 0 | 0 | 0 | 0 | 0 | 0.012 | 0 | 0 | 0.01 | 0 | 0.01 | 0 | 0 | 0 | 0 | 0 | 0 | 0 |
| 20 | Penaeus japonicus | 0 | 0 | 0 | 0 | 0 | 0 | 0 | 0 | 0 | 0 | 0 | 0 | 0.01 | 0 | 0 | 0.02 | 0 | 0 | 0.02 | 0 | 0 | 0.02 | 0 | 0 | 0 |
| 21 | Penaeus penicillatus | 0 | 0.001 | 0.001 | 0 | 0 | 0 | 0 | 0 | 0 | 0 | 0 | 0 | 0.014 | 0 | 0 | 0.07 | 0 | 0.02 | 0.03 | 0 | 0 | 0.02 | 0.01 | 0 | 0 |
| 22 | Metapenaeopsis barbata | 0 | 0 | 0.01 | 0 | 0 | 0 | 0 | 0 | 0.005 | 0 | 0 | 0 | 0.012 | 0 | 0 | 0 | 0.025 | 0 | 0.02 | 0 | 0 | 0 | 0 | 0 | 0 |
| 23 | Metanephrops thomsoni | 0 | 0 | 0 | 0 | 0 | 0.001 | 0 | 0 | 0 | 0 | 0 | 0 | 0.016 | 0 | 0 | 0.1 | 0.04 | 0 | 0.07 | 0 | 0 | 0 | 0 | 0 | 0 |
| 24 | Zooplankton_P | 0 | 0 | 0 | 0 | 0.2 | 0.2 | 0.21 | 0.2 | 0.2 | 0.18 | 0.2 | 0.17 | 0.2 | 0.25 | 0.2 | 0 | 0 | 0 | 0 | 0.1 | 0.1 | 0 | 0 | 0 | 0 |
| 25 | Zooplankton_B | 0 | 0 | 0 | 0 | 0 | 0 | 0 | 0 | 0 | 0.18 | 0 | 0.17 | 0 | 0 | 0.2 | 0.24 | 0.2 | 0.2 | 0.24 | 0.2 | 0.2 | 0.2 | 0.2 | 0 | 0 |
| 26 | Phytoplankton_P | 0 | 0 | 0 | 0 | 0.3 | 0.3 | 0.3 | 0.2 | 0.3 | 0.23 | 0.3 | 0.22 | 0.3 | 0.35 | 0.25 | 0 | 0 | 0 | 0 | 0.2 | 0.2 | 0.16 | 0.14 | 0.5 | 0.5 |
| 27 | Phytoplankton_B | 0 | 0 | 0 | 0 | 0 | 0 | 0 | 0 | 0 | 0.23 | 0 | 0.22 | 0 | 0 | 0 | 0.3 | 0.25 | 0.25 | 0.3 | 0.2 | 0.2 | 0.3 | 0.23 | 0.5 | 0.5 |
| 28 | Detritus | 0 | 0 | 0 | 0 | 0.02 | 0.02 | 0.02 | 0.02 | 0.2 | 0.18 | 0.35 | 0.22 | 0.2 | 0.22 | 0.25 | 0.25 | 0.3 | 0.2 | 0.3 | 0.3 | 0.3 | 0.3 | 0.27 | 0 | 0 |
| Import | 0 | 0 | 0 | 0 | 0 | 0 | 0 | 0 | 0 | 0 | 0 | 0 | 0 | 0 | 0 | 0 | 0 | 0 | 0 | 0 | 0 | 0 | 0 | 0 | 0 | |
| Sum | 1 | 1 | 1 | 1 | 1 | 1 | 1 | 1 | 1 | 1 | 1 | 1 | 1 | 1 | 1 | 1 | 1 | 1 | 1 | 1 | 1 | 1 | 1 | 1 | 1 |
| No. | Group Name | Group Name | Trophic Level | Biomass (t/km2) | P/B (/Year) | Q/B (/Year) | EE | P/Q (/Year) | |
|---|---|---|---|---|---|---|---|---|---|
| Predator fish | 1 | Thunnus albacares | Yellow fin tuna | 3.716 | 0.704 | 2.65 | 11.64 | 0.241 | 0.228 |
| 2 | Katsuwonus pelamis | Skipjack tuna | 3.751 | 0.380 | 2.62 | 12.53 | 0.459 | 0.209 | |
| 3 | Coryphaena hippurus | Dolphinfish | 3.731 | 0.248 | 3.71 | 8.48 | 0.229 | 0.438 | |
| 4 | Scomberomorus commerson | Spanish mackerel | 3.631 | 0.598 | 4.5 | 11.4 | 0.338 | 0.395 | |
| Pelagic fish | 5 | Scomber australasicus | Spotted mackerel | 2.832 | 2.136 | 4.3 | 8.8 | 0.953 | 0.489 |
| 6 | Scomber japonicus | Chub mackerel | 2.907 | 2.423 | 4.8 | 11.7 | 0.651 | 0.410 | |
| 7 | Trachurus japonicus | Japanese jack mackerel | 2.622 | 0.607 | 4.11 | 10 | 0.903 | 0.411 | |
| 8 | other mackerels | other mackerels | 2.794 | 0.052 | 2.22 | 9.6 | 0.907 | 0.231 | |
| 9 | Auxis rochei rochei | Bullet tuna | 3.049 | 0.568 | 4.8 | 10.6 | 0.985 | 0.453 | |
| Small pelagic fish | 10 | Etrumeus micropus | Pacific round herring | 2.360 | 3.778 | 4.2 | 14.04 | 0.921 | 0.299 |
| 11 | Sardinella spp. | Sardinella spp. | 2.532 | 2.149 | 5.1 | 11.6 | 0.942 | 0.440 | |
| 12 | Decapterus maruadsi | Round scad | 2.340 | 1.239 | 3.1 | 9.08 | 0.949 | 0.341 | |
| Benthic and Reef fish | 13 | Seriola dumerili | Amberjack | 2.390 | 1.946 | 1.2 | 3.3 | 0.120 | 0.364 |
| 14 | Mene maculata | Moonfish | 2.387 | 2.188 | 2.64 | 6.7 | 0.946 | 0.394 | |
| 15 | Decapterus kurroides | Mackerel scad | 2.549 | 2.004 | 1.97 | 7.1 | 0.850 | 0.277 | |
| 16 | Polydactylus sextarius | Polynemid fish | 2.465 | 0.718 | 2.34 | 11.1 | 0.015 | 0.211 | |
| Cephalopod | 17 | Uroteuthis chinensis | Mitre squid | 2.446 | 1.322 | 4.7 | 11.64 | 0.958 | 0.404 |
| 18 | Loliginidae | Squids | 2.753 | 1.279 | 4.7 | 11.64 | 0.901 | 0.404 | |
| Crustaceans | 19 | Portunus sanguinolentus | Portunus sanguinolentus | 2.457 | 0.038 | 4.93 | 14.5 | 0.979 | 0.340 |
| 20 | Penaeus japonicus | Penaeus japonicus | 2.300 | 0.033 | 8.6 | 15.6 | 0.902 | 0.551 | |
| 21 | Penaeus penicillatus | Penaeus penicillatus | 2.300 | 0.097 | 8.6 | 15.6 | 0.898 | 0.551 | |
| 22 | Metapenaeopsis barbata | Metapenaeopsis barbata | 2.252 | 0.159 | 7.6 | 12.22 | 0.813 | 0.622 | |
| 23 | Metanephrops thomsoni | Metanephrops thomsoni | 2.353 | 0.293 | 5.65 | 14.2 | 0.825 | 0.398 | |
| Zooplankton | 24 | Zooplankton_P | Zooplankton_P | 2.000 | 10 | 25 | 180 | 0.145 | 0.139 |
| 25 | Zooplankton_B | Zooplankton_B | 2.000 | 10 | 25 | 180 | 0.104 | 0.139 | |
| Phytoplankton | 26 | Phytoplankton_P | Phytoplankton_P | 1.000 | 21.5 | 106.52 | 0.810 | ||
| 27 | Phytoplankton_B | Phytoplankton_B | 1.000 | 21.5 | 106.52 | 0.800 | |||
| Detritus | 28 | Detritus | Detritus | 1.000 | 163.5 | 0.215 |
| No. | Group Name | Group Name | Trophic Level | Biomass (t/km2) | P/B (/Year) | Q/B (/Year) | EE | P/Q (/Year) | |
|---|---|---|---|---|---|---|---|---|---|
| Predator fish | 1 | Thunnus albacares | Yellow fin tuna | 3.777 | 0.822 | 2.65 | 11.64 | 0.132 | 0.228 |
| 2 | Katsuwonus pelamis | Skipjack tuna | 3.782 | 0.455 | 2.62 | 12.53 | 0.695 | 0.209 | |
| 3 | Coryphaena hippurus | Dolphinfish | 3.726 | 1.366 | 3.71 | 8.48 | 0.023 | 0.438 | |
| 4 | Scomberomorus commerson | Spanish mackerel | 3.622 | 0.212 | 4.5 | 11.4 | 0.835 | 0.395 | |
| Pelagic fish | 5 | Scomber australasicus | Spotted mackerel | 2.893 | 3.519 | 4.3 | 8.8 | 0.946 | 0.489 |
| 6 | Scomber japonicus | Chub mackerel | 2.953 | 2.275 | 4.8 | 11.7 | 0.765 | 0.410 | |
| 7 | Trachurus japonicus | Japanese jack mackerel | 2.893 | 1.240 | 4.11 | 10 | 0.884 | 0.411 | |
| 8 | other mackerels | other mackerels | 2.906 | 4.724 | 2.22 | 9.6 | 0.808 | 0.231 | |
| 9 | Auxis rochei rochei | Bullet tuna | 2.732 | 1.302 | 4.8 | 10.6 | 0.916 | 0.453 | |
| Small pelagic fish | 10 | Etrumeus micropus | Pacific round herring | 2.360 | 2.898 | 4.2 | 14.04 | 0.945 | 0.299 |
| 11 | Sardinella spp. | Sardinella spp. | 2.551 | 3.699 | 5.1 | 11.6 | 0.722 | 0.440 | |
| 12 | Decapterus maruadsi | Round scad | 2.340 | 8.381 | 3.1 | 9.08 | 0.919 | 0.341 | |
| Benthic and Reef fish | 13 | Seriola dumerili | Amberjack | 2.482 | 2.177 | 1.2 | 3.3 | 0.084 | 0.364 |
| 14 | Mene maculata | Moonfish | 2.365 | 8.099 | 2.64 | 6.7 | 0.788 | 0.394 | |
| 15 | Decapterus kurroides | Mackerel scad | 2.544 | 5.306 | 1.97 | 7.1 | 0.954 | 0.277 | |
| 16 | Polydactylus sextarius | Polynemid fish | 2.474 | 0.444 | 2.34 | 11.1 | 0.113 | 0.211 | |
| Cephalopod | 17 | Uroteuthis chinensis | Mitre squid | 2.499 | 1.248 | 4.7 | 11.64 | 0.140 | 0.404 |
| 18 | Loliginidae | Squids | 2.463 | 0.355 | 4.7 | 11.64 | 0.777 | 0.404 | |
| Crustaceans | 19 | Portunus sanguinolentus | Portunus sanguinolentus | 2.496 | 0.127 | 4.93 | 14.5 | 0.890 | 0.340 |
| 20 | Penaeus japonicus | Penaeus japonicus | 2.300 | 0.046 | 8.6 | 15.6 | 0.864 | 0.551 | |
| 21 | Penaeus penicillatus | Penaeus penicillatus | 2.300 | 0.158 | 8.6 | 15.6 | 0.381 | 0.551 | |
| 22 | Metapenaeopsis barbata | Metapenaeopsis barbata | 2.252 | 0.269 | 7.6 | 12.22 | 0.358 | 0.622 | |
| 23 | Metanephrops thomsoni | Metanephrops thomsoni | 2.277 | 0.597 | 5.65 | 14.2 | 0.409 | 0.398 | |
| Zooplankton | 24 | Zooplankton_P | Zooplankton_P | 2.000 | 10 | 25 | 180 | 0.409 | 0.139 |
| 25 | Zooplankton_B | Zooplankton_B | 2.000 | 10 | 25 | 180 | 0.303 | 0.139 | |
| Phytoplankton | 26 | Phytoplankton_P | Phytoplankton_P | 1.000 | 22.1 | 106.52 | 0.815 | ||
| 27 | Phytoplankton_B | Phytoplankton_B | 1.000 | 22.1 | 106.52 | 0.781 | |||
| Detritus | 28 | Detritus | Detritus | 1.000 | 163.5 | 0.21 |
| No. | Group Name | Group Name | Trophic Level | Biomass (t/km2) | P/B (/Year) | Q/B (/Year) | EE | P/Q (/Year) | |
|---|---|---|---|---|---|---|---|---|---|
| Predator fish | 1 | Thunnus albacares | Yellow fin tuna | 3.765 | 1.019 | 2.65 | 11.64 | 0.183 | 0.228 |
| 2 | Katsuwonus pelamis | Skipjack tuna | 3.834 | 0.518 | 2.62 | 12.53 | 0.294 | 0.209 | |
| 3 | Coryphaena hippurus | Dolphinfish | 3.866 | 0.046 | 3.71 | 8.48 | 0.005 | 0.438 | |
| 4 | Scomberomorus commerson | Spanish mackerel | 3.769 | 0.615 | 4.5 | 11.4 | 0.025 | 0.395 | |
| Pelagic fish | 5 | Scomber australasicus | Spotted mackerel | 3.062 | 4.187 | 4.3 | 8.8 | 0.940 | 0.489 |
| 6 | Scomber japonicus | Chub mackerel | 3.123 | 0.980 | 4.8 | 11.7 | 0.921 | 0.410 | |
| 7 | Trachurus japonicus | Japanese jack mackerel | 3.111 | 0.684 | 4.11 | 10 | 0.911 | 0.411 | |
| 8 | other mackerels | other mackerels | 3.040 | 18.574 | 2.22 | 9.6 | 0.715 | 0.231 | |
| 9 | Auxis rochei rochei | Bullet tuna | 2.698 | 1.269 | 4.8 | 10.6 | 0.873 | 0.453 | |
| Small pelagic fish | 10 | Etrumeus micropus | Pacific round herring | 2.360 | 1.910 | 4.2 | 14.04 | 0.989 | 0.299 |
| 11 | Sardinella spp. | Sardinella spp. | 2.450 | 19.140 | 5.1 | 11.6 | 0.903 | 0.440 | |
| 12 | Decapterus maruadsi | Round scad | 2.340 | 10.317 | 3.1 | 9.08 | 0.971 | 0.341 | |
| Benthic and Reef fish | 13 | Seriola dumerili | Amberjack | 2.664 | 3.188 | 1.2 | 3.3 | 0.006 | 0.364 |
| 14 | Mene maculata | Moonfish | 2.554 | 5.739 | 2.64 | 6.7 | 0.976 | 0.394 | |
| 15 | Decapterus kurroides | Mackerel scad | 2.551 | 1.967 | 1.97 | 7.1 | 0.907 | 0.277 | |
| 16 | Polydactylus sextarius | Polynemid fish | 2.542 | 0.368 | 2.34 | 11.1 | 0.060 | 0.211 | |
| Cephalopod | 17 | Uroteuthis chinensis | Mitre squid | 2.655 | 1.872 | 4.7 | 11.64 | 0.931 | 0.404 |
| 18 | Loliginidae | Squids | 2.914 | 0.202 | 4.7 | 11.64 | 0.938 | 0.404 | |
| Crustaceans | 19 | Portunus sanguinolentus | Portunus sanguinolentus | 2.478 | 0.051 | 4.93 | 14.5 | 0.959 | 0.340 |
| 20 | Penaeus japonicus | Penaeus japonicus | 2.300 | 0.038 | 8.6 | 15.6 | 0.932 | 0.551 | |
| 21 | Penaeus penicillatus | Penaeus penicillatus | 2.300 | 0.086 | 8.6 | 15.6 | 0.928 | 0.551 | |
| 22 | Metapenaeopsis barbata | Metapenaeopsis barbata | 2.252 | 0.184 | 7.6 | 12.22 | 0.983 | 0.622 | |
| 23 | Metanephrops thomsoni | Metanephrops thomsoni | 2.506 | 0.323 | 5.65 | 14.2 | 0.910 | 0.398 | |
| Zooplankton | 24 | Zooplankton_P | Zooplankton_P | 2.000 | 10 | 25 | 180 | 0.517 | 0.139 |
| 25 | Zooplankton_B | Zooplankton_B | 2.000 | 10 | 25 | 180 | 0.125 | 0.139 | |
| Phytoplankton | 26 | Phytoplankton_P | Phytoplankton_P | 1.000 | 22 | 106.52 | 0.841 | ||
| 27 | Phytoplankton_B | Phytoplankton_B | 1.000 | 22 | 106.52 | 0.784 | |||
| Detritus | 28 | Detritus | Detritus | 1.000 | 163.5 | 0.266 | 0.215 |
| No. | Group Name | El Niño KSi | El Niño RTI | La Niña KSi | La Niña RTI | Normal KSi | Normal RTI | |
|---|---|---|---|---|---|---|---|---|
| Predator fish | 1 | Thunnus albacares | −0.087 | 1.000 | −0.180 | 0.608 | −0.240 | 0.713 |
| 2 | Katsuwonus pelamis | −0.395 | 0.490 | −0.048 | 0.821 | −0.519 | 0.373 | |
| 3 | Coryphaena hippurus | −0.339 | 0.562 | −1.626 | 0.022 | −0.742 | 0.223 | |
| 4 | Scomberomorus commerson | −0.860 | 0.168 | −0.538 | 0.266 | −0.402 | 0.489 | |
| Pelagic fish | 5 | Scomber australasicus | −0.476 | 0.418 | −0.259 | 0.519 | −0.345 | 0.568 |
| 6 | Scomber japonicus | −0.345 | 0.558 | −0.527 | 0.274 | −0.181 | 0.833 | |
| 7 | Trachurus japonicus | −0.583 | 0.320 | −0.494 | 0.295 | −0.686 | 0.255 | |
| 8 | other mackerels | −0.191 | 0.815 | −0.033 | 0.980 | −1.844 | 0.018 | |
| 9 | Auxis rochei rochei | −0.426 | 0.460 | −0.513 | 0.283 | −0.686 | 0.255 | |
| Small pelagic fish | 10 | Etrumeus micropus | −0.687 | 0.256 | −0.815 | 0.142 | −0.376 | 0.539 |
| 11 | Sardinella spp. | −0.366 | 0.539 | −0.026 | 1.000 | −0.324 | 0.597 | |
| 12 | Decapterus maruadsi | −0.406 | 0.514 | −0.377 | 0.415 | −0.703 | 0.246 | |
| Benthic and Reef fish | 13 | Seriola dumerili | −0.156 | 0.863 | −0.189 | 0.605 | −0.424 | 0.473 |
| 14 | Mene maculata | −0.185 | 0.852 | −0.592 | 0.244 | −0.342 | 0.573 | |
| 15 | Decapterus kurroides | −0.548 | 0.360 | −0.787 | 0.151 | −0.533 | 0.369 | |
| 16 | Polydactylus sextarius | −0.372 | 0.517 | −0.272 | 0.489 | −0.170 | 0.837 | |
| Cephalopod | 17 | Uroteuthis chinensis | −0.473 | 0.412 | −0.132 | 0.684 | −0.383 | 0.516 |
| 18 | Loliginidae | −0.755 | 0.214 | −0.775 | 0.154 | −0.333 | 0.579 | |
| Crustaceans | 19 | Portunus sanguinolentus | −0.695 | 0.245 | −1.292 | 0.047 | −1.353 | 0.055 |
| 20 | Penaeus japonicus | −1.556 | 0.034 | −1.520 | 0.028 | −1.665 | 0.027 | |
| 21 | Penaeus penicillatus | −1.363 | 0.053 | −1.183 | 0.060 | −1.369 | 0.053 | |
| 22 | Metapenaeopsis barbata | −0.644 | 0.276 | −0.804 | 0.144 | −0.739 | 0.224 | |
| 23 | Metanephrops thomsoni | −0.515 | 0.372 | −0.669 | 0.196 | −0.880 | 0.162 | |
| Zooplankton | 24 | Zooplankton_P | −0.305 | 0.658 | −0.316 | 0.476 | −0.335 | 0.640 |
| 25 | Zooplankton_B | −0.303 | 0.662 | −0.311 | 0.481 | −0.311 | 0.676 | |
| Phytoplankton | 26 | Phytoplankton_P | −0.207 | 0.935 | −0.189 | 0.703 | −0.211 | 1.000 |
| 27 | Phytoplankton_B | −0.267 | 0.813 | −0.267 | 0.589 | −0.319 | 0.779 |
References
- Barrier, N.; Lengaigne, M.; Rault, J.; Person, R.; Ethé, C.; Aumont, O.; Maury, O. Mechanisms underlying the epipelagic ecosystem response to ENSO in the equatorial Pacific ocean. Prog. Oceanogr. 2023, 213, 103002. [Google Scholar] [CrossRef]
- Holbrook, N.J.; Claar, D.C.; Hobday, A.J.; McInnes, K.L.; Oliver, E.C.J.; Gupta, A.S.; Widlansky, M.J.; Zhang, X. ENSO-Driven Ocean Extremes and Their Ecosystem Impacts. Geophys. Monogr. Ser. 2020, 253, 409–428. [Google Scholar] [CrossRef]
- Zhang, K.; Li, M.; Li, J.; Sun, M.; Xu, Y.; Cai, Y.; Chen, Z.; Qiu, Y. Climate-induced small pelagic fish blooms in an overexploited marine ecosystem of the South China Sea. Ecol. Indic. 2022, 145, 109598. [Google Scholar] [CrossRef]
- Hong, H.; Chai, F.; Zhang, C.; Huang, B.; Jiang, Y.; Hu, J. An overview of physical and biogeochemical processes and ecosystem dynamics in the Taiwan Strait. Cont. Shelf Res. 2011, 31, S3–S12. [Google Scholar] [CrossRef]
- Chen, W.; Feng, J.; Wu, R. Roles of ENSO and PDO in the link of the east asian winter monsoon to the following summer monsoon. J. Clim. 2013, 26, 622–635. [Google Scholar] [CrossRef]
- Hsiao, P.Y.; Shimada, T.; Lan, K.W.; Lee, M.A.; Liao, C.H. Assessing summertime primary production required in changed marine environments in upwelling ecosystems around the taiwan bank. Remote Sens. 2021, 13, 765. [Google Scholar] [CrossRef]
- Wu, Y.L.; Lee, M.A.; Chen, L.C.; Chan, J.W.; Lan, K.W. Evaluating a suitable aquaculture site selection model for Cobia (Rachycentron canadum) during extreme events in the Inner Bay of the Penghu Islands, Taiwan. Remote Sens. 2020, 12, 2689. [Google Scholar] [CrossRef]
- Naimullah, M.; Wu, Y.L.; Lee, M.A.; Lan, K.W. Effect of the El Niño–Southern Oscillation (ENSO) Cycle on the Catches and Habitat Patterns of Three Swimming Crabs in the Taiwan Strait. Front. Mar. Sci. 2021, 8, 763543. [Google Scholar] [CrossRef]
- Doney, S.C.; Ruckelshaus, M.; Emmett Duffy, J.; Barry, J.P.; Chan, F.; English, C.A.; Galindo, H.M.; Grebmeier, J.M.; Hollowed, A.B.; Knowlton, N.; et al. Climate change impacts on marine ecosystems. Ann. Rev. Mar. Sci. 2012, 4, 11–37. [Google Scholar] [CrossRef]
- Surma, S.; Christensen, V.; Kumar, R.; Ainsworth, C.H.; Pitcher, T.J. High-resolution trophic models reveal structure and function of a northeast pacific ecosystem. Front. Mar. Sci. 2019, 6, 625. [Google Scholar] [CrossRef]
- Santora, J.A.; Hazen, E.L.; Schroeder, I.D.; Bograd, S.J.; Sakuma, K.M.; Field, J.C. Impacts of ocean climate variability on biodiversity of pelagic forage species in an upwelling ecosystem. Mar. Ecol. Prog. Ser. 2017, 580, 205–220. [Google Scholar] [CrossRef]
- Thompson, A.R.; Harvey, C.J.; Sydeman, W.J.; Barceló, C.; Bograd, S.J.; Brodeur, R.D.; Fiechter, J.; Field, J.C.; Garfield, N.; Good, T.P.; et al. Indicators of pelagic forage community shifts in the California Current Large Marine Ecosystem, 1998–2016. Ecol. Indic. 2019, 105, 215–228. [Google Scholar] [CrossRef]
- Moran, J.R.; Heintz, R.A.; Straley, J.M.; Vollenweider, J.J. Regional variation in the intensity of humpback whale predation on Pacific herring in the Gulf of Alaska. Deep. Sea Res. Part II Top. Stud. Oceanogr. 2018, 147, 187–195. [Google Scholar] [CrossRef]
- Straley, J.M.; Moran, J.R.; Boswell, K.M.; Vollenweider, J.J.; Heintz, R.A.; Quinn, T.J.; Witteveen, B.H.; Rice, S.D. Seasonal presence and potential influence of humpback whales on wintering Pacific herring populations in the Gulf of Alaska. Deep. Sea Res. Part II Top. Stud. Oceanogr. 2018, 147, 173–186. [Google Scholar] [CrossRef]
- Hu, J.; Kawamura, H.; Hong, H.; Pan, W. A review of research on the upwelling in the Taiwan Strait. Bull. Mar. Sci. 2003, 73, 605–628. [Google Scholar]
- Lan, K.W.; Kawamura, H.; Lee, M.A.; Chang, Y.; Chan, J.W.; Liao, C.H. Summertime sea surface temperature fronts associated with upwelling around the Taiwan Bank. Cont. Shelf Res. 2009, 29, 903–910. [Google Scholar] [CrossRef]
- Jennings, S.; Kaiser, M.J. The effects of fishing on marine ecosystems. Adv. Mar. Biol. 1998, 34, 201–352. [Google Scholar] [CrossRef]
- Dadswell, M.; Spares, A.; Reader, J.; McLean, M.; McDermott, T.; Samways, K.; Lilly, J. The Decline and Impending Collapse of the Atlantic Salmon (Salmo salar) Population in the North Atlantic Ocean: A Review of Possible Causes. Rev. Fish. Sci. Aquac. 2022, 30, 215–258. [Google Scholar] [CrossRef]
- Adebola, T.; de Mutsert, K. Compartive network analyses for Nigerian coastal waters using two ecopath models developed for the years 1985 and 2000. Fish. Res. 2019, 213, 33–41. [Google Scholar] [CrossRef]
- Ju, P.; Chen, M.; Cheung, W.W.L.; Tian, Y.; Yang, S.; Sun, P.; Jiang, C.; Lu, Z. Modelling the structure and functioning of an upwelling ecosystem in the Southern Taiwan Strait, China. J. Mar. Syst. 2022, 226, 103666. [Google Scholar] [CrossRef]
- Lindeman, R.L. The Trophic-Dynamic Aspect of Ecology. Ecology 1942, 23, 399–417. [Google Scholar] [CrossRef]
- Tilman, D.; Reich, P.B.; Isbell, F. Biodiversity impacts ecosystem productivity as much as resources, disturbance, or herbivory. Proc. Natl. Acad. Sci. 2012, 109, 10394–10397. [Google Scholar] [CrossRef]
- Heath, M.R.; Speirs, D.C.; Steele, J.H. Understanding patterns and processes in models of trophic cascades. Ecol. Lett. 2014, 17, 101–114. [Google Scholar] [CrossRef]
- Poisot, T.; Mouquet, N.; Gravel, D. Trophic complementarity drives the biodiversity–ecosystem functioning relationship in food webs. Ecol. Lett. 2013, 16, 853–861. [Google Scholar] [CrossRef] [PubMed]
- Frank, K.T.; Petrie, B.; Fisher, J.A.D.; Leggett, W.C. Transient dynamics of an altered large marine ecosystem. Nature 2011, 477, 86–89. [Google Scholar] [CrossRef]
- Worm, B.; Barbier, E.B.; Beaumont, N.; Duffy, J.E.; Folke, C.; Halpern, B.S.; Jackson, J.B.C.; Lotze, H.K.; Micheli, F.; Palumbi, S.R.; et al. Impacts of biodiversity loss on ocean ecosystem services. Science 2006, 314, 787–790. [Google Scholar] [CrossRef] [PubMed]
- Halpern, B.S.; Selkoe, K.A.; Micheli, F.; Kappel, C.V. Evaluating and ranking the vulnerability of global marine ecosystems to anthropogenic threats. Conserv. Biol. 2007, 21, 1301–1315. [Google Scholar] [CrossRef]
- Heymans, J.J.; Coll, M.; Libralato, S.; Morissette, L.; Christensen, V. Global patterns in ecological indicators of marine food webs: A modelling approach. PLoS ONE 2014, 9, e95845. [Google Scholar] [CrossRef]
- Libralato, S.; Caccin, A.; Pranovi, F. Modeling species invasions using thermal and trophic niche dynamics under climate change. Front. Mar. Sci. 2015, 2, 29. [Google Scholar] [CrossRef]
- Jørgensen, S.E. Exergy and ecology. Ecol. Modell. 1992, 63, 185–214. [Google Scholar] [CrossRef]
- Pauly, D.; Christensen, V.; Dalsgaard, J.; Froese, R.; Torres, F. Fishing down marine food webs. Science 1998, 279, 860–863. [Google Scholar] [CrossRef] [PubMed]
- Fulton, E.A. Approaches to end-to-end ecosystem models. J. Mar. Syst. 2010, 81, 171–183. [Google Scholar] [CrossRef]
- Smith, M.D.; Fulton, E.A.; Day, R.W. Using an Atlantis model of the southern Benguela to explore the response of ecosystem indicators for fisheries management. Environ. Model. Softw. 2015, 69, 23–41. [Google Scholar] [CrossRef]
- Coll, M.; Steenbeek, J. Standardized ecological indicators to assess aquatic food webs: The ECOIND software plug-in for Ecopath with Ecosim models. Environ. Model. Softw. 2017, 89, 120–130. [Google Scholar] [CrossRef]
- Odum, E.P. The Strategy of Ecosystem Development An understanding of ecological succession provides a basis for resolving man’s conflict with nature. Adv. Sci. 1969, 164, 262–270. [Google Scholar]
- Christensen, V.; Walters, C.J. Ecopath with Ecosim: Methods, capabilities and limitations. Ecol. Modell. 2004, 172, 109–139. [Google Scholar] [CrossRef]
- Watari, S.; Murase, H.; Yonezaki, S.; Okazaki, M.; Kiyofuji, H.; Tamura, T.; Hakamada, T.; Kanaji, Y.; Kitakado, T. Ecosystem modeling in the western North Pacific using Ecopath, with a focus on small pelagic fishes. Mar. Ecol. Prog. Ser. 2019, 617, 295–305. [Google Scholar] [CrossRef]
- Woodward, G.; Perkins, D.M.; Brown, L.E. Climate change and freshwater ecosystems: Impacts across multiple levels of organization. Philos. Trans. R. Soc. B Biol. Sci. 2010, 365, 2093–2106. [Google Scholar] [CrossRef]
- Christensen, V. Ecosystem maturity—Towards quantification. Ecol. Modell. 1995, 77, 3–32. [Google Scholar] [CrossRef]
- Duan, L.J.; Li, S.Y.; Liu, Y.; Moreau, J.; Christensen, V. Modeling changes in the coastal ecosystem of the Pearl River Estuary from 1981 to 1998. Ecol. Modell. 2009, 220, 2802–2818. [Google Scholar] [CrossRef]
- Pikitch, E.K.; Santora, C.; Babcock, E.A.; Bakun, A.; Bonfil, R.; Conover, D.O.; Dayton, P.; Doukakis, P.; Fluharty, D.; Heneman, B.; et al. Ecosystem-based fishery management. Science 2004, 305, 346–347. [Google Scholar] [CrossRef]
- Ho, C.H.; Chen, J.L.; Nobuyuki, Y.; Lur, H.S.; Lu, H.J. Mitigating uncertainty and enhancing resilience to climate change in the fisheries sector in Taiwan: Policy implications for food security. Ocean. Coast Manag. 2016, 130, 355–372. [Google Scholar] [CrossRef]
- Lan, K.W.; Zhang, C.I.; Kang, H.J.; Wu, L.J.; Lian, L.J. Impact of Fishing Exploitation and Climate Change on the Grey Mullet Mugil cephalus Stock in the Taiwan Strait. Mar. Coast. Fish. 2017, 9, 271–280. [Google Scholar] [CrossRef]
- Froese, R.; Pauly, D. Fishbase. World Wide Web Electronic Publication. Version (01/2023). 2023. Available online: https://www.fishbase.de (accessed on 19 August 2022).
- Christensen, V.; Walters, C.J.; Pauly, D.; Forrest, R. Ecopath with Ecosim Version 6 User Guide; Fisheries Centre, University of British Columbia: Vancouver, BC, Canada, 2008; p. 281. [Google Scholar]
- Heymans, J.J.; Coll, M.; Link, J.S.; Mackinson, S.; Steenbeek, J.; Walters, C.; Christensen, V. Best practice in Ecopath with Ecosim food-web models for ecosystem-based management. Ecol. Modell. 2016, 331, 173–184. [Google Scholar] [CrossRef]
- Gulland, J.A. The fish resources of the ocean. In Fishing News [For the Food and Agriculture Organization]; Fishing News Ltd.: Surrey, UK, 1971. [Google Scholar]
- Ullah, M.H.; Rashed-Un-Nabi, M.; Al-Mamun, M.A. Trophic model of the coastal ecosystem of the Bay of Bengal using mass balance Ecopath model. Ecol. Model. 2012, 225, 82–94. [Google Scholar] [CrossRef]
- Morel, A.; Berthon, J.-F. Surface pigments, algal biomass profiles, and potential production of the euphotic layer: Relationships reinvestigated in view of remote-sensing applications. Limnol. Ocean. 1989, 34, 1545–1562. [Google Scholar] [CrossRef]
- Link, J.; Griswold, C.; Methratta, T.; Gunnrd, J. Documentation for the Energy Modeling and Analysis Exercise (EMAX). In Northeast Fisheries Science Center Reference Document 6; NOAA: Woods Hole, MA, USA, 2006. [Google Scholar]
- Ye, X. Particulate Organic Carbon and Suspended Particle Size Spectra in the Southern Taiwan Strait during Summer; Xiamen University: Xiamen, China, 2007. [Google Scholar]
- Duan, L.J. Modeling and Analysis Ecopath Model in the Coastal Ecosystem of the Pearl River Estuary; Sun Yat-sen University: Guangzhou, China, 2005. [Google Scholar]
- Lin, Q.; Jin, X.; Zhang, B. Trophic interactions, ecosystem structure and function in the southern Yellow Sea. Chin. J. Oceanol. Limnol. 2013, 31, 46–58. [Google Scholar] [CrossRef]
- Wang, X. Establishment of EwE Model of Marine Ecosystem in Northern Continental Shelf of South China Sea; Sun Yat-sen University: Guangzhou, China, 2005. [Google Scholar]
- Wang, D.; Lin, Z.J. Spatial and temporal variations of fish community structure in the Pearl River Estuary waters. South China Fish. Sci. 2006, 2, 37–45. (In Chinese) [Google Scholar]
- Lee, C.L.; Lin, W.J.; Liu, P.J.; Shao, K.T.; Lin, H.J. Highly productive tropical seagrass beds support diverse consumers and a large organic carbon pool in the sediments. Diversity 2021, 13, 544. [Google Scholar] [CrossRef]
- Piroddi, C.; Coll, M.; Steenbeek, J.; Moy, D.M.; Christensen, V. Modelling the Mediterranean marine ecosystem as a whole: Addressing the challenge of complexity. Mar. Ecol. Prog. Ser. 2015, 533, 47–65. [Google Scholar] [CrossRef]
- Ulanowicz, R.E. Growth and Development: Ecosystems Phenomenology; Springer Science & Business Media: Berlin/Heidelberg, Germany, 2012. [Google Scholar]
- Finn, J.T. Measures of ecosystem structure and function derived from analysis of flows. J. Theor. Biol. 1976, 56, 363–380. [Google Scholar] [CrossRef] [PubMed]
- Libralato, S.; Christensen, V.; Pauly, D. A method for identifying keystone species in food web models. Ecol. Modell. 2006, 195, 153–171. [Google Scholar] [CrossRef]
- Ulanowicz, R.E.; Puccia, C.J. Mixed Trophic Impacts in Ecosystems. Coenoses 1990, 5, 7–16. [Google Scholar]
- Rahman, M.F.; Al, M.A.; Akhtar, A.; Hoque, M.N.; Shafiqul Islam, M.; Sikder, M.N.A.; Barman, P.P. Structural patterns of fisheries communities with relation to ecological condition in subtropical coastal waters of the northern Bay of Bengal, Bangladesh. Indian J. Geo-Mar. Sci. 2019, 48, 1720–1732. [Google Scholar]
- Giralt Paradell, O.; Díaz López, B.; Methion, S.; Rogan, E. Food-web interactions in a coastal ecosystem influenced by upwelling and terrestrial runoff off North-West Spain. Mar. Environ. Res. 2020, 157, 104933. [Google Scholar] [CrossRef]
- Cross, W.F.; Wallace, J.B.; Rosemond, A.D.; Eggert, S.L. Whole-system nutrient enrichment increases secondary production in a detritus-based ecosystem. Ecology 2006, 87, 1556–1565. [Google Scholar] [CrossRef]
- Zhang, Y.; Richardson, J.S.; Negishi, J.N. Detritus processing, ecosystem engineering and benthic diversity: A test of predator-omnivore interference. J. Anim. Ecol. 2004, 73, 756–766. [Google Scholar] [CrossRef]
- Pauly, D.; Christensen, V. Primary production required to sustain global fisheries. Nature 1995, 374, 255–257. [Google Scholar] [CrossRef]
- Ju, P.; Cheung, W.W.L.; Chen, M.; Xian, W.; Yang, S.; Xiao, J. Comparing marine ecosystems of Laizhou and Haizhou Bays, China, using ecological indicators estimated from food web models. J. Mar. Syst. 2020, 202, 103238. [Google Scholar] [CrossRef]
- Jiang, H.; Cheng, H.Q.; Xu, H.G.; Arreguín-Sánchez, F.; Zetina-Rejón, M.J.; Del Monte Luna, P.; Le Quesne, W.J.F. Trophic controls of jellyfish blooms and links with fisheries in the East China Sea. Ecol. Model. 2008, 212, 492–503. [Google Scholar] [CrossRef]
- Cheung, W.L. Vulnerability of Marine Fishes to Fishing: From Global Overview to the Northern South China Sea; University of British Columbia: Vancouver, BC, Canada, 2007. [Google Scholar]
- Ma, S.; Cheng, J.; Li, J.; Liu, Y.; Wan, R.; Tian, Y. Interannual to decadal variability in the catches of small pelagic fishes from China Seas and its responses to climatic regime shifts. Deep. Sea Res. Part II Top. Stud. Oceanogr. 2019, 159, 112–129. [Google Scholar] [CrossRef]
- Cheng, J.; Cheung, W.W.L.; Pitcher, T.J. Mass-balance ecosystem model of the East China Sea. Prog. Nat. Sci. 2009, 19, 1271–1280. [Google Scholar] [CrossRef]
- Kim, D.H.; Seo, J.N.; Kim, H.S.; Lee, K. Estimation of productivity growth, technical progress, and efficiency changes in the Korean offshore fisheries. Fish. Sci. 2012, 78, 743–751. [Google Scholar] [CrossRef]
- Switzer, T.S.; Keenan, S.F.; Stevens, P.W.; McMichael, R.H.; MacDonald, T.C. Incorporating Ecology into Survey Design: Monitoring the Recruitment of Age-0 Gags in the Eastern Gulf of Mexico. N. Am. J. Fish. Manag. 2015, 35, 1132–114335. [Google Scholar] [CrossRef]
- Flannery, E.; Przeslawski, R. Comparison of sampling methods to assess benthic marine biodiversity. In Are Spatial and Ecological Relationships Consistent among Sampling Gear? Geoscience Australia: Canberra, Australia, 2015. [Google Scholar]
- La Peyre, M.K.; Sable, S.; Taylor, C.; Watkins, K.S.; Kiskaddon, E.; Baustian, M. Effects of sample gear on estuarine nekton assemblage assessments and food web model simulations. Ecol. Indic. 2021, 133, 108404. [Google Scholar] [CrossRef]
- Frederiksen, M.; Edwards, M.; Richardson, A.J.; Halliday, N.C.; Wanless, S. From plankton to top predators: Bottom-up control of a marine food web across four trophic levels. J. Anim. Ecol. 2006, 75, 1259–1268. [Google Scholar] [CrossRef]
- Krebs, C.J. The experimental analysis of distribution and abundance. In Ecology: The Experimental Analysis of Distribution and Abundance, 6th ed.; Benjamin Cummings: San Francisco, CA, USA, 2009. [Google Scholar]
- Shannon, L.; Coll, M.; Bundy, A.; Gascuel, D.; Heymans, J.J.; Kleisner, K.; Lynam, C.P.; Piroddi, C.; Tam, J.; Travers-Trolet, M. Trophic level-based indicators to track fishing impacts across marine ecosystems. Mar. Ecol. Prog. Ser. 2014, 512, 115–140. [Google Scholar] [CrossRef]
- Hunter, M.D.; Price, P.W. Playing chutes and ladders: Heterogeneity and the relative roles of bottom-up and top-down forces in natural communities. Ecology 1992, 73, 724–732. [Google Scholar] [CrossRef]
- Li, B.; Liao, C.H.; Zhang, X.D.; Chen, H.L.; Wang, Q.; Chen, Z.Y.; Gan, X.J.; Wu, J.H.; Zhao, B.; Ma, Z.J.; et al. Spartina alterniflora invasions in the Yangtze River estuary, China: An overview of current status and ecosystem effects. Ecol. Eng. 2009, 35, 511–520. [Google Scholar] [CrossRef]
- Zeng, Z.; Cheung, W.W.L.; Li, S.; Hu, J.; Wang, Y. Effects of climate change and fishing on the Pearl River Estuary ecosystem and fisheries. Rev. Fish Biol. Fish. 2019, 29, 861–875. [Google Scholar] [CrossRef]
- Guénette, S.; Christensen, V.; Pauly, D. Trophic modelling of the Peruvian upwelling ecosystem: Towards reconciliation of multiple datasets. Prog. Oceanogr. 2008, 79, 326–335. [Google Scholar] [CrossRef]
- Baum, J.K.; Worm, B. Cascading top-down effects of changing oceanic predator abundances. J. Anim. Ecol. 2009, 78, 699–714. [Google Scholar] [CrossRef] [PubMed]
- Lynam, C.P.; Llope, M.; Möllmann, C.; Helaouët, P.; Bayliss-Brown, G.A.; Stenseth, N.C. Interaction between top-down and bottom-up control in marine food webs. Proc. Natl. Acad. Sci. USA 2017, 114, 1952–1957. [Google Scholar] [CrossRef]
- Wang, F.; Wu, Y.; Chen, Z.; Zhang, G.; Zhang, J.; Zheng, S.; Kattner, G. Trophic interactions of mesopelagic fishes in the south China sea illustrated by stable isotopes and fatty acids. Front. Mar. Sci. 2019, 5, 522. [Google Scholar] [CrossRef]
- Davison, P.C.; Checkley, D.M.; Koslow, J.A.; Barlow, J. Carbon export mediated by mesopelagic fishes in the northeast Pacific Ocean. Prog. Ocean. 2013, 116, 14–30. [Google Scholar] [CrossRef]
- Olivar, M.P.; Contreras, T.; Hulley, P.A.; Emelianov, M.; López-Pérez, C.; Tuset, V.; Castellón, A. Variation in the diel vertical distributions of larvae and transforming stages of oceanic fishes across the tropical and equatorial Atlantic. Prog. Oceanogr. 2018, 160, 83–100. [Google Scholar] [CrossRef]
- Surma, S.; Pakhomov, E.A.; Pitcher, T.J. Energy-based ecosystem modelling illuminates the ecological role of Northeast Pacific herring. Mar. Ecol. Prog. Ser. 2018, 588, 147–161. [Google Scholar] [CrossRef]
- Coll, M.; Shannon, L.J.; Moloney, C.L.; Palomera, I.; Tudela, S. Comparing trophic flows and fishing impacts of a NW Mediterranean ecosystem with coastal upwelling systems by means of standardized models and indicators. Ecol. Model. 2006, 198, 53–70. [Google Scholar] [CrossRef]
- Lan, K.W.; Lee, M.A.; Zhang, C.I.; Wang, P.Y.; Wu, L.J.; Lee, K.T. Effects of climate variability and climate change on the fishing conditions for grey mullet (Mugil cephalus L.) in the Taiwan Strait. Clim. Chang. 2014, 126, 189–202. [Google Scholar] [CrossRef]
- Lau, N.C.; Nath, M.J. ENSO modulation of the interannual and intraseasonal variability of the East Asian monsoon—A model study. J. Clim. 2006, 19, 4508–4530. [Google Scholar] [CrossRef]
- Yang, J.W.; Wu, W.; Chung, C.C.; Chiang, K.P.; Gong, G.C.; Hsieh, C.H. Predator and prey biodiversity relationship and its consequences on marine ecosystem functioning—Interplay between nanoflagellates and bacterioplankton. ISME J. 2018, 12, 1532–1542. [Google Scholar] [CrossRef] [PubMed]
- Young, J.W.; Hunt, B.P.V.; Cook, T.R.; Llopiz, J.K.; Hazen, E.L.; Pethybridge, H.R.; Ceccarelli, D.; Lorrain, A.; Olson, R.J.; Allain, V.; et al. The trophodynamics of marine top predators: Current knowledge, recent advances and challenges. Deep. Sea Res. Part II Top. Stud. Oceanogr. 2015, 113, 170–187. [Google Scholar] [CrossRef]
- Tam, J.; Taylor, M.H.; Blaskovic, V.; Espinoza, P.; Ballón, R.M.; Díaz, E.; Wosnitza-Mendo, C.; Argüelles, J.; Purca, S.; Ayón, P.; et al. Trophic modeling of the Northern Humboldt Current Ecosystem, part I: Comparing trophic linkages under La Niña and El Niño conditions. Prog. Oceanogr. 2008, 79, 352–365. [Google Scholar] [CrossRef]
- Del Solar, A.; Romagnoni, G.; Kluger, L.C.; Céspedes, C.M.S.; Wolff, M. Comparative food web analysis of two Peruvian bay systems along a latitudinal gradient: Resource use and the environmental envelope. Front. Mar. Sci. 2022, 9, 829424. [Google Scholar] [CrossRef]
- Dang, X.; Bai, Y.; Gong, F.; Chen, X.; Zhu, Q.; Huang, H.; He, X. Different Responses of Phytoplankton to the ENSO in Two Upwelling Systems of the South China Sea. Estuaries Coasts 2022, 45, 485–500. [Google Scholar] [CrossRef]
- Zhang, C. Responses of summer upwelling to recent climate changes in the Taiwan strait. Remote Sens. 2021, 13, 1386. [Google Scholar] [CrossRef]
- Cheng, Y.H.; Chang, M.H. Exceptionally cold water days in the southern Taiwan Strait: Their predictability and relation to la Niña. Nat. Hazards Earth Syst. Sci. 2018, 18, 1999–2010. [Google Scholar] [CrossRef]
- Christensen, V.; Walters, C.J.; Pauly, D. Ecopath with Ecosim: A User’s Guide, November 2005 ed.; Fisheries Centre, University of British Columbia: Vancouver, BC, Canada, 2005; p. 154. [Google Scholar]
- Heymans, J.J.; Shannon, L.J.; Jarre, A. Changes in the northern Benguela ecosystem over three decades: 1970s, 1980s, and 1990s. Ecol. Modell. 2004, 172, 175–195. [Google Scholar] [CrossRef]
- Lee, W.H. Seasonal Ecosystem Structures and the Influence of Fishing Activities in the Southwestern Taiwan Straits. Master’s Thesis, National Taiwan Ocean University, Keelung, China, 2022. [Google Scholar]
- Papantoniou, G.; Giannoulaki, M.; Stoumboudi, M.T.; Lefkaditou, E.; Tsagarakis, K. Food web interactions in a human dominated Mediterranean coastal ecosystem. Mar. Environ. Res. 2021, 172, 105507. [Google Scholar] [CrossRef]
- Bruno, J.F.; Carr, L.A.; O’Connor, M.I. Exploring the role of temperature in the ocean through metabolic scaling. Ecology 2015, 96, 3126–3140. [Google Scholar] [CrossRef]
- Shokri, M.; Cozzoli, F.; Vignes, F.; Bertoli, M.; Pizzul, E.; Basset, A. Metabolic rate and climate change across latitudes: Evidence of mass-dependent responses in aquatic amphipods. J. Exp. Biol. 2022, 225, jeb244842. [Google Scholar] [CrossRef] [PubMed]
- Shokri, M.; Lezzi, L.; Basset, A. The seasonal response of metabolic rate to projected climate change scenarios in aquatic amphipods. J. Therm. Biol. 2024, 124, 103941. [Google Scholar] [CrossRef] [PubMed]
- Walters, C.; Christensen, V.; Pauly, D. Structuring dynamic models of exploited ecosystems from trophic mass-balance assessments. Rev. Fish Biol. Fish. 1997, 7, 139–172. [Google Scholar] [CrossRef]
- Crozier, L.G.; McClure, M.M.; Beechie, T.; Bograd, S.J.; Boughton, D.A.; Carr, M.; Cooney, T.D.; Dunham, J.B.; Greene, C.M.; Haltuch, M.A.; et al. Climate vulnerability assessment for Pacific salmon and steelhead in the California Current Large Marine Ecosystem. PLoS ONE 2019, 14, e0217711. [Google Scholar] [CrossRef]
- Free, C.M.; Jensen, O.P.; Anderson, S.C.; Gutierrez, N.L.; Kleisner, K.M.; Longo, C.; Minto, C.; Osio, G.C.; Walsh, J.C. Blood from a stone: Performance of catch-only methods in estimating stock biomass status. Fish Res. 2020, 223, 105452. [Google Scholar] [CrossRef]
- Lin, Y.S. Using Ecological Models to Evaluate the Impact of Offshore Wind Farm on Fishery Resources off Miaoli. Master’s Thesis, National Taiwan Ocean University, Keelung, China, 2022. [Google Scholar]
- Zhou, S.; Klaer, N.L.; Daley, R.M.; Zhu, Z.; Fuller, M.; Smith, A.D.M. Modelling multiple fishing gear efficiencies and abundance for aggregated populations using fishery or survey data. ICES J. Mar. Sci. 2014, 71, 2436–2447. [Google Scholar] [CrossRef]
| Parameter | La Niña | Normal | El Niño | Unit | |
|---|---|---|---|---|---|
| Ecosystem Structure | Total number of pathways | 824 | 2108 | 345 | |
| Mean length of pathways | 7.217 | 7.757 | 6.774 | ||
| System omnivory index | 0.333 | 0.247 | 0.264 | ||
| Shannon diversity index | 2.462 | 2.313 | 2.557 | ||
| Connectance Index | 0.267 | 0.269 | 0.265 | ||
| Maximum trophic level | 3.866 | 3.751 | 3.782 | ||
| Ecosystem productivity | Total system throughput | 11,121.62 | 10,556.30 | 10,957.02 | t/km2/year |
| Cycles and Flows | Transfer efficiency | 15.69% | 12.26% | 13.40% | |
| Cycling index (Finn’s) | 0.555 | 0.152 | 0.288 | % of throughput | |
| Consumption and Respiration | Sum of all consumption | 4315.664 | 3853.056 | 4057.582 | t/km2/year |
| Sum of all export | 1989.309 | 2091.331 | 2127.226 | t/km2/year | |
| Sum of all respiratory | 2697.572 | 2489.028 | 2580.958 | t/km2/year | |
| Sum of all flows into detritus | 2119.073 | 2122.888 | 2191.254 | t/km2/year | |
| Fishery | Landing | 5.473 | 10.569 | 12.425 | t/km2/year |
| Mean trophic level of catch | 2.995 | 2.730 | 2.663 |
| No. | Group Name | El Niño TD | La Niña TD | Normal TD | El Niño BU | La Niña BU | Normal BU | |
|---|---|---|---|---|---|---|---|---|
| Predator fish | 1 | Thunnus albacares | 0.866 | 0.847 | 0.939 | 0.134 | 0.153 | 0.061 |
| 2 | Katsuwonus pelamis | 0.896 | 0.956 | 0.871 | 0.104 | 0.044 | 0.129 | |
| 3 | Coryphaena hippurus | 0.935 | 0.975 | 0.936 | 0.065 | 0.025 | 0.064 | |
| 4 | Scomberomorus commerson | 0.774 | 0.972 | 0.957 | 0.226 | 0.028 | 0.043 | |
| Pelagic fish | 5 | Scomber australasicus | 0.756 | 0.697 | 0.752 | 0.244 | 0.303 | 0.248 |
| 6 | Scomber japonicus | 0.692 | 0.371 | 0.684 | 0.308 | 0.629 | 0.316 | |
| 7 | Trachurus japonicus | 0.628 | 0.600 | 0.788 | 0.372 | 0.400 | 0.212 | |
| 8 | other mackerels | 0.803 | 0.475 | 0.783 | 0.197 | 0.525 | 0.217 | |
| 9 | Auxis rochei rochei | 0.728 | 0.568 | 0.642 | 0.272 | 0.432 | 0.358 | |
| Small pelagic fish | 10 | Etrumeus micropus | 0.599 | 0.620 | 0.565 | 0.401 | 0.380 | 0.435 |
| 11 | Sardinella spp. | 0.912 | 0.766 | 0.688 | 0.088 | 0.234 | 0.312 | |
| 12 | Decapterus maruadsi | 0.549 | 0.682 | 0.425 | 0.451 | 0.318 | 0.575 | |
| Benthic and Reef fish | 13 | Seriola dumerili | 0.998 | 0.996 | 0.996 | 0.002 | 0.004 | 0.004 |
| 14 | Mene maculata | 0.707 | 0.518 | 0.685 | 0.293 | 0.482 | 0.315 | |
| 15 | Decapterus kurroides | 0.629 | 0.355 | 0.439 | 0.371 | 0.645 | 0.561 | |
| 16 | Polydactylus sextarius | 0.982 | 0.998 | 0.995 | 0.018 | 0.002 | 0.005 | |
| Cephalopod | 17 | Uroteuthis chinensis | 0.884 | 0.963 | 0.887 | 0.116 | 0.037 | 0.113 |
| 18 | Loliginidae | 0.950 | 0.970 | 0.812 | 0.050 | 0.030 | 0.188 | |
| Crustaceans | 19 | Portunus sanguinolentus | 0.948 | 0.913 | 0.968 | 0.052 | 0.087 | 0.032 |
| 20 | Penaeus japonicus | 0.304 | 0.293 | 0.297 | 0.696 | 0.707 | 0.703 | |
| 21 | Penaeus penicillatus | 0.329 | 0.298 | 0.385 | 0.671 | 0.702 | 0.615 | |
| 22 | Metapenaeopsis barbata | 0.977 | 0.956 | 0.940 | 0.023 | 0.044 | 0.060 | |
| 23 | Metanephrops thomsoni | 0.856 | 0.817 | 0.886 | 0.144 | 0.183 | 0.114 | |
| Zooplankton | 24 | Zooplankton_P | 0.946 | 0.909 | 0.934 | 0.054 | 0.091 | 0.066 |
| 25 | Zooplankton_B | 0.790 | 0.819 | 0.808 | 0.210 | 0.181 | 0.192 | |
| Phytoplankton | 26 | Phytoplankton_P | 0.240 | 0.212 | 0.209 | 0.760 | 0.788 | 0.791 |
| 27 | Phytoplankton_B | 0.181 | 0.174 | 0.212 | 0.819 | 0.826 | 0.788 | |
| Detritus | 28 | Detritus | 0.025 | 0.038 | 0.023 | 0.975 | 0.962 | 0.977 |
| Fleet | Fleet | 0.739 | 0.790 | 0.763 | 0.261 | 0.210 | 0.237 | |
| Mean | Mean | 0.711 | 0.674 | 0.699 | 0.289 | 0.326 | 0.301 |
| Parameters | La Niña | Normal | El Niño | East China Sea | South China Sea | Southern TS |
|---|---|---|---|---|---|---|
| System omnivory index | 0.33 | 0.25 | 0.26 | 0.2 | 0.18 | 0.21 |
| Shannon diversity index | 2.46 | 2.31 | 2.56 | - | - | - |
| Connectance index | 0.27 | 0.27 | 0.26 | 0.19 | 0.30 | 0.22 |
| Total system throughput | 11,121.62 | 10,556.30 | 10,957.02 | - | 262,118 | 18,832.08 |
| Transfer efficiency | 15.69% | 12.26% | 13.40% | 14.6% | 10.2% | 15.57% |
| Cycling index (Finn’s) | 0.555 | 0.152 | 0.288 | 0.18 | - | 0.12 |
| Sum of all consumption/TST (Q/TST) | 0.39 | 0.37 | 0.37 | - | 0.01 | 0.5 |
| Sum of all exports/TST (Ex/TST) | 0.18 | 0.20 | 0.19 | - | 0.49 | 0.03 |
| Sum of all respiratory flows/TST (R/TST) | 0.24 | 0.24 | 0.24 | - | 0.01 | 0.32 |
| Sum of all flows into detritus/TST (FD/TST) | 0.19 | 0.20 | 0.20 | - | 0.50 | 0.16 |
| Mean trophic level of catch | 3.00 | 2.73 | 2.66 | 2.71 | 2.85 | 3.49 |
| Reference | Jiang et al. [68] | Cheung [69] | Ju et al. [20] |
Disclaimer/Publisher’s Note: The statements, opinions and data contained in all publications are solely those of the individual author(s) and contributor(s) and not of MDPI and/or the editor(s). MDPI and/or the editor(s) disclaim responsibility for any injury to people or property resulting from any ideas, methods, instructions or products referred to in the content. |
© 2024 by the authors. Licensee MDPI, Basel, Switzerland. This article is an open access article distributed under the terms and conditions of the Creative Commons Attribution (CC BY) license (https://creativecommons.org/licenses/by/4.0/).
Share and Cite
Hsiao, P.-Y.; Lan, K.-W.; Lee, W.-H.; Liang, T.-Y.; Liao, C.-H.; Su, N.-J. Impacts of El Niño–Southern Oscillation (ENSO) Events on Trophodynamic Structure and Function in Taiwan Bank Marine Ecosystem. Diversity 2024, 16, 572. https://doi.org/10.3390/d16090572
Hsiao P-Y, Lan K-W, Lee W-H, Liang T-Y, Liao C-H, Su N-J. Impacts of El Niño–Southern Oscillation (ENSO) Events on Trophodynamic Structure and Function in Taiwan Bank Marine Ecosystem. Diversity. 2024; 16(9):572. https://doi.org/10.3390/d16090572
Chicago/Turabian StyleHsiao, Po-Yuan, Kuo-Wei Lan, Wen-Hao Lee, Ting-Yu Liang, Cheng-Hsin Liao, and Nan-Jay Su. 2024. "Impacts of El Niño–Southern Oscillation (ENSO) Events on Trophodynamic Structure and Function in Taiwan Bank Marine Ecosystem" Diversity 16, no. 9: 572. https://doi.org/10.3390/d16090572
APA StyleHsiao, P.-Y., Lan, K.-W., Lee, W.-H., Liang, T.-Y., Liao, C.-H., & Su, N.-J. (2024). Impacts of El Niño–Southern Oscillation (ENSO) Events on Trophodynamic Structure and Function in Taiwan Bank Marine Ecosystem. Diversity, 16(9), 572. https://doi.org/10.3390/d16090572