Abstract
Butterflies of the genus Borbo are mainly distributed in the Oriental and Australian regions and are considered pests of important crops. However, no mitochondrial genomes have been reported for this genus until now, leaving the evolutionary characteristics and differentiation patterns of their mitogenomes unclear. In this study, we present the first complete mitochondrial genome sequence of the rice swift, Borbo cinnara. The circular double-stranded mitogenome was 15,508 bp in length, comprising 13 protein-coding genes (PCGs), 2 ribosomal RNA genes (rRNAs), 22 transfer RNA genes (tRNAs), and 1 non-coding control region (CR). Among the mitogenomes of Hesperiinae, the ND3 gene was found to be the most variable PCG, while COX1 was the most conserved. Selection pressure analysis revealed that ND3 was under relaxed purifying selection, whereas COX1 was subjected to strong purifying selection. Phylogenetic trees reconstructed using both the Bayesian inference (BI) and maximum likelihood (ML) methods yielded robust and identical topologies, confirming the sister relationship between B. cinnara and Pelopidas mathias at the mitogenome level. Methodologically, this research enriches novel molecular markers for the species identification of butterflies and enhances our understanding of mitogenomic evolution in Lepidoptera.
1. Introduction
Insect mitochondrial genomes are circular double-stranded DNA molecules, typically ranging in length from 14 to 20 kb in length and exhibiting remarkable conservation [1,2,3]. Mitogenomes generally consist of 37 genes: 13 protein-encoding genes (PCGs), 2 ribosomal RNA genes (rRNAs), 22 transfer RNA genes (tRNAs), and 1 non-coding A+T-rich region (or control region), which houses the initiation sites for transcription and replication [4,5]. Due to their cellular abundance, rapid evolution, and lack of introns, mitogenome sequences are easily amplified [6]. Compared to nuclear genes, mitogenomes have a compact size, maternal inheritance, conservative organization, lack of extensive recombination, and a higher mutation rate. Consequently, mitogenomes are widely used in studies of phylogenetic relationships, population genetics, and biogeography [3,7,8,9].
The butterfly genus Borbo, belonging to the tribe Baorini of the subfamily Hesperiinae, includes 17 known species worldwide, primarily distributed in the Oriental and Australian regions [10,11]. The larvae of many of these species feed on crops such as rice, corn, and sugarcane, causing significant agricultural damage during large outbreaks [11]. Despite their impact, current taxonomic studies on this genus rely mainly on morphological characteristics and a few partial gene fragments [10,12,13,14]. Previous research has shown that phylogenetic and evolutionary analyses based on whole mitogenome sequences are more reliable and stable than those based on single or partial gene fragments [6,15]. However, no mitogenomes from this group have been reported before, meaning that the evolutionary characteristics and differentiation patterns of their mitochondrial genomes remain unclear and underexplored.
Borbo cinnara (Wallace, 1866), commonly known as the rice swift, is considered a minor pest of the economically important crop Oryza sativa L. (Asian rice) [16]. In this study, we sequenced, annotated, and analyzed the complete mitogenome of this species. We then conducted comparative analysis of mitogenome features among Hesperiinae species, focusing on genomic structure, nucleotide composition, and codon usage of the protein-coding genes (PCGs). Additionally, we reconstructed the phylogenetic relationships within the subfamily Hesperiinae using current mitogenome information, analyzed the taxonomic status of B. cinnara, and explored its phylogenetic relationships with related species at the mitogenome level.
2. Materials and Methods
2.1. Sample Collection and DNA Extraction
The B. cinnara samples utilized in this study were obtained from Luocheng (108°54′30″ E, 24°47′20″ N) on Duranta erecta in Guangxi Zhuang Autonomous Region, China. All fresh specimens were immediately soaked in 100% ethyl alcohol and then stored in a −20 °C refrigerator in our laboratory to facilitate DNA extraction. The identification of adult specimens was based on morphological characteristics as described by Yuan et al. (2015) and confirmed via COX1 gene fragment using the NCBI database [17]. All specimens and vouchers were deposited at the School of Life Sciences, Qufu Normal University, Shandong, China.
Total genomic DNA was extracted from thorax and leg tissues using the Takara Genomic DNA Extraction Kit (Sangon Biotech, Shanghai, China) following the manufacturer’s protocols. The quality of the extracted DNA was evaluated on a 1% agarose gel and further assessed using a Nanodrop 2000 spectrophotometer (Thermo, Wilmington, NC, USA). The extracted DNA was then preserved at −20 °C and used for future sequencing.
2.2. Primer Design, PCR Amplification and Sequencing
The complete mitogenome of B. cinnara was generated with overlapping fragments by means of the polymerase chain reaction (PCR) and Sanger sequencing [7]. Several pairs of universal primers for butterfly mitogenomes were used for PCR amplification [7,18]. Specific primers were designed by Primer Premier 5 to amplify overlapping segments of the whole mitogenome [19]. All fragments were amplified using Takara Ex-Taq polymerase (Takara, Dalian, China) under the conditions mentioned in a previous study [20]. The PCR products were electrophoresed on 1% agarose gels, and the target fragments were purified from excised pieces of gel using a SanPrep DNA Gel Extraction Kit (Sangon, Shanghai, China). Finally, the appropriate products were sequenced via the primer-walking strategy from both strands in Genscript Biotech Corp. (Nanjing, China) [20].
2.3. Mitogenome Assembly and Bioinformatic Analysis
All DNA sequences were checked with the SeqMan program of DNASTAR (Madison, WI, USA) and assembled using Geneious R9 [21,22]. The assembled mitogenome was initially annotated using the MITOS web server (http://mitos2.bioinf.uni-leipzig.de/, with the invertebrate mitochondrial genetic code [23]. PCGs were further adjusted and corrected manually using reference mitogenomes of Hesperiidae to identify the non-normal start and stop codons. To verify the primary annotation results, tRNAs and rRNAs were identified by aligning them with homologous genes of previously sequenced hesperiid mitogenomes. Intergenic and overlapping regions of the genome were manually estimated. Secondary structures of 22 tRNAs were determined using tRNAscan-SE 1.21 and ARWEN 1.2 [24,25]. The mitogenome map was produced using the visualization module of MitoZ [26].
For the comparative analysis, sequences from 20 additional Hesperiinae species were downloaded from GenBank (Table S1). A total of 21 species were analyzed to assess nucleotide composition and skew, codon usage of PCGs, and relative synonymous codon usage (RSCU) values. Codon usage statistics were calculated using MEGA X and PhyloSuite v1.2.1 [27,28], while strand asymmetry was determined using the following formulas: AT skew = [A − T]/[A + T] and GC skew = [G − C]/[G + C] [29]. Nucleotide diversity analysis, with a sliding window of 100 bp and a step size of 25 bp, was performed using DnaSP 5.0. Additionally, the number of synonymous substitutions (Ks) and non-synonymous substitutions (Ka) and the Ka/Ks ratios for each PCG were calculated using DnaSP 5.0 [30].
2.4. Phylogenetic Analysis
The mitogenome sequences of 24 Hesperiidae butterflies were used for phylogenetic analysis, and mitogenomes of Heteropterus morpheus (Heteropterinae), Leptalina unicolor (Heteropterinae) and Rachelia extrusus (Trapezitinae) served as outgroups. Detailed information and accession numbers of these mitogenomes are listed in Table S1. The concatenated nucleotide sequences of 13 PCGs and two rRNAs were used in our analyses. Sequences of each PCG were aligned individually with codon-based multiple alignments using MAFFT 7.205 by codon using the L-INS-i algorithm [31]. Sequences of each rRNA were aligned separately using the G-INS-i strategy. DAMBE 5 was then used to test the nucleotide saturation, and Gblocks 0.91b was used with default settings to identify the poorly aligned positions [32,33]. Individual alignment fragments were finally concatenated using PhyloSuite [28]. The phylogenetic trees were reconstructed using both the Bayesian inference (BI) and maximum likelihood (ML) methods. The optimal partition strategy and substitution models were selected using PartitionFinder 2 with the greedy algorithm [34]. ML analysis was performed using RAxML 8.2.0 with 1000 bootstrap replicates under the automatic model prediction [35]. BI analysis was carried out using MrBayes 3.2.215 under the following conditions: two independent Markov-chain Monte Carlo runs for 1,000,000 generations, sampling every 1000 generations, with a burn-in of 25% [36]. Finally, phylogenetic trees were checked and visualized in FigTree 1.4.2 [37].
3. Results and Discussion
3.1. General Mitogenomic Features
The complete mitogenome of B. cinnara was 15,508 bp in size, comprising 37 typical genes including 13 protein-coding genes (PCGs), 22 transfer RNAs (tRNAs), 2 ribosomal RNAs (rRNAs), and 1 long non-coding region known as the control region (CR) (Figure 1). Of these, 23 genes (9 PCGs and 14 tRNAs) were encoded on the majority strand (J-strand), while the remaining 14 genes (4 PCGs, 2 rRNAs, and 8 tRNAs) were located on the minority strand (N-strand) (Table 1). The organization and gene order were in keeping with those of other hesperiid butterflies previously reported (Table 1). All genes were arranged in the same order and direction as in the ancestral insect Drosophila yakuba, with the exception of the order among three (trnI, trnQ, and trnM) [38]. Comparative analysis showed that this rearrangement of tRNAs was extremely conservative within Lepidoptera, suggesting it might be regarded as a clear molecular synapomorphy for this order [39,40].
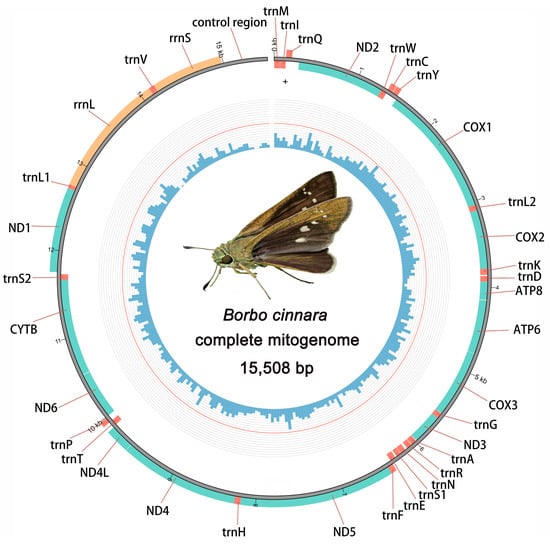
Figure 1.
Complete mitochondrial genome map of B. cinnara. Genes transcribed anticlockwise outside and clockwise inside. The blue histogram on the inside indicates the GC content.

Table 1.
Organization of the B. cinnara mitochondrial genome.
As is typical for Lepidoptera, the mitogenome of B. cinnara exhibited a significant bias towards A and T, with a nucleotide composition of 40.02% A, 40.90% T, 7.41% G, and 11.67% C. The highest A+T content was found in the control region (93.31%), while the lowest was in the PCGs (79.28%). The A+T content in each gene component showed a decreasing trend as follows: CR > rRNAs > tRNAs > PCGs. The AT skew and GC skew of the entire genome and PCGs were negative, while those of tRNAs and rRNAs were positive. This situation of nucleotide bias may be due to the asymmetric mutation during replication and transcription. Notably, the AT skew of CR was positive (0.104), and the GC skew was zero, indicating an equal number of Gs and Cs.
3.2. Protein-Coding Genes
The 13 protein-coding genes (PCGs) of B. cinnara span 11,148 bp, accounting for 71.87% of the total mitogenome sequence. Four of these genes (ND1, ND4, ND4L and ND5) were encoded on the N-strand, while the remaining nine were located on the J-strand, consistent with findings in other reported butterfly mitogenomes (Figure 1 and Table 1). The shortest PCG is ATP8 (168 bp), while the longest is ND5 (1723 bp). All PCGs, except for COX1, begin with typical ATN start codons (ATA/ATG/ATT). Notably, COX1 uses an alternative start codon, CGA, a feature observed in many other insect mitogenomes [41,42]. Regarding stop codons, all PCGs terminated with the complete TAA codon, except for COX2, ND4 and ND5, which end with a single T. These incomplete stop codons are likely to be completed through post-transcriptional polyadenylation [43].
In addition to the stop codons, the mitogenome of B. cinnara encoded 3703 amino acids. Relative synonymous codon usage (RSCU) values were calculated and visualized in Figure 2. All possible synonymous codons of the 22 amino acids, except for AGG, were detected. Leucine (Leu2), phenylalanine (Phe), asparagine (Asn) and tyrosine (Tyr) were the most frequently encoded amino acids, with isoleucine (Ile) possessing the highest RSCU value (Table S2). Meanwhile, UUA (L), AUU (I), and UUU (F) were the most frequently used codons in this mitogenome. Comparative analysis suggested that codon frequencies might be one of the possible factors for the biased usage of A+T content.
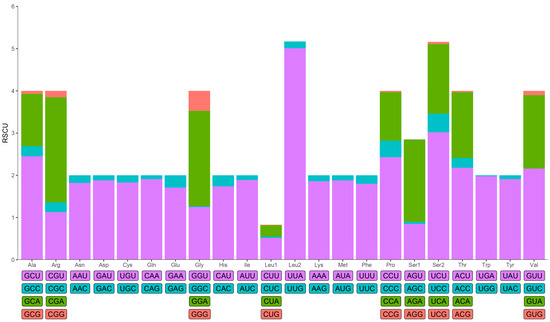
Figure 2.
Relative synonymous codon usage (RSCU) of the mitogenome of B. cinnara.
3.3. Ribosomal and Transfer RNA Genes
Both the large rRNA (rrnL) and small rRNA (rrnS) genes were identified in the sequenced mitogenome, with rrnL located between trnL1 and trnV and rrnS positioned between trnV and the control region. Both genes were oriented on the N-strand (Figure 1 and Table 1). The lengths of rrnL and rrnS were 1352 bp and 802 bp, with A+T contents of 83.24% and 85.66%, respectively. Both rRNAs displayed positive AT skew and GC skew, consistent with observations in other lepidopteran mitogenomes [39,40]. All 22 typical tRNA genes were detected, ranging in size from 59 to 71 bp (Table 1). Fourteen genes were encoded on the J-strand and eight on the N-strand, aligning with other Lepidoptera species. All tRNAs were found to be folded into typical cloverleaf secondary structures, except for trnS1, which lacked the dihydrouridine (DHU) arm and formed a simple ring instead (Figure 3). The missing DHU arm of trnS1 is considered a common phenomenon in many other insect taxa [20,40]. Besides the normal base pairs (A-U and C-G), the secondary cloverleaf stems also included multiple non-Watson–Crick base pairs (15 G-U pairs and seven U-U pairs). These mismatches can be corrected through editing processes, ensuring that they do not affect the transport function in insect mitogenomes [44].
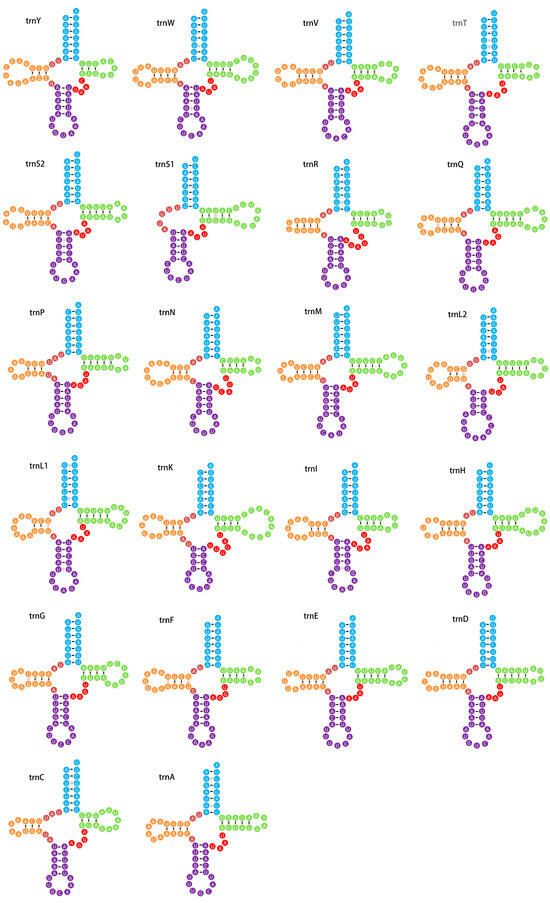
Figure 3.
Secondary structures of 22 tRNAs in the mitogenome of B. cinnara. Blue: amino acid accepter arm; Green: TψC arm; Red: variable loop; Purple: anticodon arm; Orange: dihydorouidine arm.
3.4. Non-Coding Regions
Previous studies have shown that the number and size of overlapping regions and intergenic spacer regions vary significantly between species, contributing to differences in the overall length of the mitogenome [20]. In the mitogenome of B. cinnara, seven overlapping regions were identified, ranging in size from one to eight base pairs. Notably, the overlap at the ATP6/ATP8 boundary is conserved across butterfly mitogenomes, with the 7 bp nucleotide fragment (5′-ATGATAA-3′) being identical to that found in other available mitogenomes [45]. Additionally, 19 intergenic regions of varying sizes (1–523 bp) are present in this mitogenome. The longest intergenic spacer (IGS) region, aside from the control region, is 85 bp and is located between trnQ and ND2. Among the non-coding regions, the largest is the control region, which spans 523 bp and is situated between the rrnS and trnI genes. This region, also known as the A+T-rich region due to its nucleotide composition, contains the highest percentage of A+T nucleotides and plays a crucial role in the regulation and initiation of mitochondrial DNA transcription and replication.
3.5. Comparative Analysis of Hesperiinae Mitogenomes
The mitogenome sequences of 21 Hesperiinae butterflies displayed a significant AT nucleotide bias, ranging from 71.99% to 78.57%, with the AT content in the protein-coding genes (PCGs) being slightly lower than in other regions (Figure 4). Compositional asymmetry, measured by AT and GC skews, showed that the AT skew for tRNAs and rRNAs was predominantly positive, while other regions exhibited negative values, indicating a higher number of T nucleotides compared to As (Figure 5). The GC skew for the entire sequences of the 21 genomes was consistently negative (−0.18 to −0.25), while it was positive for tRNAs and rRNAs. Interestingly, the GC skew across the three matrices of PCGs varied among species, even among closely related ones, suggesting that GC content is not conserved within Hesperiinae. Additionally, the AT content of PCG3 was significantly higher than that of PCG123 and PCG12. Codon usage patterns and the most frequently used codons across the 21 mitogenomes were highly conservative. The most frequently used amino acids were isoleucine (Ile), leucine (Leu), and phenylalanine (Phe), which were encoded by codons with high A or T contents (Figure 6). This AT content and codon usage bias might result from synonymous codon usage in mitogenomes favoring codons ending in A or T, which could facilitate transcription [46,47].
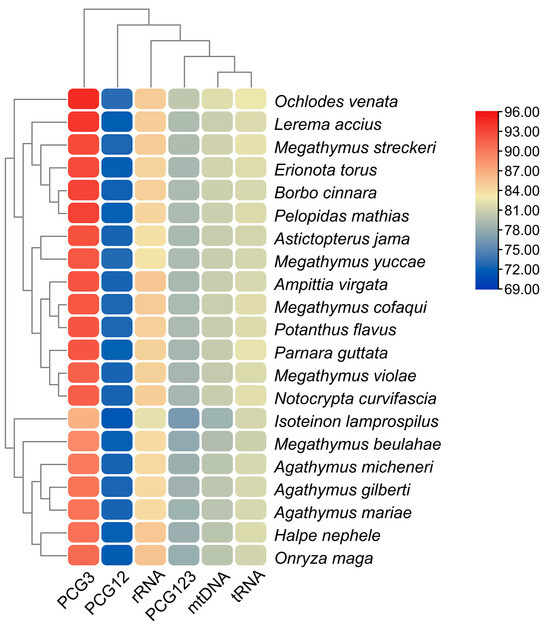
Figure 4.
Nucleotide composition across different datasets of 21 Hesperiinae mitogenomes.
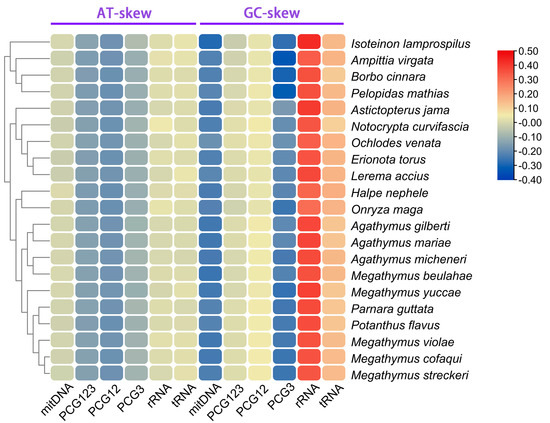
Figure 5.
Nucleotide composition of various datasets of 21 Hesperiinae mitogenomes.
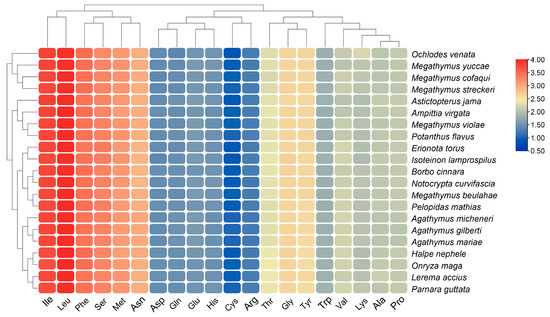
Figure 6.
Amino acid composition of all protein-coding genes (PCGs) across the 21 Hesperiinae mitogenomes.
Figure 7A illustrates the nucleotide diversity of Hesperiinae mitogenomes (PCGs) using a sliding window of 100 bp. The most variable region was identified in ND3, while COX1 exhibited the lowest nucleotide diversity (Pi), consistent with observations in other insects [48]. The Ka (nonsynonymous substitutions) and Ks (synonymous substitutions) values are widely used as indicators of selective pressure [49]. To evaluate the evolutionary rates of Hesperiinae PCGs, we calculated the average Ka/Ks ratios, which ranged from 0.07 (COX1) to 0.79 (ND3), indicating that all PCGs are under purifying selection (Ka/Ks < 1). Our in-depth analysis showed that ND3 is subject to relaxed purifying selection, whereas COX1 and COX2 are under the strongest purifying selection (Figure 7B), highlighting the strong functional constraints on Hesperiinae genes.
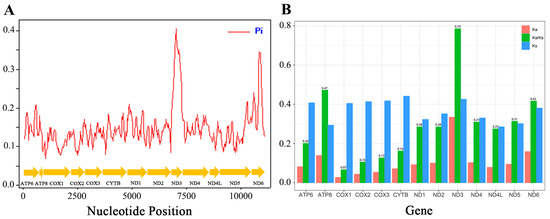
Figure 7.
(A) Sliding window analysis conducted on 13 aligned protein-coding genes (PCGs), with the blue line representing nucleotide diversity (Pi). (B) The ratio of non-synonymous (Ka) to synonymous (Ks) substitution rates was calculated across the 13 PCGs for 21 species within the Hesperiinae subfamily.
3.6. Phylogenetic Analysis
In the present study, the mitogenomes of 24 Hesperiinae species and three outgroup species (one species of Trapezitinae and two of Heteropterinae) were used to reconstruct the phylogenetic relationships of Hesperiinae. The matrix contained 12,333 sites, including all codon positions of 13 PCGs plus 2 rRNAs. DAMBE analysis confirmed the suitability of the nucleotide’s unsaturation of the concatenated data for phylogenetic analysis (ISS < ISS.c). Using two analytical methods, Bayesian inference (BI) and maximum likelihood (ML), we generated phylogenetic trees that exhibited unique topologies. These trees were subsequently integrated (Figure 8). The results demonstrated high stability, as indicated by the robust nodal support values derived from mitogenome data.
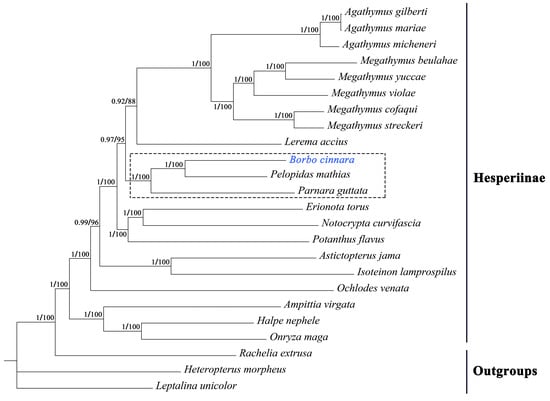
Figure 8.
Phylogenetic trees obtained from ML and BI analysis. Numbers on nodes are the posterior probability (PP) and bootstrap value (BV).
The analysis revealed a large disparity in the number of available mitogenome sequences among different genera, with most genera having only one sequence available. Two genera with more than two species were found to be monophyletic in our trees. Three genera (Borbo, Pelopidas and Parnara) with only one species belong to the same tribe Baorini [50]. Among the three species in Baorini, the following relationships were reconstructed with the support of high nodal values (PP = 1 and BV = 100):((B. cinnara + Pelopidas mathias) + Parnara guttata), which indicated that Borbo was more closely related to Pelopidas than Parnara. Our results supported those from the previous study based on several genes [11,14,51,52].
4. Conclusions
In this study, we successfully determined and analyzed the complete mitogenome of B. cinnara. The gene characteristics and arrangements were consistent with those reported in other butterfly mitogenomes. The nucleotide composition of the mitogenome was relatively conserved, displaying a preference for A and T nucleotides. All PCGs started with the canonical ATN start codon, except for COX1, which utilized CGA. Three genes (COX2, ND4 and ND5) were terminated with the incomplete codon T. The nucleotide diversity of Hesperiinae PCGs revealed that ND3 was the most variable gene, while COX1 was the most conserved. Furthermore, selection pressure analysis for each gene showed that ND3 was under relaxed purifying selection, whereas COX1 experienced the strongest purifying selection. These comparative analyses contribute to our understanding of butterfly mitochondrial genome evolution. Phylogenetic analyses based on PCGs and rRNAs from the mitogenomes of 24 species provided clarity on the phylogenetic relationships within Hesperiinae. The sister relationship between B. cinnara and P. mathias was corroborated at the mitogenome level. Our findings suggest that whole mitogenomes are effective molecular markers that can be used to study phylogenetic relationships within Hesperiinae. Due to extremely limited available data and uneven sequencing among different genera, larger samples across more taxa are necessary for future research.
Supplementary Materials
The following supporting information can be downloaded at: https://www.mdpi.com/article/10.3390/d16090560/s1, Table S1. Complete mitogenomes used in this study. Table S2. Codon number and RSCU in the mitogenome of B. cinnara.
Author Contributions
Conceptualization, C.X., R.L. and X.Y.; methodology, R.L.; software, C.X. and D.L.; validation, D.Z. and D.L.; formal analysis, C.X. and D.Z.; investigation, C.X. and L.J.; resources, L.J. and R.L.; data curation, C.X. and R.L.; writing—original draft preparation, C.X. and D.Z.; writing—review and editing, R.L. and X.Y.; visualization, C.X. and R.L.; supervision, X.Y.; project administration, R.L. and X.Y. All authors have read and agreed to the published version of the manuscript.
Funding
This research was funded by the National Natural Science Foundation of China, grant number 32200359, and Sichuan Medical Law Research Center, grant number YF23-Q08.
Institutional Review Board Statement
Not applicable.
Informed Consent Statement
Not applicable.
Data Availability Statement
The mitogenome of Borbo cinnara has been deposited in the GenBank database under the accession number OL361826.
Acknowledgments
The authors acknowledge any support given that is not covered by the author, contributions, or by funding.
Conflicts of Interest
The authors declare no conflicts of interest.
References
- Wolstenholme, D.R. Animal mitochondrial DNA: Structure and evolution. Int. Rev. Cytol. 1992, 141, 173–216. [Google Scholar]
- Boore, J.L. Animal mitochondrial genomes. Nucleic Acids Res. 1999, 27, 1767–1780. [Google Scholar] [CrossRef] [PubMed]
- Cameron, S.L. Insect mitochondrial genomics: Implications for evolution and phylogeny. Annu. Rev. Entomol. 2014, 59, 95–117. [Google Scholar] [CrossRef]
- Clary, D.O.; Wolstenholme, D.R. Drosophila mitochondrial DNA: Conserved sequences in the A+T-rich region and supporting evidence for a secondary structure model of the small ribosomal RNA. J. Mol. Evol. 1987, 25, 116–125. [Google Scholar] [CrossRef]
- Taanman, J.W. The mitochondrial genome: Structure, transcription, translation and replication. Biochim. Biophys. Acta—Bioenerg. 1999, 1410, 103–123. [Google Scholar] [CrossRef]
- Gissi, C.; Iannelli, F.; Pesole, G. Evolution of the mitochondrial genome of metazoa as exemplified by comparison of congeneric species. Heredity 2008, 101, 301–320. [Google Scholar] [CrossRef] [PubMed]
- Simon, C.; Buckley, T.R.; Frati, F.; Stewart, J.B.; Beckenbach, A.T. Incorporating molecular evolution into phylogenetic analysis, and a new compilation of conserved polymerase chain reaction primers for animal mitochondrial DNA. Annu. Rev. Ecol. Evol. Syst. 2006, 37, 545–579. [Google Scholar] [CrossRef]
- Timmermans, M.J.; Lees, D.C.; Simonsen, T.J. Towards a mitogenomic phylogeny of Lepidoptera. Mol. Phylogenet. Evol. 2014, 79, 169–178. [Google Scholar] [CrossRef]
- Morgan, B.; Wang, T.Y.; Chen, T.Z.; Moctezuma, V.; Burgos, O.; Le, M.H.; Huang, J.P. Long-read sequencing data reveals dynamic evolution of mitochondrial genome size and the phylogenetic utility of mitochondrial DNA in Hercules beetles (Dynastes; Scarabaeidae). Genome Biol. Evol. 2022, 14, evac147. [Google Scholar] [CrossRef]
- Fan, X.L.; Chiba, H.; Huang, Z.F.; Fei, W.; Sáfián, S. Clarification of the phylogenetic framework of the tribe Baorini (Lepidoptera: Hesperiidae: Hesperiinae) inferred from multiple gene sequences. PLoS ONE 2016, 11, e0156861. [Google Scholar] [CrossRef]
- Li, Y.P.; Gao, K.; Yuan, F.; Wang, P.; Yuan, X.Q. Molecular systematics of the butterfly tribe Baorini (Lepidoptera: Hesperiidae) from China. J. Kans. Entomol. Soc. 2017, 90, 100–108. [Google Scholar] [CrossRef]
- Larsen, T.B. Two new species of African Hesperiidae: Borbo (Hepseriinae, Baorini) and Platylesches (Hepseriinae, incertae sedis). Trop. Lepid. Res. 2013, 23, 92–98. [Google Scholar]
- Toussaint, E.F.; Vila, R.; Yago, M.; Chiba, H.; Warren, A.D.; Aduse-Poku, K.; Storer, C.; Dexter, K.M.; Maruyama, K.; Lohman, D.J.; et al. Out of the Orient: Post-Tethyan transoceanic and trans-Arabian routes fostered the spread of Baorini skippers in the Afrotropics. Syst. Entomol. 2019, 44, 926–938. [Google Scholar] [CrossRef]
- Jiang, W.B.; He, H.Y.; Li, Y.Y.; Wang, Y.; Ge, C.; Zhu, J.; Yu, W. Molecular phylogeny of the butterfly tribe Baorini Doherty, 1886 (Hesperiidae, Hesperiinae) in China. Zootaxa 2019, 4565, 108–116. [Google Scholar] [CrossRef] [PubMed]
- Gong, N.; Yang, L.; Chen, X.S. Comparative analysis of twelve mitogenome of Caliscelidae (Hemiptera: Fulgoromorpha) and their phylogenetic implications. PeerJ 2021, 9, e12465. [Google Scholar] [CrossRef] [PubMed]
- Kunte, K. Butterflies of Peninsular India; Universities Press (Hyderabad) and Indian Academy of Sciences (Bangalore): Bangalore, India, 2001; 254p. [Google Scholar]
- Yuan, F.; Yuan, X.; Xue, G. Fauna Sinica: Insecta—Lepidoptera, Hesperiidae; Science Press: Beijing, China, 2015. [Google Scholar]
- Simon, C.; Frati, F.; Beckenbach, A.; Crespi, B.; Liu, H.; Flook, P. Evolution, weighting, and phylogenetic utility of mitochondrial gene sequences and a compilation of conserved polymerase chain reaction primers. Ann. Entomol. Soc. Am. 1994, 87, 651–701. [Google Scholar] [CrossRef]
- Singh, V.K.; Mangalam, A.K.; Dwivedi, S.; Naik, S. Primer premier: Program for design of degenerate primers from a protein sequence. Biotechniques 1998, 24, 318–319. [Google Scholar] [CrossRef] [PubMed]
- Li, R.; Wang, Y.Q.; Shu, X.H.; Meng, L.; Li, B.P. Complete mitochondrial genomes of three Oxya grasshoppers (Orthoptera) and their implications for phylogenetic reconstruction. Genomics 2019, 112, 289–296. [Google Scholar] [CrossRef]
- Burland, T.G. DNASTAR’s Lasergene sequence analysis software. In Bioinformatics Methods and Protocols; Humana Press: Totowa, NJ, USA, 2000; pp. 71–91. [Google Scholar]
- Kearse, M.; Moir, R.; Wilson, A.; Stones-Havas, S.; Cheung, M.; Sturrock, S.; Buxton, S.; Cooper, A.; Markowitz, S.; Duran, C.; et al. Geneious basic: An integrated and extendable desktop software platform for the organization and analysis of sequence data. Bioinformatics 2012, 28, 1647–1649. [Google Scholar] [CrossRef]
- Bernt, M.; Donath, A.; Jühling, F.; Externbrink, F.; Florentz, C.; Fritzsch, G.; Pütz, J.; Middendorf, M.; Stadler, P.F. MITOS: Improved de novo metazoan mitochondrial genome annotation. Mol. Phylogenet. Evol. 2013, 69, 313–319. [Google Scholar] [CrossRef]
- Lowe, T.M.; Chan, P.P. tRNAscan-SE On-line: Integrating search and context for analysis of transfer RNA genes. Nucleic Acids Res. 2016, 44, W54–W57. [Google Scholar] [CrossRef] [PubMed]
- Laslett, D.; Canbck, B. ARWEN: A program to detect tRNA genes in metazoan mitochondrial nucleotide sequences. Bioinformatics 2008, 24, 172–175. [Google Scholar] [CrossRef] [PubMed]
- Meng, G.L.; Li, Y.Y.; Yang, C.T.; Liu, S.L. MitoZ: A toolkit for animal mitochondrial genome assembly, annotation and visualization. Nucleic Acids Res. 2018, 47, e63. [Google Scholar] [CrossRef] [PubMed]
- Kumar, S.; Stecher, G.; Li, M.; Knyaz, C.; Tamura, K. MEGA X: Molecular evolutionary genetics analysis across computing platforms. Mol. Biol. Evol. 2018, 35, 1547–1549. [Google Scholar] [CrossRef]
- Zhang, D.; Gao, F.L.; Jakovlić, I.; Zou, H.; Zhang, J.; Li, W.X.; Wang, G.T. PhyloSuite: An integrated and scalable desktop platform for streamlined molecular sequence data management and evolutionary phylogenetics studies. Mol. Ecol. Resour. 2020, 20, 348–355. [Google Scholar] [CrossRef]
- Perna, N.T.; Kocher, T.D. Patterns of nucleotide composition at fourfold degenerate sites of animal mitochondrial genomes. J. Mol. Evol. 1995, 41, 353–358. [Google Scholar] [CrossRef]
- Librado, P.; Rozas, J. DnaSP v5: A software for comprehensive analysis of DNA polymorphism data. Bioinformatics 2009, 25, 1451–1452. [Google Scholar] [CrossRef]
- Katoh, K.; Standley, D.M. MAFFT multiple sequence alignment software version 7: Improvements in performance and usability. Mol. Biol. Evol. 2013, 30, 772–780. [Google Scholar] [CrossRef]
- Xia, X.H. DAMBE5: A comprehensive software package for data analysis in molecular biology and evolution. Mol. Biol. Evol. 2013, 30, 1720–1728. [Google Scholar] [CrossRef]
- Castresana, J. Gblocks v. 0.91 b. Available online: https://www.biologiaevolutiva.org/jcastresana/Gblocks.html (accessed on 20 June 2023).
- Lanfear, R.; Calcott, B.; Ho, S.Y.W.; Guindon, S. PartitionFinder: Combined selection of partitioning schemes and substitution models for phylogenetic analyses. Mol. Biol. Evol. 2012, 29, 1695–1701. [Google Scholar] [CrossRef]
- Stamatakis, A. RAxML version 8: A tool for phylogenetic analysis and post-analysis of large phylogenies. Bioinformatics 2014, 30, 1312–1313. [Google Scholar] [CrossRef] [PubMed]
- Ronquist, F.; Huelsenbeck, J.P. MrBayes 3: Bayesian phylogenetic inference under mixed models. Bioinformatics 2003, 19, 1572–1574. [Google Scholar] [CrossRef]
- Rambaut, A. FigTree 1.4.2. Institute of Evolutionary Biology, University of Edinburgh. Available online: http://tree.bio.ed.ac.uk/software/figtree/ (accessed on 15 May 2023).
- Clary, D.O.; Wolstenholme, D.R. The ribosomal RNA genes of Drosophila mitochondrial DNA. Nucleic Acids Res. 1985, 13, 4029–4045. [Google Scholar] [CrossRef]
- Chen, Q.; Chen, L.; Liao, C.Q.; Wang, X.; Wang, M.; Huang, G.H. Comparative mitochondrial genome analysis and phylogenetic relationship among lepidopteran species. Gene 2022, 830, 146516. [Google Scholar] [CrossRef] [PubMed]
- Cai, Y.; Yin, A. The complete mitochondrial genome of Chibiraga houshuaii (Lepidoptera, Limacodidae) and its phylogenetic implications. Sci. Rep. 2024, 14, 7009. [Google Scholar] [CrossRef] [PubMed]
- Hao, X.Y.; Liu, J.Q.; Chiba, H.; Xiao, J.T.; Yuan, X.Q. Complete mitochondrial genomes of three skippers in the tribe Aeromachini (Lepidoptera: Hesperiidae: Hesperiinae) and their phylogenetic implications. Ecol. Evol. 2021, 11, 8381–8393. [Google Scholar] [CrossRef] [PubMed]
- Hao, X.Y.; Zhao, J.F.; Hao, R.W.; Zhao, Y.F.; Yuan, X.Q. Complete mitochondrial genome of the small-branded swift: Pelopidas mathias (Lepidoptera, Hesperiidae). Mitochondrial DNA Part B 2021, 6, 1599–1600. [Google Scholar] [CrossRef]
- Ojala, D.; Montoya, J.; Attardi, G. tRNA punctuation model of RNA processing in human mitochondria. Nature 1981, 290, 470–474. [Google Scholar] [CrossRef]
- Varani, G.; Mcclain, W.H. The G·U wobble base pair. A fundamental building block of RNA structure crucial to RNA function in diverse biological systems. EMBO Rep. 2000, 1, 18–23. [Google Scholar] [CrossRef]
- Liu, L.N.; Zeng, L.; Guo, Z.X.; Yang, B.M.; Yin, K.S.; Wang, C.M.; Zheng, S.J. Complete mitochondrial genome of banana skipper Erionota torus Evans (Lepidoptera: Hesperiidae) and phylogenetic analysis. Mitochondrial DNA Part B 2021, 6, 2054–2055. [Google Scholar] [CrossRef]
- Fernández-Silva, P.; Enriquez, J.A.; Montoya, J. Replication and transcription of mammalian mitochondrial DNA. Exp. Physiol. 2003, 88, 41–56. [Google Scholar] [CrossRef] [PubMed]
- Xia, X. Maximizing transcription efficiency causes codon usage bias. Genetics 1996, 144, 1309–1320. [Google Scholar] [CrossRef] [PubMed]
- Li, R.; Ma, Z.; Zhou, C. The first two complete mitochondrial genomes of Neoephemeridae (Ephemeroptera): Comparative analysis and phylogenetic implication for Furcatergalia. Genes 2021, 12, 1875. [Google Scholar] [CrossRef]
- Zhang, L.; Li, W.H. Mammalian housekeeping genes evolve more slowly than tissue-specific genes. Mol. Biol. Evol. 2004, 21, 236–239. [Google Scholar] [CrossRef]
- Warren, A.D.; Ogawa, J.R.; Brower, A.V.Z. Phylogenetic relationships of subfamilies and circumscription of tribes in the family Hesperiidae (Lepidoptera: Hesperioidea). Cladistics 2008, 24, 642–676. [Google Scholar] [CrossRef]
- Sahoo, R.K.; Warren, A.D.; Wahlberg, N.; Brower, A.V.; Lukhtanov, V.A.; Kodandaramaiah, U. Ten genes and two topologies: An exploration of higher relationships in skipper butterflies (Hesperiidae). PeerJ 2016, 4, e2653. [Google Scholar] [CrossRef]
- Toussaint, E.F.; Breinholt, J.W.; Earl, C.; Warren, A.D.; Brower, A.V.; Yago, M.; Dexter, K.M.; Espeland, M.; Pierce, N.E.; Lohman, D.J.; et al. Anchored phylogenomics illuminates the skipper butterfly tree of life. BMC Evol. Biol. 2018, 18, 101. [Google Scholar] [CrossRef]
Disclaimer/Publisher’s Note: The statements, opinions and data contained in all publications are solely those of the individual author(s) and contributor(s) and not of MDPI and/or the editor(s). MDPI and/or the editor(s) disclaim responsibility for any injury to people or property resulting from any ideas, methods, instructions or products referred to in the content. |
© 2024 by the authors. Licensee MDPI, Basel, Switzerland. This article is an open access article distributed under the terms and conditions of the Creative Commons Attribution (CC BY) license (https://creativecommons.org/licenses/by/4.0/).