Article

Translation Elongation Factor 1-Alpha Sequencing Provides Reliable Tool for Identification of Fusarium graminearum Species Complex Members

1
Department of Molecular Biology and Genetics, Faculty of Sciences and Literature, Istanbul Yeni Yuzyil University, Cevizlibag, Istanbul 34010, Turkey
2
Department of Life Technologies, Molecular Plant Biology, University of Turku, FI-20520 Turku, Finland
*
Author to whom correspondence should be addressed.
Diversity 2024, 16(8), 481; https://doi.org/10.3390/d16080481
Submission received: 15 July 2024 / Revised: 4 August 2024 / Accepted: 5 August 2024 / Published: 8 August 2024

Abstract

:
The Fusarium graminearum species complex (FGSC) is a worldwide phytopathogenic fungus of small grain cereals. Genetics and bioinformatics tools have been providing an efficient strategy for identifying FGSC. However, the potential reliability of tef1−α sequencing in FGSC members has not been well investigated. In this study, the tef1−α sequencing data of 246 FGSC members, one F. culmorum, and one F. solani isolate were subjected to distance-, character-, and PCA-based phylogenetic analysis. Linux terminals and the R programming language were used in phylogenetic analysis. The Unweighted Pair Group Method with Arithmetic Mean (UPGMA) and maximum likelihood methods produced relatively more homogenous F. graminearum sensu stricto (Fgss) and F. asiaticum isolates. Fgss and F. asiaticum isolates co-clustered in two separate sub-divisions in the ML and UPGMA methods, with significant differences in the Chi2 test (p < 0.05). PCA profiling revealed a low level of variation in FGSC members, with 99–99.5% percentages in axis 1. An increased number of taxa and isolates would be tested for tef1−α in future studies. To our knowledge, this is also the first study to combine phylogenetic methods with PCA tests for comprehensive characterization of FGSC members.

1. Introduction

Fusarium graminearum, a phytopathogenic fungus, is a major concern in agriculture due to its ability to cause destructive diseases in small grain cereals, especially wheat, barley, and maize [1,2,3]. This phytopathogenic fungus has been reported as a major causal agent of Fusarium head blight (FHB) and crown rot (CR) diseases in many geographic regions worldwide. Moreover, F. graminearum could produce B-type trichothecenes, zearalenone, and some other mycotoxins, which are not only hazardous for plants but also for humans and animals [4,5]. This species has been reported as one of the top 10 phytopathogenic fungi worldwide [6].
Over the last two decades, this species has been announced and accepted as a species complex, the F. graminearum species complex (FGSC), which includes more than ten members. Fgss (Fgss) and F. asiaticum seem to be the predominant members of the FGSC. Members present differences in chemotypes, geographic distribution, and morphological characteristics [3,7]. Accurate identification of the members within FGSC is crucial for developing effective disease management strategies.
Sequence-characterized amplified marker (SCAR)-based identification of F. graminearum was historically very important in terms of distinguishing the FGSC from other FHB and CR agents [8,9,10]. Especially UBC85 and FG16 SCARs have been widely used in species-specific characterization and identification of F. graminearum isolates worldwide [8,9]. However, the lineage characterization of the FGSC in the early 2000s led scientists to use detailed characterization protocols. Fortunately, the development of more effective DNA sequencing platforms and whole genome sequencing technologies has made it easier for researchers. These platforms and strategies, including gene-specific or genome-wide sequencing data, yielded fast and reliable results within a short time period. In this way, single- or multip-copy gene sequencing, merging conserved DNA sequences as a multilocus, and the alignment of these sequences provided another aspect of FGSC characterization [11,12,13,14,15]. Translation elongation factor 1-α (tef1−α: FG08811), α-tubulin (α-tub: FG00639), histone H3 (HIS: FG04290), mating type locus (MAT: FG08890-93), β-tubulin (β-tub: FG09530), reductase (RED: FG03224), phosphate permease (PHO: FG07894), trichothecene 3-O-acetyltransferase (TRI101: FG07896), and ammonium ligase (URA: FG07897) genes have been widely used for obtaining detailed FGSC member identification by multilocus sequencing and/or genealogical concordance analysis by using probe-based identification assays. Additionally, ITS/28S rDNA, as multi-copy regulatory RNA coding regions, has been used in multilocus assays for FGSC member identification [14,15]. It could be concluded that so far the geographic region, chemotype, aggressiveness, and morphologically distinct characteristics of FGSC members have been well characterized by using sequencing and/or probe-based real time identification techniques.
One approach that has gained great importance in recent years is the use of tef1−α as a genetic marker for the identification of members within the FGSC. tef1−α is a highly conserved protein that plays a crucial role in protein synthesis, making it a potentially reliable target for species differentiation [7,11,12,13]. DNA sequencing and/or probe-based hybridization methods could accurately distinguish members within the complex. It could be clearly seen that plenty of scientific reports, including those involving FGSC members (mainly Fgss), revealed FGSC member identification by only tef1−α DNA sequencing [16,17]. Due to the non-monophylogenetic structure of FGSC, single gene sequencing-based molecular identification methods could reveal inaccurate results, such as in SCAR-based identification methods [18,19,20]. Thus, the efficiency and/or reliability of tef1−α for accurate FGSC member identification should be tested. In this study, the aim was to reveal the potential reliability of tef1−α sequencing in FGSC member identification by distance-based and character-based phylogenetic analysis. Presenting the potential reliability of tef1−α sequencing as a single locus in comparison to multilocus sequencing investigations could accelerate the rate of genetic characterization studies of FGSC worldwide.

2. Materials and Methods

2.1. FGSC Isolate Sequences, Format Converting, and Preparing Samples for Alignment

F. graminearum, as a species complex, includes 15 members with accession numbers deposited under GenBank for specific gene sequences. Fourteen members with accession numbers provided for tef1−α gene sequences were used in the phylogenetic analysis. In total, 246 tef1−α gene sequences for FGSC members were obtained as “.fasta” files from GenBank. 100 and 92 of these sequences belonged to Fgss and F. asiaticum, respectively (Table 1). tef1−α gene sequences with accession number OQ876777 of F. culmorum (causing head blight and crown rot but not belonging to FGSC) were used for internal control of phylogenetic analysis. Similarly, tef1−α gene sequences with accession number MG183712 of F. solani (not causal agents of head blight or crown rot) were used as an external control in phylogenetic analysis.
Labels from “A_” to “P_” (such as OP245201, which is edited as A_OP245201 for the F. acacia-mearnsii tef1−α accession) were placed just before the accession numbers of sequences to easily follow of samples in phylogenetic trees (Table 1). “Extract” and “export table” functions of Phylosuite software (v1.2.3) were used to construct a table including accession numbers. The “cat” function from the Linux terminal was used to obtain three separate aligned fasta files. These three aligned files formed three sample sets:
(i)
The first of these three aligned “.fasta” files, named Set I, included F. asiaticum alignment with 107 isolates (not containing Fgss).
(ii)
The second one, named Set II, included Fgss alignment with 115 isolates (not containing F. asiaticum).
(iii)
The third one, named Set III, included all 248 isolates.
After basic alignment using MAFFT software (version 7), “.aln” files were obtained, and these aligned files were converted to “.phy” and “.nexus” formats using the online tool lirmm.fr (please see https://www.lirmm.fr, accessed on 25 May 2024).

2.2. Distance-Based Phylogenetic Methods

In total, three sample sets, Sets I, II, and III, were subjected to distance-based phylogenetic analysis. For the Unweighted Pair Group Method with Arithmetic Mean (UPGMA) and Neighbor Joining (NJ)-based phylogenetic analysis, FFT-NS-2, 200PAM/K = 2, Jukes–Cantor substitution modeling, and threshold score = 39 parameters were selected. Bootstrap support with 1000 hierarchical repeats was also used in NJ-based phylogenetic assays. Distance-based alignment produced a phylogenetic tree with Newick format, MSA profiling with conserved regions, plots, and “.aln” files. Phylogenetic trees were transferred to ITOL for visualization of dendrograms [21]. ITOL visualization parameters were as follows: circular tree mode with 210° rotation/350° arc, branch length usage, labels with accession numbers, no rotation, and separately colored sub-divisions.

2.3. Character-Based Phylogenetic Methods

Sample Sets I, II, and III were used in obtaining detailed phylogenetic analysis via character-based methods. For this purpose, maximum likelihood (ML) and Bayesian topology assays were carried out using iqtree (1.6.12) and MrBayes software (3.2.7a) on a Linux terminal (WSL2-based Ubuntu version 20.04). Aligned files with the “.phy” format were used in iqtree-based ML analysis [22]. The first command in the Linux terminal was “iqtree -s filename.phy” in order to obtain the best-fit model. Best-fit models were used in three different sample sets. The following command for bootstrapping and model selection was used in the Linux terminal: iqtree -s filename.phy -m modelname -bb 1000 -redo. “.tree” and “.phy” files, including base frequencies, site proportions, and rates, were obtained. The “.tree” file was transferred and processed using ITOL software (v6) as described above. For Bayesian topology analysis, MrBayes software was used using “nex/nexus” files [23]. For entering a bayesing window in the Linux terminal, the “mb” command was entered. Common sample size and rate-related commands were then followed as “execute filename.nex”, “lset nst = 6 rates = invgamma”, “mcmc ngen = 20,000 samplefreq = 100”, “no selection”, “sump”, and “sumt”. After finishing the Bayesian assay, tree files were processed and visualized using ITOL software.

2.4. Principal Component Analysis (PCA) by RStudio

PCA is a powerful strategy for visualizing and simplifying multiple experiments and/or data sets with a relatively high number of samples as a single holistic profile or figure. The potential relationship between tef1−α sequence differences and axis numbers and rates among FGSC members was figured out by PCA using “ape”, “phangorn”, “factoextra”, and “readxl” packages in RStudio. “.phy” file was used in PCA processes. The distance matrix was obtained by describing a new variable, including the “dist.ml” function. After writing the distance matrix with the “readxl” package, new variables were characterized. “prcomp”, “str”, “fviz_eig”, “rep” (with grouping with a specific number of members), and “fviz_pca_ind” functions were used to obtain PCA graphics. Axis numbers and percentages were recorded for each sample set.

3. Results and Discussion

3.1. Distance-Based Phylogenetic Analysis

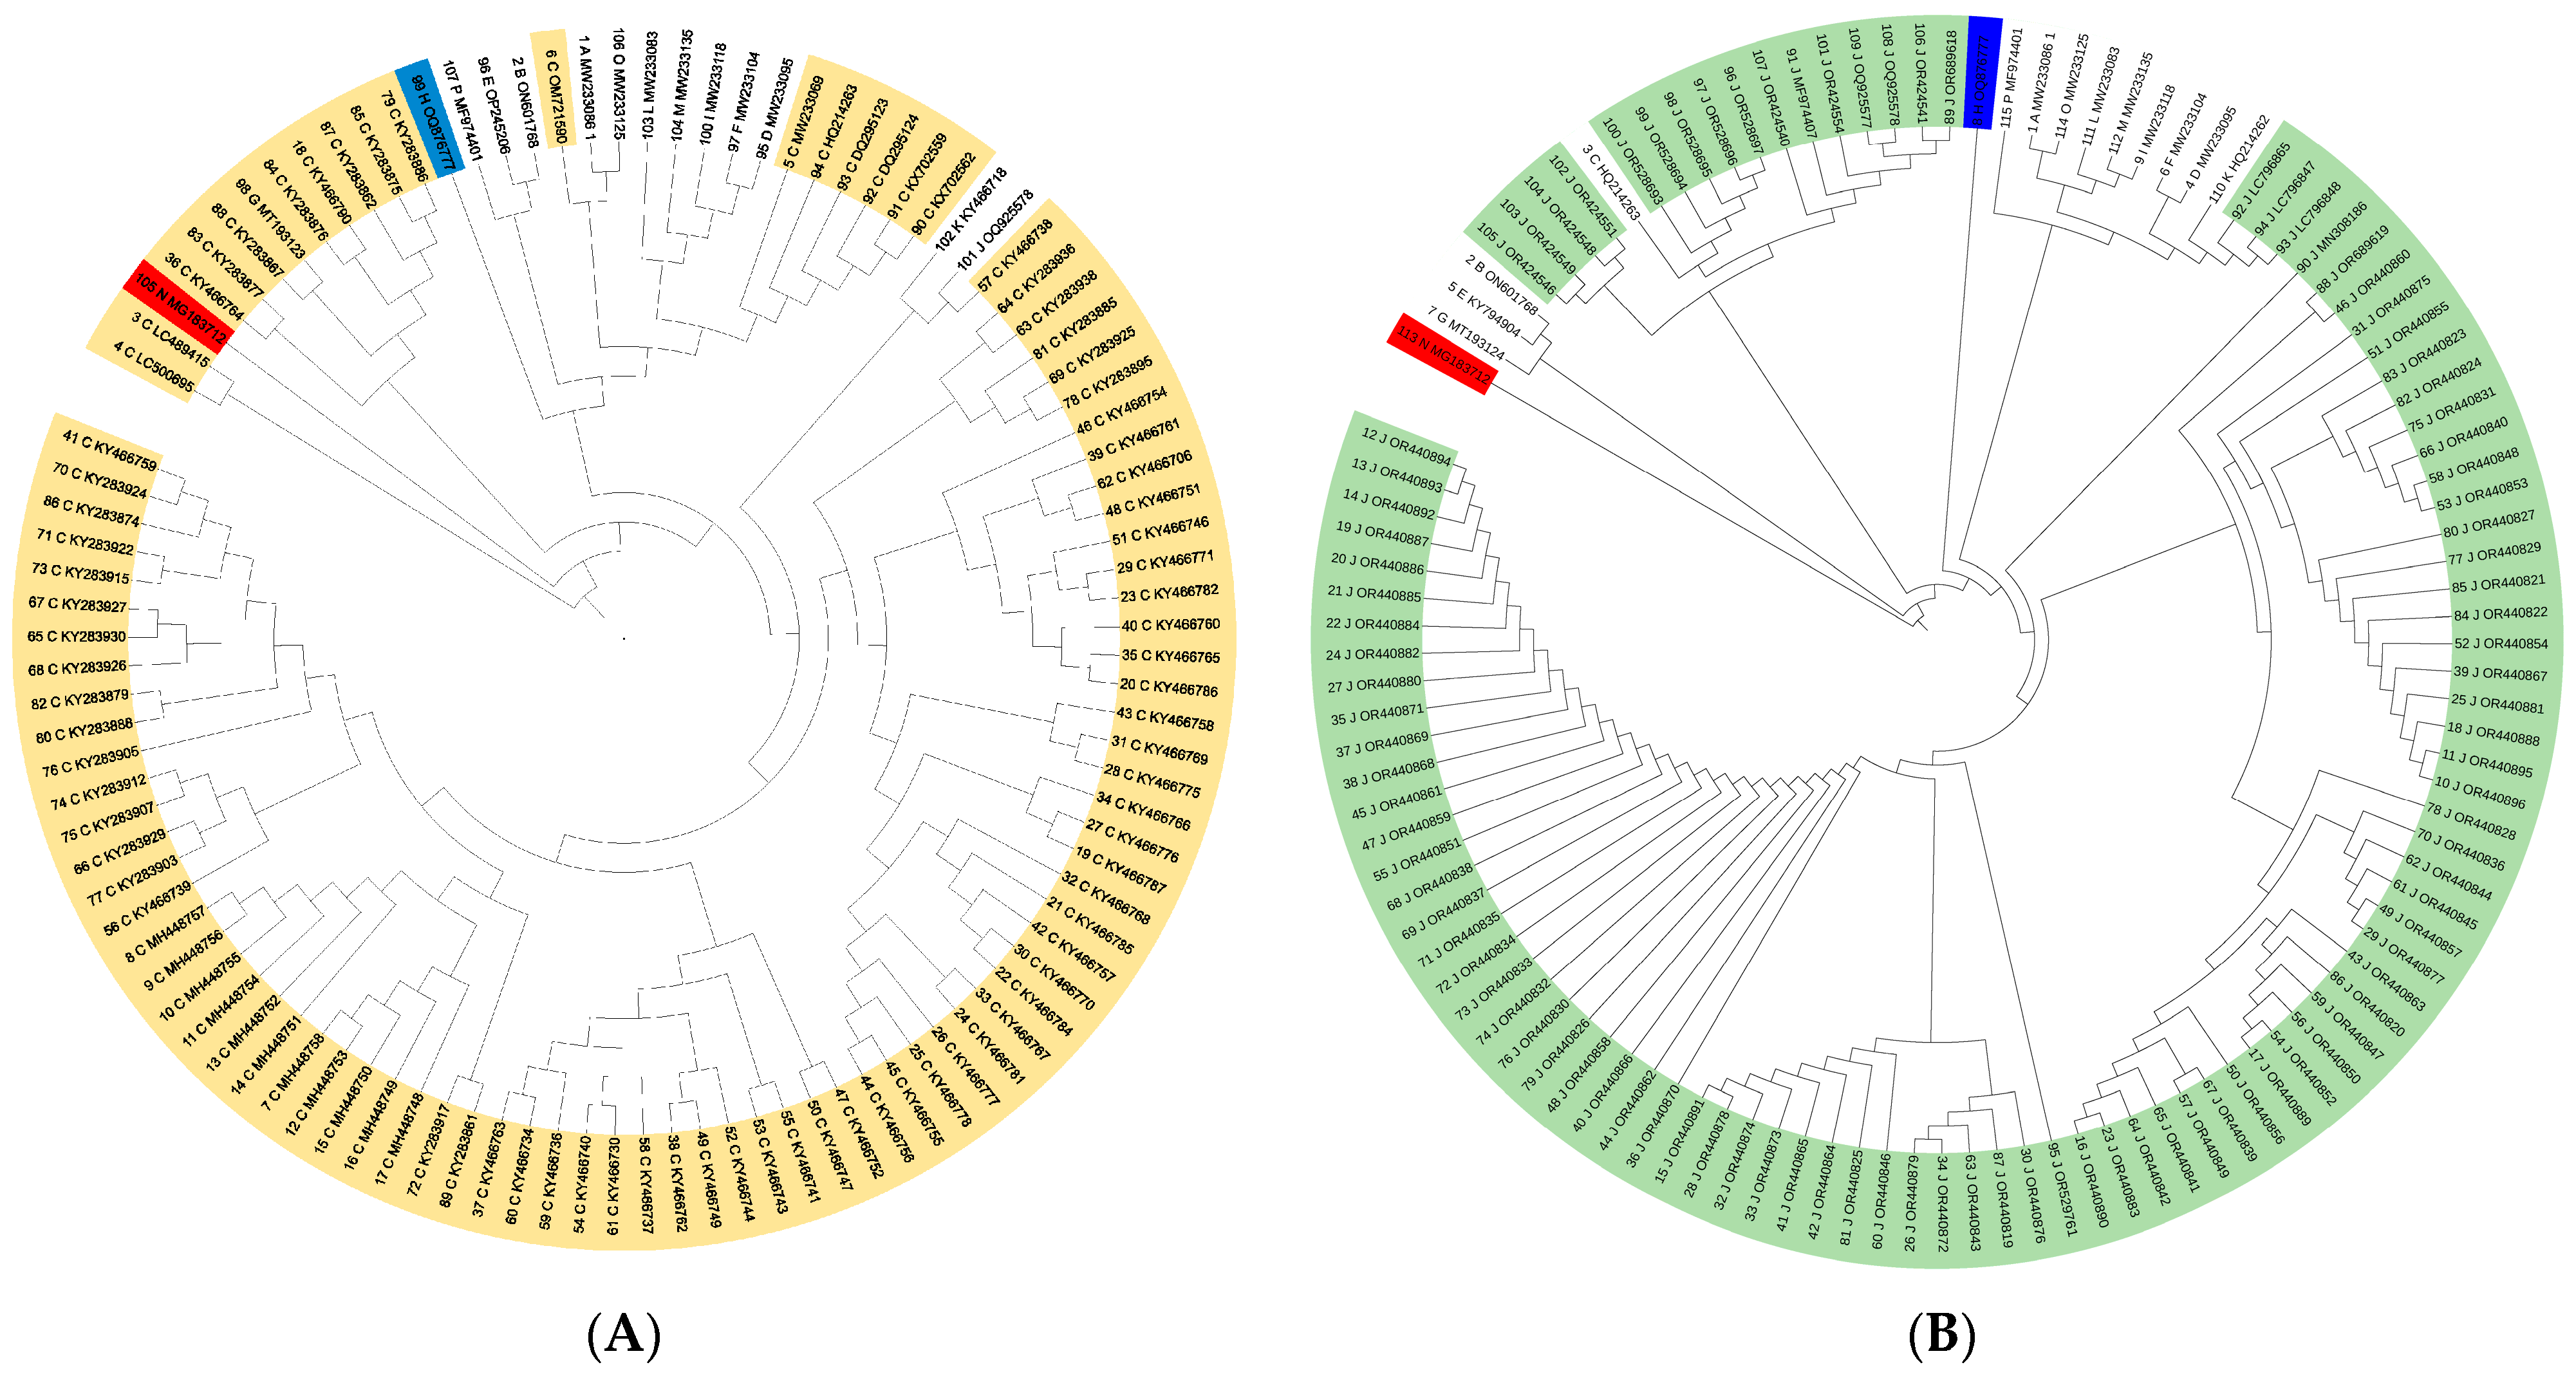
The aligned tef1−α sequences for three sets were obtained as different file types, including “.aln, .phy, and .nexus”. The NJ dendrogram for Set I included five major clusters (Figure 1A). The majority of the samples appeared in four clusters that belonged to F. asiaticum. Only one cluster included only F. asiaticum samples. F. culmorum was located between two clusters, while F. solani clearly took quite a distant location compared to the majority of F. asiaticum samples. There was no perfectly homogenous distribution for the remaining FGSC members in the Set I NJ dendrogram. However, the Set II dendrogram obtained via NJ clustering produced a homogenous distribution for FGSC members, excluding Fgss (Figure 1B). Two clusters were present in the Set II NJ dendrogram and 83 of the 100 Fgss samples were included in cluster I. Cluster II included the remaining Fgss samples, F. solani, F. culmorum, and other FGSC members. The NJ dendrogram for Set III clearly distinguished two major FGSC members (Fgss and F. asiaticum), F. boothii, and F. meridionale (Figure S1). The Set III NJ dendrogram contained four major clusters, and two of them included F. asiaticum samples, while cluster I included Fgss samples. The remaining cluster is composed of the remaining FGSC members, primarily F. boothii and F. meridionale samples.
It seems that NJ-based phylogenetics that included all samples (Set III) provided the closest distribution to the predicted systematic knowledge. Fgss samples showed a homogenous distribution in comparison to F. asiaticum samples. Hafez et al. (2020) [24] reposted similar co-clustering of Fgss isolates among nine FGSC members, eight FHB and/or CR agents, and F. oxysporum (as an outer group). In addition to developing a PCR-RFLP-based identification tool for FGSC members, they revealed that Fgss had a clearly distinct distribution from the remaining Fusarium spp. isolates. Similar results were also obtained for NJ-based topology analysis in Fgss isolates previously [17,25]. Overall, it seems that NJ-based phylogenetic analysis would be useful for comprehensive phylogenetic analysis with a high number of samples among FGSC members, especially for Fgss.
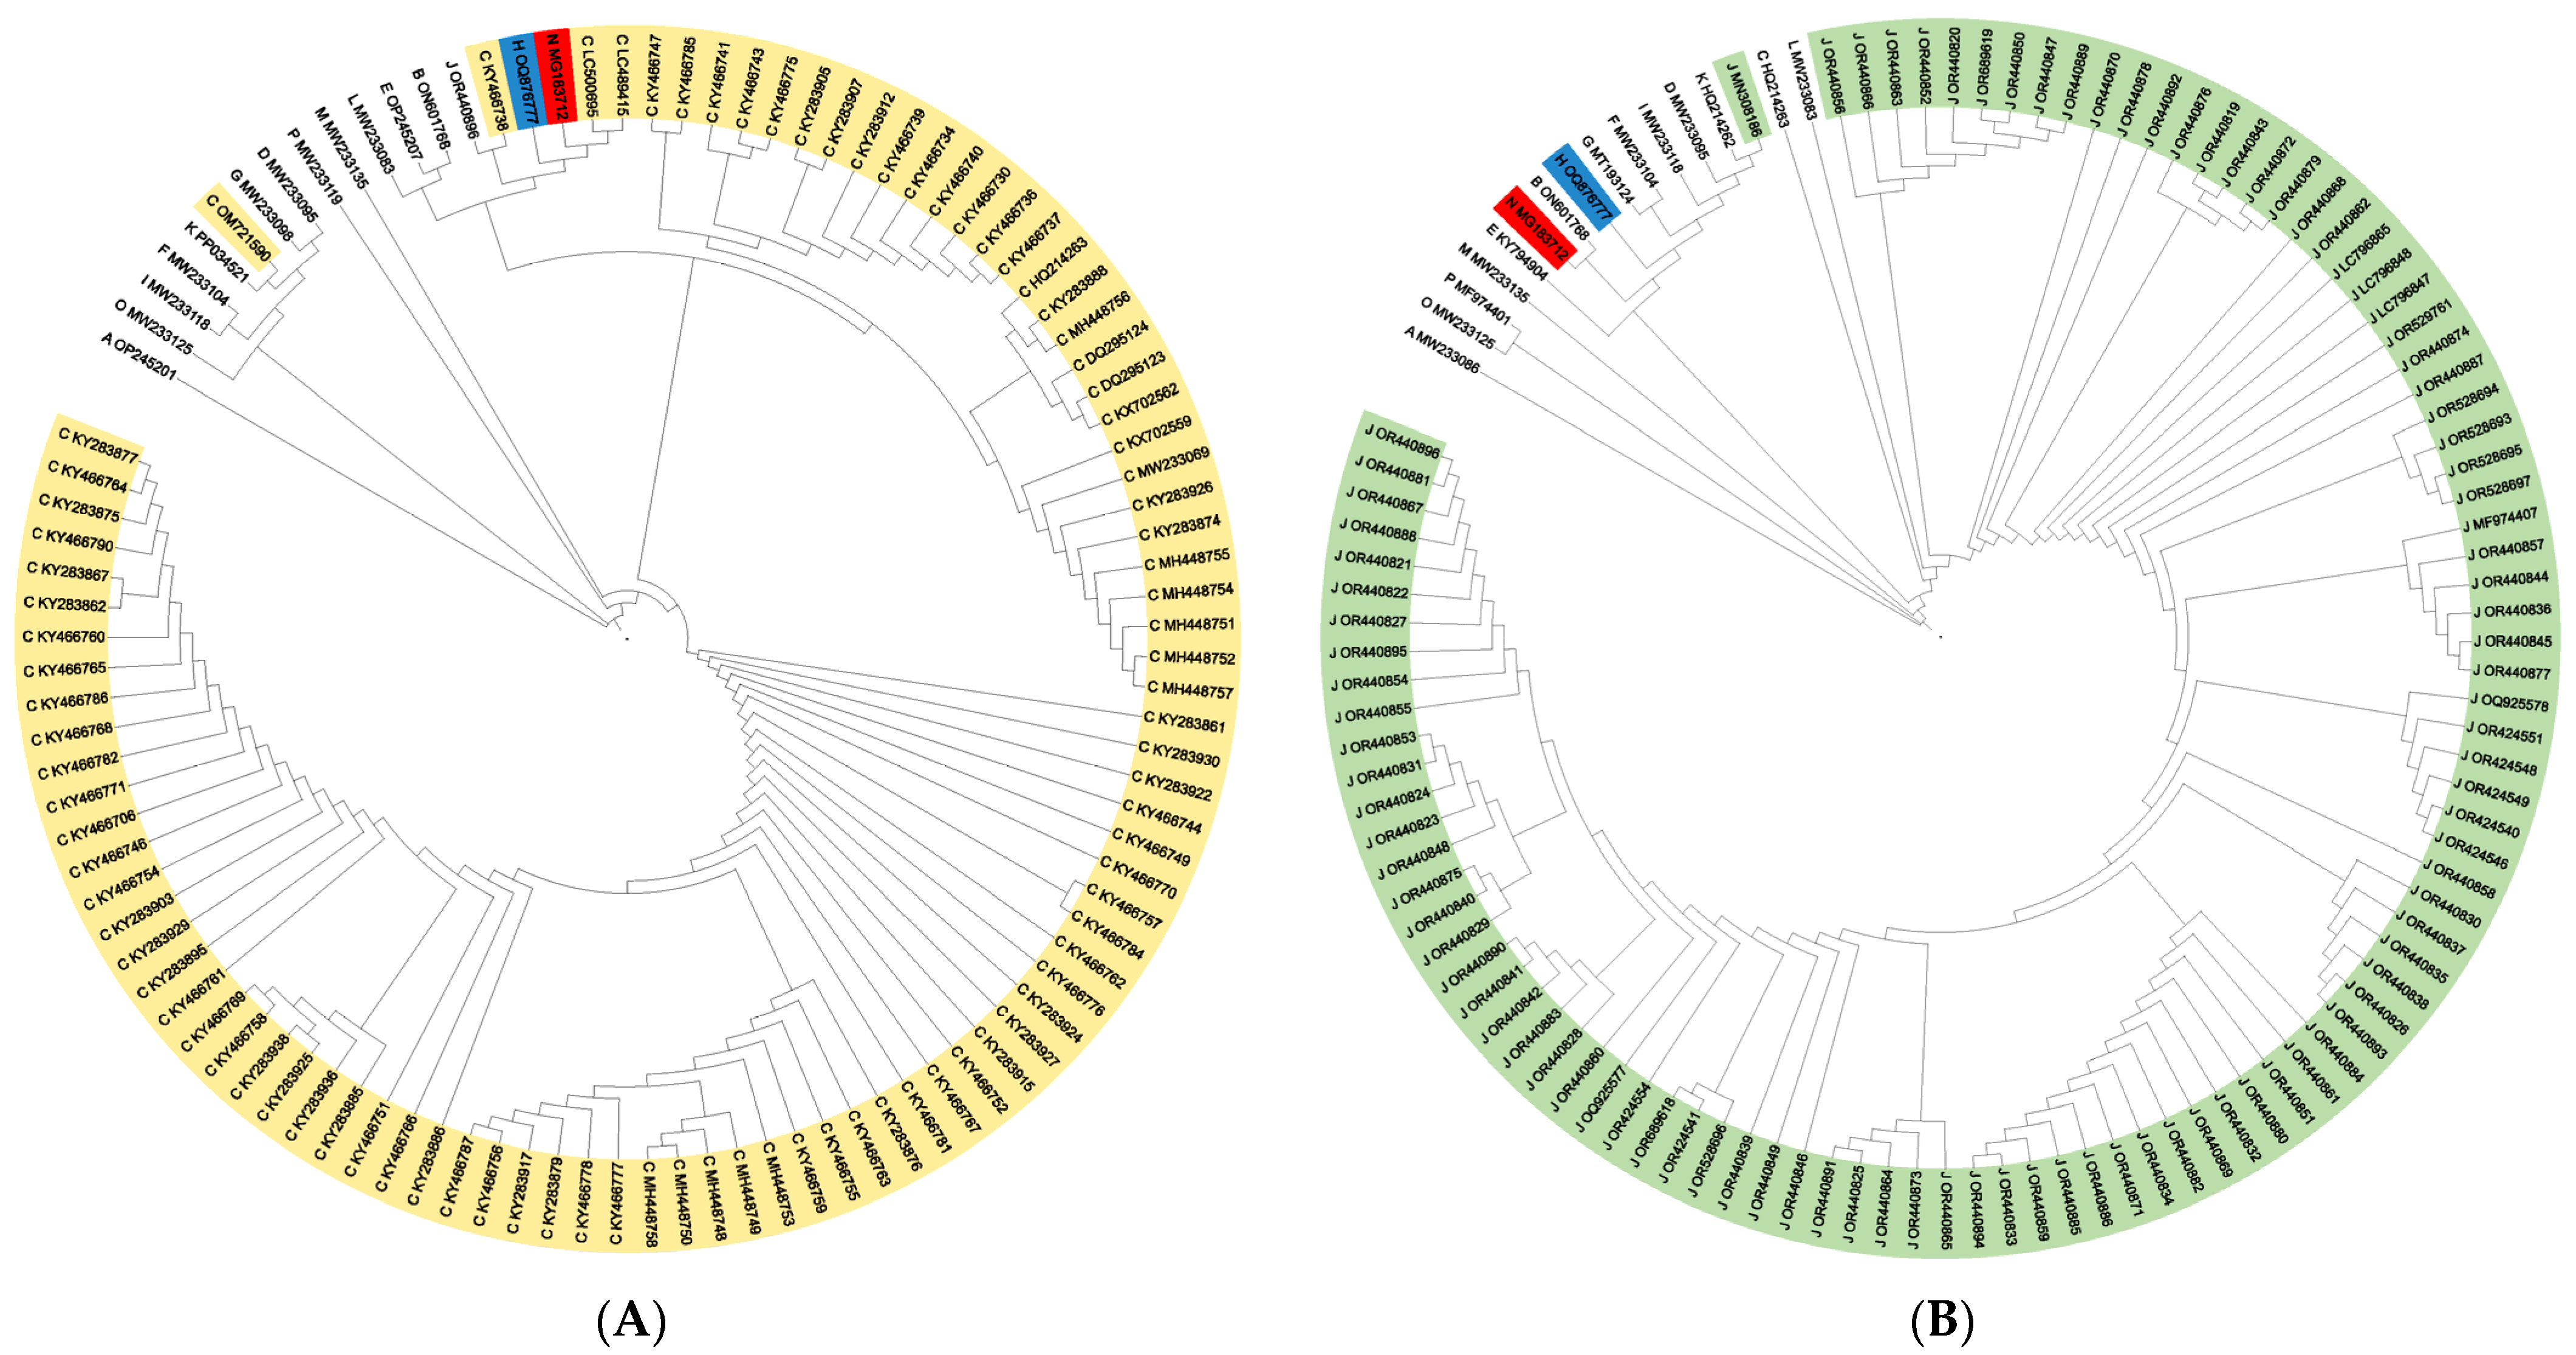
The UPGMA dendrogram for Set I produced a nearly homogenous distribution for F. asiaticum samples within only one cluster. Two clusters were obtained, and division-II contained 80% of F. asiaticum samples, while division-I contained 20% of F. asiaticum samples, and the remaining FGSC members had F. solani (Figure 2A). Similar results were obtained for the UPGMA dendrogram for Set II (Figure 2B). 84% of Fgss samples were co-clustered in division I, and the remaining samples were included in the same division. F. solani seems to be the most genetically distinct sample for UPGMA analysis. Four major divisions were present in the UPGMA analysis for Set III. The majority of the Fgss and F. asiaticum samples were clearly located in separate divisions, which are closely related to each other (Figure S2). While all F. meridionale samples co-clustered in a single division, the remaining members of F. solani were distinct from the remaining isolates.
UPGMA analysis yielded an almost homogenous distribution in FGSC members for three. Additionally, it was shown that F. solani was clearly genetically distinct from the majority of FGSC members, which was expected based on previous investigations [26,27]. There was idiomorphic UPGMA profiling for Argentinian Fgss isolates and other FGSC members by tef1−α sequence alignment [28] (Alvarez et al., 2011). It was reported that Fgss and F. cortaderiae precisely co-clustered in the same sub-division via the UPGMA method, and F. culmorum was genetically more closely related to F. culmorum in comparison to the non-FHB and CR pathogen F. oxysporum [29]. Our results showed a similar pattern of homogenous (but not idiomorphic) distribution among FGSC members, especially for Fgss and F. asiaticum isolates via UPGMA profiling. Moreover, the UPGMA method provided clear distinguishing between F. boothii and F. meridionale isolates.

3.2. Character-Based Phylogenetic Analysis

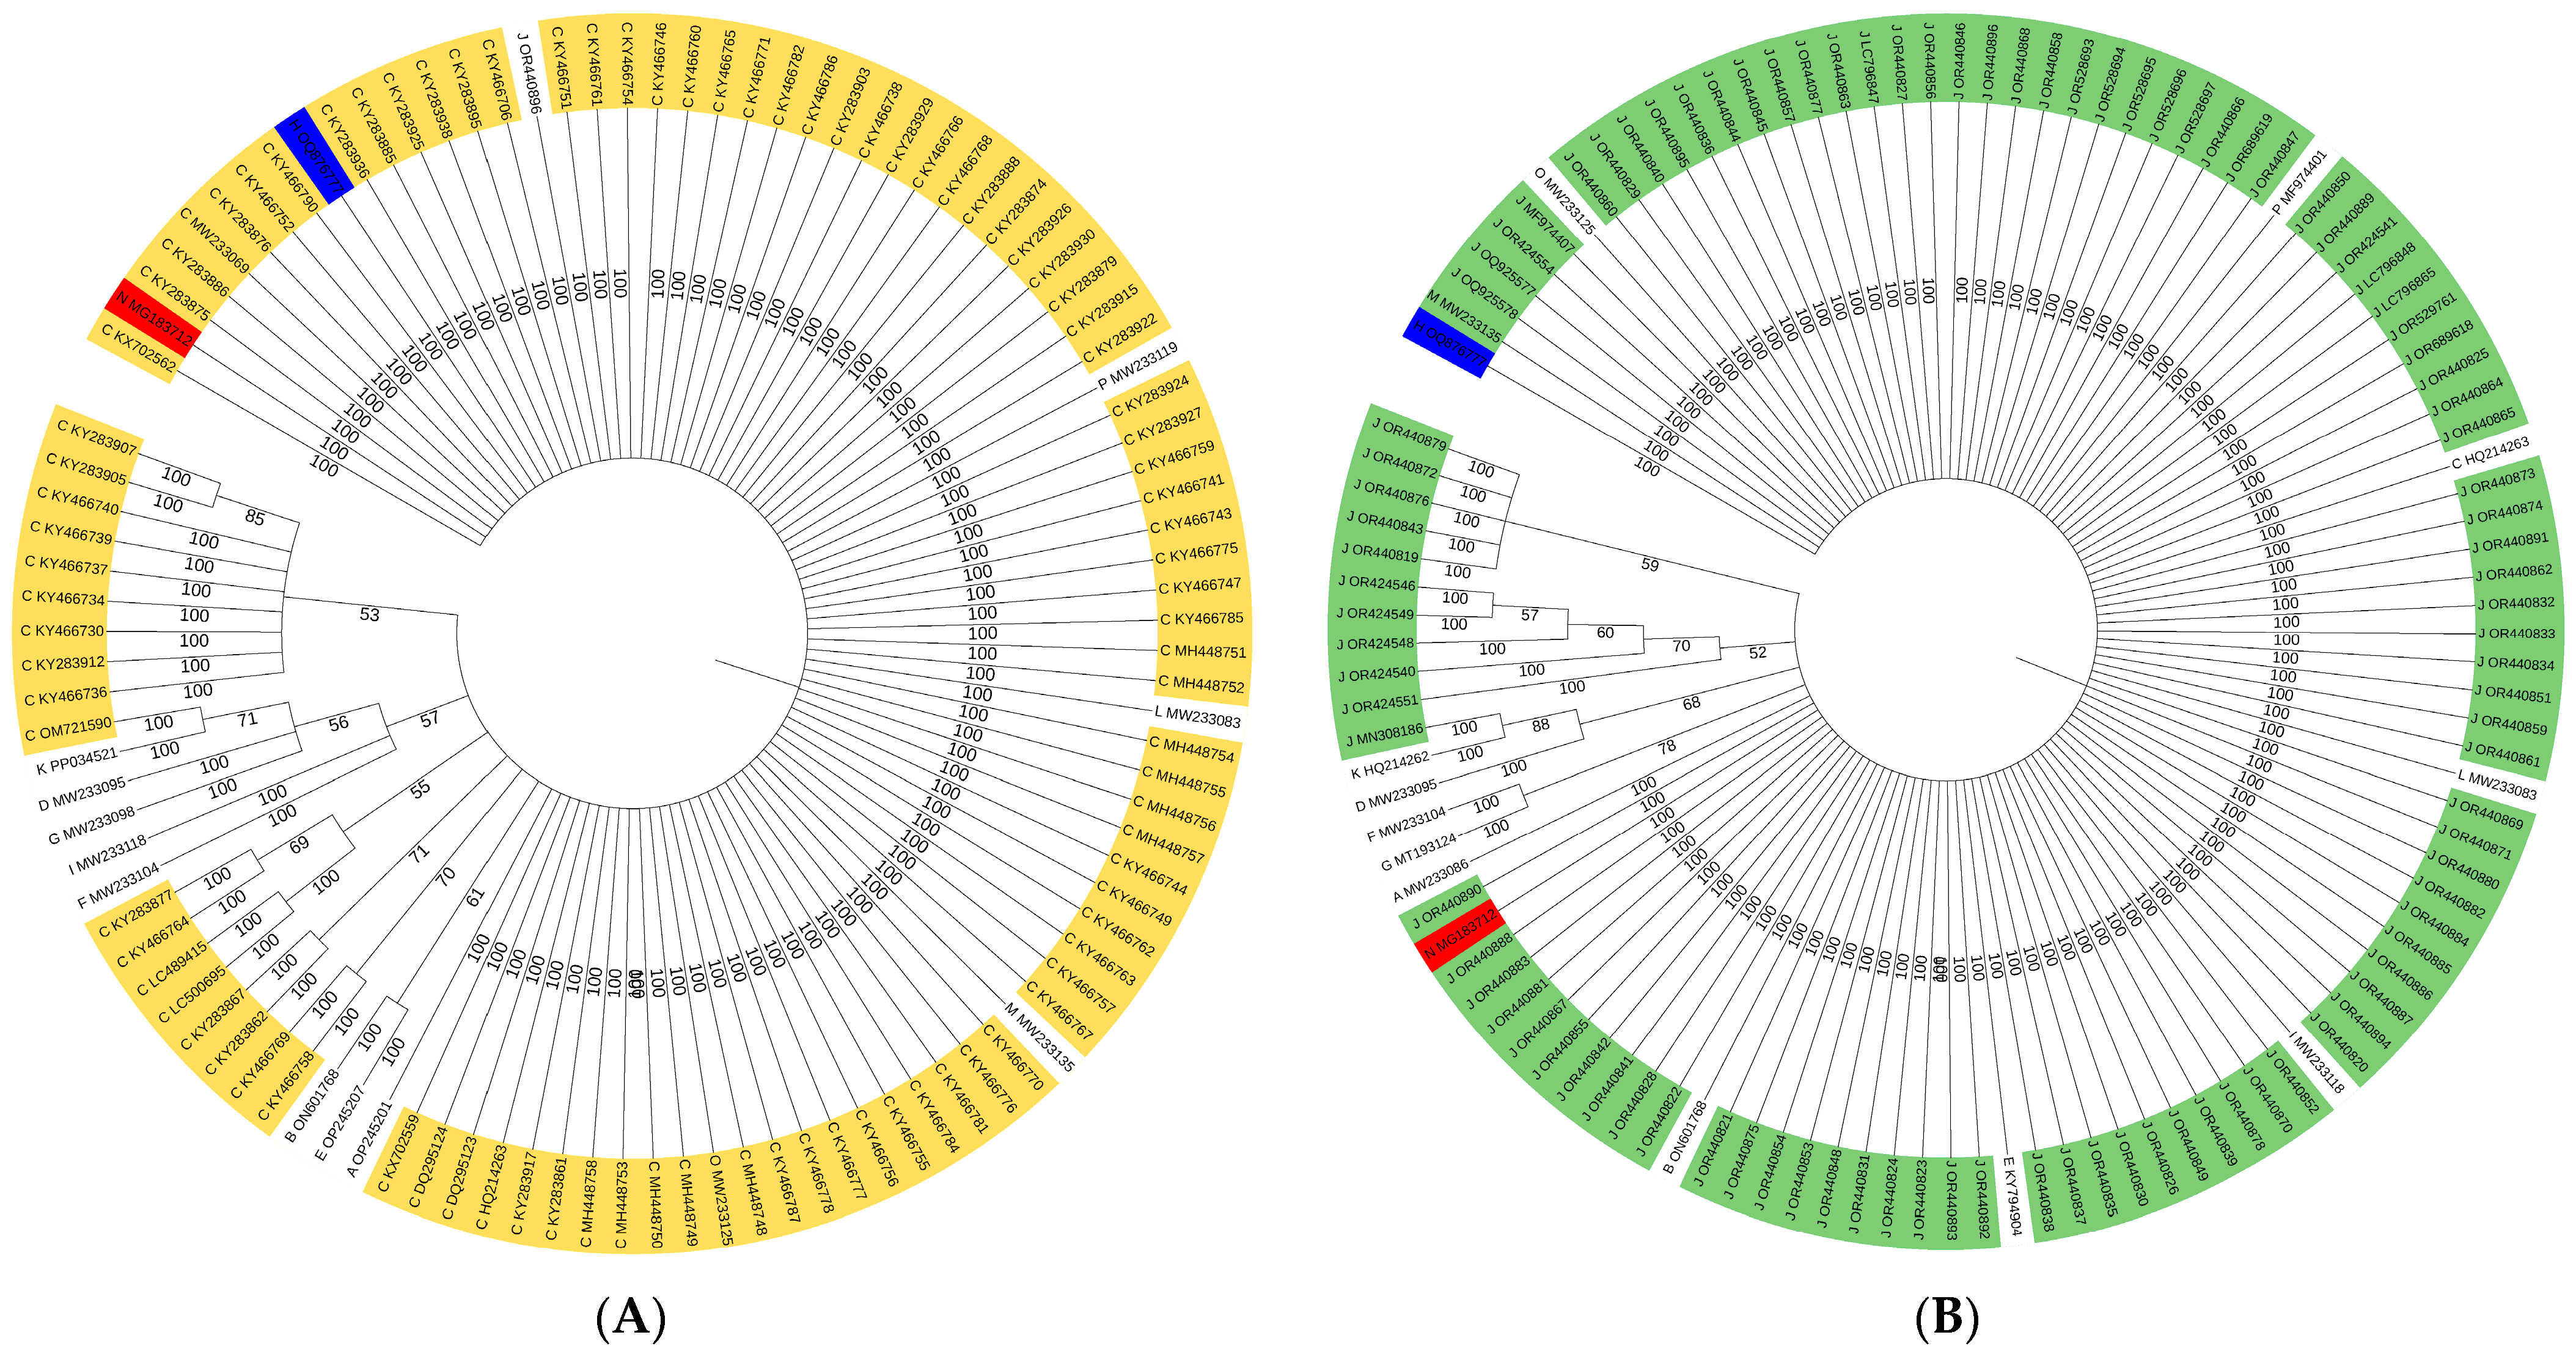
Iqtree software-based ML assays yielded best-fit models as TN + F + R2, TIM2e + G4, and TNe + R2 for Set I, Set II, and Set III, respectively. For each set, the p values and df values were recorded as follows: p < 0.05 and df = 3 by the chi2 test (Table 2). The maximum parsimony informative site was detected in Set I with a relatively minimum gap percentage. In the ML-dendrogram of Set I, only two samples were distinctly clustered from F. asiaticum samples. F. solani, F. culmorum, and FGSC members but not F. asiaticum samples were co-clustered (Figure 3A). A similar clustering profile was obtained by ML analysis in Set II. The largest division included all Fgss samples, excluding one (Figure 3B). The smaller division included the remaining FGSC members with F. culmorum and F. solani samples. The ML dendrogram clearly distinguished Fgss and F. asiaticum samples from F. boothii, F. meridionale, and the remaining FGSC members. In addition, F. solani and F. culmorum samples were co-clustered, being located quite far from the Fgss and F. asiaticum samples (Figure S3).
ML-based phylogenetic analysis provided effective distinction among FGSC members in terms of intraspecific variation. Especially, the location of the F. solani sample was clearly informative and distinguishable from the FHB and CR causal agents’ tef1−α sequences. Similar ML profiling for FGSC members was present in previous studies [30,31]. Fgss, F. meridionale, F. asiaticum, and F. boothii isolates from Iraq, Poland, and Austria were clearly distinguished from Fusarium spp. isolates not related to FHB and CR. Overall, it could be concluded that ML-based phylogenetic analysis could provide reliable characterization and clustering of Fgss and F. asiaticum isolates from FGSC members.
Bayesian phylogenetics were obtained by using MrBayes software. Bayesian topology yielded not more than two divisions for all three sets (Figure 4A,B). However, Bayesian dendrograms for Set I and Set II clearly showed distinct clustering of F. solani and F. culmorum samples from F. asiaticum and Fgss samples, respectively (Figure 4A,B). Set III dendrogram provided heterogeneous distribution of F. asiaticum and Fgss samples among the largest division. Even if F. meridionale and F. boothii samples were located between the majority of Fgss and F. asiaticum samples, as in distance-based Set III dendrograms, 6 F. asiaticum and 4 Fgss samples clustered apart from the majority of Set I and Set II samples (Figure S4). In comparison to the remaining three phylogenetic analysis methods, Bayesian topology would be more useful in member-specific alignment analysis due to the heterogeneous distribution of F. asiaticum and Fgss samples in Set III.
To our knowledge, there is no present, detailed investigation for FGSC phylogenetic analysis via Bayesian topology. Several Fusarium spp. species excluding FGSC members have been identified and characterized by multiple alignment assays combined with Bayesian topology in the tef1−α, tub2, cyp51C, and rpb2 genes [32,33,34]. Similar to the existing studies, including Bayesian topology analysis for Fusarium spp., homogenous distributions of Fusarium spp. isolates belonging to the same species were present in this study.

3.3. PCA-Based Similarity Analysis

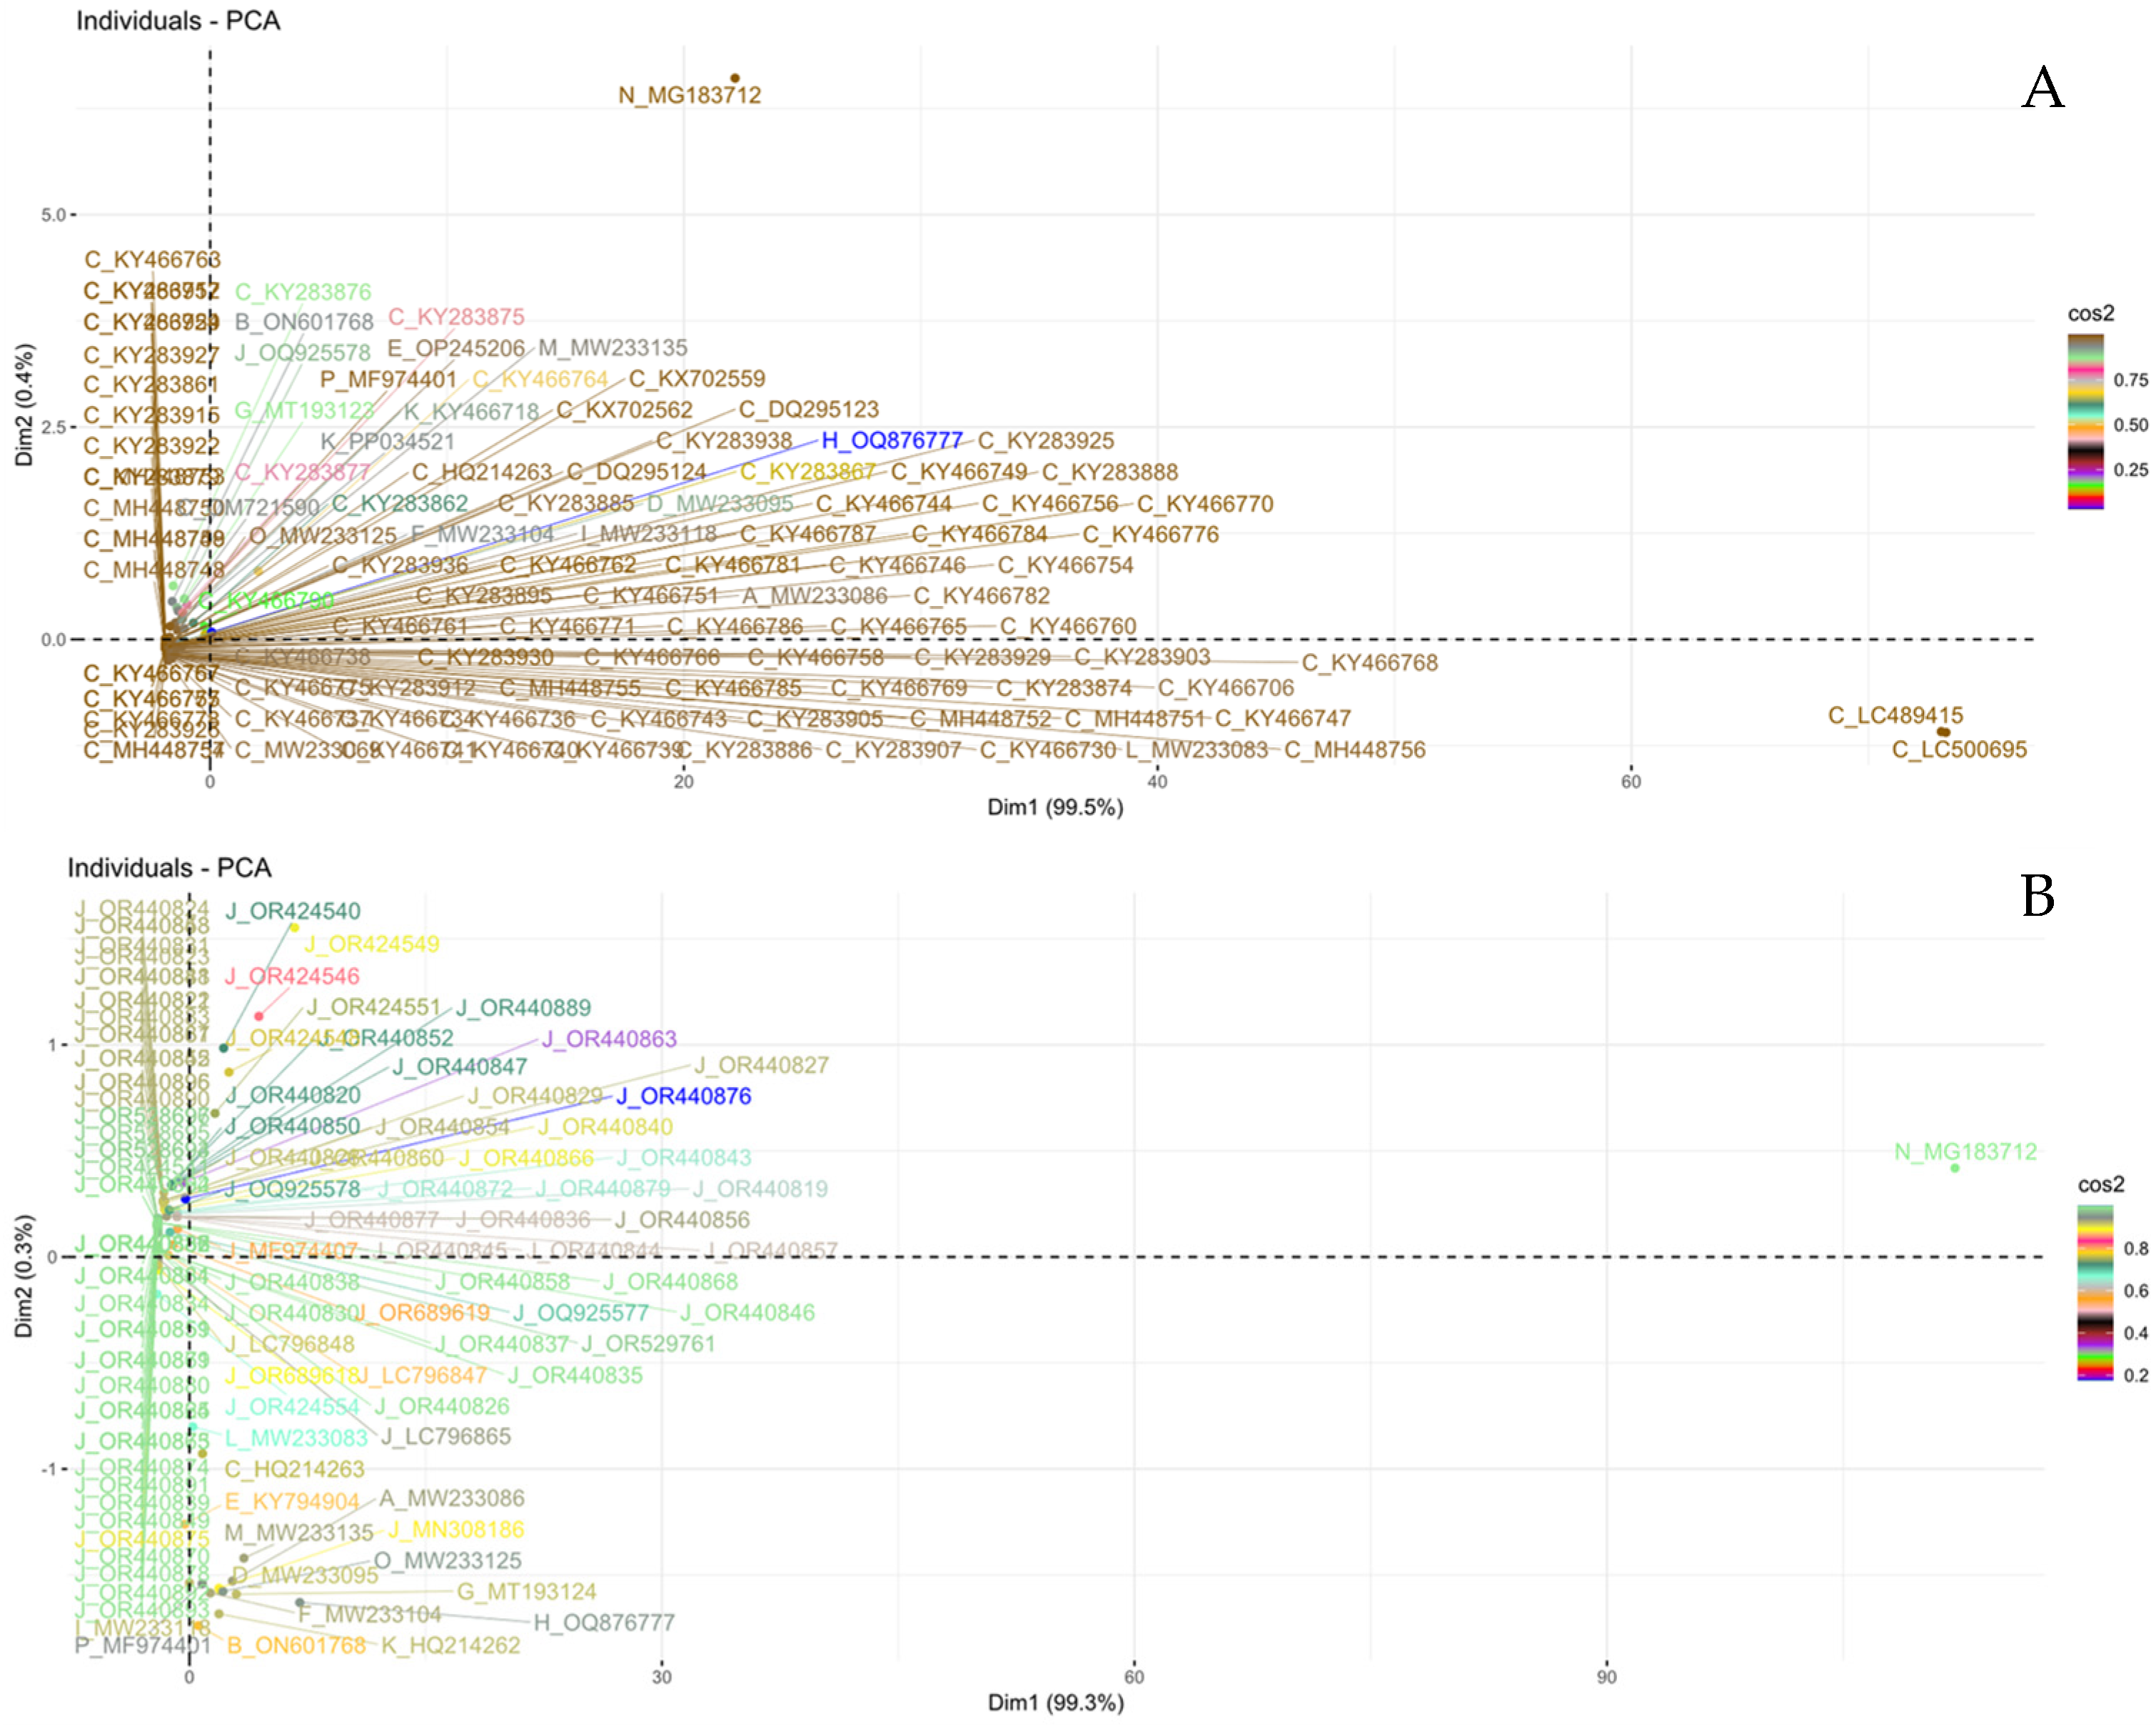
PCA tests were carried out using the R programming language for three sets separately. Set I PCA revealed 99.5% and 0.4% percentages for dimension 1 and dimension 2, respectively (Figure 5A). The F. solani isolate with accession number N_MG183712 was clearly located a quite far away from the FHB and CR causal agents. Additionally, two F. asiaticum samples (C_LC489415 and C_LC500695) were not co-clustered with the remaining 90 F. asiaticum samples. In comparison to the Set I PCA graphic, Set II samples were regularly clustered within dimension I (99.3%). Similarly, the F. solani isolate was clustered distinctively from all FHB and CR pathogens (Figure 5B). Set III revealed a natural combination of PCA graphics from Set I and Set II in terms of the homogenous distribution of FHB and CR pathogens with a 99.5% percentage of dimension 1 (Figure S5). PCA profiling of three different sets produced an overall homogenous distribution of FGSC members via tef1−α sequence alignment analysis.
Distance-based methods and character-based methods revealed strong co-clustering of Fgss and F. asiaticum isolates from remaining FGSC members, F. culmorum, and F. solani. Phylogenetic analysis for especially Set III resulted in FGSC members clustering in different sub-divisions from non-FHB and non-CR pathogens, as reported previously [17,24,25,28,29,30,31]. Especially UPGMA-based phylogenetics resulted in a homogenous distribution of Fgss and F. asiatium isolates. Similar data were obtained from ML-based phylogenetic analysis. Fgss and F. asiaticum isolates co-clustered in separate sub-divisions from the remaining FGSC members, F. culmorum and F. solani. Even if UPGMA has some limitations, such as assuming the same evolutionary speed and evolution rate, our results showed that UPGMA would be useful in phylogenetic studies that include a high number of samples with a limited number of taxa [35,36]. Similarly, ML-based phylogenetic analysis resulted in a great level of distinction between Fgss and F. asiaticum isolates from other Fusarium spp. This success in ML-phylogenetics in FGSC characterization might be due to the fact that there was no outlier or genetically most distant sample presence in the aligned data [37,38]. In addition to UPGMA- and ML-based phylogenetics, PCA also seemed to be an effective strategy for revealing the homogenous distribution of F. asiaticum, Fgss, F. meridionale, and F. boothii. FGSC members were clustered together in PCA profiling, resulting in a 99.5% percentage of homology. Phylogenetic analysis approaches supported by PCA tests are particularly important for increasing the reliability of studies of fungal species where subspecies or species complexes exist. PCA tests offer a holistic approach when compared to phylogenetic tests based on different mathematical arguments and help to clearly identify individuals at the genetic level when the phylogenetic diagnosis is in doubt. In this content, these results showed that FGSC members could effectively be genetically characterized via UPGMA- and ML-based phylogenetics in tef1−α sequence alignment strategies.

4. Conclusions

F. graminearum has always been at the center of interest for those studying plant pathology. Its global distribution, capacity to produce different types of important mycotoxins, being a species complex with geographically confusing distribution, and some other characteristics made F. graminearum such a popular phytopathogenic fungus worldwide. However, the need for the precise identification of FGSC members (formerly named as lineage) led scientists to develop reliable and verifiable methods. Hitherto, it is safe to say that multilocus genotyping has met this need. However, it could be concluded that tef1−α sequencing has also been quite successful on its own. This study was designed, in a sense, to test the success of the genetic identification of FGSC members by tef1−α sequencing. Four different methods were used for phylogenetic analysis with 246 FGSC members. Even if NJ and Bayesian topology assays revealed a relatively heterogeneous distribution of F. solani and F. culmorum within sub-divisions of FGSC members, the majority of Fgss and F. asiaticum isolates co-clustered in two large sub-divisions. The UPGMA and ML methods, which provided a near-perfect FGSC member characterization, were validated by PCA. The results showed that especially UPGMA- and ML-based phylogenetic treatments in FGSC members would be useful in member-specific genetic characterization via tef1−α sequencing data. This is also the first study to combine phylogenetic methods with PCA tests to reveal member-specific characterization in FGSC. An increased number of taxa with a higher number of FGSC isolates would be tested by using character- and distance-based phylogenetic analysis for tef1−α in future studies.

Supplementary Materials

The following supporting information can be downloaded at: https://www.mdpi.com/article/10.3390/d16080481/s1: Figure S1: NJ dendrogram for 248 Fusarium spp. Isolates. Yellow, green, blue, red, purple, and gray lines are predicting F. asiaticum, Fgss, F. culmorum, F. solani, F. meridionale, and F. boothii samples, respectively. Figure S2: UPGMA dendrogram for 248 Fusarium spp. Isolates. Yellow, green, blue, red, purple, and gray lines are predicting F. asiaticum, Fgss, F. culmorum, F. solani, F. meridionale, and F. boothii samples, respectively. Figure S3: ML dendrogram for 248 Fusarium spp. Isolates. Yellow, green, blue, red, purple, and gray lines are predicting F. asiaticum, Fgss, F. culmorum, F. solani, F. meridionale, and F. boothii samples, respectively. Figure S4: Bayesian topology dendrogram for 248 Fusarium spp. Isolates. Yellow, green, blue, red, purple, and gray lines are predicting F. asiaticum, Fgss, F. culmorum, F. solani, F. meridionale, and F. boothii samples, respectively. Figure S5: PCA profiling for 248 Fusarium spp. isolates.

Author Contributions

Conceptualization, E.Y. and T.Y.-M.; methodology, E.Y.; software, E.Y.; validation, E.Y. and T.Y.-M.; formal analysis, E.Y. and T.Y.-M.; investigation, E.Y. and T.Y.-M.; resources, E.Y. and T.Y.-M.; data curation, E.Y. and T.Y.-M.; writing—original draft preparation, E.Y.; writing—review and editing, T.Y.-M.; visualization, E.Y. and T.Y.-M.; supervision, T.Y.-M.; project administration, E.Y.; funding acquisition, E.Y. All authors have read and agreed to the published version of the manuscript.

Funding

This research received no external funding.

Institutional Review Board Statement

Not applicable.

Data Availability Statement

The DNA sequence data subjected to phylogenetic analysis in this study are deposited under the accession number given in Table 1.

Conflicts of Interest

The authors declare no conflicts of interest.

References

  1. McMullen, M.; Jones, R.; Gallenberg, D. Scab of Wheat and Barley: A Re-emerging Disease of Devastating Impact. Plant Dis. 1997, 81, 1340–1348. [Google Scholar] [CrossRef] [PubMed]
  2. Parry, D.W.; Jenkinson, P.; McLE, L. Fusarium ear blight (scab) in small grain cereals—A review. Plant Pathol. 1995, 44, 207–238. [Google Scholar] [CrossRef]
  3. Yli-Manila, T.; Gagkaeva, T.Y. Fusarium toxins in cereals in northern Europe and Asia. In Fungi; CRC Press: Boca Raton, FL, USA, 2018; pp. 293–317. [Google Scholar]
  4. Desjardins, A.E. Fusarium Mycotoxins: Chemistry, Genetics, and Biology. 2006. Available online: https://www.cabidigitallibrary.org/doi/full/10.5555/20063036927 (accessed on 14 July 2024).
  5. Desjardins, A.E.; Proctor, R.H. Molecular biology of Fusarium mycotoxins. Int. J. Food Microbiol. 2007, 119, 47–50. [Google Scholar] [CrossRef] [PubMed]
  6. Dean, R.; Van Kan, J.A.L.; Pretorius, Z.A.; Hammond-Kosack, K.E.; Di Pietro, A.; Spanu, P.D.; Rudd, J.J.; Dickman, M.; Kahmann, R.; Ellis, J.; et al. The Top 10 fungal pathogens in molecular plant pathology. Mol. Plant Pathol. 2012, 13, 414–430. [Google Scholar] [CrossRef] [PubMed]
  7. O’donnell, K.; Humber, R.A.; Geiser, D.M.; Kang, S.; Park, B.; Robert, V.A.R.G.; Crous, P.W.; Johnston, P.R.; Aoki, T.; Rooney, A.P.; et al. Phylogenetic diversity of insecticolous fusaria inferred from multilocus DNA sequence data and their molecular identification via FUSARIUM-ID and Fusarium MLST. Mycologia 2012, 104, 427–445. [Google Scholar] [CrossRef] [PubMed]
  8. Nicholson, P.; Chandler, E.; Draeger, R.C.; Gosman, N.E.; Simpson, D.R.; Thomsett, M.; Wilson, A.H. Molecular tools to study epidemiology and toxicology of Fusarium head blight of cereals. Eur. J. Plant Pathol. 2003, 109, 691–703. [Google Scholar] [CrossRef]
  9. Schilling, A. Polymerase chain reaction-based assays for species-specific detection of Fusarium culmorum, F. graminearum, and F. avenaceum. Phytopathology 1996, 86, 515–522. [Google Scholar] [CrossRef]
  10. Zhang, X.; Ma, H.; Zhou, Y.; Xing, J.; Chen, J.; Yu, G.; Sun, X.; Wang, L. Identification and Genetic Division of Fusarium graminearum and Fusarium asiaticum by Species-Specific SCAR Markers. J. Phytopathol. 2014, 162, 81–88. [Google Scholar] [CrossRef]
  11. O’Donnell, K.; Kistler, H.C.; Tacke, B.K.; Casper, H.H. Gene genealogies reveal global phylogeographic structure and reproductive isolation among lineages of Fusarium graminearum, the fungus causing wheat scab. Proc. Natl. Acad. Sci. USA 2000, 97, 7905–7910. [Google Scholar] [CrossRef]
  12. O’Donnell, K.; Sarver, B.A.J.; Brandt, M.; Chang, D.C.; Noble-Wang, J.; Park, B.J.; Sutton, D.A.; Benjamin, L.; Lindsley, M.; Padhye, A.; et al. Phylogenetic Diversity and Microsphere Array-Based Genotyping of Human Pathogenic Fusaria, Including Isolates from the Multistate Contact Lens-Associated U.S. Keratitis Outbreaks of 2005 and 2006. J. Clin. Microbiol. 2007, 45, 2235–2248. [Google Scholar] [CrossRef]
  13. O’donnell, K.; Ward, T.J.; Aberra, D.; Kistler, H.C.; Aoki, T.; Orwig, N.; Kimura, M.; Bjørnstad, S.; Klemsdal, S.S. Multilocus genotyping and molecular phylogenetics resolve a novel head blight pathogen within the Fusarium graminearum species complex from Ethiopia. Fungal Genet. Biol. 2008, 45, 1514–1522. [Google Scholar] [CrossRef] [PubMed]
  14. Sarver, B.A.J.; Ward, T.J.; Gale, L.R.; Broz, K.; Kistler, H.C.; Aoki, T.; Nicholson, P.; Carter, J.; O’donnell, K. Novel Fusarium head blight pathogens from Nepal and Louisiana revealed by multilocus genealogical concordance. Fungal Genet. Biol. 2011, 48, 1096–1107. [Google Scholar] [CrossRef] [PubMed]
  15. Wang, C.; Zhang, S.; Hou, R.; Zhao, Z.; Zheng, Q.; Xu, Q.; Zheng, D.; Wang, G.; Liu, H.; Gao, X.; et al. Functional analysis of the kinome of the wheat scab fungus Fusarium graminearum. PLoS Pathog. 2011, 7, e1002460. [Google Scholar] [CrossRef] [PubMed]
  16. Garmendia, G.; Umpierrez-Failache, M.; Ward, T.J.; Vero, S. Development of a PCR-RFLP method based on the transcription elongation factor 1-gene to differentiate Fusarium graminearum from other species within the Fusarium graminearum species complex. Food Microbiol. 2018, 70, 28–32. [Google Scholar] [CrossRef] [PubMed]
  17. Tunal, B.; Yrk, E.; Sefer, Ö.; Kansu, B.; Sharifnabi, B. First Report on Identification of Fusarium graminearum Species Complex Members from Turkey and Iran. Turk. J. Agric. Food Sci. Technol. 2019, 7, 1040–1045. [Google Scholar] [CrossRef]
  18. Qu, B.; Li, H.P.; Zhang, J.B.; Huang, T.; Carter, J.; Liao, Y.C.; Nicholson, P. Comparison of genetic diversity and pathogenicity of fusarium head blight pathogens from China and Europe by SSCP and seedling assays on wheat. Plant Pathol. 2008, 57, 642–651. [Google Scholar] [CrossRef]
  19. Wang, C.-L.; Cheng, Y.-H. Identification and trichothecene genotypes of Fusarium graminearum species complex from wheat in Taiwan. Bot. Stud. 2017, 58, 4. [Google Scholar] [CrossRef]
  20. Yörük, E.; Albayrak, G. Genetic characterization of Fusarium graminearum and F. culmorum isolates from Turkey by using random-amplified polymorphic DNA. Genetics and Molecular Research 2013, 12, 1360–1372. [Google Scholar] [CrossRef] [PubMed]
  21. Letunic, I.; Bork, P. Interactive Tree of Life (iTOL) v6: Recent updates to the phylogenetic tree display and annotation tool. Nucleic Acids Res. 2024, 52, 78–82. [Google Scholar] [CrossRef]
  22. Nguyen, L.-T.; Schmidt, H.A.; Von Haeseler, A.; Minh, B.Q. IQ-TREE: A fast and effective stochastic algorithm for estimating maximum-likelihood phylogenies. Mol. Biol. Evol. 2015, 32, 268–274. [Google Scholar] [CrossRef]
  23. Huelsenbeck, J.P.; Ronquist, F. MRBAYES: Bayesian inference of phylogenetic trees. Bioinformatics 2001, 17, 754–755. [Google Scholar] [CrossRef] [PubMed]
  24. Hafez, M.; Abdelmagid, A.; Adam, L.R.; Daayf, F. Specific Detection and Identification of Fusarium graminearum Sensu Stricto Using a PCR-RFLP Tool and Specific Primers Targeting the Translational Elongation Factor 1α Gene. Plant Dis. 2020, 104, 1076–1086. [Google Scholar] [CrossRef] [PubMed]
  25. Boutigny, A.-L.; Gautier, A.; Basler, R.; Dauthieux, F.; Leite, S.; Valade, R.; Aguayo, J.; Ioos, R.; Laval, V. Metabarcoding targeting the EF1 alpha region to assess Fusarium diversity on cereals. PLoS ONE 2019, 14, e0207988. [Google Scholar] [CrossRef] [PubMed]
  26. Geiser, D.M.; Aoki, T.; Bacon, C.W.; Baker, S.E.; Bhattacharyya, M.K.; Brandt, M.E.; Brown, D.W.; Burgess, L.W.; Chulze, S.; Coleman, J.J.; et al. One Fungus, One Name: Defining the Genus Fusarium in a Scientifically Robust Way That Preserves Longstanding Use. Phytopathology 2013, 103, 400–408. [Google Scholar] [CrossRef] [PubMed]
  27. Geiser, D.M.; Al-Hatmi, A.M.S.; Ao, T.; Arie, T.; Balmas, V.; Barnes, I.; Viljoen, A. Phylogenomic Analysis of a 55. 1-kb 19-Gene Dataset Resolves a Monophyletic Fusarium that Includes the Fusarium solani Species Complex. Phytopathology 2021, 111, 1064–1079. [Google Scholar] [CrossRef] [PubMed]
  28. Alvarez, C.L.; Somma, S.; Proctor, R.H.; Stea, G.; Mulè, G.; Logrieco, A.F.; Pinto, V.F.; Moretti, A. Genetic Diversity in Fusarium graminearum from a Major Wheat-Producing Region of Argentina. Toxins 2011, 3, 1294–1309. [Google Scholar] [CrossRef] [PubMed]
  29. Bentley, A.R.; Cromey, M.G.; Farrokhi-Nejad, R.; Leslie, J.F.; Summerell, B.A.; Burgess, L.W. Fusarium crown and root rot pathogens associated with wheat and grass stem bases on the South Island of New Zealand. Australas. Plant Pathol. 2006, 35, 495. [Google Scholar] [CrossRef]
  30. Minati, M.H.; Mohammed-Ameen, M.K. Novel report on six Fusarium species associated with head blight and crown rot of wheat in Basra province, Iraq. Bull. Natl. Res. Cent. 2019, 43, 139. [Google Scholar] [CrossRef]
  31. Stępniewska, H.; Jankowiak, R.; Bilański, P.; Hausner, G. Structure and Abundance of Fusarium Communities Inhabiting the Litter of Beech Forests in Central Europe. Forests 2021, 12, 811. [Google Scholar] [CrossRef]
  32. Fernández-Ortuño, D.; Loza-Reyes, E.; Atkins, S.L.; Fraaije, B.A. The CYP51C gene, a reliable marker to resolve interspecific phylogenetic relationships within the Fusarium species complex and a novel target for species-specific PCR. Int. J. Food Microbiol. 2010, 144, 301–309. [Google Scholar] [CrossRef]
  33. Noel, Z.A.; Roze, L.V.; Breunig, M.; Trail, F. Endophytic Fungi as a Promising Biocontrol Agent to Protect Wheat from Fusarium graminearum Head Blight. Plant Dis. 2022, 106, 595–602. [Google Scholar] [CrossRef]
  34. Sanna, M.; Martino, I.; Guarnaccia, V.; Mezzalama, M. Diversity and Pathogenicity of Fusarium Species Associated with Stalk and Crown Rot in Maize in Northern Italy. Plants 2023, 12, 3857. [Google Scholar] [CrossRef] [PubMed]
  35. Backeljau, T.; De Bruyn, L.; De Wolf, H.; Jordaens, K.; Van Dongen, S.; Winnepennincks, B. Multiple UPGMA and Neighbor-joining Trees and the Performance of Some Computer Packages. Mol. Biol. Evol. 1996, 13, 309–313. [Google Scholar] [CrossRef]
  36. Drummond, A.; Rodrigo, A.G. Reconstructing Genealogies of Serial Samples Under the Assumption of a Molecular Clock Using Serial-Sample UPGMA. Mol. Biol. Evol. 2000, 17, 1807–1815. [Google Scholar] [CrossRef]
  37. Michu, E. A short guide to phylogeny reconstruction. Plant Soil Environ. 2007, 53, 442–446. [Google Scholar] [CrossRef]
  38. Saitou, N. Property and efficiency of the maximum likelihood method for molecular phylogeny. J. Mol. Evol. 1988, 27, 261–273. [Google Scholar] [CrossRef]
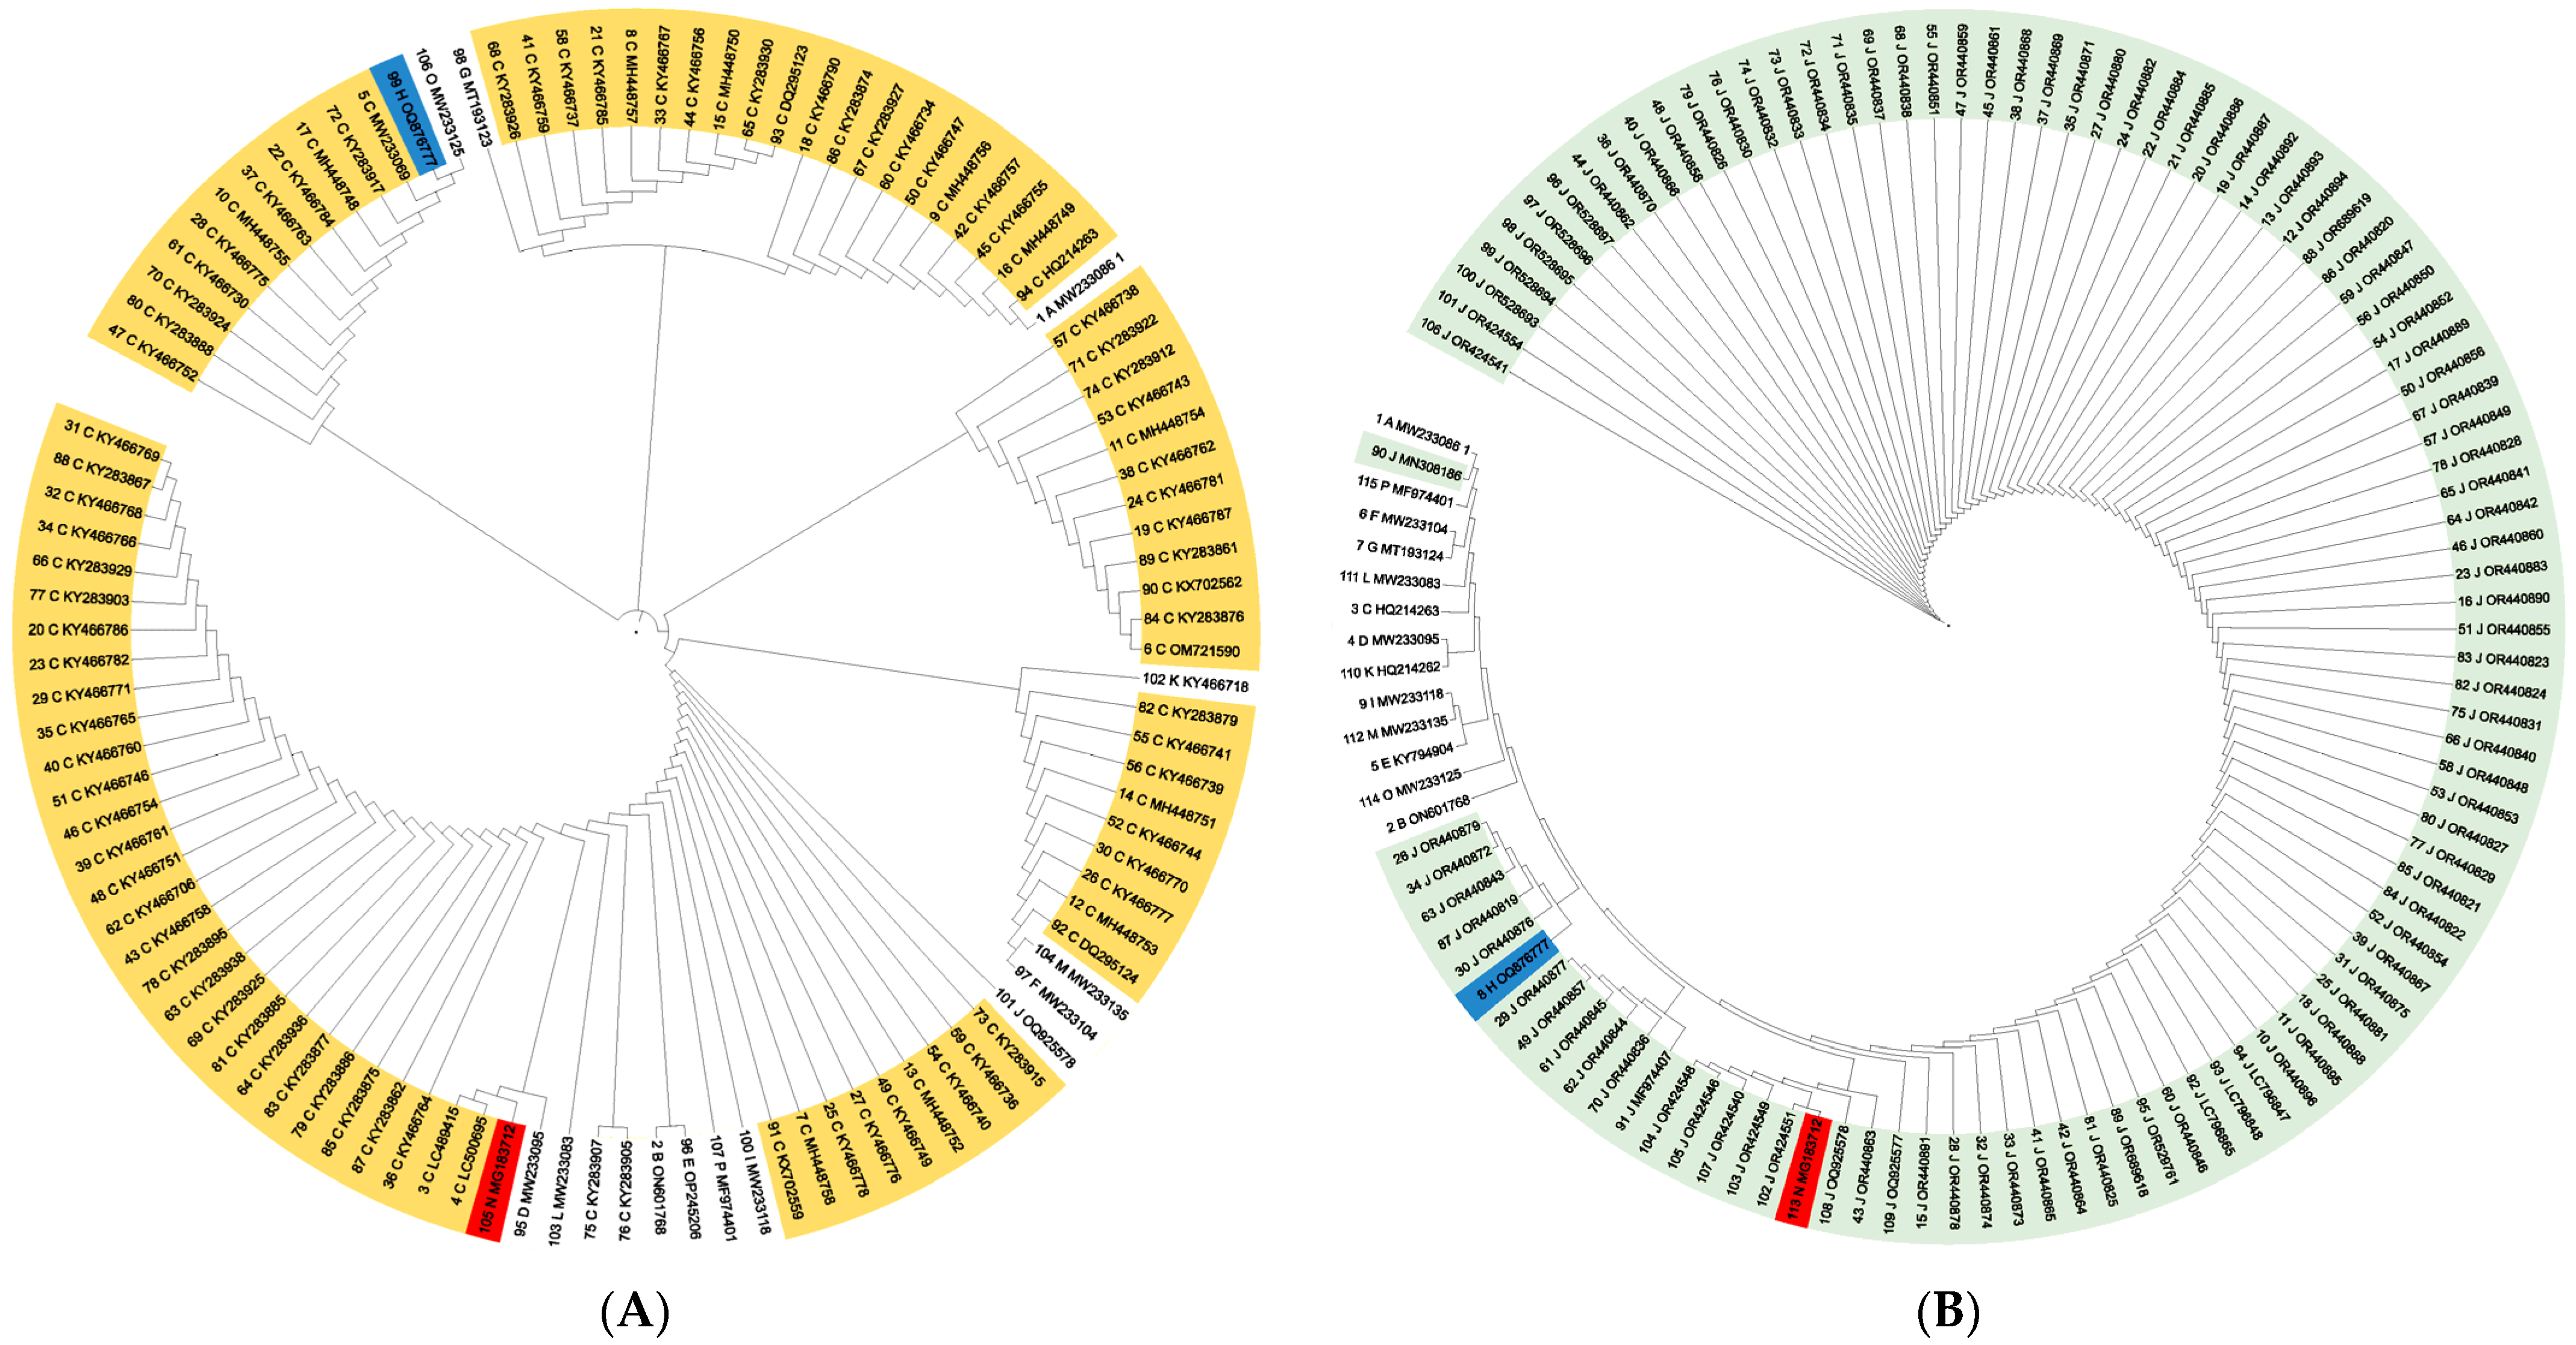
Figure 1. F. asiaticum (A) and Fgss (B) NJ dendrograms. Yellow, green, blue, and red lines are predicting F. asiaticum, Fgss, F. culmorum, and F. solani samples, respectively.
Diversity 16 00481 g001
Figure 2. F. asiaticum (A) and Fgss (B) UPGMA dendrograms. Yellow, green, blue, and red lines are predicting F. asiaticum, Fgss, F. culmorum, and F. solani samples, respectively.
Diversity 16 00481 g002
Figure 3. F. asiaticum (A) and Fgss (B) ML dendrograms. Yellow, green, blue, and red lines are predicting F. asiaticum, Fgss, F. culmorum, and F. solani samples, respectively.
Diversity 16 00481 g003
Figure 4. F. asiaticum (A) and Fgss (B) Bayesian dendrograms. Yellow, green, blue, and red lines are predicting F. asiaticum, Fgss, F. culmorum, and F. solani samples, respectively.
Diversity 16 00481 g004
Figure 5. PCA profiling of F. asiaticum (A) and Fgss (B) samples subjected to tef1−α sequence based phylogenetic analysis.
Diversity 16 00481 g005
Table 1. FGSC isolates subjected to phylogenetic analysis in this study with their accession numbers.
NoSpeciesSample CodeNoSpeciesSample CodeNoSpeciesSample CodeNoSpeciesSample Code
1F. acacia-mearnsiiA_OP24520163F. asiaticumC_KY466730125FgssJ_OR440886187FgssJ_OR440824
2F. acacia-mearnsiiA_MW23308664F. asiaticumC_KY466706126FgssJ_OR440885188FgssJ_OR440823
3F. aethiopicumB_ON60176865F. asiaticumC_KY283938127FgssJ_OR440884189FgssJ_OR440822
4F. aethiopicumB_MW23312666F. asiaticumC_KY283936128FgssJ_OR440883190FgssJ_OR440821
5F. asiaticumC_LC48941567F. asiaticumC_KY283930129FgssJ_OR440882191FgssJ_OR440820
6F. asiaticumC_LC50069568F. asiaticumC_KY283929130FgssJ_OR440881192FgssJ_OR440819
7F. asiaticumC_MW23306969F. asiaticumC_KY283927131FgssJ_OR440879193FgssJ_OR689619
8F. asiaticumC_OM72159070F. asiaticumC_KY283926132FgssJ_OR440880194FgssJ_OR689618
9F. asiaticumC_MH44875871F. asiaticumC_KY283925133FgssJ_OR440878195FgssJ_MN308186
10F. asiaticumC_MH44875772F. asiaticumC_KY283924134FgssJ_OR440877196FgssJ_MF974407
11F. asiaticumC_MH44875673F. asiaticumC_KY283922135FgssJ_OR440876197FgssJ_LC796865
12F. asiaticumC_MH44875574F. asiaticumC_KY283917136FgssJ_OR440875198FgssJ_LC796848
13F. asiaticumC_MH44875475F. asiaticumC_KY283915137FgssJ_OR440874199FgssJ_LC796847
14F. asiaticumC_MH44875376F. asiaticumC_KY283912138FgssJ_OR440873200FgssJ_OR529761
15F. asiaticumC_MH44875277F. asiaticumC_KY283907139FgssJ_OR440872201FgssJ_OR528697
16F. asiaticumC_MH44875178F. asiaticumC_KY283905140FgssJ_OR440871202FgssJ_OR528696
17F. asiaticumC_MH44875079F. asiaticumC_KY283903141FgssJ_OR440870203FgssJ_OR528695
18F. asiaticumC_MH44874980F. asiaticumC_KY283895142FgssJ_OR440869204FgssJ_OR528694
19F. asiaticumC_MH44874881F. asiaticumC_KY283886143FgssJ_OR440868205FgssJ_OR528693
20F. asiaticumC_KY46679082F. asiaticumC_KY283888144FgssJ_OR440867206FgssJ_OR424554
21F. asiaticumC_KY46678783F. asiaticumC_KY283885145FgssJ_OR440866207FgssJ_OR424551
22F. asiaticumC_KY46678684F. asiaticumC_KY283879146FgssJ_OR440865208FgssJ_OR424549
23F. asiaticumC_KY46678585F. asiaticumC_KY283877147FgssJ_OR440864209FgssJ_OR424548
24F. asiaticumC_KY46678486F. asiaticumC_KY283876148FgssJ_OR440863210FgssJ_OR424546
25F. asiaticumC_KY46678287F. asiaticumC_KY283875149FgssJ_OR440862211FgssJ_OR424541
26F. asiaticumC_KY46678188F. asiaticumC_KY283874150FgssJ_OR440861212FgssJ_OR424540
27F. asiaticumC_KY46677889F. asiaticumC_KY283862151FgssJ_OR440860213FgssJ_OQ925578
28F. asiaticumC_KY46677790F. asiaticumC_KY283867152FgssJ_OR440859214FgssJ_OQ925577
29F. asiaticumC_KY46677691F. asiaticumC_KY283861153FgssJ_OR440858215F. meridionaleK_PP034521
30F. asiaticumC_KY46677592F. asiaticumC_KX702562154FgssJ_OR440857216F. meridionaleK_MW233092
31F. asiaticumC_KY46677193F. asiaticumC_KX702559155FgssJ_OR440856217F. meridionaleK_MG838991
32F. asiaticumC_KY46677094F. asiaticumC_DQ295124156FgssJ_OR440855218F. meridionaleK_MG838988
33F. asiaticumC_KY46676995F. asiaticumC_DQ295123157FgssJ_OR440854219F. meridionaleK_MG838955
34F. asiaticumC_KY46676896F. asiaticumC_HQ214263158FgssJ_OR440853220F. meridionaleK_MG838949
35F. asiaticumC_KY46676797F. austroamericanumD_MW233095159FgssJ_OR440852221F. meridionaleK_MG838948
36F. asiaticumC_KY46676698F. boothiiE_OP245207160FgssJ_OR440851222F. meridionaleK_MG838947
37F. asiaticumC_KY46676599F. boothiiE_OP245206161FgssJ_OR440850223F. meridionaleK_MH448800
38F. asiaticumC_KY466764100F. boothiiE_OP245205162FgssJ_OR440849224F. meridionaleK_MH448801
39F. asiaticumC_KY466763101F. boothiiE_OP245204163FgssJ_OR440848225F. meridionaleK_MH448802
40F. asiaticumC_KY466762102F. boothiiE_PP035520164FgssJ_OR440847226F. meridionaleK_MH448803
41F. asiaticumC_KY466761103F. boothiiE_PP035519165FgssJ_OR440846227F. meridionaleK_MH448796
42F. asiaticumC_KY466760104F. boothiiE_ON601969166FgssJ_OR440845228F. meridionaleK_MH448797
43F. asiaticumC_KY466759105F. boothiiE_ON601968167FgssJ_OR440844229F. meridionaleK_MH448798
44F. asiaticumC_KY466757106F. boothiiE_ON601967168FgssJ_OR440843230F. meridionaleK_MH448799
45F. asiaticumC_KY466758107F. boothiiE_MW233088169FgssJ_OR440842231F. meridionaleK_KY466783
46F. asiaticumC_KY466756108F. boothiiE_KY794904170FgssJ_OR440841232F. meridionaleK_KY466779
47F. asiaticumC_KY466755109F. brasilicumF_MW233104171FgssJ_OR440840233F. meridionaleK_KY466774
48F. asiaticumC_KY466754110F. cortaderiaeG_MW233098172FgssJ_OR440839234F. meridionaleK_KY466773
49F. asiaticumC_KY466752111F. cortaderiaeG_MT193123173FgssJ_OR440838235F. meridionaleK_KY466772
50F. asiaticumC_KY466751112F. cortaderiaeG_MT193124174FgssJ_OR440837236F. meridionaleK_KY466735
51F. asiaticumC_KY466749113F. culmorumH_OQ876777175FgssJ_OR440836237F. meridionaleK_KY466733
52F. asiaticumC_KY466747114F. gerlachiiI_MW233118176FgssJ_OR440835238F. meridionaleK_KY466732
53F. asiaticumC_KY466746115FgssJ_OR440896177FgssJ_OR440834239F. meridionaleK_KY466731
54F. asiaticumC_KY466744116FgssJ_OR440895178FgssJ_OR440833240F. meridionaleK_KY466718
55F. asiaticumC_KY466743117FgssJ_OR440894179FgssJ_OR440832241F. meridionaleK_HQ214262
56F. asiaticumC_KY466740118FgssJ_OR440893180FgssJ_OR440831242F. mesoamericanumL_MW233083
57F. asiaticumC_KY466741119FgssJ_OR440892181FgssJ_OR440830243F. nepalenseM_MW233135
58F. asiaticumC_KY466739120FgssJ_OR440891182FgssJ_OR440829244F. solaniN_MG183712
59F. asiaticumC_KY466738121FgssJ_OR440890183FgssJ_OR440828245F. ussurianumO_MW233125
60F. asiaticumC_KY466737122FgssJ_OR440889184FgssJ_OR440826246F. vorosiiP_MW233119
61F. asiaticumC_KY466736123FgssJ_OR440888185FgssJ_OR440827247F. vorosiiP_KY586243
62F. asiaticumC_KY466734124FgssJ_OR440887186FgssJ_OR440825248F. vorosiiP_MF974401
Table 2. Alignment results obtained from iqtree-based ML treatment for three sets.
SetParsimony Informative SitesSingleton SitesConstant SitesGap/AmbiguityChi2 Test Base Frequencies (A/C/G/T)
Set I24612040518.13%p < 0.05, df = 30.220/0.301/0.220/0.259
Set II3615855420.38%p < 0.05, df = 30.25/0.25/0.25/0.25
Set III29312434419.73%p < 0.05, df = 30.25/0.25/0.25/0.25
Disclaimer/Publisher’s Note: The statements, opinions and data contained in all publications are solely those of the individual author(s) and contributor(s) and not of MDPI and/or the editor(s). MDPI and/or the editor(s) disclaim responsibility for any injury to people or property resulting from any ideas, methods, instructions or products referred to in the content.