Article

Role of Rare Species on Phytoplankton Size–Abundance Relationships and Size Structure across Different Biogeographical Areas

1
Department of Biological and Environmental Sciences and Technologies (DiSTeBA), University of Salento, 73100 Lecce, Italy
2
Institute for Research on Terrestrial Ecosystems (IRET), Italian National Research Council (CNR), 73100 Lecce, Italy
3
Hellenic Centre for Marine Research, Institute of Oceanography, 19013 Anavyssos, Greece
4
National Biodiversity Future Center, 90133 Palermo, Italy
*
Authors to whom correspondence should be addressed.
Diversity 2024, 16(2), 98; https://doi.org/10.3390/d16020098
Submission received: 29 December 2023 / Revised: 26 January 2024 / Accepted: 30 January 2024 / Published: 2 February 2024
(This article belongs to the Section Plant Diversity)

Abstract

:
Phytoplankton guilds are commonly characterised by dominance effects, while the main contribution to biological diversity is given by rare species. Here, we analysed the influence of rare species on taxonomic and functional diversity, which is described by taxa richness and composition, cell size, and size–abundance relationships in phytoplankton guilds. We explore these relationships at global and regional scales by analysing phytoplankton guilds from five biogeographical regions: the Northern Atlantic Ocean (Scotland), the South-Western Atlantic Ocean (Brazil), the South-Western Pacific Ocean (Australia), the Indo-Pacific Ocean (Maldives), and the Mediterranean Sea (Greece and Turkey). We have comparatively analysed the phytoplankton taxonomic diversity of the whole dataset and with the datasets obtained by progressively subtracting taxa occurring in the last 1%, 5%, 10%, and 25% of both numerical abundance and overall biomass. Globally, 306 taxa were identified across five ecoregions with only 27 taxa accounting for 75% of overall numerical abundance and biomass; almost 50% of taxa were lost on every step. The removal of 1% of most rare taxa significantly affected the phytoplankton size–abundance relationships and body-size structure, strongly impacting on small taxa. The progressive removal of additional rare taxa did not further affect phytoplankton size–abundance relationships and size structure.

1. Introduction

A common pattern is often observed in ecological communities: a few common species make up the majority of individuals, while the majority of species are rare [1,2,3]. Rare species are those with low relative abundance within the communities, restricted habitat selection, and/or limited distributional range [4]. Despite their low abundance, the occurrence and distribution of rare species can play a fundamental role in shaping ecosystem dynamics by influencing community diversity, structure, and stability. In the current context of global environmental change and escalating biodiversity loss, rare species may face increased vulnerability and risk of extinction [5] or compensate for the impact on other species with their numerical abundance increase. Concerns related to the rapid loss of biodiversity due to climatic regulations and anthropogenic activities have made it important to comprehend the role of rare species in maintaining the structure, functioning, and services of ecosystems [6,7]. Consequently, rare species have received increased attention from conservation biologists and ecologists [8,9], and rarity studies within ecological communities have encompassed a broad spectrum of organisms to provide a more comprehensive understanding of biodiversity dynamics [10].
Certain taxonomic groups have received more attention than others; in particular, plants [11,12,13], butterflies [14,15], beetles [16], birds, mammals [17,18,19] in the terrestrial realm, and invertebrates and deep sea taxa [20,21] in marine ones. On the other hand, the role of rare species in phytoplankton communities has received limited attention, so far [22,23,24].
Phytoplankton comprise diverse photosynthetic microorganisms that form the base of aquatic food webs and contribute substantially to global biogeochemical cycles [25]. Many studies show that phytoplankton guilds are commonly characterised by dominance effects [26,27], while the main contribution to biological diversity is given by rare species [28,29], but very few addressed the ecological role of rare species, which remains unclear [30].
This investigation focuses on the distribution of different species within phytoplankton communities from 24 transitional water ecosystems, ecotones between marine and freshwater environments, exploring how the less common species coexist with the dominant ones. Through the use of an integrated individual-level trait-based phytoplankton dataset [31], size–abundance relationships at global and regional scales have been analysed in phytoplankton guilds from five biogeographical regions: the Northern Atlantic Ocean (Scotland), the South-Western Atlantic Ocean (Brazil), the South-Western Pacific Ocean (Australia), the Indo-Pacific Ocean (Maldives), and the Mediterranean Sea (Greece and Turkey).
Size–abundance relationships tend to show common patterns of variation in numerical populations or species abundance in relation to average body size at the individual level [32,33] across different animal and plant guilds, including phytoplankton [34,35], macroinvertebrates, and fish [36,37] in aquatic ecosystems. Theoretically, a rule of −3/4 is expected for the scaling coefficient for both global and local size–abundance relationships [38,39]. Rare species often manifest as tails or outliers in size–abundance distribution and are typically treated as artefacts or noise in the data and consequently excluded from data analysis [40,41].
The purpose of this study is to add knowledge on the quantitative relevance and functional importance of species rarity in phytoplankton community by addressing the role of rare species in shaping phytoplankton size–abundance relationships.
Here, we focus on the patterns of change of size–abundance relationships in a large phytoplankton individual trait-based dataset at the removal of rare and occasional species. This paper aims to investigate the role of the taxonomic diversity component, which is represented by most rare species, on the morpho-functional diversity in phytoplankton guilds, where a hierarchical organization has already been observed [42] with the morpho-functional diversity at the highest level of the hierarchy.

2. Materials and Methods

2.1. Sampling and Data Collection

This study was performed using an integrated, individual-level, trait-based phytoplankton dataset that is openly accessible from the LifeWatch Italy data portal (https://dataportal.lifewatchitaly.eu/data (accessed on 10 January 2024). The integrated dataset contains 6 datasets from phytoplankton data collected in 24 transitional water ecosystems, located across five biogeographical regions: the Northern Atlantic Ocean (Scotland), the South-Western Atlantic Ocean (Brazil), the South-Western Pacific Ocean (Australia), the Indo-Pacific Ocean (Maldives), and the Mediterranean Sea (Greece and Turkey) (Figure 1). The study sites in this study were mostly tidal and non-tidal lagoons that exhibit heterogeneity in hydro-morphological and physio-chemical characteristics with low anthropogenic pressure and relatively pristine nature [43,44,45]. Phytoplankton samples were collected following a hierarchical sampling design: three ecosystems were selected for each biogeographical area, and within each ecosystem, a maximum of three habitat types were selected. Three experimental stations were sampled per habitat type, each with three replicates, resulting in a total count of 116 sites. Samples were collected with horizontal tows from a net of 6 µm mesh at a subsurface depth of 0.5 m and preserved with Lugol’s solution (15 mL/L). Phytoplankton identification and analysis were carried out using a Nikon T300E inverted microscope connected to a video-interactive image analysis system (L.U.C.I.A Version 4.8, Laboratory Imaging) following the Utermöhl’s method [46] at 400× magnification. For each sample, around 400 cells were counted, measured, and identified to the lowest taxonomic level possible. Taxonomic identification of cells was carried out by using specific monographs, manuals, and phytoplankton atlases [47,48,49,50], and further validation was conducted by using WoRMS [51]. The qualifiers “cf.”, ”sp.”, and “spp.” were used to indicate the cell to its nearest nominated species; spherical cells with the presence of flagella and chloroplasts that could not be identified at the species or higher levels were grouped and identified with the term “phytoflagellates”. Phytoplankton cell volume (expressed in μm3) was determined by measuring the specific cell dimensions, on the basis of associated cell shape, and using geometric equations [52]. Cellular biovolume was converted to carbon content (pg C) following Menden-Deuer and Lessard [53]. Shannon–Wiener’s diversity index (H’) and Morisita index ( C λ ) of similarity were used to calculate the diversity and dispersion of taxa based on their abundance in phytoplankton community [54,55] at the global and regional scale. The formulas were given as follows:
H = i = 1 S p i × l n   p i
where S is the total number of taxa present, p i is the relative abundance of taxa i and estimated as ( n i /N), n i is the number of individuals in taxa i, and N is the total number of individuals.
C λ = 2 i = 1 x i y i ( λ x + λ y ) N x N y
where
λ x = i x i ( x i 1 ) N x ( N x 1 )
N x = i x i , and λ x is the unbiased estimate for the probability of drawing two individuals of same taxa from x, without replacement.

2.2. Statistical Analyses

To identify the role of rare and occasional taxa in setting a phytoplankton size structure and community distribution, the integrated dataset and the individual six regional datasets were filtered by choosing a threshold value of 1%, 5%, 10%, and 25% in the cumulative contribution of both taxa abundance and biomass. By progressively subtracting taxa that contributed to the lower 1%, 5%, 10%, and 25% of both numerical abundance and biomass, this means that only taxa occurring in both the last 1% of numerical abundance and the last 1% of overall biomass were actually removed, and a similar method has been used for all other thresholds. Therefore, at the threshold of 1%, the actual numerical abundance and biomass removed were less than 1% (0.5% abundance removed and 0.8% biomass removed). This was similar for the threshold of 5% (3.8% abundance, 4% biomass were removed), the threshold of 10% (7.1% abundance, 8.4% biomass), and the threshold of 25% (20% abundance, 21% biomass). From the global and regional datasets, size–abundance relationships were investigated. The global size–abundance relationship (GSAR) and the local size–abundance relationship (LSAR) were shown as the linear regressions between average body size and overall taxa abundance, on a logarithmic scale. Extremely rare or occasional taxa accounted for less than 1%, 5%, 10%, and 25% in cumulative contribution to the overall abundance and biomass; they were also investigated in terms of taxonomy and size class distribution. Size class distribution was conducted using the average individual cellular carbon content of phytoplankton taxa on the logarithmic (log2) scale [56], forming 16 size classes with a size class width of 1 and clustering these classes into 6 ordered size classes (i.e., a cluster of 2, 3, 3, 3, 3, 2 classes). Linear analysis of covariance (ANCOVA) was used to test pairwise comparisons of slopes and was obtained before and after filtering the datasets using 1%, 5%, 10%, and 25% threshold values, from the theoretical expectation of slope values from Damut’s law [57]. All statistical analyses were conducted using R Studio statistical and programming software (package: dplyr, version 4.2.1) [58].

3. Results

3.1. Global and Local Phytoplankton Size–abundance Relationships

The overall phytoplankton sampled guilds, comprising 127,311 cells, consisted of 306 taxa. Approximately 58% of the taxa have been identified at the species level (177 species), while the remaining taxa were classified at the genus or family level, pertaining to ten phyla globally. Among these, Bacillariophyta and Myzozoa represented most of the taxa, having high abundance and the highest frequency of occurrence. Chlorophyta and Cryptophyta were also relevant at specific ecoregions (i.e., in the Northern Atlantic Ocean and in the Mediterranean Sea; Figure 1a). At the species level, most species have a marine origin, and few species were freshwater or ubiquitous (Figure 1b).
Global size–abundance relationships were all highly significant, irrespective of the percent removal of rare species, from 0% to 25%, but the scaling coefficient was lower at 0% removal than at all other rare species removal thresholds (i.e., from 1% to 25%) (Figure 2a). A significant difference was observed in the scaling coefficient of the size–abundance relationships only when 1% of most rare species had been removed (Figure 2a), and the scaling coefficient decreased from −0.38, at 0% removal, to −0.60, at 1% removal. All parameters of the global size–abundance relationships were reported in Table 1. When we applied the 1% threshold, 131 taxa were removed, with an exclusion of approximately 42% of overall taxa richness, corresponding to 732 individuals. A complete list of rare taxa is provided in the Supplementary Materials, Table S2.
At the regional level, a significant difference in the scaling coefficient of the size-abundance relationships has been observed only when 1% of rare taxa were removed. This was observed specifically only in the South-Western Atlantic Ocean and in the South-Western Pacific Ocean (Figure 2b; Table 1), where the scaling coefficient decreased from −0.64, at 0% removal, to −1.09, at 1% removal, in the South-Western Atlantic Ocean and from −0.31, at 0% removal, to −0.85 at, 1% removal, in the South-Western Pacific Ocean. Scaling coefficients followed the same patterns in the other three biogeographical areas, but the differences in the scaling coefficients were only qualitative p > 0.05 for all comparisons, with a single exception (the Mediterranean Sea; comparison between 10% and 25% thresholds, Table 1).

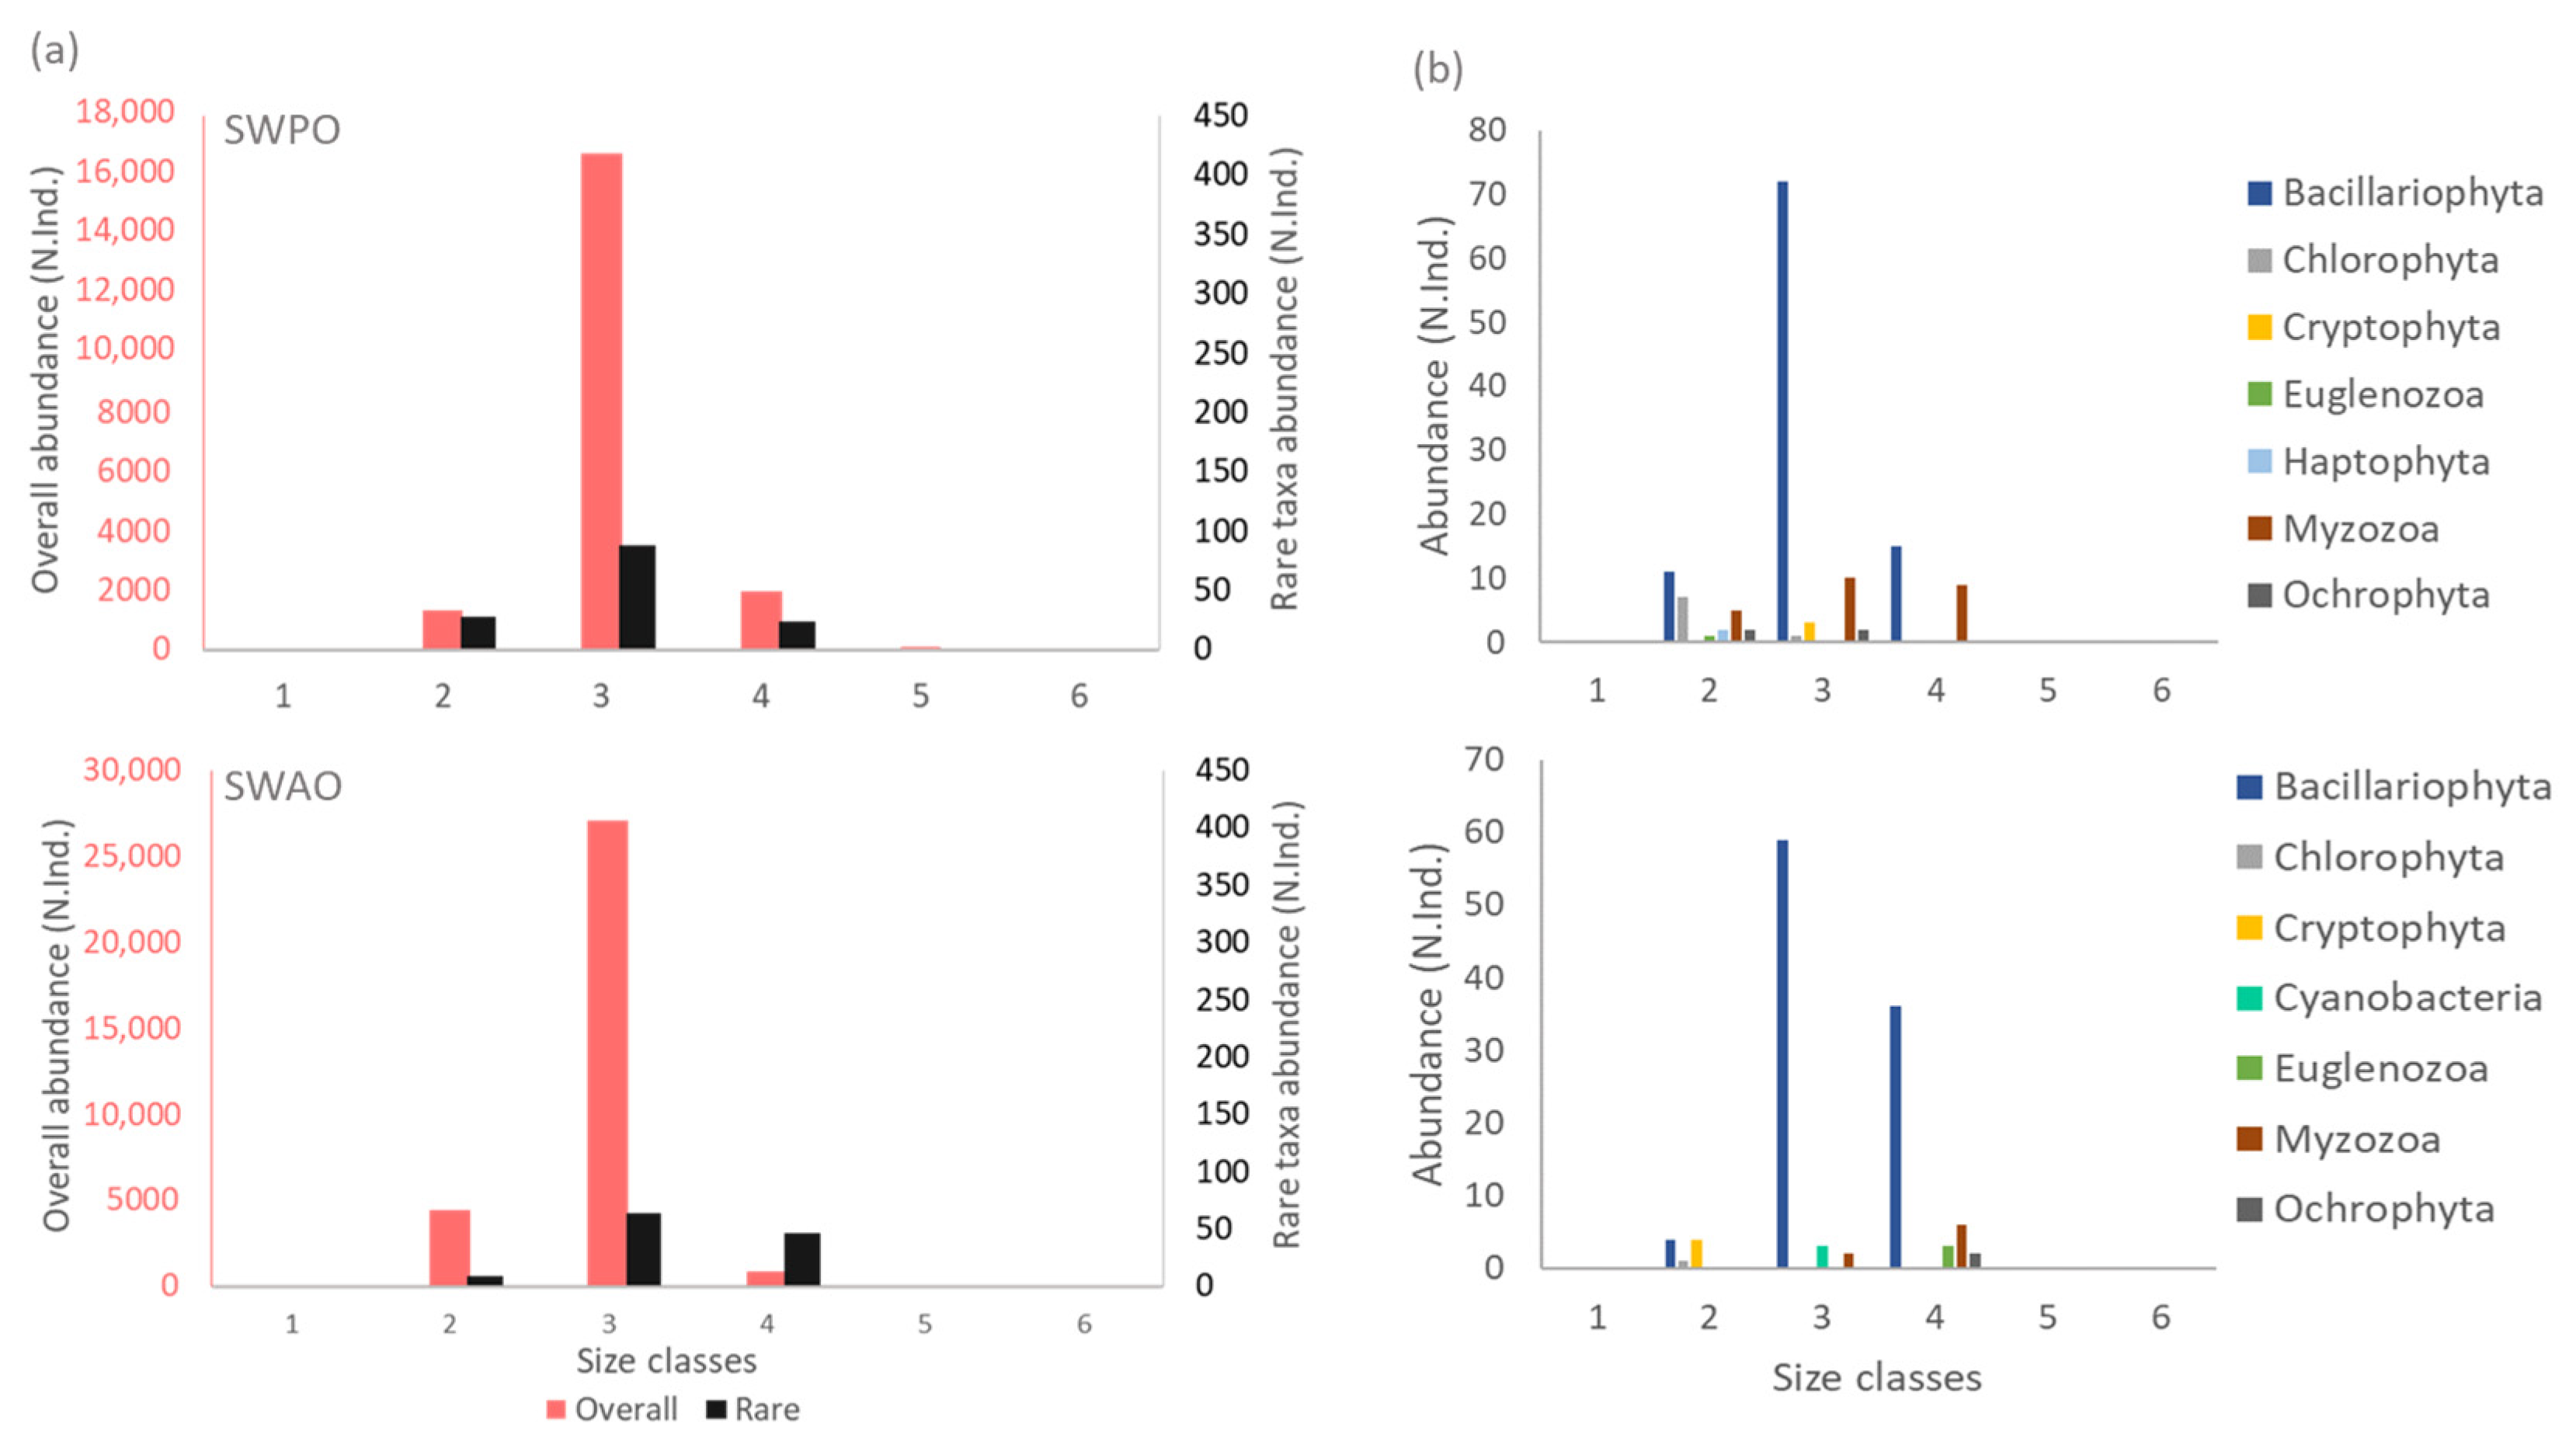
3.2. Taxonomic Diversity and Size Class Distribution of Rare Taxa

The phytoplankton body size spectra consisted of sixteen size classes, which were grouped into six body size classes, as detailed in the Materials and Methods section. Globally, the overall abundance was taken as the total abundance of all six datasets, and regionally, it corresponded to the respective regions separated. At the taxa level, the average individual cellular carbon content ranged between 1.84 pg C for the smallest taxa Monoraphidium to 346,93.89 pg C for the largest taxa Proboscia alata, and most of the rare taxa belonged to intermediate-size classes. Around 80% of rare taxa abundance belonged to Bacillariophyta, Chlorophyta, and Myzozoa, and 20% of rare taxa abundance mostly belonged to Cyanobacteria and other phyla (Figure 3a,b).
At the regional level, similarities were observed in the size distribution of rare taxa only for two ecoregions, the South-Western Pacific Ocean and the South-Western Atlantic Ocean, where the results were found to be significant and coherent to the global trends after 1% rare taxa removal (Figure 4a,b). Size class and taxonomic distributions of the phytoplankton community and 1% rare taxa present in the Indo-Pacific Ocean, the Mediterranean Sea, and the Northern Atlantic Ocean are shown in the Supplementary Materials (Figure S1). Generally, rare taxa exhibited heterogeneous distribution across all the regions, with none found to be rare in all regions. Only a few taxa occurred as rare in two ecoregions, such as Thalassionema nitzschioides in the South-Western Pacific Ocean and the South-Western Atlantic Ocean, Syracosphaera pulchra, Pseudopediastrum boryanum, and Oxytoxum longiceps in the Indo-Pacific Ocean and the Mediterranean Sea, and Snowella lacustris in the Mediterranean Sea and the Northern Atlantic Ocean. Moreover, 44% of the rare taxa occurring in the considered lagoon ecosystems were of marine origin, 19% were freshwater, and the remaining 37% were ubiquitous, i.e., adapted to occur in both marine and freshwater conditions (Supplementary Table S1).
The Morisita index was used to calculate the similarity of taxa across different regions (Figure 5). The South-Western Pacific Ocean and the Indo-Pacific Ocean exhibited 78% similarity in phytoplankton taxa composition and abundance, whereas other regions showed distinct and lower similarities. The phytoplankton community composition in the South-Western Atlantic Ocean differed the most compared to all the other biogeographical areas, with similarity values ranging from 14% to 25%. Phytoplankton diversity was calculated globally and regionally using the Shannon diversity index (H′) (Table 2) before and after excluding rare taxa. The Northern Atlantic Ocean (NAO) showed the highest diversity (4.75), followed by the Mediterranean Sea and the South-Western Atlantic Ocean, while the lowest diversity was recorded in the Indo-Pacific Ocean (IPO) phytoplankton community. The removal of rare taxa resulted in a gradual and smooth decline in Shannon diversity values, both globally and locally.

4. Discussion

In recent years, the rarity of species has become a topic of interest in many ecological and biodiversity studies [59]. The recent advancement in phytoplankton research has highlighted the importance of studying rare species in phytoplankton assemblages. Available information indicates that phytoplankton communities are made up of common species with high abundance, although there is a large pool of rare species with low abundance and frequency of occurrence [60,61]. There are various possible ways to define and investigate rarity [62]. In this study, the cumulative contribution of taxa abundance and biomass was considered as a common denominator to categorize a species as rare [63,64], incorporating also the probability of occurrence. This approach determines the cut-off points for abundances and body sizes, below which species were regarded as rare. These cut-off points of rarity are inevitably somewhat arbitrary, although the cut-off threshold of 25% has already been used in other studies [65,66]. One of the difficulties in assessing the importance of removing rare species is the lack of context from which to judge the impact of such a decision. However, it is challenging to find appropriate criteria for quantifying rare phytoplankton species because it is not an easy group to study in terms of rarity [67,68].
Our aim in this study was to verify the effect of rarity on the slope of the size scaling of phytoplankton abundance. Firstly, we observed that the removal of most rare species, accounting for only 1% of the overall phytoplankton numerical abundance and biomass, at both global and regional scale, significantly affected the scaling rate of the size–abundance relationships. Secondly, the removal of a progressive additional fraction of rare species, globally accounting for up to 25% of numerical abundance and biomass, did not further affect the scaling rate of the size–abundance relationships. The slope of the size–abundance relationship is a general indicator of the relative importance of cells of different sizes in terms of their contribution to total biomass. Size–abundance spectra at the global level, obtained by excluding 1% rarity, showed a trend towards steeper and more negative slopes, indicating increased importance of smaller phytoplankton cells to biomass contribution and an exponent close to −3/4, known as Damuth’s rule. Locally, in the South-Western Atlantic Ocean and in the South-Western Pacific Ocean, the removal of 1% of rare species shaped the slope of the size spectra even more negatively than the expected −3/4. Local-scale relationships in the Indo-Pacific Ocean, Mediterranean Sea, and Northern Atlantic Ocean showed less steep slopes of the size–abundance spectrum, reflecting the increasing importance of larger cells and power-law relationships with exponents that were always shallower than expectations, not affected by the exclusion of rare taxa (at any percentage from 1–25%). This is in accordance with other studies and is probably due to size differences in competition or differences in resource availability for species of different sizes [69,70,71]. Several mechanisms may contribute to biomass distribution such as the resource supply driven by changes in nutrient availability and irradiance. Another point of consideration is the assembly rules of species based on functional groups, which describe how certain groups of species assemblages tend to co-exist based on their ecological roles. Our findings are consistent with the pattern discovered by Fox for terrestrial community: “Species entering a community will tend to be drawn from a different (functional) group until each (functional) group is represented, and then the rule repeats” [72]. The conservative patterns of individual distribution into body size classes after the removal of 1% of most rare species is, in fact, analogous to the conservative pattern of guild filling in with species emphasised for the terrestrial communities [73]. By using size-dependent functional groups, the assembly rule reflects the use of available resources, and each species in an assemblage will be drawn from a different functional group until each group is represented in the community. These patterns have been further analysed and decoded, in the terrestrial community, into underlying mechanisms of consumer–resource competition [74]. In this study, we do not have direct evidence of competition for nutrients in the phytoplankton or related phytoplankton-nutrient dynamics as underlying mechanisms of the observed size distribution patterns, but competition for nutrients is a mechanism commonly observed in phytoplankton communities [75,76] and the large-scale biogeography of phytoplankton size structure is largely determined by resource supply. Several studies have investigated the patterns and mechanisms of phytoplankton diversity using different indices [77,78] and in terms of functional diversity compared to taxonomic diversity. Differences in functionality have been distinguished from morphological traits [79,80]; the majority of the studies on phytoplankton functional diversity have been based on the presence or absence of identities in terms of species richness [81,82], and very few have been conducted on functional groups defined by body size and the basis of abundance- or biovolume-based functional diversity [83,84,85]. The South-Western Pacific Ocean and Indo-Pacific Ocean regions exhibited the highest similarity in terms of phytoplankton taxa composition and abundance, while the South-Western Atlantic Ocean region was the most dissimilar compared to the others. When exploring the taxonomic diversity, through the Shannon index calculation, the Northern Atlantic Ocean (NAO) showed the highest diversity and the Indo-Pacific Ocean phytoplankton community showed the lowest. However, after the removal of the rare species, the diversity values decreased in a comparable manner in all regions, showing a constant influence of rare taxa on the overall community.
Our study is one of the first that focuses on the role of rarity in the structural component of both taxonomic and functional diversity of the phytoplankton guild. In this respect, our study shows that extremely rare species, accounting for less than 1% of numerical abundance and biomass, contribute consistently to lagoon phytoplankton taxonomic diversity and significantly affect its morpho-functional diversity. Therefore, the huge reserve of biological diversity, at the taxonomic and morpho-functional level, hidden in extremely rare phytoplankton species, seems to have an important role in maintaining long stability, as a resilience component, of primary producers and primary productivity in transitional water ecosystems.

5. Conclusions

The results of this study seem likely to add knowledge on the role of rare species on the phytoplankton size–abundance relationships, as they provide evidence of high taxonomic redundancy of rare species within size classes until most rare species, accounting for the 1% of numerical and biomass abundance, are considered. This last group of species, which represents almost 50% of overall taxonomic diversity, is dis-homogeneously distributed among size classes, with a more leptokurtic distribution than less rare taxa.
These observations of a deterministic rare species allocation among size classes, with the exception of most rare taxa, highlight the relevance of morpho-functional diversity within phytoplankton communities, giving value to their body size structure and size–abundance relationships.

Supplementary Materials

The following supporting information can be downloaded at https://www.mdpi.com/article/10.3390/d16020098/s1. Figure S1. (a) Size class distribution of overall phytoplankton assemblage (pink) and 1% rare taxa (black) in the Indo-Pacific Ocean (IPO), the Mediterranean Sea (MED) and the Northern Atlantic Ocean (NAO). (b) Taxonomic distribution in terms of phyla for 1% rare phytoplankton taxa assemblage in associated ecoregions. Table S1. Overall and Regional distribution of 1% rare taxa based on their nature of origin. Table S2. List of rare phytoplankton taxa. Species are provided with scientific names and taxa identified by sp. and spp. were listed by their respective genus or family name.

Author Contributions

A.B., M.L. and J.T. conceived the study, M.L. performed the data analysis, and M.L., J.T., A.G., S.R. and A.B. discussed the results, wrote, commented, and edited the manuscript. All authors have read and agreed to the published version of the manuscript.

Funding

This study was supported by “POR PUGLIA Progetto Strategico 2009–2012”, “LifeWatchPLUS”-CIR01_00028, and the project ITINERIS—Italian Integrated Environmental Research Infrastructure System CUP B53C22002150006 (PNRR for Mission4, Component 2, Notice 3264/2021, IR0000032) and funded by University of Salento UPB RIAF.RIAF1—Planning and Budget Office, expense item 10211009.

Institutional Review Board Statement

Not applicable.

Data Availability Statement

Acknowledgments

The authors thank Ilaria Rosati and Elena Stanca for their support in data collection, harmonization, and compilation and the anonymous reviewers for their time and their helpful comments.

Conflicts of Interest

The authors declare no conflicts of interest.

References

  1. Säterberg, T.; Jonsson, T.; Yearsley, J.; Berg, S.; Ebenman, B. A potential role for rare species in ecosystem dynamics. Sci. Rep. 2019, 9, 11107. [Google Scholar] [CrossRef]
  2. Umaña, M.N.; Mi, X.; Cao, M.; Enquist, B.J.; Hao, Z.; Howe, R.; Iida, Y.; Johnson, D.; Lin, L.; Liu, X. The role of functional uniqueness and spatial aggregation in explaining rarity in trees. Glob. Ecol. Biogeogr. 2017, 26, 777–786. [Google Scholar] [CrossRef]
  3. Van Schalkwyk, J.; Pryke, J.S.; Samways, M.J. Contribution of common vs. rare species to species diversity patterns in conservation corridors. Ecol. Indic. 2019, 104, 279–288. [Google Scholar] [CrossRef]
  4. Gaston, K.J.; Lawton, J.H. The population ecology of rare species. J. Fish Biol. 1990, 37, 97–104. [Google Scholar] [CrossRef]
  5. Chapman, A.S.A.; Tunnicliffe, V.; Bates, A.E. Both rare and common species make unique contributions to functional diversity in an ecosystem unaffected by human activities. Divers. Distrib. 2018, 24, 568–578. [Google Scholar] [CrossRef]
  6. Ohlemuller, R.; Anderson, B.J.; Araujo, M.B.; Butchart, S.H.M.; Kudrna, O.; Ridgely, R.S.; Thomas, C.D. The coincidence of climatic and species rarity: High risk to small-range species from climate change. Biol. Lett. 2008, 4, 568–572. [Google Scholar] [CrossRef] [PubMed]
  7. Fehér, A.; Končeková, L.; Glemnitz, M.; Berger, G.; Pfeffer, H.; Herzon, I. Maintaining and promoting biodiversity. In Sustainable Agriculture; Jakobson, C., Ed.; Baltic University Press: Uppsala, Sweden, 2012. [Google Scholar]
  8. Leitão, R.P.; Zuanon, J.; Villéger, S.; Williams, S.E.; Baraloto, C.; Fortunel, C.; Mendonça, F.P.; Mouillot, D. Rare species contribute disproportionately to the functional structure of species assemblages. Proc. Royal Soc. B 2016, 283, 20160084. [Google Scholar] [CrossRef] [PubMed]
  9. Zhang, Z.; Lu, Y.; Wei, G.; Jiao, S. Rare species-driven diversity–ecosystem multifunctionality relationships are promoted by stochastic community assembly. MBio 2022, 13, e00449-22. [Google Scholar] [CrossRef]
  10. Kondratyeva, A.; Grandcolas, P.; Pavoine, S. Reconciling the concepts and measures of diversity, rarity and originality in ecology and evolution. Biol. Rev. 2019, 94, 1317–1337. [Google Scholar] [CrossRef]
  11. Boyd, J.N.; Anderson, J.T.; Brzyski, J.; Baskauf, C.; Cruse-Sanders, J. Eco-evolutionary causes and consequences of rarity in plants: A meta-analysis. New Phytol. 2022, 235, 1272–1286. [Google Scholar] [CrossRef]
  12. Stebbins, G.L. Rarity of plant species: A synthetic viewpoint. Rhodora 1980, 82, 77–86. [Google Scholar]
  13. Enquist, B.J.; Feng, X.; Boyle, B.; Maitner, B.; Newman, E.A.; Jørgensen, P.M.; Roehrdanz, P.R.; Thiers, B.M.; Burger, J.R.; Corlett, R.T. The commonness of rarity: Global and future distribution of rarity across land plants. Sci. Adv. 2019, 5, eaaz0414. [Google Scholar] [CrossRef] [PubMed]
  14. Clark, P.J.; Reed, J.M.; Chew, F.S. Effects of urbanization on butterfly species richness, guild structure, and rarity. Urban Ecosyst. 2007, 10, 321–337. [Google Scholar] [CrossRef]
  15. Hodgson, J.G. Commonness and rarity in British butterflies. J. Appl. Ecol. 1993, 30, 407–427. [Google Scholar] [CrossRef]
  16. Fattorini, S. Use of insect rarity for biotope prioritisation: The tenebrionid beetles of the Central Apennines (Italy). J. Insect Conserv. 2010, 14, 367–378. [Google Scholar] [CrossRef]
  17. Booth, J.E.; Gaston, K.J.; Evans, K.L.; Armsworth, P.R. The value of species rarity in biodiversity recreation: A birdwatching example. Biol. Conserv. 2011, 144, 2728–2732. [Google Scholar] [CrossRef]
  18. Yu, J.; Dobson, F.S. Seven forms of rarity in mammals. J. Biogeogr. 2000, 27, 131–139. [Google Scholar] [CrossRef]
  19. Loiseau, N.; Mouquet, N.; Casajus, N.; Grenie, M.; Gueguen, M.; Maitner, B.; Mouillot, D.; Ostling, A.; Renaud, J.; Tucker, C.; et al. Global distribution and conservation status of ecologically rare mammal and bird species. Nat. Commun. 2020, 11, 5071. [Google Scholar] [CrossRef] [PubMed]
  20. Chapman, M.G. Are there adequate data to assess how well theories of rarity apply to marine invertebrates? Biodivers. Conserv. 1999, 8, 1295–1318. [Google Scholar] [CrossRef]
  21. Mcclain, C.R. The commonness of rarity in a deep-sea taxon. Oikos 2021, 130, 863–878. [Google Scholar] [CrossRef]
  22. Schmidt, A.; Feher, G.; Padisák, J. Some rare green algae occurring in the Danube river and its dead-and side-branches in southern Hungary. Biologia-Bratislava 2003, 58, 475–482. [Google Scholar]
  23. Lenarczyk, J.; Tsarenko, P. Some rare and interesting green algae (Chlorophyta) from subalpine Tatra lakes (High Tatra Mountains, Poland). Oceanol. Hydrobiol. Stud. 2013, 42, 225–232. [Google Scholar] [CrossRef]
  24. Stoyneva-Gärtner, M.P.; Isheva, T.; Ivanov, P.; Uzunov, B.A.; Dimitrova, P. Red List of Bulgarian Algae. II. Microalgae. 2016. Available online: http://hdl.handle.net/10506/1389 (accessed on 11 January 2024).
  25. Falkowski, P.G. The role of phytoplankton photosynthesis in global biogeochemical cycles. Photosynth. Res. 1994, 39, 235–258. [Google Scholar] [CrossRef] [PubMed]
  26. Martins, M.P.M.; Soares, K.W.d.S.; Carvalho, P.d.; Bortolini, J.C. Phytoplankton community diversity, dominance, and rarity: A case study of tropical urban lakes. Acta Limnol. Bras. 2024, 36, e1. [Google Scholar] [CrossRef]
  27. Hallegraeff, G.M.; Ringelbelg, J. Characterization of species diversity of phytoplankton assemblages by dominance-diversity curves: With 4 figures and 1 table in the text. Int. Ver. Theor. Angew. Limnol. Verh. 1978, 20, 939–949. [Google Scholar] [CrossRef]
  28. Gerhard, M.; Mori, C.; Striebel, M. Nonrandom species loss in phytoplankton communities and its effect on ecosystem functioning. Limnol. Oceanogr. 2021, 66, 779–792. [Google Scholar] [CrossRef]
  29. Ignatiades, L.; Gotsis-Skretas, O. The contribution of rare species to coastal phytoplankton assemblages. Mar. Ecol. 2013, 35, 132–145. [Google Scholar] [CrossRef]
  30. Crisfield, V.E.; Guillaume Blanchet, F.; Raudsepp-Hearne, C.; Gravel, D. How and why species are rare: Towards an understanding of the ecological causes of rarity. Ecography 2024, 2024, e07037. [Google Scholar] [CrossRef]
  31. Laraib, M.; Titocci, J.; Rosati, I.; Basset., A. An integrated individual-level trait-based phytoplankton dataset from transitional waters. Sci. Data 2023, 10, 897. [Google Scholar] [CrossRef]
  32. Brown, J.H.; Maurer, B.A. Evolution of species assemblages: Effects of energetic constraints and species dynamics on the diversification of the North American avifauna. Am. Nat. 1987, 130, 1–17. [Google Scholar] [CrossRef]
  33. Gaston, K.J.; Blackburn, T.M. Global scale macroecology: Interactions between population size, geographic range size and body size in the Anseriformes. J. Anim. Ecol. 1996, 65, 701–714. [Google Scholar] [CrossRef]
  34. Gjoni, V.; Glazier, D.S. A perspective on body size and abundance relationships across ecological communities. Biology 2020, 9, 42. [Google Scholar] [CrossRef]
  35. Belgrano, A.; Allen, A.P.; Enquist, B.J.; Gillooly, J.F. Allometric scaling of maximum population density: A common rule for marine phytoplankton and terrestrial plants. Ecol. Lett. 2002, 5, 611–613. [Google Scholar] [CrossRef]
  36. Basset, A.; Sangiorgio, F.; Pinna, M. Monitoring with benthic macroinvertebrates: Advantages and disadvantages of body size descriptors. Aquat. Conserv. Mar. Freshw. Ecosyst. 2004, 14, S43–S58. [Google Scholar] [CrossRef]
  37. Shokri, M.; Cozzoli, F.; Vignes, F.; Bertoli, M.; Pizzul, E.; Basset, A. Metabolic rate and climate change across latitudes: Evidence of mass-dependent responses in aquatic amphipods. J. Exp. Biol. 2022, 225, jeb244842. [Google Scholar] [CrossRef]
  38. Damuth, J. Population density and body size in mammals. Nature 1981, 290, 699–700. [Google Scholar] [CrossRef]
  39. West, G.B.; Brown, J.H.; Enquist, B.J. A general model for the origin of allometric scaling laws in biology. Science 1997, 276, 122–126. [Google Scholar] [CrossRef] [PubMed]
  40. Cermeño, P.; Marañón, E.; Harbour, D.; Harris, R.P. Invariant scaling of phytoplankton abundance and cell size in contrasting marine environments. Ecol. Lett. 2006, 9, 1210–1215. [Google Scholar] [CrossRef] [PubMed]
  41. Blackburn, T.M.; Gaston, K.J. Who is rare? Artefacts and complexities of rarity determination. In The Biology of Rarity: Causes and Consequences of Rare—Common Differences; Springer: Dordrecht, The Netherlands, 1997; pp. 48–60. [Google Scholar]
  42. Roselli., L.; Litchman, E.; Stanca, E.; Cozzoli, F.; Basset, A. Individual trait variation in phytoplankton communities across multiple spatial scales. J. Plankton Res. 2017, 39, 577–588. [Google Scholar] [CrossRef]
  43. Durante, G.; Stanca, E.; Roselli, L.; Basset, A. Phytoplankton composition in six Northern Scotland lagoons (Orkney Islands). Transit. Water. Bull. 2013, 7, 159–174. [Google Scholar]
  44. Roselli, L.; Stanca, E.; Ludovisi, A.; Durante, G.; Souza, J.S.D.; Dural, M.; Alp, T.; Bulent, S.; Gjoni, V.; Ghinis, S. Multi-scale biodiverity patterns in phytoplankton from coastal lagoons: The Eastern Mediterranean. Transit. Water. Bull. 2013, 7, 202–219. [Google Scholar]
  45. Stanca, E.; Roselli, L.; Cellamare, M.; Basset, A. Phytoplankton composition in the coastal magnetic island lagoon, western pacific ocean (Australia). Transit. Water. Bull. 2013, 7, 145–158. [Google Scholar]
  46. Utermöhl, H. Zur vervollkommnung der quantitativen phytoplankton-methodik: Mit 1 Tabelle und 15 abbildungen im text und auf 1 tafel. Verh.-Int. Ver. Theor. Angew. Limnol. Mitte. 1958, 9, 1–38. [Google Scholar] [CrossRef]
  47. Sournia, A. Introduction, Cyanophycées, Dictyochophycées, Dinophycées et Raphidophycées. 1986. Available online: https://cir.nii.ac.jp/crid/1130000797027661568 (accessed on 3 March 2010).
  48. Round, F.E.; Crawford, R.M.; Mann, D.G. Biology and morphology of the genera. In The Diatom; Cambridge University Press: Cambridge, UK, 1990. [Google Scholar]
  49. Tomas, C.R. Identifying Marine Phytoplankton; Elsevier: Amsterdam, The Netherlands, 1997. [Google Scholar]
  50. Phytoplankton Virtual Research Environment VRE. Available online: https://www.phytovre.lifewatchitaly.eu/vre/shapes-groups/ (accessed on 1 March 2011).
  51. World Register of Marine Species WoRMS. Available online: https://www.marinespecies (accessed on 9 April 2013).
  52. Vadrucci, M.R.; Cabrini, M.; Basset, A. Biovolume determination of phytoplankton guilds in transitional water ecosystems of Mediterranean Ecoregion. Trans. Water. Bull. 2007, 1, 83–102. [Google Scholar] [CrossRef]
  53. Menden-Deuer, S.; Lessard, E.J. Carbon to volume relationships for dinoflagellates, diatoms, and other protist plankton. Limnol. Oceanogr. 2000, 45, 569–579. [Google Scholar] [CrossRef]
  54. Shannon, C.E. A mathematical theory of communication. Bell Syst. Techn. J. 1948, 27, 379–423. [Google Scholar] [CrossRef]
  55. Morisita, M. Measuring of the Dispersion of individuals and analysis of the distributional patterns. Mem. Fac. Sci. Kyushu Univ. Ser. E 1959, 3, 65–80. [Google Scholar]
  56. Blanco, J.M.; Echeverria, F.; García, C.M. Dealing with size-spectra: Some conceptual and mathematical problems. Sci. Mar. 1994, 58, 17–29. [Google Scholar]
  57. Brown, J.H.; Gillooly, J.F.; Allen, A.P.; Savage, V.M.; West, G.B. Toward a metabolic theory of ecology. Ecology 2004, 85, 1771–1789. [Google Scholar] [CrossRef]
  58. R Core Team. R: A Language and Environment for Statistical Computing; R Foundation for Statistical Computing: Vienna, Austria, 2022; Available online: https://www.R-project.org/ (accessed on 23 March 2022).
  59. Irwin, A.J.; Finkel, Z.V.; Schofield, O.M.; Falkowski, P.G. Scaling-up from nutrient physiology to the size-structure of phytoplankton communities. J. Plankton Res. 2006, 28, 459–471. [Google Scholar] [CrossRef]
  60. Cermeno, P.; de Vargas, C.; Abrantes, F.; Falkowski, P.G. Phytoplankton biogeography and community stability in the ocean. PLoS ONE 2010, 5, e10037. [Google Scholar] [CrossRef]
  61. Ignatiades, L.; Gotsis-Skretas, O.; Pagou, K.; Krasakopoulou, E. Diversification of phytoplankton community structure and related parameters along a large-scale longitudinal east–west transect of the Mediterranean Sea. J. Plankton Res. 2009, 31, 411–428. [Google Scholar] [CrossRef]
  62. Gaston, K.J. Rarity; Chapman & Hall: London, UK, 1994. [Google Scholar]
  63. Rabinowitz, D.; Cairns, S.; Dillon, T. Seven forms of rarity and their frequency in the flora of the British Isles. In Conservation Biology: The Science of Scarcity and Diversity; Soule, M.E., Ed.; Sinauer Associates: Sunderland, MA, USA, 1986. [Google Scholar]
  64. Reed, J.M. A system for ranking conservation priorities for neotropical migrant birds based on relative susceptibility to extinction. In Ecology and Conservation of Neotropical Migrant Landbirds; Hangan, J.M., Johnston, D.W., Eds.; Smithsonian Institution Press: Washington, DC, USA, 1992. [Google Scholar]
  65. Kunin, W.E.; Gaston, K.J. The Biology of Rarity: Causes and Consequences of Rare—Common Differences; Springer Science & Business Media: Berlin/Heidelberg, Germany, 2012. [Google Scholar]
  66. Ricotta, C.; Godefroid, S.; Celesti-Grapow, L. Common species have lower taxonomic diversity evidence from the urban floras of Brussels and Rome. Divers. Distrib. 2008, 14, 530–537. [Google Scholar] [CrossRef]
  67. Padisák, J.; Hajnal, É.; Krienitz, L.; Lakner, J.; Üveges, V. Rarity, ecological memory, rate of floral change in phytoplankton—And the mystery of the Red Cock. Hydrobiologia 2010, 653, 45–64. [Google Scholar] [CrossRef]
  68. Cao, Y.; Williams, D.D.; Williams, N.E. How important are rare species in aquatic community ecology and bioassessment? Limnol. Oceanogr. 1998, 43, 1403–1409. [Google Scholar] [CrossRef]
  69. White, E.P.; Ernest, S.K.M.; Kerkhoff, A.J.; Enquist, B.J. Relationships between body size and abundance in ecology. Trends Ecol. Evol. 2007, 22, 323–330. [Google Scholar] [CrossRef] [PubMed]
  70. Cozzoli, F.; Shokri, M.; Boulamail, S.; Marrocco, V.; Vignes, F.; Basset, A. The size dependency of foraging behaviour: An empirical test performed on aquatic amphipods. Oecologia 2022, 199, 377–386. [Google Scholar] [CrossRef] [PubMed]
  71. Sabetta, L.; Fiocca, A.; Margheriti, L.; Vignes, F.; Basset, A.; Mangoni, O.; Carrada, G.C.; Ruggieri, N.; Ianni, C. Body size–abundance distributions of nano-and micro-phytoplankton guilds in coastal marine ecosystems. Estuar. Coast. Shelf Sci. 2005, 63, 645–663. [Google Scholar] [CrossRef]
  72. Fox, B.J.; Brown, J.H. Assembly rules for functional groups in North American desert rodent communities. Oikos 1993, 67, 358–370. [Google Scholar] [CrossRef]
  73. Fox, B.J.; Kirkland, G.L., Jr. An assembly rule for functional groups applied to North American soricid communities. J. Mammal. 1992, 73, 491–503. [Google Scholar] [CrossRef]
  74. Morris, D.W.; Knight, T.W. Can consumer-resource dynamics explain patterns of guild assembly? Am. Nat. 1996, 147, 558–575. [Google Scholar] [CrossRef]
  75. Zhu, W.; Wan, L.; Zhao, L. Effect of nutrient level on phytoplankton community structure in different water bodies. J. Environ. Sci. 2010, 22, 32–39. [Google Scholar] [CrossRef]
  76. Litchman, E. Resource competition and the ecological success of phytoplankton. In Evolution of Primary Producers in the Sea; Falkowski, P.G., Knoll, A.H., Eds.; Academic Press: Burlington, MA, USA, 2007. [Google Scholar]
  77. Kostryukova, A.M.; Krupnova, T.G.; Mashkova, I.V.; Gavrillkina, S.V.; Egorov, N.O. Phytoplankton diversity in three lakes of South Ural, Russia. Biodiversitas J. Biol. Divers. 2018, 19, 1459–1467. [Google Scholar] [CrossRef]
  78. Arhonditsis, G.; Karydis, M.; Tsirtsis, G. Analysis of phytoplankton community structure using similarity indices: A new methodology for discriminating among eutrophication levels in coastal marine ecosystems. Environ. Manag. 2003, 31, 0619–0632. [Google Scholar] [CrossRef] [PubMed]
  79. Kruk, C.; Huszar, V.L.; Peeters, E.T.; Bonilla, S.; Costa, L.; Lürling, M.; Reynolds, C.S.; Scheffer, M. A morphological classification capturing functional variation in phytoplankton. Freshw. Biol. 2010, 55, 614–627. [Google Scholar] [CrossRef]
  80. Weithoff, G. The concepts of plant functional types and functional diversity in lake phytoplankton: A new understanding of phytoplankton ecology. Freshw. Biol. 2003, 48, 1669–1675. [Google Scholar] [CrossRef]
  81. Bergkemper, V.; Stadler, P.; Weisse, T. Moderate weather extremes alter phytoplankton diversity-a microcosm study. Freshw. Biol. 2018, 63, 1211–1224. [Google Scholar] [CrossRef]
  82. Santos, J.B.O.; Brasil, J.; Huszar, V.L.M. Responses of functional and taxonomic phytoplankton diversity to environmental gradients in subtropical and tropical reservoirs. Front. Environ. Sci. 2022, 10, 899571. [Google Scholar] [CrossRef]
  83. Santos, A.M.C.; Carneiro, F.M.; Cianciaruso, M.V. Predicting productivity in tropical reservoirs: The roles of phytoplankton taxonomic and functional diversity. Ecol. Indic. 2015, 48, 428–435. [Google Scholar] [CrossRef]
  84. Wang, H.; Zhao, D.; Chen, L.; Giesy, J.P.; Zhang, W.; Yuan, C.; Ni, L.; Shen, H.; Xie, P. Light, but not nutrients, drives seasonal congruence of taxonomic and functional diversity of phytoplankton in a eutrophic highland lake in China. Front. Plant Sci. 2020, 11, 179. [Google Scholar] [CrossRef] [PubMed]
  85. Graco-Roza, C.; Soininen, J.; Correa, G.; Pacheco, F.S.; Miranda, M.; Domingos, P.; Marinho, M.M. Functional rather than taxonomic diversity reveals changes in the phytoplankton community of a large dammed river. Ecol. Indic. 2021, 121, 107048. [Google Scholar] [CrossRef]
Figure 1. Spatial distribution of phytoplankton sampling in five biogeographic regions: the South-Western Pacific Ocean (SWPO), Australia, the South-Western Atlantic Ocean (SWAO), Brazil, the Indo-Pacific Ocean (IPO), Maldives, the Mediterranean Sea (MED), Greece and Turkey, and the Northern Atlantic Ocean (NAO), Scotland. (a) Stacked bar plot showing phytoplankton composition, in phyla, across ecoregions. (b) Phytoplankton species composition based on their origin.
Diversity 16 00098 g001
Figure 2. Scaling of phytoplankton taxa abundance (N. individuals per sample) against average biomass (cellular carbon content, expressed as pg C per individual) on a logarithmic scale. (a) Global size–abundance relationship (GSAR) of the entire phytoplankton global dataset. (b) Local size–abundance relationship (LSAR) for each of the five biogeographic regions: the South-Western Pacific Ocean (SWPO), the South-Western Atlantic Ocean (SWAO), the Northern Atlantic Ocean (NAO), the Mediterranean Sea (MED), and the Indo-Pacific Ocean (IPO). In all plots, the total distribution of the phytoplankton community, including the rare taxa, is represented in pink while the phytoplankton size–abundance relationship after 1% removal of rare taxa is shown in light brown, after 5% removal in green, after 10% removal in light blue, and after 25% removal in purple.
Diversity 16 00098 g002
Figure 3. (a) Size class distribution of overall phytoplankton assemblage (pink) and 1% rare taxa (black). (b) Taxonomic distribution in terms of phyla for 1% rare phytoplankton taxa.
Diversity 16 00098 g003
Figure 4. (a) Size class distribution of overall phytoplankton assemblage (pink) and 1% rare taxa (black) in the South-Western Pacific Ocean (SWPO) and the South-Western Atlantic Ocean (SWAO) ecoregions. (b) Taxonomic distribution in terms of phyla for 1% rare phytoplankton taxa in associated ecoregions.
Diversity 16 00098 g004
Figure 5. Morisita index of similarity in phytoplankton assemblages from different biogeographical areas: the South-Western Atlantic Ocean (SWAO), the Northern Atlantic Ocean (NAO), the Mediterranean Sea (MED), the Indo-Pacific Ocean (IPO), and the South-Western Pacific Ocean (SWPO). The index ranges from 0 (no similarity) to 1 (complete similarity).
Diversity 16 00098 g005
Table 1. Linear regression analyses of the phytoplankton assemblage before and after 1%, 5%, 10%, and 25% removal of rare taxa. The table includes the results of the global size–abundance relationship (GSAR) and the local size–abundance relationship (LSAR) in five biogeographic regions: the South-Western Pacific Ocean (SWPO), the South-Western Atlantic Ocean (SWAO), the Indo-Pacific Ocean (IPO), the Mediterranean Sea (MED), and the Northern Atlantic Ocean (NAO).
GSARThresholdsSlope95%CIInterceptdfr2
100−0.38−0.50 to −0.261743040.11
99 **−0.60−0.71 to −0.4825401730.38
95−0.72−0.84 to −0.6017,804880.61
90−0.71−0.84 to −0.5730,634580.66
75−0.59−0.76 to −0.4139,909250.65
LSAR
SWPO100−0.31−0.54 to −0.09681130.06
99 **−0.85−1.04 to −0.666650660.55
95−0.93−1.11 to −0.7623,516420.73
90−0.91−1.10 to −0.7334,108280.78
75−0.94−1.14 to −0.7490,925120.90
SWAO1000.64−0.92 to −0.37508960.18
99 *−1.09−1.31 to −0.8723,895590.61
95−1.17−1.40 to −0.9396,070320.76
90−1.20−1.46 to −0.94206,798200.82
75−0.72−1.34 to −0.0957,01960.56
MED100−0.36−0.55 to −0.17931090.11
99−0.54−0.75 to −0.33970600.31
95−0.46−0.66 to −0.252898290.42
90−0.52−0.77 to −0.316113200.57
75 *−0.19−0.32 to −0.073202100.55
IPO100−0.43−0.65 to −0.201641090.11
99−0.54−0.77 to −0.301335560.27
95−0.77−1.06 to −0.4937,501220.59
90−0.65−0.97 to −0.3339,592120.62
75−0.71−1.12 to −0.30142,21750.79
NAO100−0.30−0.48 to −0.11831220.07
99−0.47−0.63 to −0.31514840.29
95−0.53−0.69 to −0.361485540.43
90−0.59−0.77 to −0.413354360.55
75−0.53−0.75 to −0.317315140.66
* p < 0.05, ** p < 0.01, (95% CI was used to assess pairwise comparison of slopes by ANCOVA analysis).
Table 2. Summary of the Shannon diversity index (H’) at the global and regional level, before and after the exclusion of 1–25% rare taxa.
Shannon-Diversity IndexGlobalSWPOSWAOMEDIPONAO
Overall5.084.033.384.283.304.75
After 1%5.023.973.354.193.264.68
After 5%4.783.743.203.983.174.24
After 10%4.583.603.153.753.073.91
After 25%3.90nanananana
South-Western Pacific Ocean (SWPO), South-Western Atlantic Ocean (SWAO), Mediterranean Sea (MED), Indo-Pacific Ocean (IPO), and Northern Atlantic Ocean (NAO). na stands for: not applicable.
Disclaimer/Publisher’s Note: The statements, opinions and data contained in all publications are solely those of the individual author(s) and contributor(s) and not of MDPI and/or the editor(s). MDPI and/or the editor(s) disclaim responsibility for any injury to people or property resulting from any ideas, methods, instructions or products referred to in the content.

